the Creative Commons Attribution 4.0 License.
the Creative Commons Attribution 4.0 License.
 | 15 Mar 2022
Statistical study and corresponding evolution of plasmaspheric plumes under different levels of geomagnetic storms
Haimeng Li
Tongxing Fu
Zhigang Yuan
Zhanrong Yang
Zhihai Ouyang
Xiaohua Deng
Using observations of Van Allen Probes, we present a statistical study of plasmaspheric plumes in the inner magnetosphere. Plasmaspheric plumes tend to occur during the recovery phase of geomagnetic storms. Furthermore, the results imply that the occurrence rate of observed plasmaspheric plume in the inner magnetosphere is larger during stronger geomagnetic activity. This statistical result is different from the observations of the Cluster satellite with much higher L shells in most orbital periods, which suggests that the plasmaspheric plume near the magnetopause tends to be observed during moderate geomagnetic activity (Lee et al., 2016). In the following, the dynamic evolutions of plasmaspheric plumes during a moderate geomagnetic storm in February 2013 and a strong geomagnetic storm in May 2013 are simulated through group test particle simulation. It is obvious that the plasmaspheric particles drift out on open convection paths due to sunward convection during both geomagnetic storms. It seems that the outer plasmaspheric particles exhaust the energy available to them sooner, and the plasmasphere shrinks faster during strong geomagnetic storms. As a result, the longitudinal width of the plume is narrower, and the plume is limited to lower L shells during the recovery phase of strong geomagnetic storm. The simulated evolutions may provide a possible interpretation for the occurrence rates: Van Allen Probes tend to observe plumes during stronger geomagnetic storms, and the Cluster satellite with higher L shells tends to observe plumes during moderate geomagnetic storms.
- Article
(1903 KB) - Full-text XML
- BibTeX
- EndNote


The innermost magnetosphere is occupied by a torus of cold dense plasma known as the plasmasphere (Lemaire et al., 1998). In general, the dynamics of plasmaspheric particles are controlled by the combination of corotational and solar-wind-driven convection electric fields. The southward interplanetary magnetic field (IMF) at the magnetopause brings about dayside magnetopause reconnection, resulting in an increase in dawn–dusk convection electric fields in the inner magnetosphere (Dungey, 1961). Goldstein et al. (2005a) suggested that the electric field at the plasmapause was approximately 13 % of the solar wind electric field (ESW). Under the effect of a dawn–dusk convection electric field, plasmaspheric particles move sunward through the E×B drift and may transfer into the magnetospheric boundary layers. This dynamic mechanism leads to the erosion of the plasmasphere and the formation of a plasmaspheric plume near the dusk side (Goldstein et al., 2004; Darrouzet et al., 2008; Walsh et al., 2013). Long-term observations also suggest that the radial location of the plasmapause can move inward during periods of geomagnetic disturbance, which are mainly correlated with increases in the southward IMF (Elphic et al., 1996; Carpenter and Lemaire, 1997). After the time interval of the geomagnetic disturbance, low-energy ionospheric particles are drawn upward from low altitudes along magnetic field lines and contribute to the refilling of the eroded plasmasphere. It may take more than 10 d to recover to the normal level of the plasmasphere (Chu et al., 2017; Lointier et al., 2013).
The plasmaspheric plume is an important region of detached plasma elements in the magnetosphere, as it connects to the main body of the plasmasphere and stretches outward (Goldstein et al., 2004; Darrouzet et al., 2009; Moldwin et al., 2016). Therefore, the plasmaspheric plume provides an effective coupling channel of energy–mass between the inner magnetospheric plasmasphere and outer magnetosphere. During geomagnetic storms, the plasmaspheric plume may reach the dayside magnetopause and, thus, reduce the reconnection rate (Dargent et al., 2020). The structureless hiss waves often arise in high-density plasmaspheric plumes (Meredith et al., 2004; Yuan et al., 2012; Zhang et al., 2018, 2019). Furthermore, although electromagnetic ion cyclotron (EMIC) waves are not preferentially observed in the high-density plumes (Usanova et al., 2013; Grison et al., 2018), the plume maybe related to the excitation of EMIC waves (Grison et al., 2018; Yu et al., 2016; Yuan et al., 2010). The electron scattering induced by hiss waves is thought to be a key contributor to the formation of the radiation belt slot region (Su et al., 2015; Shi et al., 2019; Zhang et al., 2019). Therefore, it is very important to study the formation and evolution of plasmaspheric plumes. Generally, plasmaspheric plumes are identified when the electron density is more than the modeled density of the plasmasphere (provided by Sheeley et al., 2001) in a specific L shell outside the plasmapause (Moldwin et al., 2004; Zhang et al., 2019). Using density data from the Cluster spacecraft, Darrouzet et al. (2008) and Lee et al. (2016) presented statistical studies of plasmaspheric plumes. Since the time interval of Cluster in the outer magnetosphere is much greater than that in the inner magnetosphere, the Cluster provides a good opportunity to investigate plumes in the outer magnetosphere. Studies suggest that the occurrence rate of plasmaspheric plumes is significantly higher on the afternoon side than on the prenoon side, and plasmaspheric plumes tend to be observed during moderate geomagnetic activity.
In this paper, in situ measurements from Van Allen Probes are used to identify plasmaspheric plumes in the inner magnetosphere (with L shells ≤ 6). Plasmaspheric plume spatial distributions and occurrence rates at different levels of geomagnetic activity are investigated. The results imply that the occurrence rate of plasmaspheric plumes in the inner magnetosphere is largest during strongest geomagnetic activity, which is different from the statistical result near the magnetopause provided by Lee et al. (2016). Moreover, to explain the different occurrence rates of observed plasmaspheric plumes as a function of the levels of geomagnetic activity, group test particle simulations are used to exhibit the evolution of plasmaspheric plumes during both moderate and strong geomagnetic activity.
In our study, using the observations of Van Allen Probe A, we performed statistical research on plasmaspheric plumes in the inner magnetosphere. The perigee of Van Allen Probe is ∼ 1.1 RE (radius of the Earth), and its apogee is ∼ 6.2 RE. Electron density data with a 6.5 s time resolution are provided by level 4 of the Electric and Magnetic Field Instrument Suite and Integrated Science (EMFISIS) data sets of Van Allen Probe A (Kletzing et al., 2013), which is mainly calculated from the trace of the upper hybrid resonance frequency (Kurth et al., 2015). Using electron density data, the structure of the plasmaspheric plume is identified based on the following criteria. (1) The plasmapause is identified as the innermost steep gradient of electron density, which requires the electron density to decrease by a factor > 5 within 0.5 L shell (Moldwin et al., 2002; Malaspina et al., 2016; Zhang et al., 2019). Through the above criterion of the plasmapause, a very small number of identified events are not the real plasmapause. To ensure the accuracy of the plasmapause database, these spurious events are discarded. (2) While Van Allen Probes are outside the plasmapause, we identify the region where the observed electron density sharply increases (by a factor > 5 within 0.5 L shell), and the observed density exceeds the density calculated by the model of Sheeley et al. (2001) as follows:
Referencing the criterion of plasmaspheric plume identification in Darrouzet et al. (2008) and Zhang et al. (2019), if the satellite orbit range of enhanced electron density is more than 0.2 RE and less than 2 RE, we consider that the region can be identified as a plasmaspheric plume by satellite.
Figure 1 displays an example of a plasmaspheric plume observed by Van Allen Probe A on 6 June 2013. The top panels exhibit the geomagnetic indices (including Dst and Kp) from 00:00 on 6 June to 00:00 UT on 7 June in 2013. The measured density from 06:35 to 14:00 UT is shown in the bottom panel. According to the criterion above, the location of the plasmapause is indicated by black vertical lines. While the satellite is outside the plasmapause, the measured electron density (blue curve) from 07:25 UT to 08:10 UT (marked by brown shadow) absolutely exceeds the density model provided by the Sheeley et al. (2001) model (red curve). As a result, the region of high density marked by a gray shadow is considered a plasmaspheric plume. We find that the plume occurs in the non-storm period through the analysis of geomagnetic indices.
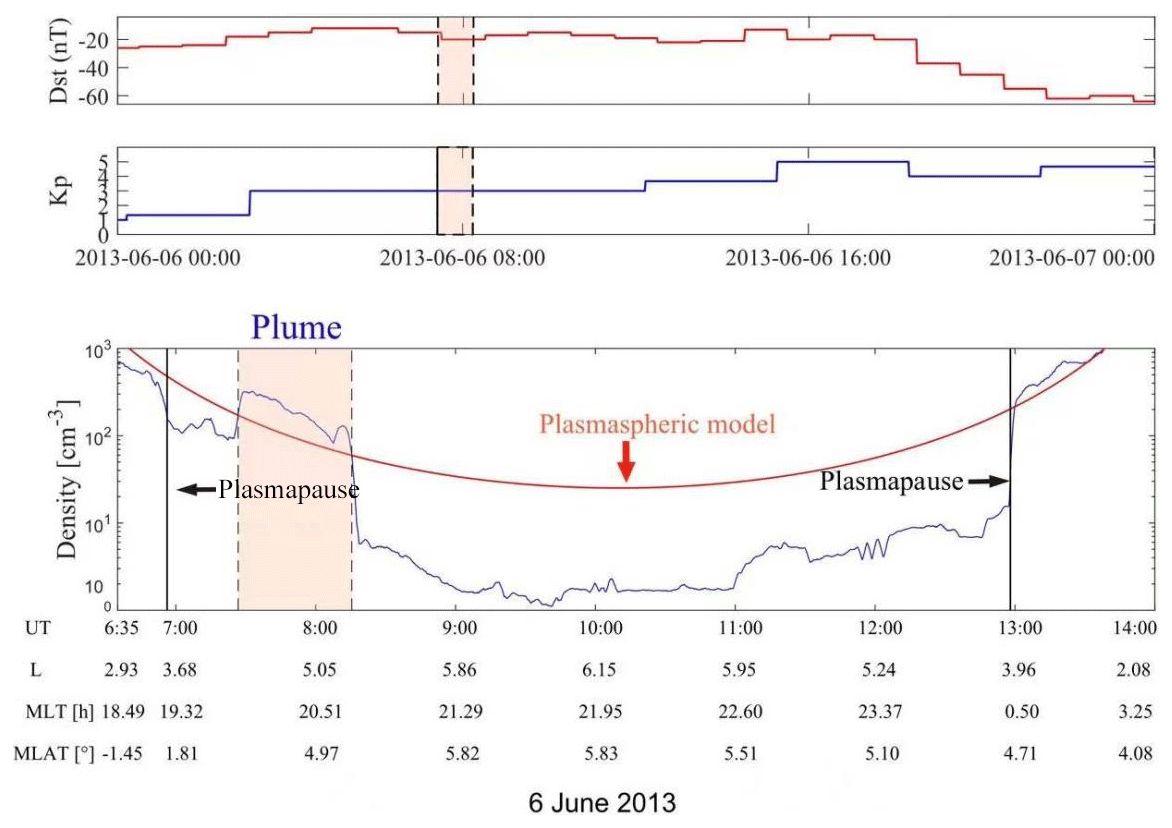
Figure 1A typical example of a plasmaspheric plume measured by level 4 EMFISIS data sets of Van Allen Probe A. The top panels exhibit the geomagnetic indices (including Dst and Kp) from 00:00 on 6 June to 00:00 UT on 7 June in 2013. The measured density from 06:35 to 14:00 UT is shown in the bottom panel. The measured electron density and the density provided by Sheeley et al. (2001) are indicated by blue and red curves, respectively. The black vertical lines denote the location of the plasmapause, as determined by Moldwin et al. (2002). The brown shadows indicate the time interval of the detected plasmaspheric plume.
Following the criterion method described above, we capture 422 plasmaspheric plume events out of 4030 Van Allen Probe A orbits in the inner magnetosphere from January 2013 to December 2018. In this study, the global spatial distributions of plasmaspheric plumes associated with different geomagnetic phases are analyzed. For a geomagnetic storm, the minimum Dst (disturbed storm time) must be at least below −30 nT, and the duration of that Dst nT must be more than 10 min (Gonzalez et al., 1994). The geomagnetic storm onset, which indicates the beginning of a geomagnetic storm, is defined as the time when the slope of the Dst index becomes negative and remains negative until the minimum of Dst index. Then, the 3 h before the time of onset is defined as the initial phase, as in Halford et al. (2010) and Wang et al. (2016). The period from the onset to the minimum Dst in the geomagnetic storm is defined as the main phase, while the recovery phase begins after the minimum Dst and ends when the Dst recovers to 80 % of the minimum value or the next storm starts. The time interval without the storm (including initial, main, and recovery phases) is defined as nonstorm. The statistical outcome shows that 185 plasmaspheric plume events are detected during the nonstorm period. These events during the nonstorm period account for 43.8 % percent of the total. The high proportion may be due to the relatively quiet geomagnetic activity during most of the time interval. As shown in Fig. 2a, it seems that the nonstorm plasmaspheric plume events cover all magnetic local time (MLT) ranges. However, the maximum number of plasmaspheric plume events occurs from MLT ∼ 18 to MLT ∼ 24. The spatial distributions of plasmaspheric plumes during different phases of geomagnetic storms are shown in Fig. 2b–d. The numbers of plasmaspheric plume events in the initial, main, and recovery phases are 31, 32, and 174, respectively. During geomagnetic storms, it seems that the plasmaspheric plume events observed in the recovery phase (174) occupy the largest proportion, and the plasmaspheric plumes in the recovery phase are mainly located on the dusk side (from MLT ∼ 15:00 to ∼ 21:00). On the other hand, the number of plasmaspheric plumes in both the initial and main phases are lower (31 and 32, respectively). The plasmaspheric plumes in the initial phase are mainly observed on the dusk–midnight side, and the plasmaspheric plumes in the main phase mainly occur on the afternoon side.
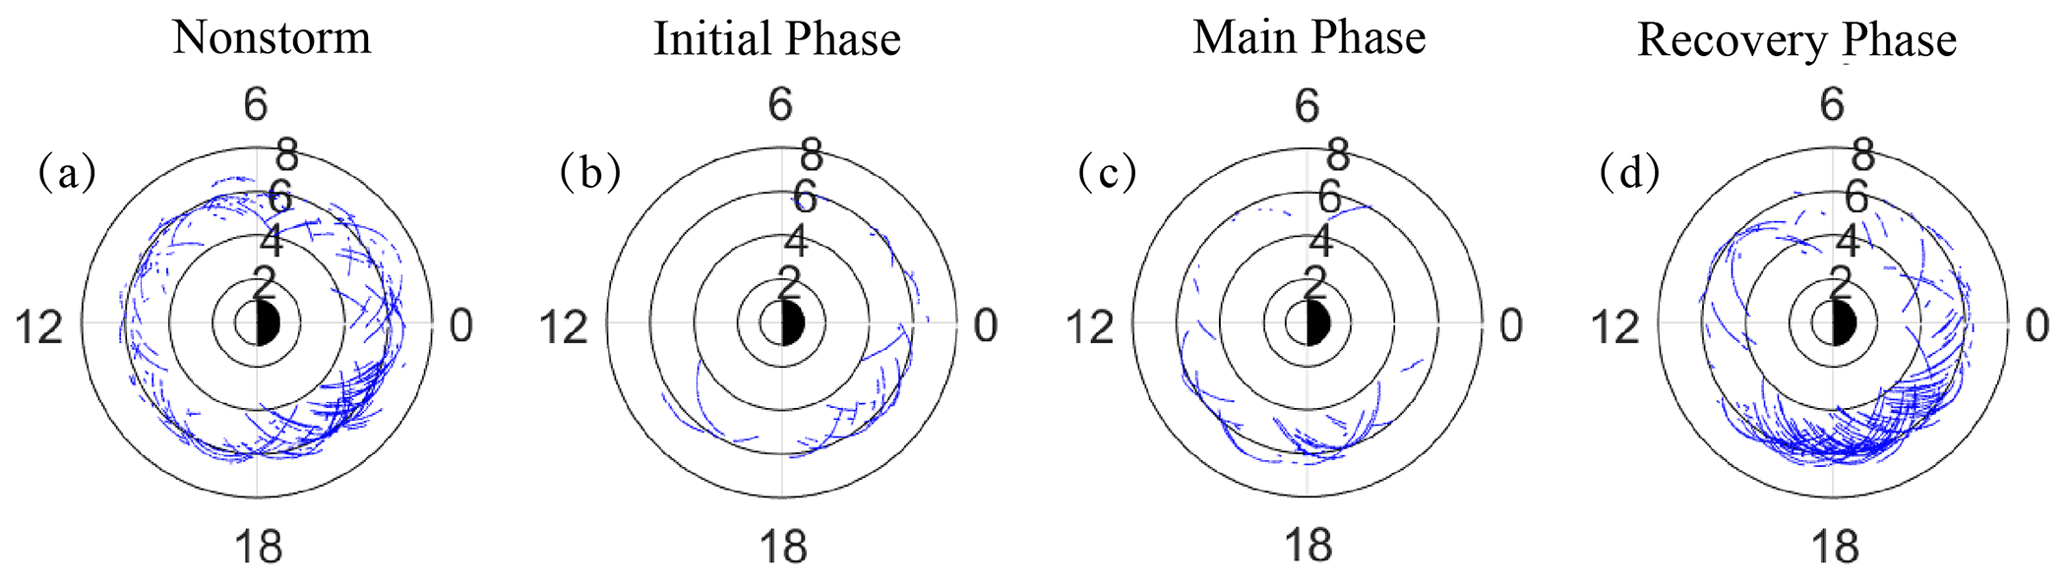
Figure 2The spatial distribution of plasmaspheric plumes (422 total events from January 2013 to December 2018) are shown in the MLT–L plane. (a–d) The distributions of observed plasmaspheric plumes during the nonstorm period (185 events), initial phase (31 events), main phase (32 events), and recovery phase (174 events).
Furthermore, we also examine the relationship between the occurrence rate of plasmaspheric plumes and the levels of geomagnetic disturbance. Similar to the analysis of the relationship between the plasmaspheric plume near magnetopause and geomagnetic activity studied in Lee et al. (2016; which reveals a statistical analysis of plumes while Dst >−50 nT), we selected the minimum Dst value from the previous 24 h to account for the response time of the plasmapause to geomagnetic activity, which was also adopted by Moldwin et al. (2004) and Darrouzet et al. (2008). Figure 3a shows the distribution of observed plasmaspheric plume density data points as a function of minimum Dst in the previous 24 h. Notably, every density data point provided by Van Allen Probes during the interval of a plume event is considered as one plasmaspheric plume sample. Figure 3b shows the normalized occurrence rates of plasmaspheric plumes in the inner magnetosphere with respect to the minimum Dst in the previous 24 h, which is obtained from the number of density data points in the plasmaspheric plume divided by that of all density data points provided by Van Allen Probes during the different levels of geomagnetic activity. It seems that the occurrence rates of plasmaspheric plumes in the interval of −10 < Dst < −10 nT are lower. On the other hand, the occurrence rates in intervals of −70 < Dst < −50, −50 < Dst < −30, and −30 < Dst < −10 nT are higher. The occurrence rates in the three intervals when −10 nT and Dst < 10 nT are similar, but the occurrence rate increases slightly with increasing geomagnetic activity level. The statistical results from the Van Allen Probes are somewhat different from the statistical result of plasmaspheric plumes near the dayside magnetopause measured by the Cluster spacecraft displayed in Lee et al. (2016). The results of Lee et al. (2016) implied that plasmaspheric plumes near the magnetopause with high L shells tend to be observed during moderate geomagnetic activity, and the highest occurrence rate is in the interval −30 < Dst < −10 nT.
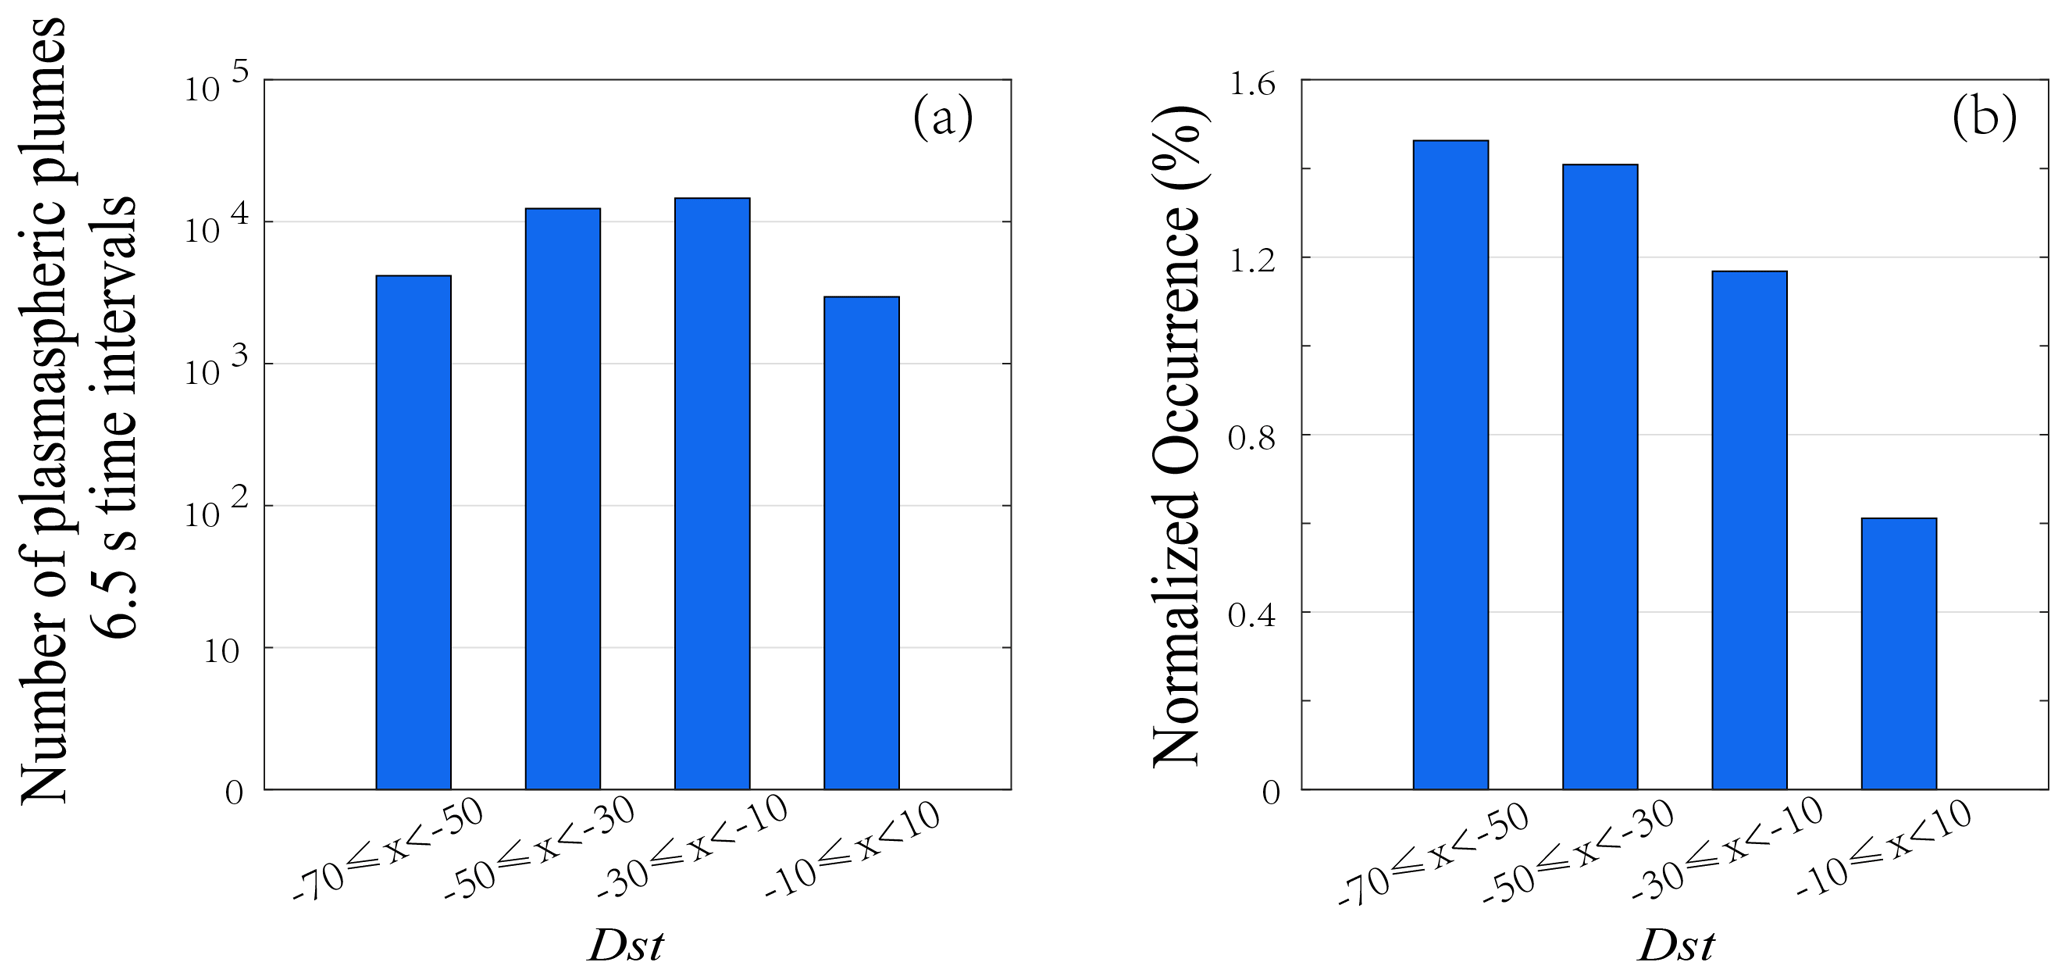
Figure 3(a) The distribution of observed plasmaspheric plume density data points as a function of the minimum Dst in the previous 24 h. (b) The normalized occurrence rates of plasmaspheric plumes in the inner magnetosphere with respect to the minimum Dst in the previous 24 h.
4.1 Model inputs
Test particle simulation is a useful method to analyze the motions and variations in plasma (Zhou et al., 2018). To explain the disparity in the occurrence rates of the observed plasmaspheric plume associated with geomagnetic activity levels in different L shells (L≤6.2 in the inner magnetosphere observed by Van Allen Probe A satellite and L≥6.2 during most of the Cluster orbital period), we run group test particle simulations to analyze the evolution of plasmaspheric plumes during different levels of geomagnetic storms. By calculating the drift paths of a great quantity of test plasmaspheric particles, the simulation not only provides the evolution of the plasmapause and plasmaspheric plume boundaries, which is similar to the plasmapause test particle (PTP) simulation provided by Goldstein et al. (2003, 2005a, b, 2014b), but also reveals the evolution of equatorial density in both the plasmasphere and plasmaspheric plume.
In this study, the geomagnetic field is assumed to be a dipolar field, and electron motion is assumed to be adiabatic. Following Goldstein et al. (2003, 2005a), we establish a magnetospheric model for the electric potential. The electric potential is the sum of the corotation electric potential Φrot and convection electric potential ΦVS as follows:
where C is a constant equal to 92, given by Völk and Haerendel (1970), R is the geocentric distance, and φ is the azimuthal angle. EIM indicates the assumed inner magnetospheric electric field derived from the solar wind electric field (ESW), where ESW is computed from 1 min OMNI data (derived from upstream measurements by the Advanced Composition Explorer (ACE) spacecraft; Stone et al., 1998). For the southward IMF, , where the factor f is assumed to be a constant 0.13. On the other hand, in the northward IMF, (Goldstein et al., 2014a, b).
Based on the model of a realistic magnetospheric electric field, the evolution of the cold plasmaspheric electron distribution in the geomagnetic equator is simulated. To obtain the initial electron density distribution in the plasmasphere during the quiet geomagnetic period, the electron density in the plasmasphere as a function of the L shell provided by the Sheeley et al. (2001) model is used (for L shell ≤ 7). In order to clearly exhibit the position near the plasmapause, the initial electron density is assumed to be the same at different MLTs. In addition, to simplify the calculation of the model, the electron densities outside the plasmapause are all assumed to be 5 cm−3. In this way, a relatively high-density gradient is assumed around L ∼ 7. A total of 100 000 test particles at an initial energy of 1 eV are launched into the model. The pitch angle of electrons is assumed to be arbitrary because the gradient/curvature drift velocity associated with the pitch angle can be negligible for cold electrons (Roederer and Zhang, 2014). The number of test particles within a unit area is transformed into a realistic density according to the weighting factor. Using the model above, the evolutions of the plasmasphere and plasmaspheric plume during different levels of geomagnetic storms are simulated. It should be pointed out that the shape of the real plasmasphere is complicated. As it is difficult to obtain the absolutely accurate shape of a real plasmasphere, a typical plasmaspheric model is used as the initial distribution of electron density in the current study. Although there may be some deviations between the simulated plume and the real plume, the simulation can still reflect the trends of density variation.
4.2 Plasmasphere dynamics: 13–15 February 2013
Figure 4 shows the geomagnetic and solar wind conditions for a moderate geomagnetic storm on 13–15 February 2013. As shown in Fig. 4a, the minimum value of the Dst index is −37 nT during the geomagnetic storm. During the main and recovery phases of the geomagnetic storm, the IMF is southward most of the time (shown in Fig. 4b). Based on the ESW, we calculated the EIM, which is shown in Fig. 4c.
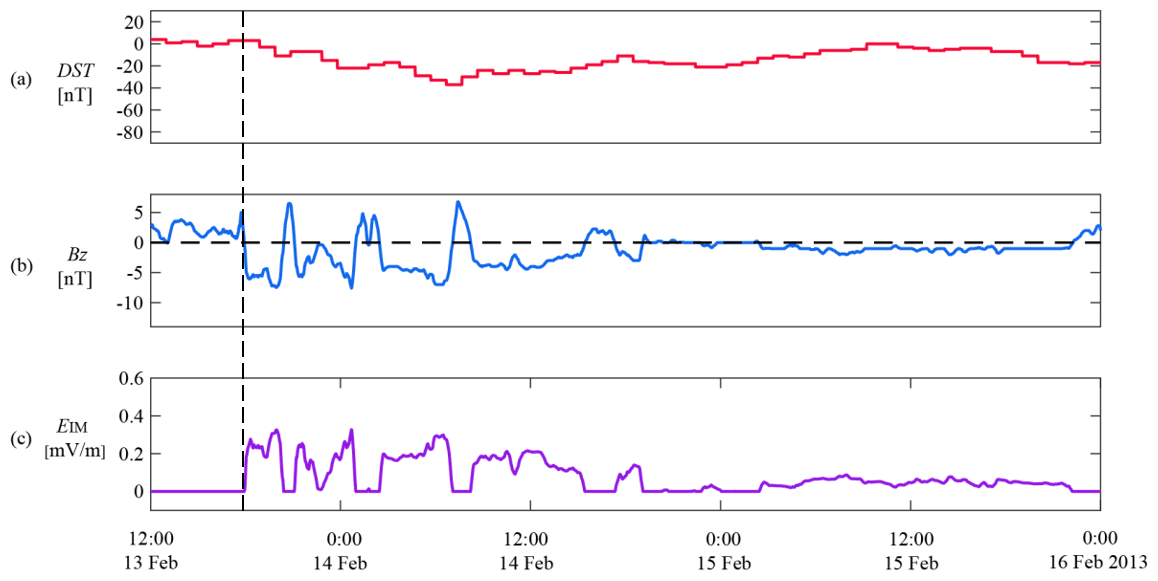
Figure 4Geomagnetic and solar wind conditions on 13–15 February 2013. The vertical dotted line indicates the start time of the test particle simulation (17:40 UT on 13 February 2013). (a) Dst index. (b) z component of IMF in geocentric solar magnetospheric (GSM) coordinates from merged 1 min OMNI data. (c) Assumed inner magnetospheric EIM is derived from ESW (see the text).
The EIM (derived from the ESW) in Fig. 4 was used as input to drive the test particle simulation. The simulation is started at 17:40 UT on 13 February 2013. This initial condition onset is defined as the time at which the EIM slope becomes positive and remains positive on its way to the maximum EIM value. The initial distribution of electron density is shown in Fig. 5a. The electron density is a function of the L shells and is provided by the model of Sheeley et al. (2001). With the dynamic evolution, it is obvious that the plasmaspheric particles move sunward through the E×B drift within 4 h (as shown in Fig. 5b), and the plasmapause on the nightside moves towards lower L shells. Meanwhile, the plasmapause on the dayside temporarily expands to higher L shells, and its location exceeds L shell ∼ 8.5. Next, the solar-wind-driven magnetospheric convection strips away the outer layers of the plasmasphere. Under the combined action of convection and corotation, the plasmaspheric plume is formed on the afternoon side, and the location of the dayside plasmapause decreases to L shell ∼ 4.2 (as shown in Fig. 5c). The eroded plasmaspheric material is transported sunward and may be lost to the dayside magnetopause boundary (Spasojevic et al., 2005; Spasojevic and Inan, 2010). Meanwhile, the plasmaspheric plume is formed near the dusk side due to the combination of convection and corotation electric fields at 20:40 UT on 14 February (as shown in Fig. 5d).
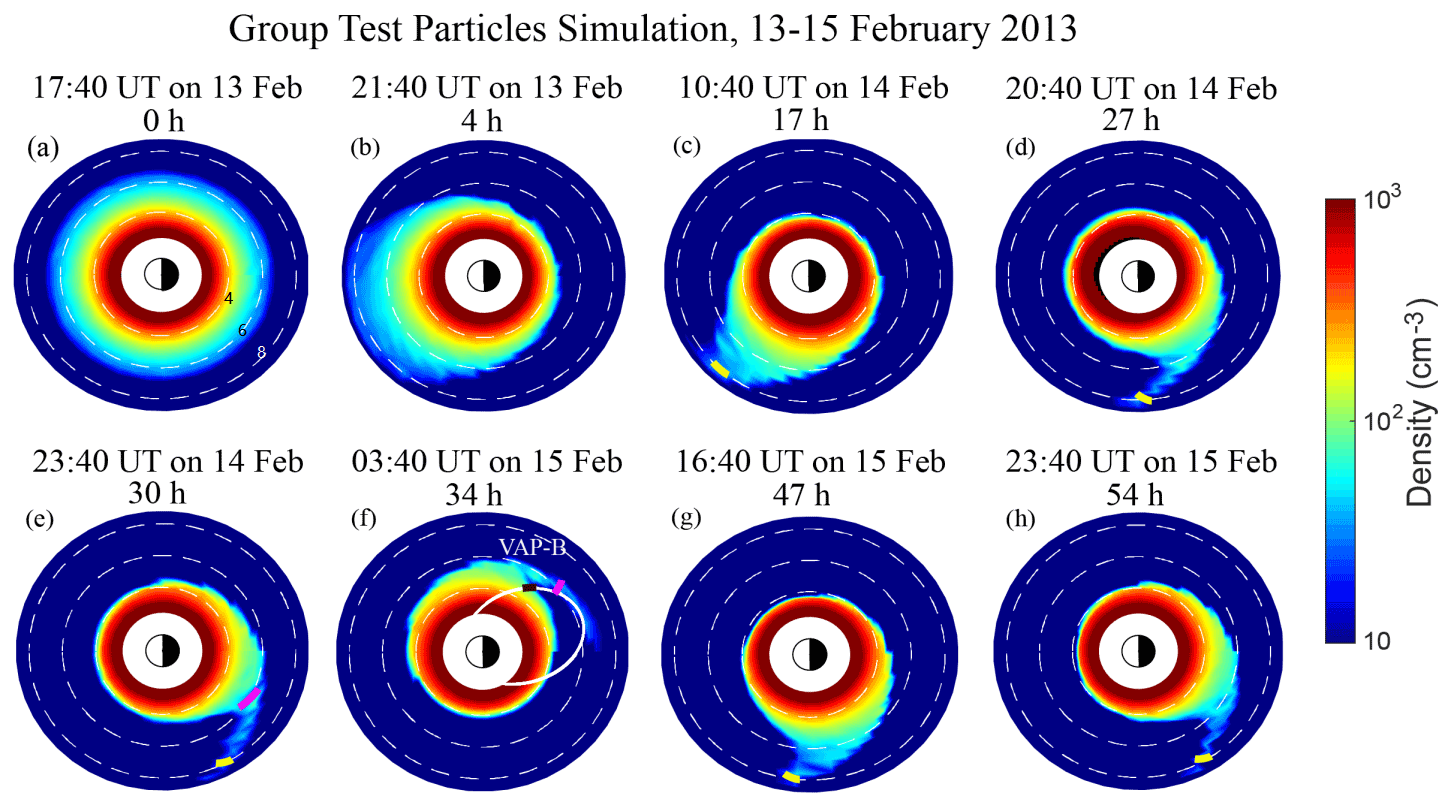
Figure 5The equatorial plots of the simulated plasmasphere and plasmaspheric plume through test particle simulation during 13–15 February 2013. The white curve represents the orbit of Van Allen Probe B satellite from 22:00 on 14 February to 07:00 UT on 15 February 2013. The black curves indicate the observed plasmaspheric plume. The white dashed circles represent L shells = 4, 6, and 8. The time above each panel represents the evolution time of the plasmasphere and plasmaspheric plume. The pink (yellow) curve indicates the range of enhanced density with a specific L shell = 6 (L shell = 8) that meets the standard of a satellite-observable plasmaspheric plume.
To combine the simulation with the identification of plasmaspheric plumes from satellites (Cluster observations provided by Lee et al., 2016, and Van Allen Probe observations in our study), the range of enhanced density with a specific L shell meeting the standard below is considered a satellite-observable plasmaspheric plume because (1) the density is more than the modeled density of the plasmasphere, as provided by Sheeley et al. (2001), and (2) the isolated cycle of enhanced density with a specific L shell (RCL) is more than 0.2 RE but less than 2 RE (0.2 RE). As shown in Fig. 5e and f, the range of enhanced density satisfied the criterion of an observable plasmaspheric plume from the 30th (23:40 UT on 14 February) to the 40th hours (09:40 UT on 15 February; not shown here) of the simulation time interval at L shell = 6 (indicated by the pink curve). As indicated by the black curve in Fig. 5f, Van Allen Probe B also observed the plume from L shell ∼ 4.7 to L shell ∼ 5.2 at approximately 04:00 UT on 15 February 2013. There is a small deviation between the simulated plume and the real one, which may be because the initial shape and density of real plasmasphere is very complicated. However, the real plasmasphere is hard to obtain; thus, only an empirical plasmaspheric model is adopted in the simulations. In the other intervals displayed in Fig. 5c, d, g, and h, the longitudinal range of enhanced density near L shell = 6 is too high. The wide isolated range of enhanced density near L shell ∼ 6 makes it difficult for the Van Allen Probes with elliptic orbits to identify the structure as a plasmaspheric plume because the Van Allen Probes may operate in the high electron density region during the whole interval of the inbound and outbound orbits. Compared with the information in Fig. 5f, the plasmaspheric bulges in Fig. 5c, d, g, and h are increasingly wider and larger because the interplanetary magnetic field was southward on 15 February. Although the EIM was small, it may have strengthened the plasmaspheric bulge near the dusk side.
Meanwhile, as shown in Fig. 5c–h, the range of enhanced density satisfied the criterion of an observable plasmaspheric plume from the 17th (10:40 UT on 14 February) to the 54th hours (23:40 UT on 15 February) in at L shell = 8 (indicated by yellow curve) during most times. Therefore, in this case of a moderate geomagnetic storm, it seems that the satellite with higher L shells has a larger probability of identifying the plasmaspheric plume structure than that in the inner magnetosphere with lower L shells.
4.3 Plasmasphere dynamics: 30 April–3 May 2013
Figure 6 shows the geomagnetic and solar wind conditions for a strong geomagnetic storm from 30 April to 3 May 2013. As shown in Fig. 6a, the minimum value of the Dst index is −72 nT during the geomagnetic storm. The calculated EIM (shown in Fig. 6c) in the main phase is much larger than that in the above moderate geomagnetic storm presented in Sect. 4.2. This implies that the convection during the strong geomagnetic storm was much more intense. Similar to Fig. 4, the vertical dashed line (17:00 UT on 30 April 2013) indicates that the start time of the test particle simulation corresponds to the strong geomagnetic storm.

Figure 6Geomagnetic and solar wind conditions on 30 April–3 May 2013. The format is the same as Fig. 4.
Figure 7 reveals the dynamic evolution of the plasmasphere and plasmaspheric plume during the strong geomagnetic storm. The initial distribution of the electron density is set up in the same way as the previous event at 17:00 UT on 30 April and is shown in Fig. 7a. Due to more intense convection during the main phase of the strong geomagnetic storm, more plasmasphere material is lost. It is obvious that the particles in the outer plasmasphere dissipate in a very short time interval, as shown in Fig. 7d. The location of the plasmapause is reduced to L shells < 3 at 21:00 UT on 1 May (within 28 h). Meanwhile, a typical plasmaspheric plume structure formed near the dusk side. At 18:00 UT on 1 May 2013, the recovery phase of the geomagnetic storm starts. As indicated by the black curve in Fig. 7g, the Van Allen Probe also observed the plume from L shell ∼ 3.4 to L shell ∼ 4.3 at approximately 07:00 UT on 2 May 2013. Although the EIM is positive in some intervals of the recovery phase, the motions of the residual material of the plasmasphere at low L shells (L shell < 3) are mainly controlled by the corotational electric field during the recovery phase. The intermittent positive EIM during the recovery phase of the second geomagnetic storm may continue to bring about plume particle loss to the magnetopause, especially for the plume particles with higher L shells. As a result, the plasmaspheric plume becomes thinner than that during the moderate geomagnetic storm (presented in Sect. 4.2), especially for L shell ≥8. As shown in Fig. 7f–h, after 01:00 UT on 2 May, the bulged density at L shell ∼ 8 is too low to be identified as an observable plasmaspheric plume. Overall, the plasmaspheric plume was mainly confined to lower L shells (L shell ≤ 7) in the recovery phase of the geomagnetic storm. The time interval of the Cluster satellite in the region with L shell ≥ 6 is much greater than that in the inner magnetosphere. As a result, during this strong geomagnetic storm, especially the recovery phase of the geomagnetic storm, the Cluster satellite has a lower probability of identifying the plasmaspheric plume structure than the Van Allen Probe satellites (in the inner magnetosphere with lower L shells).
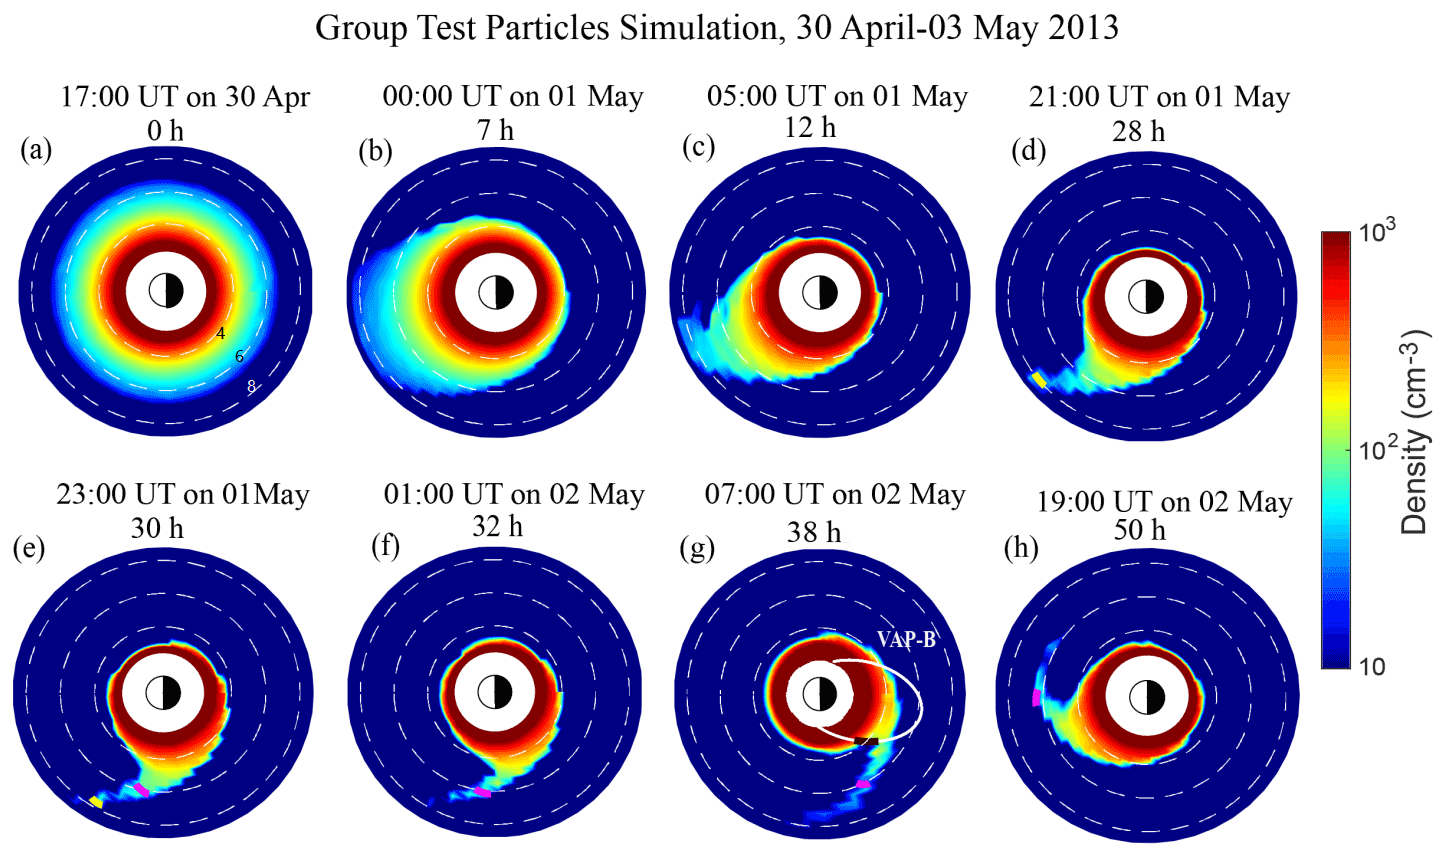
Figure 7The equatorial plots of the simulated plasmasphere and plasmaspheric plume through test particle simulation during 30 April–3 May 2013. The white curve represents the orbit of the Van Allen Probe B satellite from 06:00 to 15:00 UT on 2 May 2013. The black curves indicate the observed plasmaspheric plume. The white dotted circles represent L=4, 6, and 8. The number above each plot represents the time of evolution. The pink (yellow) curve indicates the range of enhanced density with a specific L=6 (L=8) that meets the standard of a satellite-observable plasmaspheric plume.
In the present study, using density data from Van Allen Probe A, we performed a statistical analysis of plasmaspheric plumes in the inner magnetosphere. A total of 422 plasmaspheric plume events are captured out from 4030 Van Allen Probe A orbits. The statistical results show that the ratio of observed plasmaspheric plume events is largest (∼ 43 %) during the nonstorm period. This may be because the plasmaspheric plume that forms during a geomagnetic storm may remain residual for quite a long time period after the geomagnetic activity has recovered. In addition, quiet geomagnetic activity occupies most of the time interval (Halford et al., 2010; Wang et al., 2016). Therefore, the number of observed plasmaspheric plume events during the nonstorm period is high. Since the corotational electric field plays a leading role in the motion of plasmaspheric particles during quiet geomagnetic activity, the residual plasmaspheric plume can corotate with the Earth. Consequently, the residual plasmaspheric plume may be observed by satellite in all MLTs (as shown in Fig. 2a).
Moreover, during the interval of geomagnetic storms, plasmaspheric plume events are mainly concentrated in the recovery phase and dusk side. This result is similar to the conclusions of previous works, such as Chi et al. (2000), Reinisch et al. (2004), and Kim et al. (2007), and suggests that the structure of the plasmaspheric plume is more obvious after the large erosion in the main phase of geomagnetic storms. However, this result is different from the observation at the magnetopause. Walsh et al. (2013) suggested that the most common location where plume material contacts the magnetopause is at MLT ∼ 13.6. This may be because the plasma material is dragged from the dusk region with lower L shells towards the noon side with higher L shells due to sunward convection.
In this study, to investigate the correlation between the occurrence rate of observed plasmaspheric plumes in the inner magnetosphere and the level of geomagnetic storms, we select the minimum Dst value from the previous 24 h to account for the response time of the plasmapause to geomagnetic storms. The results show that the occurrence rate of observed plasmaspheric plumes in the inner magnetosphere increases with increasing geomagnetic activity, and the largest occurrence rate corresponds to the most intense geomagnetic activity. This result is different from the occurrence rate of observed plasmaspheric plume events detected by the Cluster satellite with a much higher apogee, which was presented in Lee et al. (2016). They suggested that the plasmaspheric plume events observed by the Cluster satellite tend to be observed during moderate geomagnetic activity. The researchers generally using the same criteria to identify the observable plume in different L shells, such as Lee et al. (2015) and Zhang et al. (2019). A key point of the study is to explain the proportion of observable plasmaspheric plume in different L shells associated with geomagnetic activity. The dynamic evolutions of the plasmaspheric plume are simulated during both moderate and strong geomagnetic storms to demonstrate the disparity of observations at different L shells. The simulation results suggest that plasmasphere erosion is smaller and that the range of plasmaspheric plumes in the inner magnetosphere is wider during moderate geomagnetic activity (as shown in Sect. 4.2). The wider isolated region of high density contributed by plasmaspheric plumes near L shells ≤ 6.2 may make it difficult for the Van Allen Probes with elliptic orbits to identify the structure as an observed plasmaspheric plume. In addition, the isolated region of high density contributed by plasmaspheric plumes is narrower when L shells ≥ 8, which make it easy for Cluster (with higher L shells during most of the orbital period) to identify the plasmaspheric plume structure during moderate geomagnetic storms, especially in the recovery phase. It must be admitted that the magnetic field is assumed to be a dipolar field in this study, so the calculations of electron motions are not entirely correct near the magnetopause. Nonetheless, it can generally reflect the trend of electron density within L shells ≤ 8.5, which is exhibited in Figs. 5 and 7.
On the other hand, the simulated scale of plasmaspheric plumes during strong geomagnetic storms is different from that during moderate geomagnetic storms. As presented in Sect. 4.3, plasmasphere erosion is extremely intense during the main phase of a strong geomagnetic storm. A great quantity of outer plasmaspheric particles is lost to the magnetopause. The plasmapause shrank to L shells < 3 when the recovery phase started, and the residual plasmasphere may be primarily controlled by the corotation electric field. During the recovery phase of strong geomagnetic storm, the plasmaspheric plume is much thinner and narrower than the plasmaspheric plume during a moderate geomagnetic storm. Consequently, the Van Allen Probes more easily identify the structure of plasmaspheric plumes during the recovery phase of strong geomagnetic storms. In addition, the enhanced density near the magnetopause contributed by the stretched plasmaspheric plume is too low during strong geomagnetic storms. The obvious structure of the plasmaspheric plume is confined to lower L shells. As a result, the Cluster satellites with higher L shells in most orbital periods have difficulty identifying the structure of plasmaspheric plumes during strong geomagnetic storms.
In summary, the main conclusions of the study are as follows:
-
The plasmaspheric plume events during the nonstorm period are distributed in all MLTs, but the number of plasmaspheric plume events from the dusk side to the midnight side is the largest. In addition, during geomagnetic storms, the plasmaspheric plume events tend to occur near the dusk side during the recovery phase.
-
The plasmaspheric plume in the inner magnetosphere is preferentially observed during strong geomagnetic storms. This result is different from the statistical results of observations near the magnetopause, which suggests that the plasmaspheric plume tends to be observed during moderate geomagnetic storms.
-
The evolutions of plasmaspheric plumes during moderate and strong geomagnetic storms were simulated, respectively. During the case of the moderate geomagnetic storm, the wider isolated region of high density contributed by the plume may make it difficult for the Van Allen Probes in the inner magnetosphere to identify the structure as an observed plasmaspheric plume. However, the region of high density contributed by the plasmaspheric plume is narrower near the magnetopause, which makes it easy for the satellite near magnetopause to identify the plasmaspheric plume structure.
-
During the case of the strong geomagnetic storm, the plasmapause shrank to a very low L shell, and the scale of the plume was narrower, and these two factors make the Van Allen Probes in the inner magnetosphere frequently identify the structure of the plasmaspheric plume. In addition, the plasmaspheric plume may be confined to lower L shells, which makes it difficult for the Cluster satellite to identify the plasmaspheric plume structure.
Notably, the cases above cannot represent all the evolutions of plasmaspheric plumes during either moderate or strong geomagnetic storms. However, this study provides an alternative mechanism to interpret the different occurrence rates of plasmaspheric plumes detected by different satellites. Furthermore, since a relatively long time is required for the plasmasphere to recover to a normal level after a geomagnetic storm (Xiao-Ting et al., 1988; Chu et al., 2017), we did not consider the refilling process of the plasmasphere from the ionospheric particles drawn upward. More theoretical and comprehensive modeling will be studied in our future project.
The data of EMFISIS aboard the Van Allen Probes are publicly available at the EMFISIS website (http://emfisis.physics.uiowa.edu/Flight/, last access: 10 January 2022, Kletzing et al., 2013). The OMNI data are provided at SPDF website (http://cdaweb.gsfc.nasa.gov, last access: 10 January 2022, NASA, 2022).
The conceptional idea of this study was developed by HL and RT. HL and TF wrote the paper, and RT revised it. ZhiY and XD helped substantially with the analysis. ZhaY and OZ contributed to the Van Allen Probe data processing. All authors discussed the results.
The contact author has declared that neither they nor their co-authors have any competing interests.
Publisher’s note: Copernicus Publications remains neutral with regard to jurisdictional claims in published maps and institutional affiliations.
The data of EMFISIS aboard the Van Allen Probes are publicly available at the EMFISIS website (http://emfifisis.physics.uiowa.edu/Flight/, last access: 10 January 2022). The DST data are provided by OMNI (http://cdaweb.gsfc.nasa.gov, last access: 10 January 2022; NASA, 2022).
This research has been supported by the National Natural Science Foundation of China (grant nos. 42064009, 41974195, and 41674144).
This paper was edited by Jonathan Rae and reviewed by two anonymous referees.
Carpenter, D. L. and Lemaire, J.: Erosion and recovery of the plasmasphere in the plasmapause region, Space Sci. Rev., 80, 153–179, https://doi.org/10.1023/A:1004981919827, 1997.
Chi, P. J., Russell, C. T., Musman, S., Peterson, W. K., Le, G., Angelopoulos, V., Reeves, G. D., Moldwin, M. B., and Chun, F. K.: Plasmaspheric depletion and refilling associated with the September 25, 1998 magnetic storm observed by ground magnetometers at L=2, Geophys. Res. Lett., 32, L03S07, https://doi.org/10.1029/1999GL010722, 2000.
Chu, X. N., Bortnik, J., Li, W., Ma, Q., Angelopoulos, V., and Thorne, R. M.: Erosion and refilling of the plasmasphere during a geomagnetic storm modeled by a neural network, J. Geophys. Res., 122, 7118–7129, https://doi.org/10.1002/2017JA023948, 2017.
Darrouzet, F., Keyser, J. D., and Pierrard, V.: The Earth's Plasmasphere: A Cluster and IMAGE Perspective, Springer, New York, https://doi.org/10.1007/978-1-4419-1323-4, 2009.
Dargent, J., Aunai, N., Lavraud, B., Toledo-Redondo, S., and Califano, F.: Simulation of plasmaspheric plume impact on dayside magnetic reconnection, Geophys. Res. Lett., 47, e2019GL086546, https://doi.org/10.1029/2019GL086546, 2020.
Darrouzet, F., De Keyser, J., Décréau, P. M. E., El Lemdani-Mazouz, F., and Vallières, X.: Statistical analysis of plasmaspheric plumes with Cluster/WHISPER observations, Ann. Geophys., 26, 2403–2417, https://doi.org/10.5194/angeo-26-2403-2008, 2008.
Dungey, J. W.: Interplanetary Magnetic Field and the Auroral Zones, Phys. Rev. Lett., 6, 47–48, https://doi.org/10.1103/PhysRevLett.6.47, 1961.
Elphic, R. C., Weiss, L. A., Thomsen, M. F., McComas, D. J., and Moldwin, M. B.: Evolution of plasmaspheric ions at geosynchronous orbit during times of high geomagnetic activity, Geophys. Res. Lett., 23, 2189, https://doi.org/10.1029/96GL02085, 1996.
Goldstein, J., Sandel, B. R., Hairston, M. R., and Reiff, P. H.: Control of plasmaspheric dynamics by both convection and sub-auroral polarization stream, Geophys. Res. Lett., 30, 2243, https://doi.org/10.1029/2003GL018390, 2003.
Goldstein, J., Sandel, B. R., Thomsen, M. F., Spasojević, M., and Reiff, P. H.: Simultaneous remote sensing and in situ observations of plasmaspheric drainage plumes, J. Geophys. Res., 109, A03202, https://doi.org/10.1029/2003JA010281, 2004.
Goldstein, J., Burch, J. L., and Sandel, B. R.: Magnetospheric model of subauroral polarization stream, J. Geophys. Res., 110, A09222, https://doi.org/10.1029/2005JA011135, 2005a.
Goldstein, J., Kanekal, S. G., Baker, D. N., and Sandel, B. R.: Dynamic relationship between the outer radiation belt and the plasmapause during March–May 2001, Geophys. Res. Lett., 32, L15104, https://doi.org/10.1029/2005GL023431, 2005b.
Goldstein, J., Pascuale, S. D., Kletzing, C., Kurth, W., Genestreti, K. J., Skoug, R. M., Larsen, B. A., Kistler, L. M., Mouikis, C., and Spence, H.: Simulation of Van Allen Probes plasmapause encounters, J. Geophys. Res., 119, 7464–7484, https://doi.org/10.1002/2014JA020252, 2014a.
Goldstein, J., Thomsen, M. F., and Dejong, A.: In situ signatures of residual plasmaspheric plumes: Observations and simulation, J. Geophys. Res., 119, 4706–4722, https://doi.org/10.1002/2014JA019953, 2014b.
Gonzalez, W. D., Joselyn, J. A., Kamide, Y., Kroehl, H. W., Rostoker, G., Tsurutani, B. T., and Vasyliunas, V. M.: What is a geomagnetic storm?, J. Geophys. Res.-Space, 99, 5771–5792, https://doi.org/10.1029/93JA02867, 1994.
Grison, B., Hanzelka, M., Breuillard, H., Darrouzet, F., Santolík, O., Cornilleau‐Wehrlin, N., and Dandouras, I.: Plasmaspheric plumes and EMIC rising tone emissions, J. Geophys. Res.-Space, 123, 9443–9452, https://doi.org/10.1029/2018ja025796, 2018.
Halford, A. J., Fraser, B. J., and Morley, S. K.: EMIC wave activity during geomagnetic storm and nonstorm periods: CRRES results, J. Geophys. Res.-Space, 115, A12248, https://doi.org/10.1029/2010ja015716, 2010.
Kim, K‐H., Goldstein, J., and Berube, D.: Plasmaspheric drainage plume observed by the Polar satellite in the prenoon sector and the IMAGE satellite during the magnetic storm of 11 April 2001, J. Geophys. Res., 112, A06237, https://doi.org/10.1029/2006JA012030, 2007.
Kletzing, C. A., Kurth, W. S., Acuna, M., MacDowall, R. J., Torbert, R. B., Averkamp, T., Bodet, D., Bounds, S. R., Chutter, M., Connerney, J., Crawford, D., Dolan, J. S., Dvorsky, R., Hospodarsky, G. B., Howard, J., Jordanova, V., Johnson, R. A., Kirchner, D. L., Mokrzycki, B., Needell, G., Odom, J., Mark, D., Pfaff, R., Phillips, J. R., Piker, C. W., Remington, S. L., Rowland, D., Santolik, O., Schnurr, R., Sheppard, D., Smith, C. W., Thorne, R. M., and Tyler, J.: The Electric and Magnetic Field Instrument Suite and Integrated Science (EMFISIS) on RBSP, Space Sci. Rev., 179, 127–181, https://doi.org/10.1007/s11214-013-9993-6, 2013.
Kurth, W. S., De Pascuale, S., Faden, J. B., Kletzing, C. A., Hospodarsky, G. B., Thaller, S., and Wygant, J. R.: Electron densities inferred from plasma wave spectra obtained by the Waves instrument on Van Allen Probes, J. Geophys. Res.-Space, 120, 904–914, https://doi.org/10.1002/2014JA020857, 2015.
Lee, S. H., Zhang, H., Zong, Q.-G. Otto, A., Rème, H., and Liebert, E.: A statistical study of plasmaspheric plumes and ionospheric outflows observed at the dayside magnetopause, J. Geophys. Res., 121, 492–506, https://doi.org/10.1002/2015JA021540, 2016.
Lemaire, J. F. and Konstantin I.: The Earth's Plasmasphere, Cambridge University Press, ISBN 0521430917, 1998.
Lointier, G., Darrouzet, F., Décréau, P. M. E., Vallières, X., Kougblénou, S., Trotignon, J. G., and Rauch, J.-L.: Refilling process in the plasmasphere: a 3-D statistical characterization based on Cluster density observations, Ann. Geophys., 31, 217–237, https://doi.org/10.5194/angeo-31-217-2013, 2013.
Malaspina, D. M., Jaynes, A. N., Boulé, C., Bortnik, J., Thaller, S. A., Ergun, R. E., Kletzing, C. A., and Wygant, J. R.: The distribution of plasmaspheric hiss wave power with respect to plasmapause location, Geophys. Res. Lett. 43, 7878–7886, https://doi.org/10.1002/2016GL069982, 2016.
Meredith, N. P., Horne, R. B., Thorne, R. M., Summers, D., and Anderson, R. R.: Substorm dependence of plasmaspheric hiss, J. Geophys. Res., 109, A06209, https://doi.org/10.1029/2004JA010387, 2004.
Moldwin, M. B., Downward, L., Rassoul, H. K., Amin, R., and Anderson, R. R.: A new model of the location of the plasmapause: CRRES results, J. Geophys. Res., 107, 1339, https://doi.org/10.1029/2001JA009211, 2002.
Moldwin, M. B., Howard, J., Sanny, J., Bocchicchio, J. D., Rassoul, H. K., and Anderson, R. R.: Plasmaspheric plumes: CRRES observations of enhanced density beyond the plasmapause, J. Geophys. Res., 109, A05202, https://doi.org/10.1029/2003JA010320, 2004.
Moldwin, M. B., Zou, S., and Heine, T.: The story of plumes: the development of a new conceptual framework for understanding magnetosphere and ionosphere coupling, Ann. Geophys., 34, 1243–1253, https://doi.org/10.5194/angeo-34-1243-2016, 2016.
NASA: Coordinated Data Analysis Web (CDAWeb), SPDF [data set], http://cdaweb.gsfc.nasa.gov, last access: 10 January 2022.
Reinisch, B. W., Huang, X., Song, P., Green, J. L., Fung, S. F., Vasyliunas, V. M., Gallagher, D. L., and Sandel, B. R.: Plasmaspheric mass loss and refilling as a result of a magnetic storm, J. Geophys. Res., 109, A01202, https://doi.org/10.1029/2003JA009948, 2004.
Roederer, J. G. and Zhang, H.: Dynamics of magnetically trapped particles, Springer-Verlag Berlin An, https://doi.org/10.1007/978-3-642-41530-2, 2016.
Sheeley, B. W., Moldwin, M. B., Rassoul, H. K., and Anderson, R. R.: An empirical plasmasphere and trough density model: CRRES observations, J. Geophys. Res., 106, 25631–25642, https://doi.org/10.1029/2000JA000286, 2001.
Shi, R., Li, W., Ma, Q., Green, A., Kletzing, C. A., Kurth, W. S., Hospodarsky, G. B., Claudepierre, S. G., Spence, H. E., and Reeves, G. D.: Properties of whistler mode waves in Earth's plasmasphere and plumes, J. Geophys. Res., 124, 1035–1051, https://doi.org/10.1029/2018JA026041, 2019.
Spasojevic, M. and Inan, U. S.: Drivers of chorus in the outer dayside magnetosphere, J. Geophys. Res.-Space, 115, A00F09, https://doi.org/10.1029/2009JA014452, 2010.
Spasojevic, M., Thomsen, M. F., Chi, P. J., and Sandel, B. R.: Afternoon Subauroral Proton Precipitation Resulting from Ring Current – Plasmasphere Interaction, AGU Fall Meeting Abstracts., 159, 85–99, https://doi.org/10.1029/159gm06, 2005.
Stone, E. C., Frandsen, A. M., Mewaldt, R. A., Christian, E. R., Margolies, D., Ormes, J. F., and Snow, F.: The Advanced Composition Explorer, Space Sci. Rev. 86, 1–22, https://doi.org/10.1023/A:1005082526237, 1998.
Su, Z., Zhu, H., Xiao, F., Zheng, H., Wang, Y., Shen, C., Zhang, M., Wang, S., Kletzing, C. A., Kurth, W. S., Hospodarsky, G. B., Spence, H. E., Reeves, G. D., Funsten, H. O., Blake, J. B., Baker, D. N., and Wygant, J. R.: Disappearance of plasmaspheric hiss following interplanetary shock, Geophys. Res. Lett., 42, 3129–3140, https://doi.org/10.1002/2015GL063906, 2015.
Usanova, M. E., Darrouzet, F., Mann, I. R., and Bortnik, J.: Statistical analysis of EMIC waves in plasmaspheric plumes from Cluster observations, J. Geophys. Res.-Space, 118, 4946–4951, https://doi.org/10.1002/jgra.50464, 2013.
Walsh, B. M., Sibeck, D. G., Nishimura, Y., and Angelopoulos, V.: Statistical analysis of the plasmaspheric plume at the magnetopause, J. Geophys. Res.-Space, 118, 4844–4851, https://doi.org/10.1002/jgra.50458, 2013.
Wang, D., Yuan, Z., Yu, X., Huang, S., Deng, X., Zhou, M., and Li, H.: Geomagnetic storms and EMIC waves: Van Allen Probe observations, J. Geophys. Res., 121, 6444–6457, https://doi.org/10.1002/2015JA022318, 2016.
Xiao-Ting, S., Gendrin, R., and Caudal, G.: Refilling process in the plasmasphere and its relation to magnetic activity, J. Atmos. Sol.-Terr. Phys., 50, 185–195, https://doi.org/10.1016/0021-9169(88)90067-0, 1988.
Yu, X., Yuan, Z., Wang, D., Huang, S., Qiao, Z., Yu, T., and Yao, F.: Excitation of oblique O+ band EMIC waves in the inner magnetosphere driven by hot H+ with ring velocity distributions, J. Geophys. Res.-Space, 121, 11101–11112, https://doi.org/10.1002/2016JA023221, 2016.
Yuan, Z., Deng, X., Lin, X., Pang, Y., Zhou, M., Décréau, P. M. E., Trotignon, J. G., Lucek, E., Frey, H. U., and Wang, J.: The link between EMIC waves in a plasmaspheric plume and a detached sub-auroral proton arc with observations of Cluster and IMAGE satellites, Geophys. Res. Lett., 37, L07108, https://doi.org/10.1029/2010GL042711, 2010.
Yuan, Z., Xiong, Y., Pang, Y., Zhou, M., Deng, X., Trotignon, J. G., Lucek, E., and Wang, J.: Wave-particle interaction in a plasmaspheric plume observed by a Cluster satellite, J. Geophys. Res., 117, A03205, https://doi.org/10.1029/2011JA017152, 2012.
Zhang, W., Ni, B., Huang, H., Summers, D., Fu, S., Xiang, Z., Gu, X., Cao, X., Lou, Y., and Hua, M.: Statistical properties of hiss in plasmaspheric plumes and associated scattering losses of radiation belt electrons, Geophys. Res. Lett., 46, 5670–5680, https://doi.org/10.1029/ 2018GL081863, 2019.
Zhang, W., Fu, S., Gu, X., Ni, B., Xiang, Z., Summers, D., Zou, Z., Cao, X., Lou, Y., and Hua, M.: Electron scattering by plasmaspheric hiss in a nightside plume, Geophys. Res. Lett., 45, 4618–4627, https://doi.org/10.1029/2018GL077212, 2018.
Zhou, M., El-Alaoui, M., Lapenta, G., Berchem, J., Richard, R. L., and Schriver, D.: Suprathermal electron acceleration in a reconnecting magnetotail: Large-scale kinetic simulation, J. Geophys. Res., 123, 8087–8108, https://doi.org/10.1029/2018JA025502, 2018.