the Creative Commons Attribution 4.0 License.
the Creative Commons Attribution 4.0 License.
 | 14 Apr 2021
Modelling the residual mean meridional circulation at different stages of sudden stratospheric warming events
Andrey V. Koval
Wen Chen
Ksenia A. Didenko
Tatiana S. Ermakova
Nikolai M. Gavrilov
Alexander I. Pogoreltsev
Olga N. Toptunova
Ke Wei
Anna N. Yarusova
Anton S. Zarubin
Ensemble simulation of the atmospheric general circulation at altitudes up to the lower thermosphere is performed using the 3-D nonlinear mechanistic numerical model MUAM. The residual mean meridional circulation (RMC), which is the superposition of the mean Eulerian and wave-induced eddy components, is calculated for the boreal winter. Changes in the vertical and meridional RMC velocity components are analysed at different stages of a simulated composite sudden stratospheric warming (SSW) event averaged over 19 model runs. The simulation results show a general decrease in RMC velocity components up to 30 % during and after SSW in the mesosphere and lower thermosphere of the Northern Hemisphere. There are also increases in the downward and northward velocities at altitudes of 20–50 km at the northern polar latitudes during SSW. Associated vertical transport and adiabatic heating can contribute to warming the stratosphere and downward shifting of the stratopause during the composite SSW. The residual mean and eddy mass fluxes are calculated for different SSW stages. It is shown that before the SSW, planetary wave activity creates wave-induced eddy circulation cells in the northern upper stratosphere, which are directed upwards at middle latitudes, northward at high latitudes and downwards near the North Pole. These cells increase heat transport and adiabatic heating in the polar region. During SSW, the region of upward eddy vertical velocity is shifted to high latitudes, but the velocity is still downward near the North Pole. After SSW, upward eddy-induced fluxes span the entire polar region, producing upward transport and adiabatic cooling of the stratosphere and providing the return of the stratopause to higher altitudes. The obtained statistically significant results on the evolution of RMC and eddy circulation at different SSW stages at altitudes up to the lower thermosphere can be useful for a better understanding the mechanisms of planetary wave impacts on the mean flow and for the diagnostics of the transport of conservative tracers in the atmosphere.
- Article
(4141 KB) - Full-text XML
- BibTeX
- EndNote


The main mechanism for the global transport of tracers between the troposphere and stratosphere is the meridional circulation (e.g. Dobson et al., 1929; Dobson, 1956; Brewer, 1949; Fishman and Crutzen, 1978), in which tropospheric air enters the stratosphere in the tropics then travels to the poles and sinks down at middle and high latitudes of both hemispheres. At higher altitudes, it is essential to consider the meridional circulation producing mass transfer from the summer hemisphere to the winter one. Over the last few decades, there has been a surge of interest in the study of the atmospheric general circulation, which was mainly related to the diagnostics of transport of atmospheric gas species and its forecasting (e.g. Butchart, 2014; Pawson et al., 2000; Gerber et al., 2012; Eyring et al., 2005; SPARC CCMVal, 2010). A large number of studies were also devoted to the analysis of meteorological reanalysis data and to the interpretation of observed atmospheric processes (e.g. Iwasaki et al., 2009; Sevior et al., 2012, etc.).
It is well known, that atmospheric planetary-scale waves can substantially modify the mean Eulerian meridional circulation, i.e. zonal averaging of the mean meridional and vertical flows is ineffective for analysing the global transport of atmospheric species. In the momentum and energy equations, the wave fluxes of momentum and heat are partly compensated by advective momentum and heat fluxes (e.g. Charney and Drazin, 1961). With the Eulerian approach, similar compensation of wave and mean mass fluxes also occurs in the continuity equation. These features do not allow one to isolate the wave action from that of the mean flow. In order to overcome this disadvantage, it is essential to use alternative approaches to the analysis of the zonal-mean circulation, one of which is the calculation of transformed Eulerian mean (TEM) circulation (e.g. Andrews and McIntyre, 1976), which is used in the present study. This approach provides effective diagnostics of wave impacts on the mean flow and gives the ability to calculate the meridional transport of mass and tracers in the atmosphere. This method leads to the consideration of the so-called residual mean meridional circulation (RMC), which is a superposition of eddy-induced and advective zonal-mean flows. RMC estimates residual parts of the mean flow, which remain after partial compensation of the Eulerian zonal-mean circulation by the wave-induced eddy mass, momentum and heat fluxes (e.g. Shepherd, 2007). In its traditional form, the RMC is 2-D and formulas describing it include zonally averaged values of atmospheric parameters (e.g. Holton, 2004).
Sudden stratospheric warming (SSW) events are among the most dramatic dynamical processes appearing at high latitudes of the middle atmosphere during winter. In the stratosphere during SSWs, the zonal-mean meridional thermal gradient (usually directed towards the Equator in winter) reverses its direction to the opposite one. In the case of a major SSW, the eastward zonal velocity in the mid-latitude stratosphere also reverses, while in the case of a minor SSW, only a weakening of the zonal wind velocity is observed (e.g. Holton, 2004; McIntyre, 1982). SSW events can substantially affect the dynamics and energetics at different atmospheric layers (Siskind et al., 2010; Fuller-Rowell et al., 2010; Funke et al., 2010; Liu et al., 2011; Yuan et al., 2012; Sun and Robinson, 2009; Nath et al., 2016). Changes in the meridional circulation during different phases of SSW event have been recently studied by Tao et al. (2017) and de la Camara et al. (2018). During SSW, the general circulation of the winter stratosphere undergoes significant changes, which, through wave interactions, can be transmitted to the upper atmosphere of both hemispheres.
Koval et al. (2019a) simulated the zonal-mean Eulerian meridional circulation and its changes during SSW events. It was shown that the global-scale Eulerian mean meridional circulation in the middle atmosphere varies significantly at different stages of SSW, which is essential for the transport of mass and tracers in the middle and upper atmosphere. However, as stated above, the net transport of gas species should include contributions of wave-induced eddy fluxes and requires RMC calculating.
In this study, we extend studies by Koval et al. (2019a) to calculate the RMC components based on the simulated wind and temperature fields for the boreal winter season. Changes in the RMC and eddy circulation during composite SSW events are studied up to the altitudes of the lower thermosphere using the atmospheric circulation model MUAM. Statistically significant ensemble results for altitudes up to the mesosphere and lower thermosphere (MLT) are obtained. The study of the RMC also makes it possible to calculate residual meridional mass fluxes and estimate changes in adiabatic heating or cooling rates at different SSW stages in the middle and upper atmosphere.
In order to study the changes in the RMC at time intervals before, during and after simulated SSW events, the middle and upper atmosphere model (MUAM) is used to describe the general circulation at altitudes up to the lower thermosphere (Pogoreltsev et al., 2007). It is a 3-D nonlinear mechanistic numerical model. The horizontal grid steps of the model are 5.625∘ in longitude and 5∘ in latitude. The vertical grid has 48 nodes from the ground to 135 km along the log-isobaric coordinate , where p0 is the surface pressure and H=7 km is the pressure scale height. The MUAM is based on a standard set of primitive equations in the spherical coordinates used in the Cologne Model of the Middle Atmosphere – Leipzig Institute for Meteorology (COMMA-LIM) described by Fröhlich et al. (2003). A detailed description of the MUAM and processes implemented into the model are presented by Gavrilov et al. (2005) and Pogoreltsev et al. (2007). Details of the numerical experiments and used methods for determining the dates of SSW onset are similar to those described by Koval et al. (2019a).
According to the downward control principle, an important driving force of the atmospheric meridional circulation are planetary-scale waves and gravity waves (Haynes et al., 1991; Holton et al., 1995). The MUAM model reproduces spectra of global-scale and mesoscale wave disturbances (Pogoreltsev et al., 2014; Gavrilov et al., 2015, 2018) as well as atmospheric tides (Suvorova and Pogoreltsev, 2011). The amplitudes of stationary planetary waves (SPWs) at the lower boundary are calculated from the geopotential height distributions in the lower atmosphere obtained from reanalysis of meteorological information from the UK Met Office (Swinbank and O'Neill, 1994) and averaged over the years 1992–2011 for January. In addition, MUAM involves parameterization of westward travelling atmospheric normal modes (NMs) by adding terms to the heat balance equation in the troposphere, which have forms of time-dependent sinusoidal components with zonal wavenumbers m = 1–3. For setting the latitude structures of NM components, the parameterization uses respective Hough functions. Periods of NMs are equal to the resonant periods of atmospheric reaction to the wave forcing at lower boundary (Pogoreltsev et al., 2009). The model also includes parameterizations of the dynamic and thermal effects of stationary orographic gravity waves developed by Gavrilov and Koval (2013) and of nonorographic gravity waves (GWs). For the nonorographic GWs having phase speeds of 5–30 m s−1, a parameterization based on Lindzen's (Lindzen, 1981) is applied. For the faster GWs (30–125 m s−1) a version of the spectral parameterization (Yigit and Medvedev, 2009) is used. This parameterization uses 15 GW spectral components uniformly distributed within the period range from 40 min to 3 h. Estimations by Pogoreltsev et al. (2007) and Gavrilov et al. (2015) showed that the MUAM satisfactorily reproduces the structure of atmospheric circulation up to the altitudes of the lower thermosphere.
To improve the statistical significance and smooth out the interannual variability in the MUAM, an ensemble of 24 model runs was obtained and 19 runs containing stratospheric warming events for January–February were selected using the methodology described by Gavrilov et al. (2018). Different MUAM runs correspond to different phases of vacillations between the mean wind and SPWs in the middle atmosphere. These phases in the MUAM are controlled by changing the date of triggering daily variations in the solar heating and generation of normal atmospheric modes in different ensemble members of model runs (Pogoreltsev et al., 2007, 2009).
The onset dates of the simulated SSWs were obtained using the definition by Charlton and Polvani (2007). However zonal wind reversals at every MUAM run were frequently detected not at the pressure level of 10 hPa (near 30 km altitude), but at higher altitudes of up to 50 km (Gavrilov et al., 2018). Savenkova et al. (2017) investigated SSWs using MERRA-2 reanalysis data (Gelaro et al., 2017) for the years 1980–2016. They showed that nearly half of the warmings were accompanied by a reversal of the zonal wind above the 10 hPa pressure level. Such warmings cannot be treated as major SSWs according to the definition by the WMO and the term “high stratospheric warmings” (HSWs) was introduced to denote them. Types of the reproduced SSW events may be different for different MUAM runs. A set of 19 simulated warming events contains five major SSWs, seven HSWs and seven minor SSWs.
Figure 1 shows examples of SSW events simulated with the MUAM for different phases of stratospheric vacillations. Shaded areas in the left and right panels are the zonal-mean temperature averaged over latitude band 82–87∘ N and the zonal-mean zonal wind, respectively. Zero time in Fig. 1 corresponds to the onset day of simulated SSW. The panels (a)–(d) of Fig. 1 correspond, respectively, to typical cases of major SSW, HSW, minor SSW and a MUAM run without stratospheric warming. An interesting feature of the left panels of Fig. 1 is the downward shift of the stratopause during SSWs and its return to higher altitudes after simulated SSWs. This effect is more pronounced for the stronger major SSW in the left panel of Fig. 1a, where one can observe a so-called “elevated stratopause” after an SSW. Similar behaviour of the stratopause was obtained in simulations with the Whole Atmosphere Community Climate Model (Chandran et al., 2013). Other examples of temperature and wind variations during SSW events simulated with the MUAM can be found in Fig. 1 of the paper by Koval et al. (2019b) and Fig. 1 in Gavrilov et al. (2018).
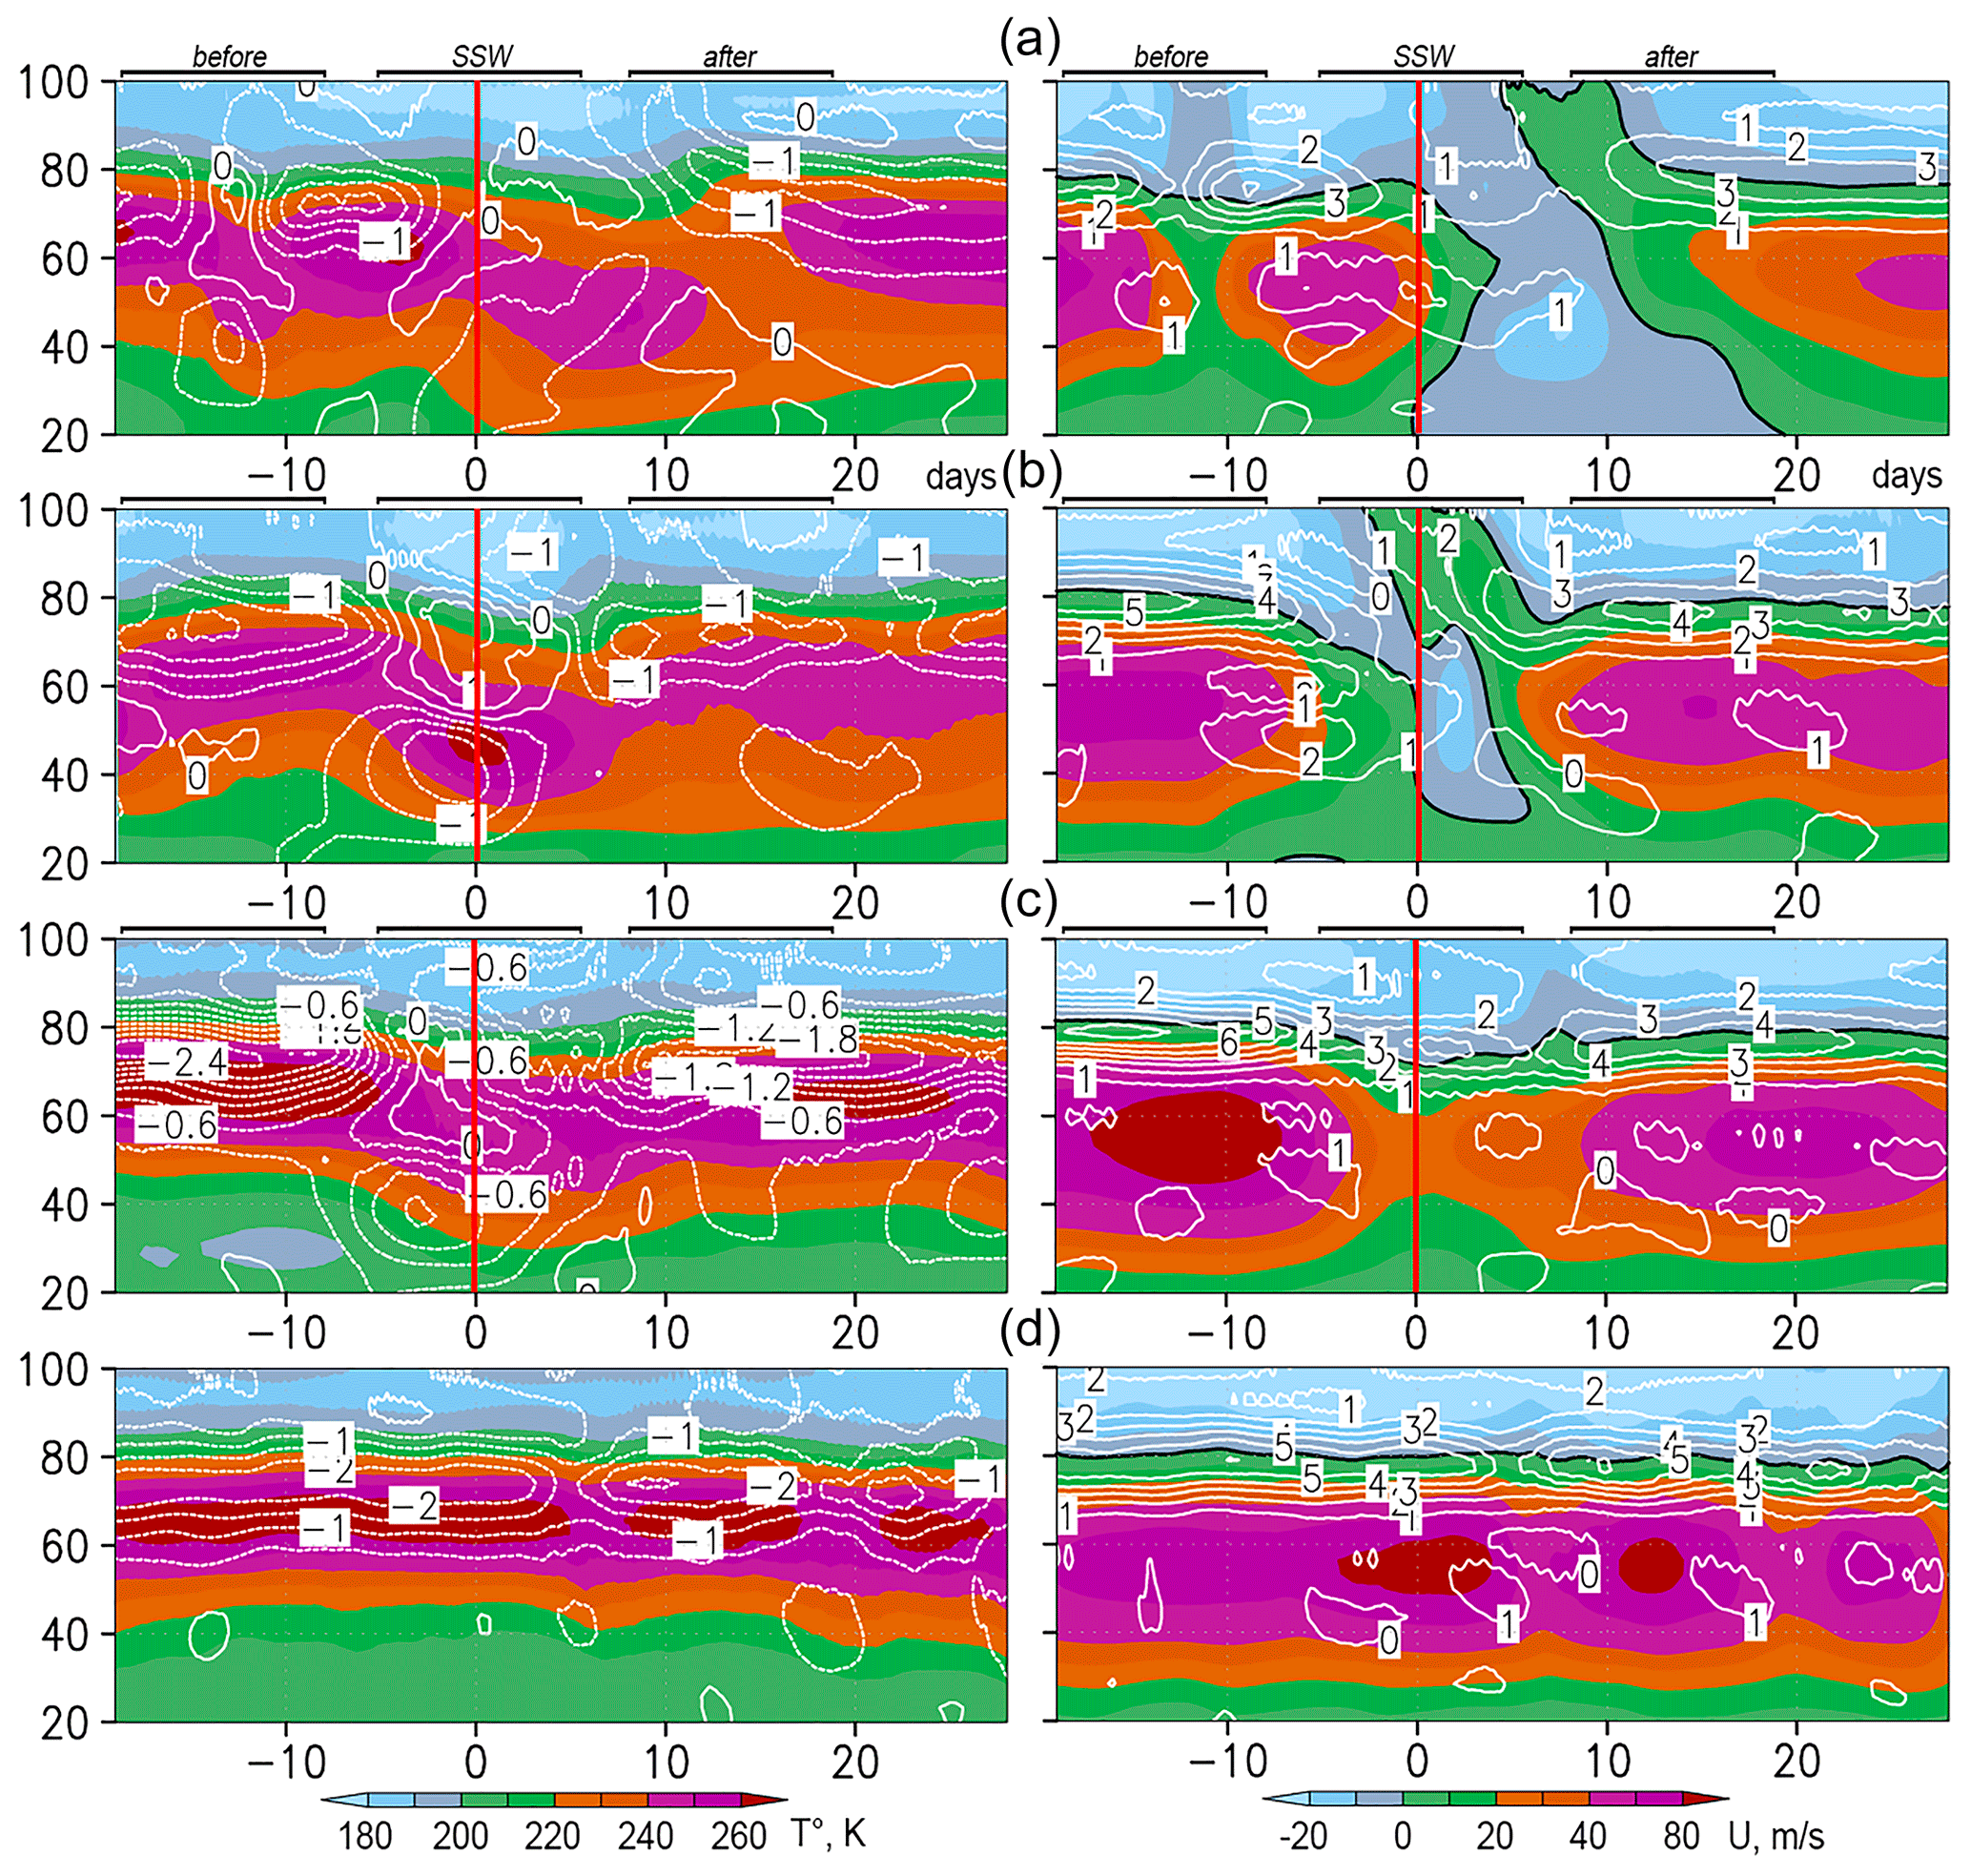
Figure 1Examples of simulated zonal-mean temperature in K averaged over a latitudinal band of 82–87∘ N (shaded left) and zonal-mean zonal wind in m s−1 at 62∘ N (shaded right) for MUAM runs with different phases of stratospheric vacillations. Panels (a)–(d) show, respectively, major SSW, HSW, minor SSW and a MUAM run without stratospheric warming. Contours show residual vertical velocity in cm s−1 (left) and residual meridional velocity in m s−1 (right) at respective latitudes (dashed contours refer to negative values). Zero days correspond to the respective SSW onset dates. Horizontal lines above the plots show time intervals before, during and after SSW.
In the present study, the onset date for each simulated SSW event was determined and three 11 d consecutive intervals were selected before, during and after the event. These intervals are indicated with horizontal lines above the panels in Fig. 1. After averaging over these intervals and over all simulated SSWs, this approach allowed us to obtain characteristics for a composite SSW event statistically relevant to the SSW climatology obtained by analysing multi-year reanalysis data and described by Savenkova et al. (2017).
Residual circulation in this study is understood in the context of the transformed Eulerian mean approach (Andrews et al., 1987). The meridional and vertical components of the RMC within the TEM approach can be calculated by the formulas described by Andrews et al. (1987) and Butchart (2014):
where the overbars denote the zonal-mean values; the dashes indicate the deviations of hydrodynamic quantities from their zonal-mean values , ; v and w are the meridional and vertical components of wind, ρ is background atmospheric density, z is the vertical log-isobaric coordinate, θ is the potential temperature, φ is latitude, and a is the Earth's radius. After some calculus, one can rewrite Eqs. (1) and (2) in the convenient form used in this study for calculating the meridional and vertical components of the residual mean circulation from the wind and temperature fields simulated with the MUAM:
In contrast to the zonal-mean Eulerian circulation (having velocity components and ), the residual vertical velocity is proportional to the net rate of diabatic heating. It roughly represents a diabatic circulation in the meridional plane (Shepherd, 2007), i.e. when the heating of ascending air parcels and the cooling of descending air take place, while their potential temperature adapts to the local environment. Thus, the time-averaged RMC approximates the average movement of air masses and, therefore, it can be considered as transport of conservative atmospheric tracers.
Figure 2 shows a comparison of RMC wind vectors simulated with the MUAM (a) and with those obtained from the database of meteorological reanalysis MERRA-2 (Gelaro et al., 2017) for the year 2010 (b). The arrows in Fig. 2 show two main RMC cells with an upwelling at low and middle latitudes of the Southern Hemisphere and downwelling at high latitudes of both hemispheres. The Eulerian mean meridional circulation in the troposphere and stratosphere should usually consist of tropical Hadley cells controlled by diabatic heating, eddy-induced mid-latitude Ferrel cells and polar cells generated by temperature gradients (e.g. Holton, 2004). In contrast to that, the residual circulation should consist of two Hadley cells transporting air masses from low to high latitudes (Butchart, 2014), which are visible in Fig. 2. At the same time, in the winter (Northern) hemisphere, the circulation cell is much wider than that in the summer (Southern) hemisphere with higher residual meridional and vertical velocities shown in Fig. 2.
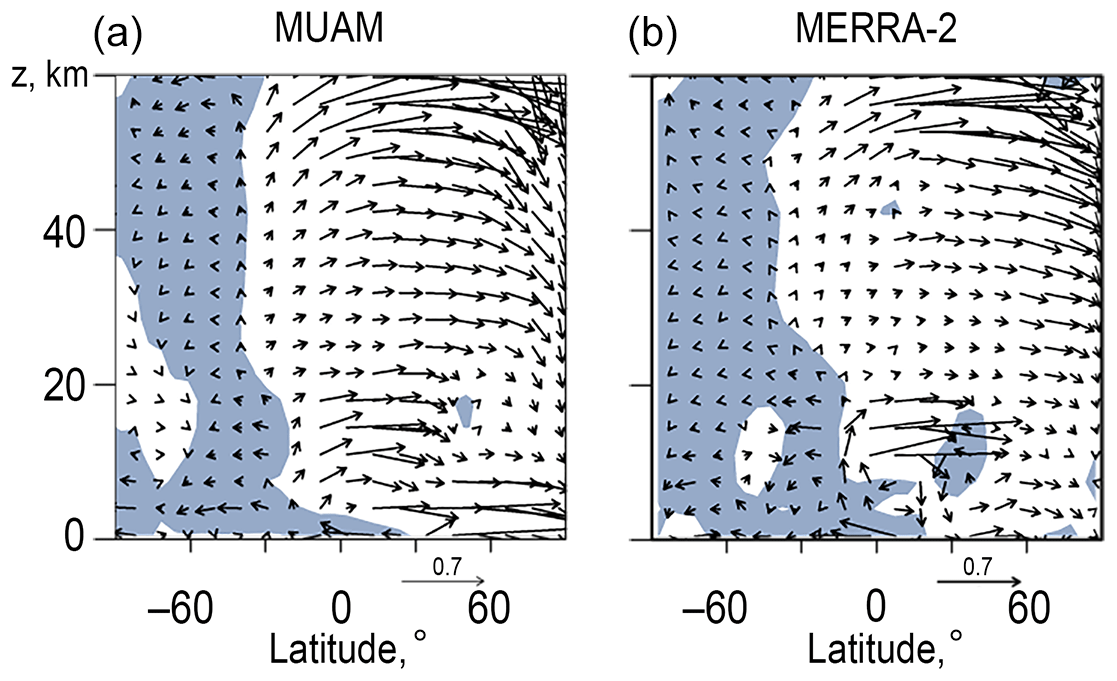
Figure 2Latitude–altitude distributions of the RMC wind vectors averaged over 19 MUAM runs (a) and according to the MERRA-2 reanalysis data (b) for January. Areas with negative (southward) residual meridional wind are shaded with the grey-blue colour. The vectors are shown for the vertical velocity multiplied by a factor of 100.
Comparisons of Fig. 2a and b show a correlation between the structure of the simulated RMC and that obtained from the reanalysis data. Some differences in the wind vectors in the upper troposphere can be connected with rather schematic representation of the tropospheric dynamics in the model. Birner and Bönisch (2011) calculated the RMC based on the data from the Canadian Middle Atmosphere Model and obtained streamline distributions for January, which reflect the RMC structure shown in Fig. 2a. Eluszkiewicz et al. (1996) analysed the RMC using modelling and observations with the Microwave Limb Sounder onboard the Upper Atmosphere Research Satellite. They presented the distributions of the vertical and meridional wind components, which are consistent with our Fig. 2a. The RMC structure shown in Fig. 2 is also in agreement with that obtained by Gille et al. (1987) and Kobayashi and Iwasaki (2016). The latter study presents the RMC fields for winter in the Northern Hemisphere obtained with the data from the Limb Infrared Monitor of the Stratosphere on the Nimbus-7 satellite and from the JRA-55 reanalysis data (Kobayashi et al., 2015).
Studies of the evolution of hydrodynamic fields during SSW events have limitations due to relatively large time spacing of meteorological observations (several hours) and due to difficulties estimating vertical velocity from meteorological data. Numerical modelling can help to overcome these difficulties. Also, using mechanistic numerical models enables one to perform a series of model runs for the same climatological conditions to increase statistical confidence of obtained results. In addition, numeric modelling allows us to study RMC changes during SSW rectified from superimposing other extreme events, which could exist in experimental data.
In this section, we observe the changes in RMC at altitudes of 0–100 km during different stages of the composite SSW event (averaged over 19 model runs) simulated with the MUAM. Residual velocity components are calculated applying Eqs. (3) and (4) to the wind and temperature fields obtained at each MUAM run. Then these characteristics are averaged over 19 model runs, separately, for 11 d intervals “before”, “during” and “after” SSW (see Sect. 2).
Figure 3a shows the distributions of the simulated with the MUAM residual meridional and vertical velocities averaged over 11 d intervals before the composite SSWs. Top and bottom panels of Fig. 3a correspond to the main cells of the RMC; its general structure is presented in Fig. 2. Also, the RMC structure is consistent with the current knowledge (e.g. Tegtmeier et al., 2008). The main maximums of the residual meridional velocity in Fig. 3a1 exist at altitudes of 40–50 and 70–90 km. They form downward residual flows in the Northern Hemisphere and upward flows in the Southern Hemisphere in Fig. 3a2, which contribute to the warming of the atmosphere near the North Pole and cooling near the South Pole in January due to adiabatic temperature changes inside vertically moving atmospheric parcels.
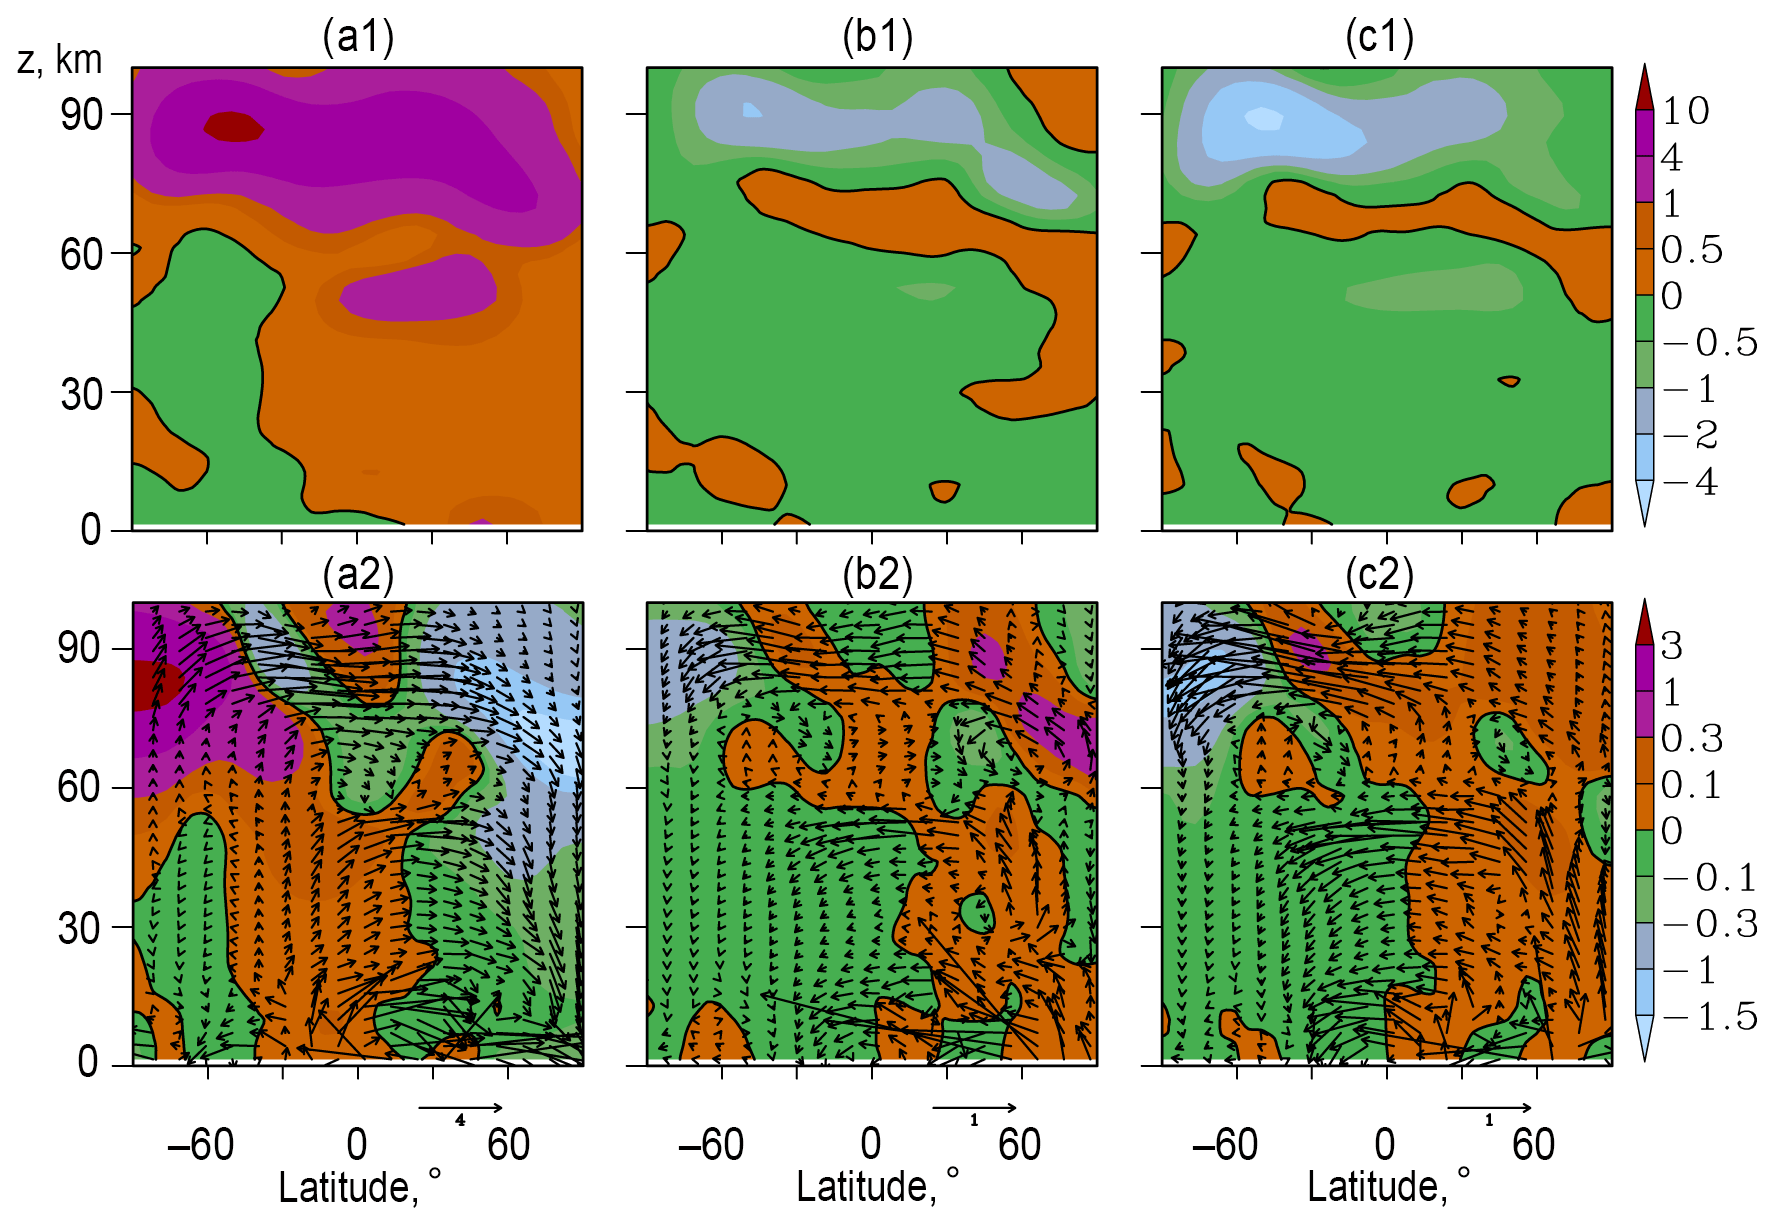
Figure 3Zonal-mean residual meridional velocity in m s−1 (a1) and vertical velocity in cm s−1 (a2) averaged over 19 MUAM runs for 11 d intervals before the composite SSW and add-ons of respective quantities at the time intervals during SSW (b) and after SSW (c). Arrows show vectors with components and in kg m−2 s−1, which schematically represent zonal-mean RMC mass fluxes and their respective add-ons, where is a scale factor used for better schematic representation at high altitudes. Solid contours correspond to zero values. All SSW events are observed in January–February.
Figure 3b and c represent add-ons of the residual velocity components during and after the composite SSW relative to the distributions before the event in Fig. 3a. The hypothesis of nonzero differences in Fig. 3b and c was verified with the statistical paired Student's t-test (e.g. Rice, 2006). At each latitude–height grid point, the data in Fig. 3b and c is averaged over individual differences (11 d with 4 h outputs for 19 model runs). The paired Student's t-test gave statistical confidence of nonzero differences larger than 95 % for almost all values shown in Fig. 3b and c.
Figure 3b1 and b2 demonstrate signs of the add-ons to the residual velocity components, which are generally opposite to the signs of meridional and vertical residual velocities in Fig. 3a1 and a2 and correspond to general RMC weakening (up to 30 %) during the SSW. However, Fig. 3b1 demonstrates positive add-ons to the residual meridional velocity at high northern latitudes at heights of 20–70 km. They increase transport of heat to the polar regions and form negative add-ons to the background downward vertical velocity at altitudes of 20–50 km and positive add-ons at altitudes ranging from 50 to 100 km at high northern latitudes in Fig. 3b2. In Fig. 1 the contours are shown indicating residual vertical and meridional velocities (in the left and right panels, respectively) at high northern latitudes for specific MUAM runs, which generally confirm the above-mentioned behaviour of average distributions shown in Fig. 3b. During SSW, magnitudes of downward and upward residual vertical velocities near the North Pole can reach ∼ 1–2 cm s−1 in Fig. 1. Similar orders of magnitude during SSW were obtained for specific runs of the WACCM numerical model in Fig. 1 of the paper by Chandran et al. (2013). Downward flows at altitudes of 20–60 km near the North Pole during SSW can move the warm stratopause down with a speed up to 1–2 km d−1 in Fig. 3b2. In addition, vertical displacements of air parcels produce adiabatic heating or cooling, the specific rate of which is proportional to the residual vertical velocity (e.g. Gavrilov et al., 2020):
where g is the acceleration due to gravity and cp is the specific heat capacity of air at constant pressure, which corresponds to ∼ 10–20 K d−1. During several days, such a mechanism can provide heating up to several tens of degrees in the polar stratosphere at altitudes of 20–50 km in the region of negative in Fig. 3b2 and comparable cooling in the region of positive at altitudes of 50–80 km. Such adiabatic cooling of the mesosphere and heating of the stratosphere can help to the downward shift of the stratopause during SSW, which can be seen in the left panels of Fig. 1.
Figure 3c1 and c2 reveal that after SSW, add-ons of residual meridional and vertical velocity have signs generally opposite to the RMC before SSW in Fig. 3a1 and a2, respectively. Similar weakening of the mean Eulerian global meridional circulation was shown in Fig. 3 of the paper by Koval et al. (2019a). At polar northern latitudes below 50 km, the add-ons to the residual meridional velocity are directed to the south and the vertical velocity add-ons are strong and directed upwards. The region of the positive residual meridional velocity add-ons at altitudes of 60–70 km remains after SSW in Fig. 3c1 and corresponds to downward add-ons to the vertical velocity at altitudes of 45–60 km in the northern polar region in Fig. 3c2. Such behaviour of RMC corresponds to evolutions of residual meridional and vertical components after SSW in Fig. 1. In the northern polar region,
strong upward below 40–50 km and strong downward above this layer create, respectively, fast upward transport and strong adiabatic cooling of the stratosphere and heating of the mesosphere restoring the stratopause heights in Fig. 1. Considerations of Fig. 1 and similar figures from the paper by Chandran et al. (2013) allow us to conclude that downward winds above altitudes 40–50 may be stronger after major SSW. This may create increased heating of the mesosphere and upper stratosphere leading to effects of elevated polar stratopause after strong SSW (Chandran et al., 2013). An example of such increased heating at altitudes above 50 km can see in the left panel of Fig. 1a.
In the Southern Hemisphere, the main differences in RMC during and after simulated SSWs are demonstrated in Fig. 3b and c at the MLT altitudes. These differences have signs generally opposite to the respective velocities shown in Fig. 3a before SSWs. Absolute values of the differences at altitudes near 90 km are larger after SSW (Fig. 3c) than those during SSW (Fig. 3b). This determines weakening of the northward residual meridional velocity at altitudes of 80–100 km in the mid-latitude Southern Hemisphere up to 25 %–30 % during the composite SSW and up to 30 %–40 % after SSW compared to that before the warming event in Fig. 3a1. Respective decreases in the upward residual vertical velocity are demonstrated in Fig. 3b2 and c2 at altitudes of 80–100 km in the Southern Hemisphere. These changes may be produced by the inter-hemispheric coupling at the MLT heights caused by SPWs. These waves propagate upward from the troposphere through the circulation structures of the winter middle atmosphere (e.g. Charney and Drazin, 1961). Above the stratospheric heights, SPWs propagate along the waveguides, which span to both hemispheres at altitudes above 60–70 km (e.g. Koval et al., 2019b). Gavrilov et al. (2018) showed that in the stratosphere below 50 km, amplitudes of SPW1 with zonal wavenumber m=1 are increased before simulated SSWs and decreased during the events, while changes in SPW2 amplitudes are opposite. The modified SPWs in the northern stratosphere before and during SSW (Stray et al., 2015; Gavrilov et al., 2018) can then propagate along the waveguides to the southern upper atmosphere. Laskar et al. (2019) showed similar significant weakening (up to a reversal) of both the mean and residual meridional circulation at MLT heights during SSW observed in the winters of 2009/10 and 2012/13, causing temperature fluctuations in the stratosphere of both hemispheres. Larger velocity add-ons in the southern MLT region after SSW in Fig. 3c compared to those during SSW in Fig. 3b may reflect time delay for SPW propagation from the Northern to the Southern Hemisphere. In addition, simulated RMC velocity add-ons after SSWs could be partly produced by seasonal changes in the global circulation, as far as time intervals after SSW have a 3-week time shift compared to respective intervals before SSW.
Recently, several studies have been devoted to the analysis of the peculiarities of the RMC formation and development during SSW events. Using data from the reanalysis of meteorological information, Song and Chun (2016) considered the contributions of various terms of the transformed Eulerian equations of temperature and angular momentum to the RMC formation at different SSW stages. Bal et al. (2017) studied the changes in the RMC based on the analysis of 76 model SSWs and of 17 major SSWs selected from the ERA-Interim reanalysis data. In both studies mentioned above, it was confirmed that large-scale wave disturbances are the main driving force of the RMC due to the transfer of energy and angular momentum in the middle atmosphere and the MLT region.
Increased downward residual vertical velocities at altitudes of 20–60 km at high northern latitudes during SSWs in Fig. 3b1 correspond to the increased net downward mass flows and to an increased adiabatic heating rate (Eq. 5) in the heat balance equation of the model. This may help to heat the polar stratosphere. Therefore, changes in the RMC may influence the mechanisms of SSW formation at high latitudes.
RMC can create zonal-mean fluxes of mass in meridional plane, which can provide substantial global-scale transport of heat and conservative tracers in the atmosphere (e.g. Fishman and Crutzen, 1978). The meridional, , and vertical, , components of residual mass fluxes can be calculated by multiplying the atmospheric density by the residual meridional and vertical velocities, respectively, at each grid node as follows:
where corresponds to the meridional and vertical components, respectively; p0 is the pressure at the ground (at h=0); R is the gas constant for dry air; and T and h are the temperature and geopotential height simulated with the MUAM at each grid node.
Arrows in Fig. 3a2 show schematic vectors representing zonal-mean RMC mass flux (Eq. 6) averaged over 11 d intervals before the composite SSW. In the stratosphere, these arrows correspond to RMC cells shown in Fig. 3a and show tropical upwelling and extratropical downwelling with maximum meridional velocity at altitudes of 40–50 km of the winter hemisphere. At altitudes above 50 km, the RMC mass transport is directed from high latitudes of the summer hemisphere to high latitudes of the winter hemisphere having a maximum meridional component at altitudes of 80–90 km in Fig. 3a2. Both RMC cells produce downward mass fluxes at the middle and high latitudes of the winter hemisphere, which are maximized at altitudes of 70–80 km near the North Pole in Fig. 3a2 and can significantly influence thermal regime and transport of conservative tracers in the middle and high atmosphere.
Arrows in Fig. 3b2 show add-ons and to the zonal-mean residual mass fluxes during simulated SSWs, which are averaged over 19 MUAM runs. The directions of the arrows in Fig. 3b2 are generally opposite to those in Fig. 3a2 showing that RMC mass fluxes become generally smaller during simulated SSWs, which corresponds to the changes in RMC velocity components shown with colours in Fig. 3b. However, at altitudes of 60–80 km at middle northern latitudes, the arrows in Fig. 3b2 have the same directions as those in Fig. 3a2 increasing northward mass fluxes during SSW. This increase in the RMC meridional component corresponds to negative at altitudes of 20–50 km and positive at altitudes of 50–70 km near the North Pole, which increase downward fluxes below 50 km and may form upward fluxes above 40–50 km during strong SSW at polar regions as is shown in Fig. 1. As was discussed in the previous section, respective advection of heat and adiabatic heating below 50 km and cooling above may form a downward shift of the stratopause during SSW (see Fig. 1).
Arrows in Fig. 3c2 show add-ons to the zonal-mean residual mass fluxes after simulated SSWs, which have directions generally opposite to the arrows in Fig. 3a2 before SSW and denote weakening the global RMC mass transport. Near the North Pole, Fig. 3c2 reveals positive at altitudes below 40 km and negative at altitude ranging from 40 to 60 km, which produce additional adiabatic cooling in the stratosphere and heating in the mesosphere helping to restore the stratopause height after SSW (see Fig. 1 and Sect. 4). After strong SSWs, downward mass fluxes above an altitude of 40 km may intensify and respective adiabatic heating may help in forming effects of elevated stratopause (Chandran et al., 2013).
In the Southern Hemisphere, the main add-ons and in Fig. 3b2 and c2 exist at altitudes above 70 km and are stronger after SSW. They have directions opposite to the mass fluxes of Fig. 3a2, which corresponds to weakening of the global RMC. One of the reasons for these changes could be propagation of SPW from the Northern Hemisphere along the waveguides crossing the Equator at altitudes above 60–70 km (Gavrilov et al., 2018; Koval et al., 2019b).
Studies of the global transport of mass with RMC are important for estimating respective transport of conservative aerosol and gas species, which are responsible for the climate changes. One such gas is ozone. Estimations of the photochemical lifetime of atmospheric ozone (Jacob, 1999) give values longer than a month at altitudes lower than 30 km. Therefore, at low altitudes, ozone fluxes may follow the RMC mass fluxes considered in this section. At higher altitudes, interactive models of atmospheric chemistry and dynamics are required for proper description of atmospheric ozone.
Differences between the residual and Eulerian zonal-mean velocity components and describe so-called eddy circulation, which give contributions of non-zonal motions produced mainly by planetary waves (Andrews et al., 1987).
Figure 4a1 and a2 reveal, respectively, meridional and vertical components of the wave-induced eddy circulation before the composite SSW. Figure 4a2 shows that atmospheric waves produce strong upward flows at middle latitudes of the Northern Hemisphere, which enhance northward winds at high latitudes with a maximum at altitudes of 40–50 km in Fig. 4a1 and enhance downward flows near the North Pole. This is consistent with the existing theory (Andrews et al., 1987; Butchart, 2014). Areas of eddy-induced flows are produced by the SPWs propagating upward from the northern troposphere along the waveguides (e.g. Dickinson, 1968; Gavrilov et al., 2018). These waveguides expand to the summer hemisphere above the stratospheric heights, leading to SPW propagation there and production of substantial eddy velocity components in the Southern Hemisphere in Fig. 4a. This eddy contribution is directed generally opposite to the Eulerian mean circulation (see Fig. 3a in Koval et al., 2019a) in the stratosphere and is co-directional in the MLT region. Peak values of eddy components in Fig. 4a may substantially exceed the residual components in the respective atmospheric regions in Fig. 3a. This reveals substantial compensation of eddy flows by the Eulerian zonal-mean circulation. However, residual meridional and vertical velocity components in Fig. 3a demonstrate the main features of eddy components shown in Fig. 4a, which shows that the wave-induced eddy circulation may substantially influence RMC.
In Fig. 4a2 in the Northern Hemisphere, the wave-induced eddy upward vertical velocity have maxima at middle latitudes at altitudes above 20 km, which corresponds to the northward meridional velocity in Fig. 4a1 at high latitudes and to enhanced downward flows near the North Pole. Figure 4b2 shows that during simulated SSWs the region of strong upward eddy vertical velocities is shifted to higher northern latitudes. This shift produces negative add-ons of meridional velocity in Fig. 4b1 at latitudes lower 60–70∘ N, which are generally opposite to the RMC meridional velocity in Fig. 3a1. However, the latitudinal shift of eddy upward fluxes in Fig. 4b2 enhances northward eddy meridional velocities near the North Pole in Fig. 4b1, which form enhanced eddy downward flows at altitudes below 60 km and upward flows above 60 km near the North Pole during SSW in Fig. 4b2. Meridional eddy add-ons in Fig. 4b1 have positive values at altitudes of 60–70 km, which can be associated with the respective region of positive add-ons of residual meridional velocity during SSW in Fig. 3b1. Figure 4c2 shows that after SSW, the region of maximum positive add-ons of eddy vertical velocity shifts northward to polar latitudes. It produces strong upward transport and adiabatic cooling at altitudes below 50–60 km, which tends to recover stratospheric temperature and stratopause height in polar regions (see discussions in Sects. 4 and 5).
At the middle latitudes of the Southern Hemisphere at altitudes above 60 km one can see a region of positive add-ons of eddy vertical velocity during and after SSW in Fig. 4b2 and c2, which becomes stronger after SSW and corresponds to respective add-ons of eddy meridional velocity in Fig. 4b1 and c1. This may confirm that propagation of planetary waves from the northern winter stratosphere along waveguides extending to the summer hemisphere at altitudes above 60 km may modify eddy and residual circulation in the MLT region of the Southern Hemisphere. Figures 3 and 4 show differences in residual and eddy meridional and vertical velocities during and after SSW compared those before the event at altitudes below 60 km. However, these differences are small and can be connected with seasonal changes in the velocity components because the time intervals before SSW and after SSW are separated by about three weeks.
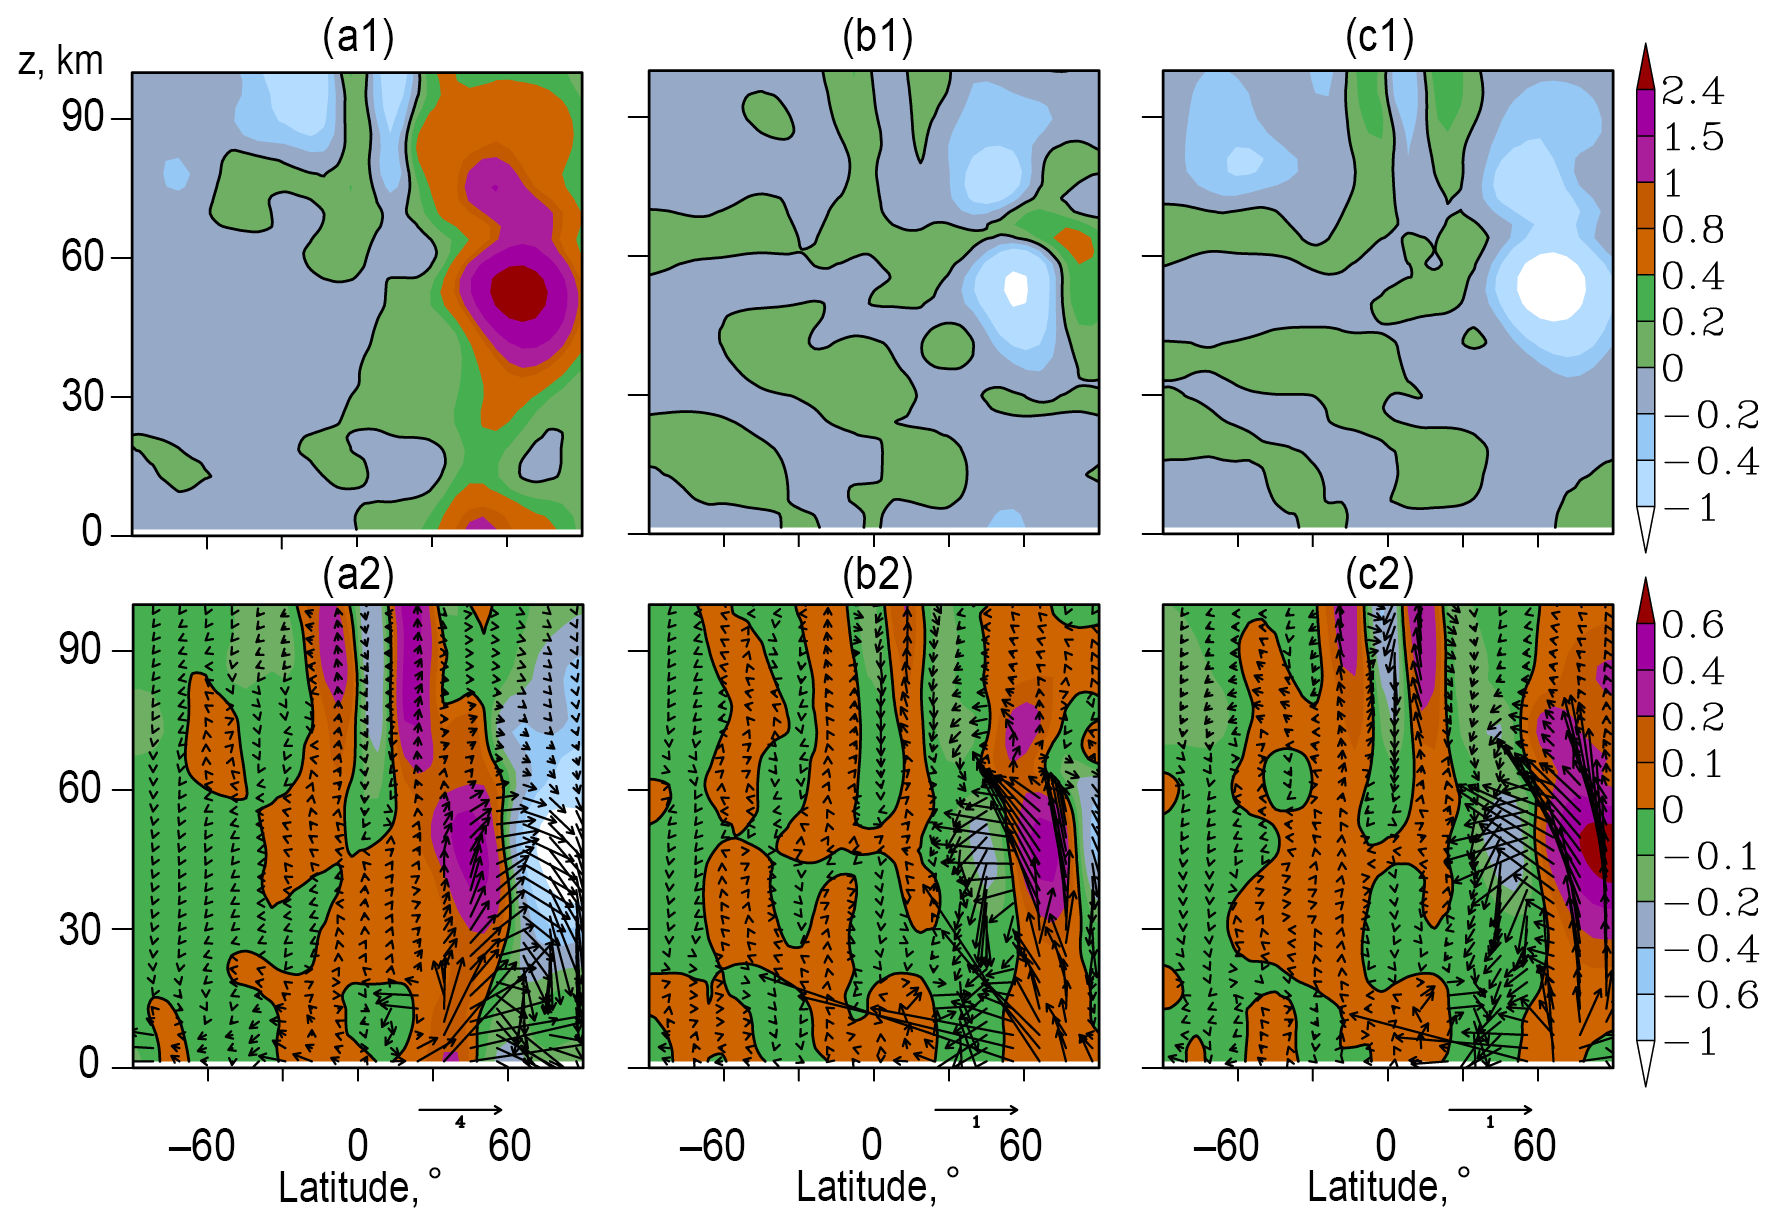
Figure 4The same as Fig. 3 but for the meridional and vertical components of the wave-induced eddy circulation.
Arrows in the bottom panels of Fig. 4 represent schematic vectors of zonal-mean eddy mass fluxes calculated using Eq. (6) and replacing by eddy velocity components . These arrows visualize all peculiarities of evolution of eddy circulation at different stages of the composite SSW. Contributions of the wave-induced eddy circulation lead in general to weakening of the residual mass fluxes in the northern stratosphere. Similar results were discussed by Garny et al. (2014), who showed that eddy components may cause recirculation of air in the stratosphere, and may increase the mean age of air, which is equivalent to deceleration of the Eulerian zonal-mean circulation by the eddy circulation.
General similarity of variations of residual and eddy velocity components and mass fluxes in Figs. 3 and 4 at different stages of the simulated SSWs demonstrate that non-zonal global-scale wave motions can produce changes in the eddy and residual circulation. These changes are important for developing stratospheric warming events and for the transport of mass and conservative tracers in the middle and upper atmosphere.
In the present study, estimations of the residual mean meridional circulation are performed using temperature and wind fields obtained from a set of numerical simulations of the atmospheric general circulation with the MUAM model. The focus is on changes of the RMC and corresponding fluxes of atmospheric mass at different stages of simulated SSW events. To achieve sufficient statistical significance, the results of numerical simulations are averaged over 19 member ensembles of the MUAM runs having SSW events. Similarities exist between the RMC simulated with the MUAM and that obtained from the MERRA-2 reanalysis database, and with the results of other models as well.
The changes in the RMC at altitudes of 0–100 km at different stages of the composite SSW event are simulated. Before SSWs in the Northern Hemisphere, the RMC with northward meridional and downward vertical velocities dominates in the middle and upper atmosphere. Downward flows are maximum at high latitudes. During and after the composite SSW, general deceleration of downward vertical flows at the middle northern latitudes slow down northward RMC in most of the analysed altitude regions. Decreases in the residual meridional velocity at MLT heights may reach up to 30 % in the Northern Hemisphere and up to 40 % in the Southern Hemisphere during and after simulated SSWs. However, the situation is different at high latitudes of the Northern (winter) Hemisphere. During the composite SSW at latitudes higher than 60∘ N and altitudes of about 20–70 km, northward add-ons to the residual meridional velocity produce increased downward flows at altitudes below 45–50 km and upward flows at higher altitudes near the North Pole. Increased downward flows produce the respective transport of heat. In addition, downward and upward flows may create adiabatic heating below 45–50 km altitude and adiabatic cooling above it helping downward shift of the polar stratopause during the composite SSW. After SSW, add-ons to the residual vertical velocity near the North Pole are positive at altitudes below 40–50 km and negative above 50 km. They produce additional cooling of the stratosphere and heating of the mesosphere, helping to restore the height of the stratopause at polar latitudes.
The wave-induced eddy circulation, which is the difference between the residual and Eulerian zonal-mean circulations, exhibits properties similar to those described above. Changes of RMC at high northern latitudes can be connected with the wave-induced zone of upward vertical flows in the stratosphere and mesosphere, which is located at latitudes 30–50∘ N before the composite SSW, at 50–70∘ N during SSW and 60–90∘ N after SSW. RMC changes in the MLT region of the Southern Hemisphere may be produced by planetary waves modified by SSW and propagating from the Northern Hemisphere along waveguides, which cross the Equator at altitudes above 60 km.
Our simulations showed that changes in RMC velocity components during SSW produce respective changes in the eddy and residual global-scale fluxes of atmospheric mass and heat, which can lead to variations in concentration of conservative aerosol and gas species, and can substantially influence the thermal regime and composition of the middle and upper atmosphere.
In accordance with statement 1296 of the Civil Code of the Russian Federation, the Russian State Hydrometeorological University (RSHU) has all rights to the MUAM code. To access and use the computer codes one should obtain permission from the Rector of RSHU via 79 Voronezhskaya Street, 192007 St. Petersburg, Russia, phone: 007 (812) 372-50-92. The authors can assist in obtaining the permission.
The data and programmes utilized in this article can be obtained upon request from Andrey V. Koval (a.v.koval@spbu.ru).
AVK developed software packages for calculating the RMC, provided general management of the studies and formed a draft of the manuscript. ANY and KAD performed model simulations. TSE compared the data obtained with the reanalysis database. NMG and AIP supervised the setting of numerical experiments with the MUAM. ONT participated in statistical data processing. ASZ calculated and analysed fluxes of mass. CW and KW contributed to the interpretation of mass fluxes data and revising the manuscript. All participants took part in the preparation of the final version of the article.
The authors declare that they have no conflict of interest.
We thank the Russian Science Foundation and the National Natural Science Foundation of China for financial support.
This research has been supported by the Russian Science Foundation (grant no. 20-77-10006), the Russian Foundation for Basic Research (grant no. 20-55-53039), and the National Natural Science Foundation of China (grant no. 42011530082).
This paper was edited by Petr Pisoft and reviewed by three anonymous referees.
Andrews, D. G. and McIntyre, M. E.: Planetary waves in horizontal and vertical shear: The generalized Eliassen–Palm relation and the mean zonal acceleration, J. Atmos. Sci., 33, 2031–2048, 1976.
Andrews, D. G., Holton, J. R., and Leovy, C. B.: Middle Atmosphere Dynamics, Academic Press, Orlando, Florida, USA, 1987.
Bal, S., Schimanke, S., Spangehl, T., and Cubasch, U.: Enhanced residual mean circulation during the evolution of split type sudden stratospheric warming in observations and model simulations, J. Earth Syst. Sci., 127, 68, https://doi.org/10.1007/s12040-018-0972-x, 2017.
Birner, T. and Bönisch, H.: Residual circulation trajectories and transit times into the extratropical lowermost stratosphere, Atmos. Chem. Phys., 11, 817–827, https://doi.org/10.5194/acp-11-817-2011, 2011.
Brewer, A. W.: Evidence for a world circulation provided by measurements of helium and water vapour distribution in the stratosphere, Q. J. Roy. Meteor. Soc., 75, 351–363, https://doi.org/10.1002/qj.49707532603, 1949.
Butchart, N.: The Brewer-Dobson circulation, Rev. Geophys., 52, 157–184, https://doi.org/10.1002/2013RG000448, 2014.
Chandran, A., Collins, R. L., Garcia, R. R., Marsh, D. R., Harvey, V. L., Yue, J., and de la Torre, L.: A climatology of elevated stratopause events in the whole atmosphere community climate model, J. Geophys. Res.-Atmos., 118, 1234–1246, https://doi.org/10.1002/jgrd.50123, 2013.
Charlton, A. J. and Polvani, L. M.: A new look at stratospheric sudden warmings, Part I: Climatology and modelling benchmarks, J. Climate, 20, 449–469, 2007.
Charney, J. G. and Drazin, P. G.: Propagation of planetary-scale disturbances from the lower into the upper atmosphere, J. Geophys. Res., 66, 83–109, 1961.
de la Camara, A., Abalos, M., and Hitchcock, P.: Changes in Stratospheric Transport and Mixing During Sudden Stratospheric Warmings, J. Geophys. Res.-Atmos., 123, 3356–3373, https://doi.org/10.1002/2017JD028007, 2018.
Dickinson, R. E.: Planetary Rossby waves propagating vertically through weak westerly wave guides, J. Atmos. Sci., 25, 984–1002, 1968.
Dobson, G. M. B.: Origin and distribution of polyatomic molecules in the atmosphere, P. Roy. Soc. A-Math. Phy., 236, 187–193, 1956.
Dobson, G. M. B., Harrison, D. N., and Lawrence, J.: Measurements of the amount of ozone in the Earth's atmosphere and its relation to other geophysical conditions, P. Roy. Soc. A-Math. Phy., 122, 456–486, 1929.
Eluszkiewicz, J., Crisp, D., Zurek, R., Elson, L., Fishbein, E., Froidevaux, L., Waters, J., Grainger, R.G., Lambert, A., Harwood, R., and Peckham, G.: Residual circulation in the Stratosphere and lower Mesosphere as diagnosed from Microwave Limb Sounder Data, J. Atmos. Sci., 53. 217–240, 1996.
Eyring, V., Harris, N. R. P., Rex, M., Shepherd, T. G., Fahey, D. W., Amanatidis, G. T., Austin, J., Chipperfield, M. P., Dameris, M., Forster, P. M. De. F., Gettelman, A., Graf, H. F., Nagashima, T., Newman, P. A., Pawson, S., Prather, M. J., Pyle, J. A., Salawitch, R. J., Santer, B. D., and Waugh, D. W.: A Strategy for process-oriented validation of coupled chemistry-climate models, B. Am. Meteorol. Soc., 86, 1117–1133, https://doi.org/10.1175/BAMS-86-8-1117, 2005.
Fishman, J. and Crutzen, P. J.: The origin of ozone in the troposphere, Nature, 274, 855–857, 1978.
Fröhlich, K., Pogoreltsev, A., and Jacobi, C.: Numerical simulation of tides, Rossby and Kelvin waves with the COMMA-LIM model, Adv. Space Res., 32, 863–868, 2003.
Fuller-Rowell, T., Wu, F., Akmaev, R., Fang, T.-W., and Araujo-Pradere, E.: A whole atmosphere model simulation of the impact of a sudden stratospheric warming on thermosphere dynamics and electrodynamics, J. Geophys. Res.-Space, 115, A00G08, https://doi.org/10.1029/2010JA015524, 2010.
Funke, B., Lopez-Puertas, M., Bermejo-Pantaleon, D., Garcia-Comas, M., Stiller, G. P., von Clarmann, T., Kiefer, M., and Linden, A.: Evidence for dynamical coupling from the lower atmosphere to the thermosphere during a major stratospheric warming, Geophys. Res. Lett., 37, L13803, https://doi.org/10.1029/2010GL043619, 2010.
Garny, H., Birner, T., Bönisch, H., and Bunzel, F.: The effects of mixing on age of air, J. Geophys. Res.-Atmos., 119, 7015–7034, https://doi.org/10.1002/2013JD021417, 2014.
Gavrilov, N. M. and Koval, A. V.: Parameterization of mesoscale stationary orographic wave forcing for use in numerical models of atmospheric dynamics, Izvestiya Atmospheric and Ocean Physics, 49, 244–251, 2013.
Gavrilov, N. M., Pogoreltsev, A. I., and Jacobi, C.: Numerical modeling of the effect of latitude-inhomogeneous gravity waves on the circulation of the middle atmosphere, Izv. Atmos. Ocean. Phy+., 41, 9–18, 2005.
Gavrilov, N. M., Koval, A. V., Pogoreltsev, A. I., and Savenkova, E. N.: Simulating influences of QBO phases and orographic gravity wave forcing on planetary waves in the middle atmosphere, Earth Planets Space, 67, 86, https://doi.org/10.1186/s40623-015-0259-2, 2015.
Gavrilov, N. M., Koval, A. V., Pogoreltsev, A. I., and Savenkova, E. N.: Simulating planetary wave propagation to the upper atmosphere during stratospheric warming events at different mountain wave scenarios, Adv. Space Res., 61, 1819–1836, https://doi.org/10.1016/j.asr.2017.08.022, 2018.
Gavrilov, N. M., Kshevetskii, S. P., and Koval, A. V.: Thermal effects of nonlinear acoustic-gravity waves propagating at thermospheric temperatures matching high and low solar activity, J. Atmos. Sol.-Terr. Phy., 208, 105381, https://doi.org/10.1016/j.jastp.2020.105381, 2020.
Gelaro, R., McCarty, W., Suárez, M. J., Todling, R., Molod, A., Takacs, L., Randles, C. A., Darmenov, A., Bosilovich, M. G., Reichle, R., Wargan, K., Coy, L., Cullather, R., Draper, C. A., Akella, S., Buchard, V., Conaty, A., da Silva, A. M., Gu, W., Kim, G.-K., Koster, R., Lucchesi, R., Merkova, D., Nielsen, J. E., Partyka, G., Pawson, S., Putman, W., Rienecker, M., Schubert, S. D., Sienkiewicz, M., and Zhao, B.: The Modern-Era Retrospective Analysis for Research and Applications, version 2 (MERRA-2), J. Climate. 30, 5419–5454, https://doi.org/10.1175/JCLI-D-16-0758.1, 2017.
Gerber, E. P., Butler, A., Calvo, N., Charlton-Perez, A., Giorgetta, M., Manzini, E., Perlwitz, J., Polvani, L. M., Sassi, F., Scaife, A. A., Shaw, T. A., Son, S. W., and Watanabe, S.: Assessing and understanding the impact of stratospheric dynamics and variability on the earth system, B. Am. Meteorol. Soc., 93, 845–859, https://doi.org/10.1175/BAMS-D-11-00145.1, 2012.
Gille, J. C., Lyjak, L. V., and Smith, A.: The Global Residual Mean Circulation in the Middle Atmosphere for the Northern Winter Period, J. Atmos. Sci., 44, 1437–1452, 1987.
Haynes, P. H., McIntyre, M. E., Shepherd, T. G., Marks, C. J., and Shine, K. P.: On the “downward control” of extratropical diabatic circulations by eddy-induced mean zonal forces, J. Atmos. Sci., 48, 651–678, 1991.
Holton, J. R.: An Introduction to Dynamic Meteorology, 4th edn., Elsevier Academic Press, Washington, 553 pp., 2004.
Holton, J. R., Haynes, P. H., McIntyre, M. E., Douglas, A. R., Rood, R. B., and Pfister, L.: Stratosphere-troposphere exchange, Rev. Geophys., 33, 403–439, 1995.
Iwasaki, T., Hamada, H., and Miyazaki, K.: Comparisons of Brewer-Dobson circulations diagnosed from reanalyses, J. Meteorol. Soc. Jpn., 87, 997–1006, https://doi.org/10.2151/jmsj.87.997, 2009.
Jacob, D. J.: Introduction to Atmospheric Chemistry, Princeton University Press, New Jersey, 280 pp., 1999.
Kobayashi, C. and Iwasaki, T.: Brewer-Dobson circulation diagnosed from JRA-55, J. Geophys. Res., 121, 1493–1510, 2016.
Kobayashi, S., Ota, Y., and Harada, H.: The JRA-55 Reanalysis: General specifications and basic characteristics, J. Meteorol. Soc. Jpn., 93, 5–48, https://doi.org/10.2151/jmsj.2015-001, 2015.
Koval, A. V., Gavrilov, N. M., Pogoreltsev, A. I., and Drobashevskaya, E. A.: Numerical simulation of the mean meridional circulation in the middle atmosphere at different phases of stratospheric warmings and mountain wave scenarios, J. Atmos. Sol.-Terr. Phy., 183, 11–18, https://doi.org/10.1016/j.jastp.2018.12.012, 2019a.
Koval, A. V., Gavrilov, N. M., Pogoreltsev, A. I., and Shevchuk, N. O.: Reactions of the middle atmosphere circulation and stationary planetary waves on the solar activity effects in the thermosphere, J. Geophys. Res.-Space, 124, 10645–10658 https://doi.org/10.1029/2019JA027392, 2019b.
Laskar, F. I., McCormack, J. P., Chau, J. L., Pallamraju, D., Hoffmann, P., and Singh, R. P.: Interhemispheric Meridional Circulation During Sudden Stratospheric Warming, J. Geophys. Res.-Space, 124, 7112–7122, https://doi.org/10.1029/2018JA026424, 2019.
Lindzen, R. S.: Turbulence and stress owing to gravity wave and tidal breakdown, J. Geophys. Res., 86, 9707–9714, 1981.
Liu, H., Doornbos, E., Yamamoto, M., and Ram, S. T.: Strong thermospheric cooling during the 2009 major stratosphere warming, Geophys. Res. Lett., 38, L12102, https://doi.org/10.1029/2011GL047898, 2011.
McIntyre, M. E.: How well do we understand the dynamics of stratospheric warmings, J. Meteorol. Soc. Jpn., 60, 37–64, 1982.
Nath, D., Chen, W., Zelin, C., Pogoreltsev, A. I., and Wei, K.: Dynamics of 2013 Sudden Stratospheric Warming event and its impact on cold weather over Eurasia: Role of planetary wave reflection, Sci. Rep.-UK, 6, 24174, https://doi.org/10.1038/srep24174, 2016.
Pawson, S., Kodera, K., Hamilton, K., Shepherd, T. G., Beagley, S. R., Boville, B. A., Farrara, J. D., Fairlie, T. D. A., Kitoh, A., Lahoz, W. A., Langematz, U., Manzini, E., Rind, D. H., Scaife, A. A., Shibata, K., Simon, P., Swinbank, R., Takacs, L., Wilson, R. J., Al-Saadi, J. A., Amodei, M., Chiba, M., Coy, L., de Grandpré, J., Eckman, R. S., Fiorino, M., Grose, W. L., Koide, H., Koshyk, J. N., Li, D., Lerner, J., Mahlman, J. D., McFarlane, N. A., Mechoso, C. R., Molod, A., O'Neill, A., Pierce, R. B., Randel, W. J., Rood, R. B., and Wu, F.: The GCM-Reality Intercomparison Project for SPARC (GRIPS): Scientific issues and initial results, B. Am. Meteorol. Soc., 81, 781–796, https://doi.org/10.1175/1520-0477(2000)081<0781:TGIPFS>2.3.CO;2, 2000.
Pogoreltsev, A. I., Vlasov, A. A., Froehlich, K., and Jacobi, C.: Planetary waves in coupling the lower and upper atmosphere, J. Atmos. Sol.-Terr. Phy., 69, 2083–2101, https://doi.org/10.1016/j.jastp.2007.05.014, 2007.
Pogoreltsev, A. I., Kanukhina, A. Y., Suvorova, E. V., and Savenkova, E. N.: Variability of Planetary Waves as a Signature of Possible Climatic Changes, J. Atmos. Sol.-Terr. Phy., 71, 1529–1539, https://doi.org/10.1016/j.jastp.2009.05.011, 2009.
Pogoreltsev, A. I., Savenkova, E. N., and Pertsev, N. N.: Sudden stratopheric warmings: the role of normal atmospheric modes, Geomagn. Aeronomy+, 54, 357–372, 2014.
Rice, J. A.: Mathematical statistics and data analysis, edn. 3, Pacific Grove. Duxbury Press, Belmont, USA, 603 pp., ISBN 10:0534399428, 2006.
Savenkova, E. N., Gavrilov, N. M., and Pogoreltsev, A. I.: On statistical irregularity of stratospheric warming occurrence during northern winters, J. Atmos. Sol.-Terr. Phy., 163, 14–22, https://doi.org/10.1016/j.jastp.2017.06.007, 2017.
Seviour, W. J. M., Butchart, N., and Hardiman, S. C.: The Brewer-Dobson circulation inferred from ERA-Interim, Q. J. Roy. Meteor. Soc., 138, 878–888, https://doi.org/10.1002/qj.966, 2012.
Shepherd T. G.: Transport in the middle atmosphere, J. Meteorol. Soc. Jpn., 85, 165–191, 2007.
Siskind, D. E., Eckermann, S. D., McCormack, J. P., Coy, L., Hoppel, K. W., and Baker, N. L.: Case studies of the mesospheric response to recent minor, major and extended stratospheric warmings, J. Geophys. Res., 115, D00N03, https://doi.org/10.1029/2010JD014114, 2010.
Song, B.-G. and Chun, H.-Y.: Residual Mean Circulation and Temperature Changes during the Evolution of Stratospheric Sudden Warming Revealed in MERRA, Atmos. Chem. Phys. Discuss. [preprint], https://doi.org/10.5194/acp-2016-729, 2016.
SPARC CCMVal: SPARC report on the evaluation of chemistry-climate models, in: SPARC Report No. 5, WCRP-132, WMO/TD-No, edited by: Eyring, V., Shepherd, T. G., and Waugh, D. W., available at: https://www.sparc-climate.org/publications/sparc-reports/sparc-report-no-5/ (last access: November 2020), 2010.
Stray, N. H., Orsolini, Y. J., Espy, P. J., Limpasuvan, V., and Hibbins, R. E.: Observations of planetary waves in the mesosphere-lower thermosphere during stratospheric warming events, Atmos. Chem. Phys., 15, 4997–5005, https://doi.org/10.5194/acp-15-4997-2015, 2015.
Sun, L. and Robinson, W. A.: Downward influence of stratospheric final warming events in an idealized model, Geophys. Res. Lett., 36, L03819, https://doi.org/10.1029/2008GL036624, 2009.
Suvorova, E. V. and Pogoreltsev, A. I.: Modeling of nonmigrating tides in the middle atmosphere, Geomagn. Aeronomy+, 51, 105–115, 2011.
Swinbank, R. and O'Neill, A.: Stratosphere-troposphere assimilation system, Mon. Weather Rev., 122, 686–702, 1994.
Tao, M. C., Liu, Y., and Zhang, Y. L.: Variation in Brewer–Dobson circulation during three sudden stratospheric major warming events in the 2000's, Adv. Atmos. Sci., 34, 1415–1425, https://doi.org/10.1007/s00376-017-6321-1, 2017.
Tegtmeier, S., Krüger, K., Wohltmann, I., Schoellhammer, K., and Rex, M.: Variations of the residual circulation in the Northern Hemispheric winter, J. Geophys. Res., 113, D16109, https://doi.org/10.1029/2007JD009518, 2008.
Yigit, E. and Medvedev, A. S.: Heating and cooling of the thermo-sphere by internal gravity waves, Geophys. Res. Lett., 36, L14807, https://doi.org/10.1029/2009GL038507, 2009.
Yuan, T., Thurairajah, B., She, C.-Y., Chandran, A., Collins, R. L., and Krueger, D. A.: Wind and temperature response of midlatitude mesopause region to the 2009 sudden stratospheric warming, J. Geophys. Res., 117, D09114, https://doi.org/10.1029/2011JD017142, 2012.
- Abstract
- Introduction
- Methodology
- Calculating the residual mean meridional circulation
- Residual circulation at the different SSW stages
- Residual fluxes of mass
- Wave-induced eddy circulation
- Summary
- Code availability
- Data availability
- Author contributions
- Competing interests
- Acknowledgements
- Financial support
- Review statement
- References