the Creative Commons Attribution 4.0 License.
the Creative Commons Attribution 4.0 License.
 | 16 Dec 2021
Dynamics of variable dusk–dawn flow associated with magnetotail current sheet flapping
Adrian Grocott
Nathan A. Case
Maria-Theresia Walach
We present Cluster spacecraft observations from 12 October 2006 of convective plasma flows in the Earth's magnetotail. Earthward flow bursts with a dawnward v⊥y component, observed by Cluster 1 (C1), are inconsistent with the duskward flow that might be expected at the pre-midnight location of the spacecraft. Previous observations have suggested that the dusk–dawn sense of the flow can be governed by the interplanetary magnetic field (IMF) By conditions, with the related “untwisting hypothesis” of magnetotail dynamics commonly invoked to explain this dependence, in terms of a large-scale magnetospheric asymmetry. In the current study, observations of the upstream solar wind conditions from OMNI, magnetic field observations by Cluster and ionospheric convection data using SuperDARN indicate a large-scale magnetospheric morphology consistent with positive IMF By penetration into the magnetotail. At the pre-midnight location of Cluster, however, the dawnward flow observed below the neutral sheet by C1 could only be explained by the untwisting hypothesis in a negative IMF By scenario. The Cluster magnetic field data also reveal a flapping of the magnetotail current sheet, a phenomenon known to influence dusk–dawn flow. Results from the curlometer analysis technique suggest that the dusk–dawn sense of the J×B force was consistent with localised kinks in the magnetic field and the flapping associated with the transient perturbations to the dusk–dawn flow observed by C1. We therefore suggest that the flapping overcame the dusk–dawn sense of the large-scale convection which we would expect to have been net duskward in this case. We conclude that invocation of the untwisting hypothesis may be inappropriate when interpreting intervals of dynamic magnetotail behaviour such as during current sheet flapping, particularly at locations where magnetotail flaring becomes dominant.
- Article
(5163 KB) - Full-text XML
- BibTeX
- EndNote


Convective magnetotail plasma flows at Earth, driven by the closing of magnetic flux via reconnection as part of the Dungey Cycle (Dungey, 1961), have been studied extensively for many years (e.g. Angelopoulos et al., 1992, 1994; Sergeev et al., 1996; Petrukovich et al., 2001; Cao et al., 2006; McPherron et al., 2011; Frühauff and Glassmeier, 2016). Arguably, the most well studied of these is the bursty bulk flow (BBF). Angelopoulos et al. (1994) defined BBFs as being channels of earthward plasma flow continually above 100 km s−1, exceeding 400 km s−1 at one point across some interval, usually across a timescale of a few minutes. The flows are said to be the main transporter of mass, energy and flux in the magnetotail (e.g. Angelopoulos et al., 1994; Nakamura et al., 2002; Grocott et al., 2004c; Kiehas et al., 2018). Although their earthward nature is the key defining characteristic of BBFs, they will invariably exhibit a dusk–dawn component in their bulk flow as well (e.g. Angelopoulos et al., 1994; Petrukovich et al., 2001; Grocott et al., 2004b). Understanding the drivers of dusk–dawn asymmetries in magnetospheric dynamics is an important element of geospace research (e.g. Haaland et al., 2017).
Magnetotail flows are generally expected to be symmetric about midnight (e.g. Kissinger et al., 2012). A key factor that has been observed to influence the dusk–dawn direction of the magnetotail flow, however, is the By component of the interplanetary magnetic field (IMF). It is well established that when the IMF reconnects with the dayside terrestrial magnetic field, a non-zero IMF By component leads to asymmetric loading of open flux into the polar cap (e.g. Khurana et al., 1996; Tenfjord et al., 2015; Grocott, 2017; Ohma et al., 2019). This results in a twisting of the magnetotail whereby the closed field lines are rotated about the midnight meridian, and a By component is superimposed onto the tail field as a consequence of IMF By penetration (Cowley, 1981; Petrukovich, 2011; Tenfjord et al., 2015). Subsequently, following nightside reconnection, the tail will untwist (Grocott et al., 2004a), with the excitation of multiple convective flow bursts, each with an earthward and dusk–dawn component, in the tail and nightside ionosphere (Grocott et al., 2007). In order to be consistent with the tail untwisting hypothesis, any convective flows associated with an individual tail field line should share the same dusk–dawn direction (e.g. see Fig. 3 of Grocott et al., 2005). The role of IMF By in the untwisting hypothesis has been examined previously in a number of studies (e.g. Grocott et al., 2007; Pitkänen et al., 2013, 2015, 2017). These studies revealed that under prolonged positive IMF By conditions, the earthward flows are expected to exhibit a dawnward component in the northern hemisphere (Bx>0) and a duskward component in the southern hemisphere (Bx<0), with the opposite correlation for negative IMF By conditions. This is especially true close to midnight, where the penetration of IMF By is particularly noticeable. Further away from midnight, however, effects such as magnetotail flaring (Fairfield, 1979) are expected to produce a dominant By component, which may suppress IMF By effects on the dusk–dawn asymmetry, resulting in the symmetric earthward convection of field lines (e.g. see Fig. 2 of Pitkänen et al., 2019). Nevertheless, IMF By has been shown to govern the dusk–dawn nature of these flows both during periods of steadier, slower convection (Pitkänen et al., 2019) and during more transient, dynamic BBF-like intervals (Grocott et al., 2007) at values up to 7RE (Pitkänen et al., 2013). In the present study, we present Cluster observations of dawnward- and duskward-directed flows that do not match this expected dependence on IMF By, implying that the untwisting hypothesis is insufficient in this case. In particular, we highlight the problematic nature of the observation of dawnward flow, in relation to the pre-midnight location of Cluster. We instead suggest that the flows are being driven by local perturbations, due to dynamic behaviour of the tail, that are associated with flapping of the current sheet.
The current sheet, or “neutral” sheet, lies in the equatorial plane at the centre of the tail plasma sheet and separates the earthward- (Bx>0) and tailward-directed (Bx<0) fields (Ness, 1965). The current sheet is a highly dynamic region of the Earth's magnetotail which can undergo various types of net motion, such as tilting due to lobe magnetic pressures (Cowley, 1981; Tenfjord et al., 2017) as well as flapping. Flapping of the current sheet can generally be described as a sinusoidal-like variation in Bx of up to tens of nanotesla, where an observing spacecraft often measures repeated changes in the sign of Bx (e.g. Runov et al., 2009), indicative of crossings of the current sheet, with characteristic times ranging from a few seconds to (more commonly) several minutes (e.g. Runov et al., 2009; Wu et al., 2016; Wei et al., 2019). Drivers of current sheet flapping have been widely investigated, with possible causes ranging from external solar wind/IMF changes (Runov et al., 2009), induction of hemispheric plasma asymmetries (Malova et al., 2007; Wei et al., 2015), fast earthward flow (Nakamura et al., 2009) and periodical, unsteady magnetotail reconnection (Wei et al., 2019). Studies such as Volwerk et al. (2008) and Kubyshkina et al. (2014) have illustrated that flapping of the current sheet can be associated with variable dusk–dawn flow, potentially overriding or preventing any IMF By control of the flow.
In this paper we present Cluster spacecraft observations of an interval of dynamic magnetotail behaviour on 12 October 2006, prior to which the By component of the concurrent upstream IMF had been largely positive for several hours. Throughout this interval, Cluster 1 observed oscillations in the magnetic field Bx component, which we attribute to current sheet flapping, concurrent with a series of convective fast flows with significant and variable dusk–dawn components. Observations from Cluster 2, Cluster 3 and Cluster 4 indicated that the spacecraft were at a pre-midnight location where magnetotail flaring was dominating over IMF By control of the flows, resulting in the expectation of (symmetrical) duskward return flows (Pitkänen et al., 2019). In the southern hemisphere, such duskward flow was measured by Cluster 3 but not observed by Cluster 1, which instead measured flows with significant dawnward components. These dawnward flows were therefore inconsistent with any expectation that the flow was governed by flaring and, owing to evidence of a large-scale IMF By>0 ionospheric convection pattern, could also not be explained by the magnetotail untwisting hypothesis. We instead suggest that the current sheet flapping was exciting the variable dusk–dawn flow, overriding the expected large-scale duskward convection at the location of Cluster 1.
2.1 Spacecraft data
The magnetospheric observations presented in this case study were made by the Cluster multi-spacecraft (C1–C4) constellation (Escoubet et al., 2001). We make use of the fluxgate magnetometer (FGM) on board the Cluster spacecraft to obtain magnetic field measurements (Balogh et al., 2001), and we obtain our bulk ion velocity data from the hot-ion analyser (HIA) on C1 and C3 calculated as on-board moments (Rème et al., 1997). The presented magnetic field data are given with five vectors per second (0.2 s res.) which have been 1 s median-averaged, with the presented velocity data having a spin resolution of just over 4 s. Where these datasets have been combined to produce parameters such as the plasma beta and field-perpendicular velocities, we have resampled both the magnetic field and plasma data to 5 s resolution. All data are presented in geocentric solar magnetospheric (GSM) coordinates unless stated otherwise.
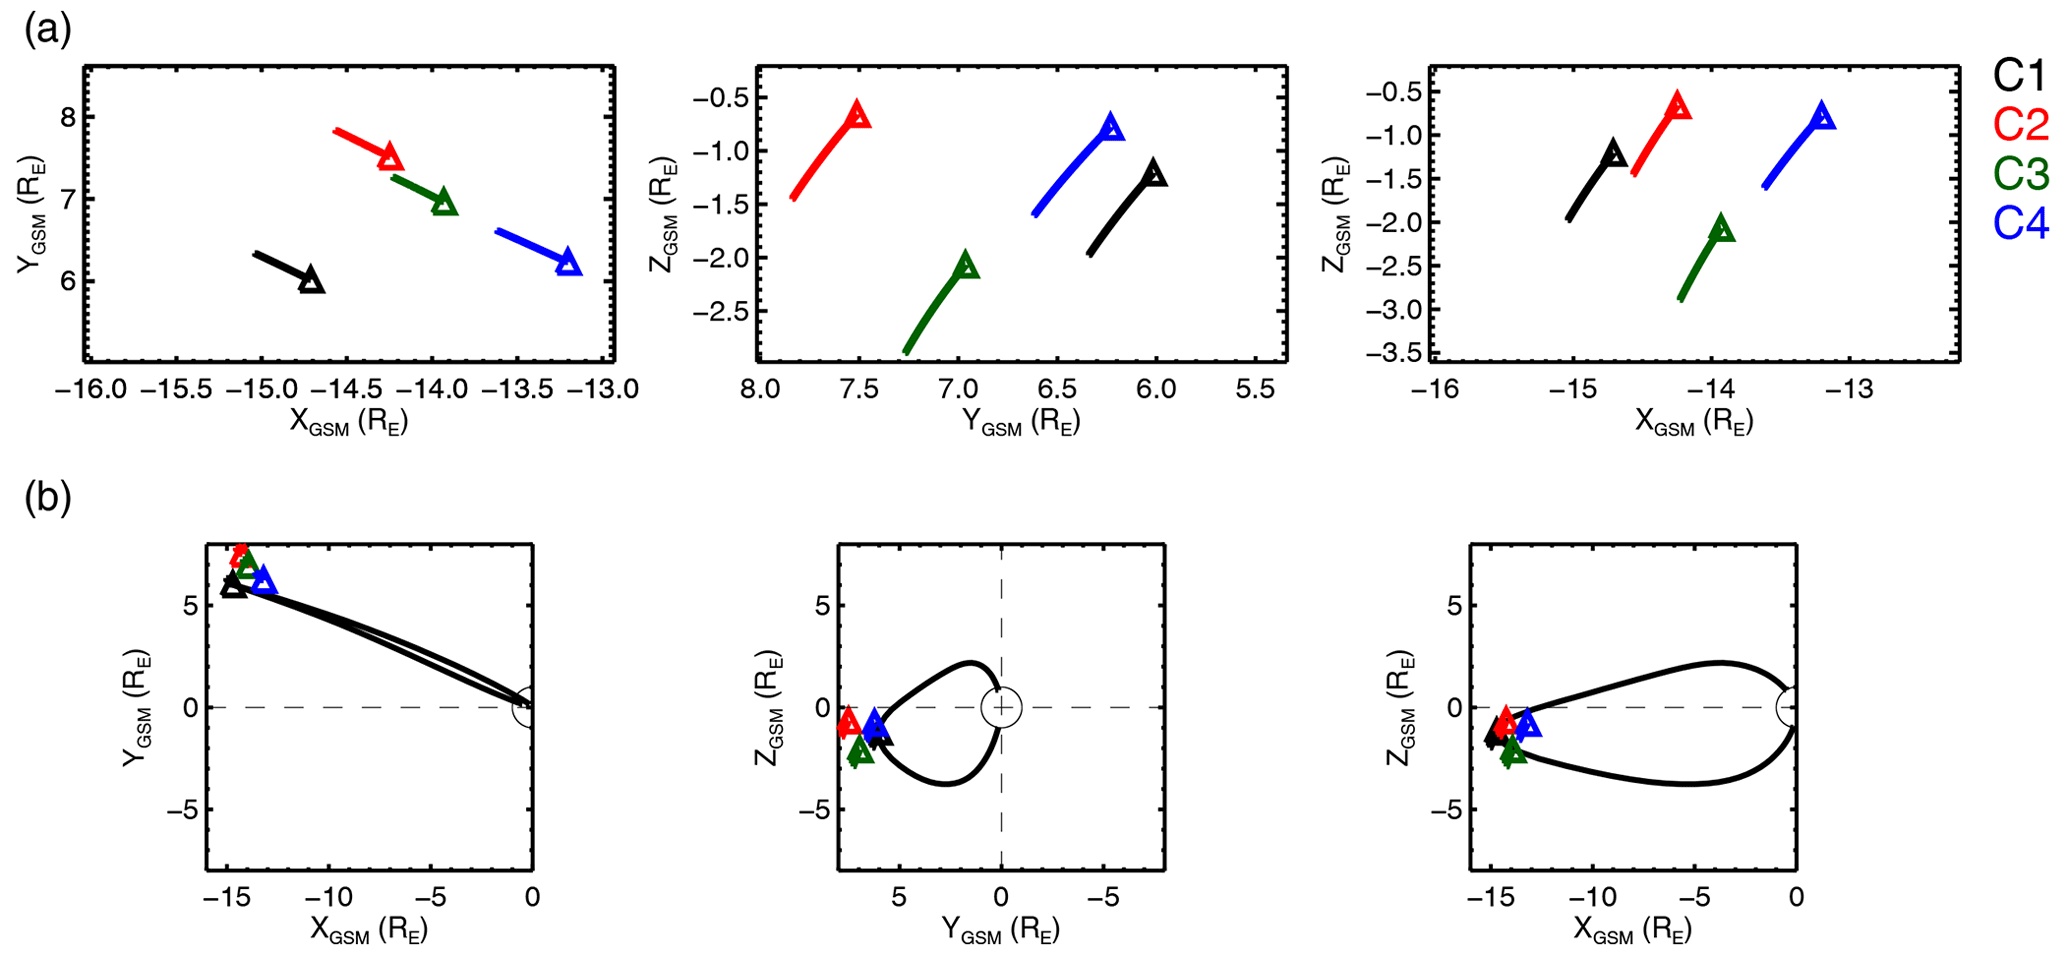
Figure 1(a) The locations of the Cluster spacecraft in the X–Y, Y–Z and X–Z GSM planes, from left to right, respectively, at 00:00 UT on 12 October 2006, marked by the triangles. The trajectories from 00:00 to 00:55 UT are marked by the solid lines. The spacecraft are colour-coded according to the key on the right. (b) Same as in (a) with a zoomed-out view. The Earth is shown by the solid circle. A TA15 model magnetic field line passing through the location of C1 is shown as the solid black line.
The interval of study in this paper is 00:00–00:55 UT on 12 October 2006. At 00:00 UT the Cluster spacecraft were located in the near-Earth magnetotail plasma sheet, in the pre-midnight sector. C1 was located at , Y=6.0, , C2 at , Y=7.5, , C3 at , Y=7.0, and C4 at , Y=6.2, . This is depicted in Fig. 1a by the coloured triangles, along with the respective spacecraft trajectories, from 00:00–00:55 UT, by the solid lines. Figure 1b shows a zoomed-out version of Fig. 1a, which illustrates the location of the spacecraft with respect to the Earth. Figure 1b also shows a traced modelled magnetic field line, achieved using the semi-empirical TA15 model of the magnetosphere (Tsyganenko and Andreeva, 2015), which passes through the location of C1 and connects to both the northern and southern hemispheres of the Earth. We parameterised the TA15 model using mean-averaged solar wind dynamic pressure (Pdyn), IMF By and IMF Bz data from the 1 h interval prior to 00:28 UT (the start of our specific interval of interest). These values were Pdyn=1.56 nPa, IMF nT and IMF nT. There was also a tailward dipole tilt ∘. The model was also parameterised with a solar wind coupling function index known as the “N index”, after Newell et al. (2007). The N index varies between 0 (quiet) and 2 (very active), and in this instance it was ∼0.4.
The IMF measurements used in this study were provided by the OMNIWeb database at 1 min resolution, having been first propagated from L1 to the bow shock nose (King and Papitashvili, 2005).
2.2 SuperDARN data
The ionospheric observations presented in Sect. 3.3 were provided by the Super Dual Auroral Radar Network (SuperDARN), an international collaboration of 36 ground-based radars (Nishitani et al., 2019) that make line-of-sight Doppler measurements of the horizontal motion of the ionospheric plasma every few seconds (e.g. Chisham et al., 2007). Here, we use 2 min ionospheric convection maps created by fitting the line-of-sight E×B velocity data to an eighth-order expansion of the ionospheric electric potential in spherical harmonics using the technique by Ruohoniemi and Baker (1998), implemented in the Radar Software Toolkit (RST version 4.2, 2018). To accommodate intervals with limited data availability, the data are supplemented with values derived from a statistical model parameterised by IMF conditions. This is a well-established technique that has been thoroughly discussed by, for example, Chisham et al. (2007). The convection maps we present employ the commonly used model of Ruohoniemi and Greenwald (1996). As a check on the sensitivity of the maps to the choice of model input, we also tested the fitting using the alternative model of Thomas and Shepherd (2018) and found that this has little impact on the maps and no impact on our conclusions.

Figure 2(a) A plot of the IMF time series data for the IMF By (blue) and IMF Bz (red) components, from 20:00 UT on 11 October 2006 to 01:00 UT on 12 October 2006. The vertical dashed lines indicate the start (00:00 UT) and end (00:55 UT) of the interval of Cluster data (below). (b) The in situ Cluster spacecraft measurements. Shown first is the local magnetic field data, (i) Bx, (ii) By and (iii) Bz, followed by the bulk ion velocity data, (iv) vx, (v) vy and (vi) vz (dotted lines). The field-perpendicular component of the ion flow (indicative of the E×B convection) is shown in panels (iv) to (vi) by the solid lines. In panel (vii) the magnetic and thermal ion (nkT) pressures are shown by the solid and dotted lines, respectively, and in panel (viii) the ion plasma beta from C1 and C3 is shown. All data are labelled according to the colour-coded key on the right-hand side. The time interval between the grey shaded region marks our specific interval of interest (discussed in the text).
As a further measure to ensure that the choice of model is not critical to our results, we chose not to use the concurrent IMF vector to parameterise the background model. In this case, as we are using the SuperDARN data to provide evidence in support of the expected large-scale influence of IMF By, we deemed it inappropriate to include model data already parameterised by IMF By. We instead specify a nominal southward IMF with zero By component in our analysis, to ensure that a background model with no pre-existing IMF By influence is used. Although this might result in the patterns we show being less accurate overall, especially in regions of poor data coverage, it will ensure that any By-associated asymmetry in the maps is driven by the radar data from our interval of study and not the background model. This is discussed further in Sect. 4.1, below.
In this section we present observations of the IMF, magnetotail magnetic field and plasma flow, and ionospheric convection from an interval on 12 October 2006.
3.1 IMF observations
Figure 2 presents an overview of the spacecraft data from an extended interval around our period of specific interest for broader context. In Fig. 2a, we show a time series of the IMF By and IMF Bz data from 20:00 UT on 11 October to 01:00 UT on 12 October 2006. These data reveal that IMF By was generally positive for several hours prior to the fast flow interval, with IMF Bz predominantly negative. There were three small intervals of negative IMF By at ∼ 21:35, 23:00 and 23:40 UT, and we discuss the possible ramifications of these and our treatment of them in Sect. 4.1.
3.2 Cluster spacecraft observations
In Fig. 2b, we present the in situ magnetic field and plasma measurements from the Cluster spacecraft across the interval 00:00–00:55 UT.
At ∼ 00:06 UT, C1 crossed from the northern hemisphere into the southern hemisphere, illustrated by the sign change in Bx from positive to negative shown in Fig. 2b(i). Coincident with this, the observed By, shown in Fig. 2b(ii), turned from negative to positive, consistent with the expected By due to magnetotail flaring (see Sect. 4.2) at this pre-midnight location (Fairfield, 1979). Figure 2b(iv) reveals that up until ∼ 00:24 UT, the bulk earthward flow (vx, dotted lines) and field-perpendicular flow (v⊥x, solid lines) measured by both C1 and C3 were generally low in magnitude (<100 km s−1). The dusk–dawn (vy) component of the flow, shown in Fig. 2b(v), remained steadily duskward (vy>0) at C1 and duskward or close to zero at C3. The north–south (vz) component of the flow in Fig. 2b(vi), measured by C1 and C3, was effectively zero. During this period, the Cluster spacecraft that resided in the northern hemisphere (predominantly C2 and C4) observed By<0, and the spacecraft which resided in the southern hemisphere (predominantly C1 and C3) observed By>0, again consistent with magnetotail flaring. Occasionally a spacecraft encountered the current sheet (Bx=0) at which point it observed By=0. We comment on the significance of these magnetic field observations in Sect. 4.2.
After ∼ 00:24 UT, C1 began to observe a period of enhanced earthward flow (vx>300 km s−1) and variable dusk–dawn flow, concurrent with sudden variation in the local Bx component. Similarly, C2 and C4 but not C3 observed large-magnitude ( nT) rapid variations in Bx, which appear to have an apparent timescale of around 1 min and which we attribute to a flapping of the current sheet. As well as rapid variations in Bx, both the By and Bz components of C1, C2 and C4 seemed highly variable. As perhaps to be expected, these variations in the magnetic field were accompanied by significant variations in the magnetic pressure of ∼0.15 nPa, as shown by the solid lines in Fig. 2b(vii).
Unlike the other spacecraft, C3 remained in the southern hemisphere throughout the entire interval and did not observe the rapid fluctuations in Bx. Between 00:28–00:33 UT (the grey shaded region), C1 began to repeatedly and rapidly cross the current sheet, as previously experienced by C2 and C4, whilst continually observing enhanced earthward flow and variable dusk–dawn convective flow (v⊥y). Across the entire interval, the plasma beta, β, indicated in Fig. 2b(viii), measured by C3 remained above ∼0.1, with C1's measured β ranging from 0.1 to over 100. This is consistent with the fact that C1 was continually crossing the current sheet at the centre of the plasma sheet, where β is larger (Baumjohann et al., 1989). It is this interval of current sheet crossing and variable flow observed by C1 that we focus on below and is presented in more detail in Fig. 3.

Figure 3(i) conveys the extent of the large-amplitude Bx variations observed by C1 between 00:28 and 00:33 UT. Bx was generally fluctuating between positive and negative values throughout the 5 min interval, with a minimum at nT and maximum at ∼17 nT. The magnetic pressure at C1 shown by the solid black line in Fig. 3(vii) is consistent with the idea that C1 was crossing the current sheet, as this generally reached minima at the centre of each current sheet crossing (Bx≈0). The By component (Fig. 3(ii)) measured by C1 generally remained negative and highly variable for the entire interval, with a number of large negative enhancements and a few small positive excursions. It is particularly of note that when C1 was below the neutral sheet, as implied by a negative Bx component, By was almost always negative. As we discuss in Sect. 4.2, this is inconsistent with what we would expect based on the location of the spacecraft and also inconsistent with any expectation that a positive IMF By should have penetrated into the tail. The Bz component (Fig. 3(iii)) generally remained positive with some small negative excursions.
Unlike C1, C2–C4 measured generally steady Bx throughout this 5 min period. C2 and C4 measured positive Bx, indicating that they were above the neutral sheet, and C3 measured negative Bx, indicating that it was below the neutral sheet. Similarly, By was steadily negative for C2 and C4 and steadily positive for C3. These observations are consistent with the larger-scale By at the spacecraft location being dominated by magnetotail flaring. Again, we note the inconsistency between the C1 and C3 observations of By; when in the southern hemisphere C1 generally observed By<0, whereas C3 observed By>0. On a few separate occasions C1 did briefly observe By>0 (e.g. at 00:31:05 UT), but at these times C1 was located above the neutral sheet (Bx>0), while C2 and C4 observed By<0 above the neutral sheet. These variations in By imply the observation of a “kink” in the field at the location of C1, the ramifications of which are discussed further in Sect. 4.2.
At times when Bx observed by C1 was negative, indicating that C1 was below the neutral sheet, C1 generally observed negative (dawnward) v⊥y (Fig. 3(v)) with a magnitude varying between 100 and 200 km s−1. At times when Bx became positive, indicating that C1 was above the neutral sheet, C1 observed positive (duskward) v⊥y a majority of the time, although this flow barely reached 100 km s−1. The negative enhancements in v⊥y were generally accompanied by negative enhancements in By. Across the interval, there was a near-continual vx>200 km s−1 flow (black dotted line in Fig. 3(iv)), peaking at almost 400 km s−1, with concurrent peaks in the convective v⊥x component (solid black line) of at least 200 km s−1. The convective flow measured by C3, however, was generally very weak ( km s−1) throughout this period (solid green line in Fig. 3(iv)). vz (Fig. 3(vi)), as measured by both C1 and C3 remained low in magnitude (<100 km s−1) for the duration of the interval, with a few v⊥z excursions above 100 km s−1 observed by C1. The most significant enhancements in v⊥z seen by C1 appeared to occur in conjunction with the rapid current sheet crossings between 00:30:50 and 00:32:00 UT. We discuss the implications of these observations in the context of the upstream IMF conditions and large-scale magnetospheric morphology in Sect. 4.
3.3 Ionospheric convection observations
To provide the large-scale context in which we can interpret the more localised observations from the Cluster spacecraft, we show ionospheric convection observations in Fig. 4. In Fig. 4a we present a series of four 2 min integration SuperDARN maps of the northern hemisphere ionospheric convection pattern, beginning at 00:24 UT and ending at 00:34 UT, which encompasses our specific interval. In all maps, plasma is flowing anti-sunward across the polar cap at high latitudes, also with a strong duskward sense, with the direction of the convection reversing in the pre-midnight sector before returning sunward at lower latitudes.
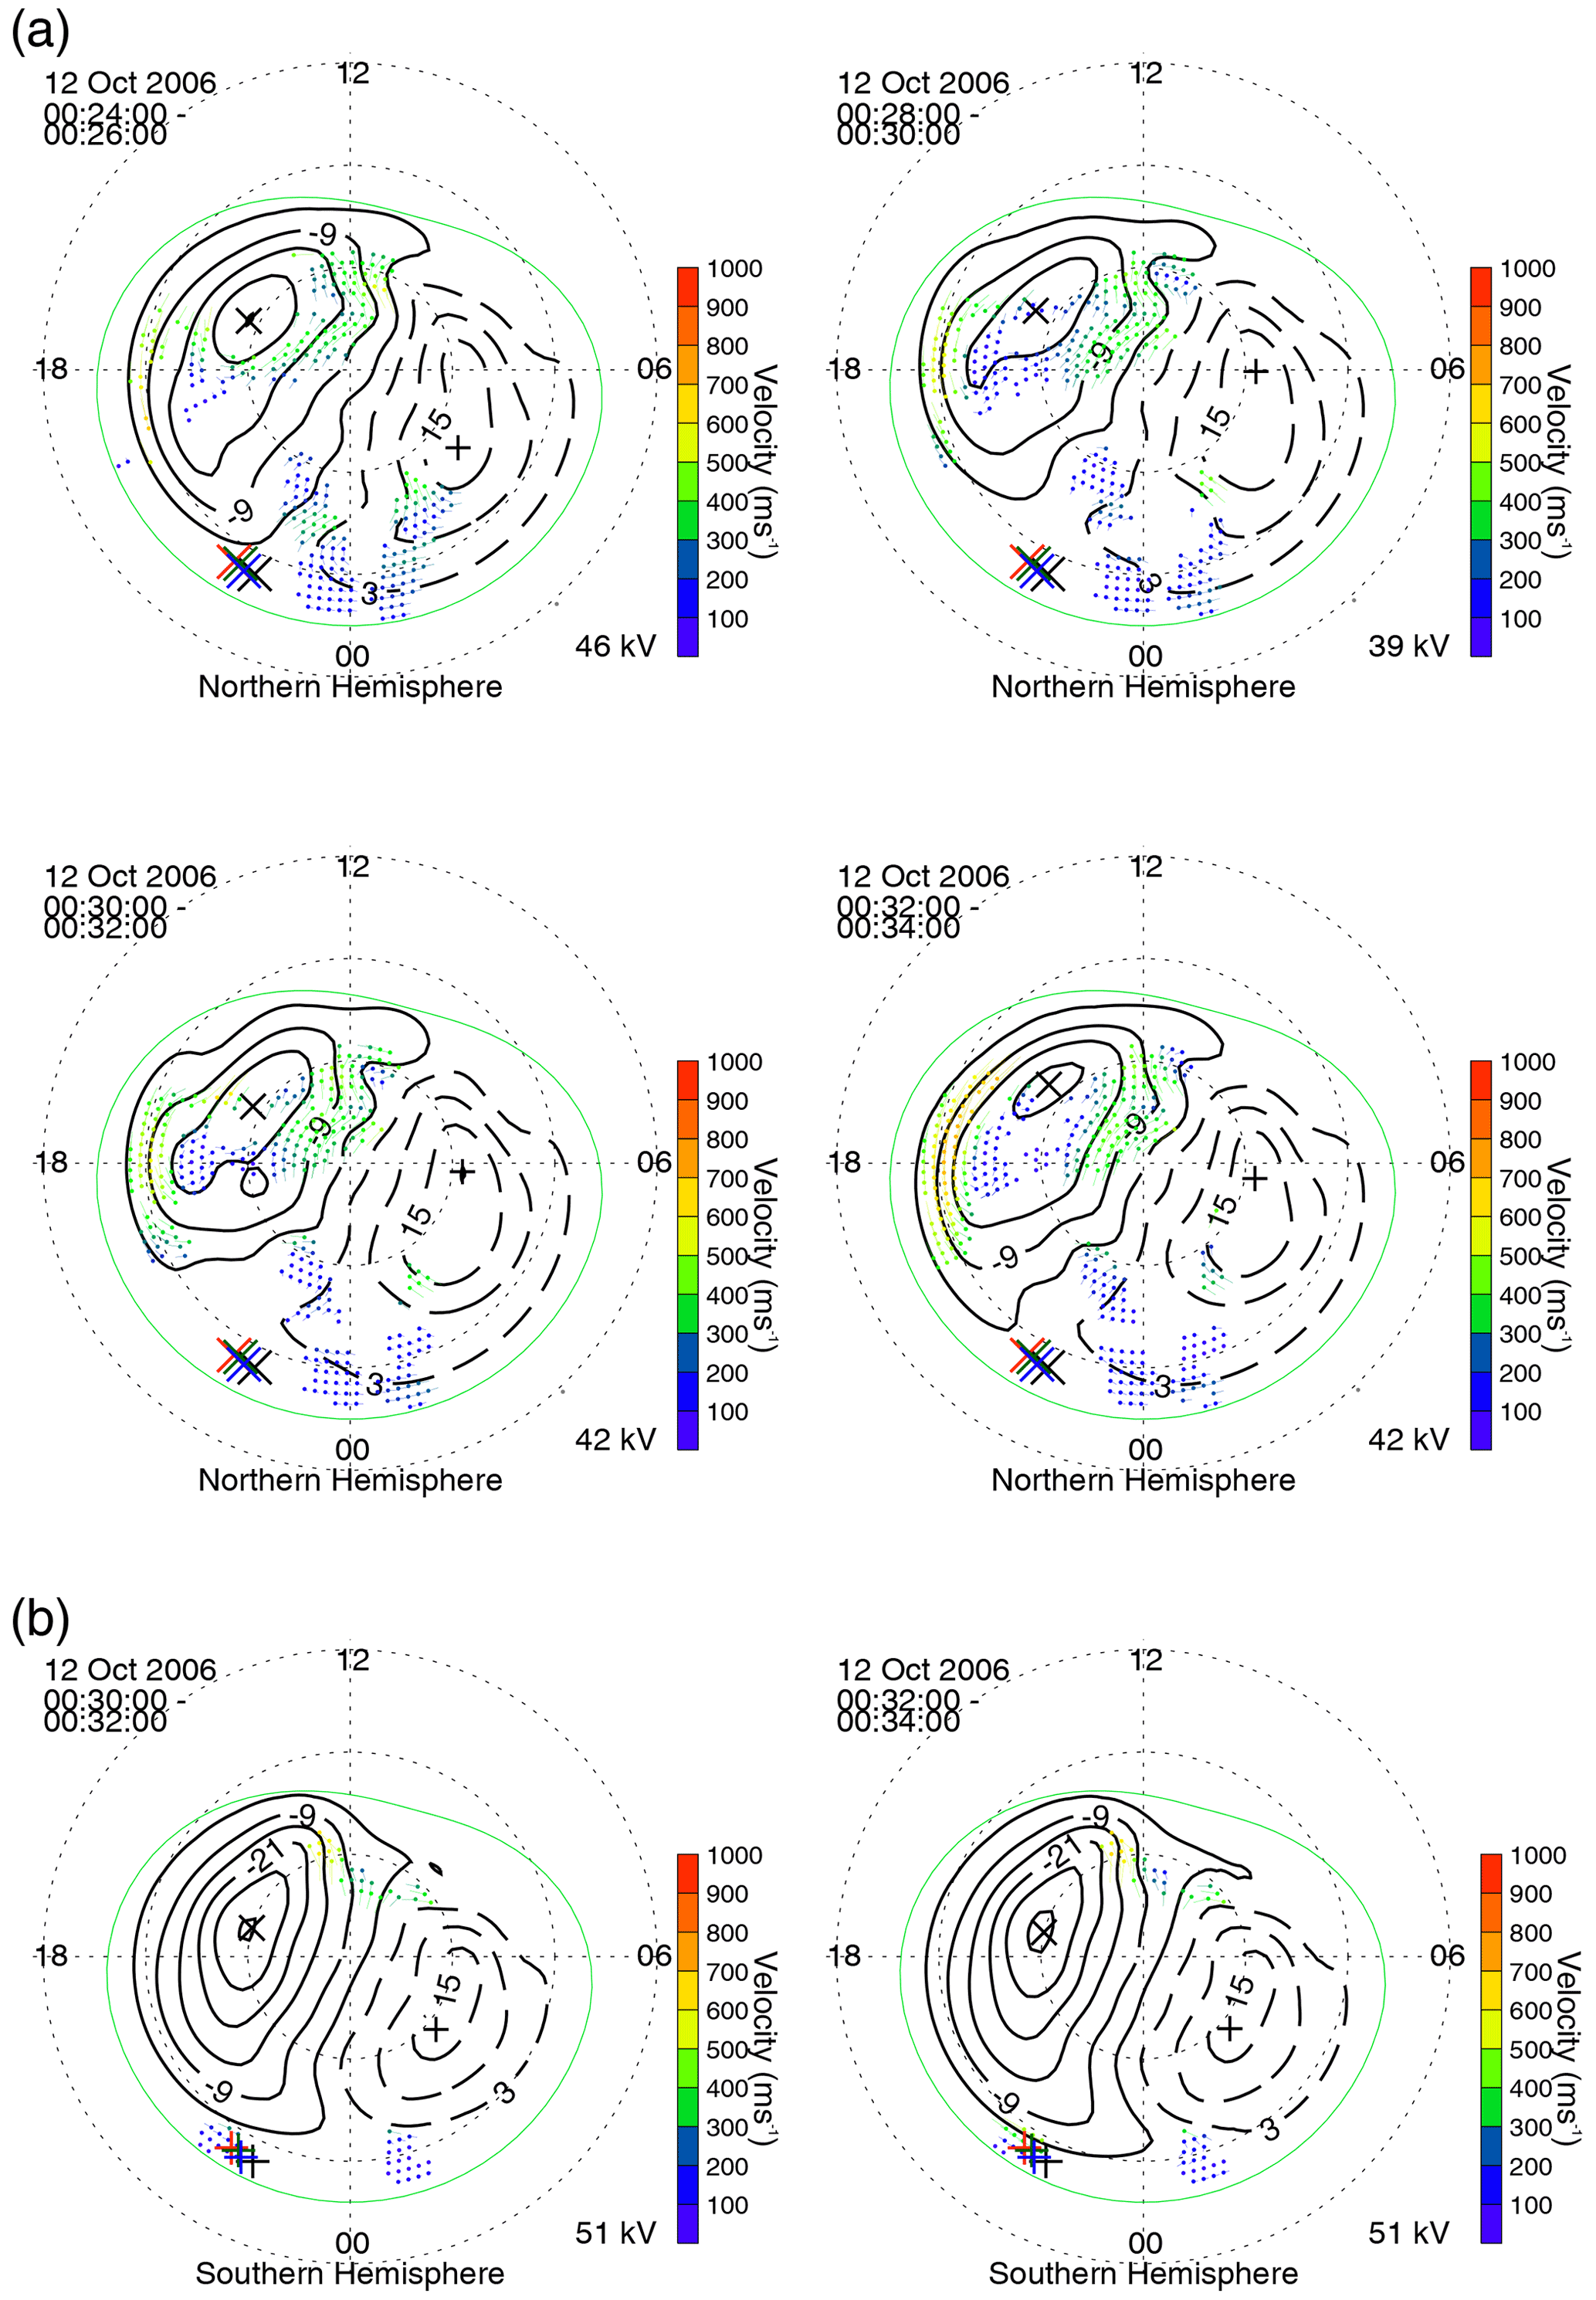
Figure 4Maps of the ionospheric plasma convection derived from SuperDARN observations. Midnight is to the bottom of each map, noon to the top, dusk to the left and dawn to the right. The dashed black circles are spaced every 10∘ in magnetic latitude. The thicker solid and dashed black lines represent the plasma streamlines and are the contours of the electrostatic potential. Flow vectors are plotted at the locations of radar observations, and these are colour-coded based on the magnitude of their velocity. (a) Four 2 min northern hemisphere maps from 00:24–00:26, 00:28–00:30, 00:30–00:32 and 00:32–00:34 UT, respectively. (b) Two 2 min southern hemisphere maps from 00:30–00:32 and 00:32–00:34 UT, respectively. On each northern (southern) hemisphere map, the footpoints of the Cluster spacecraft constellation are shown by the X's (+'s), mapped using the TA15 model.
Owing to the coupled nature of the magnetosphere–ionosphere system, the observed ionospheric convection pattern is indicative of the global-scale magnetospheric convection (Cowley, 1981). In this case, the typical symmetrical twin-cell convection pattern has been rotated clockwise, with the dawn cell extending across into the pre-midnight sector, indicative of convection that has been driven under the influence of a positive IMF By component (e.g. Reistad et al., 2016, 2018). On each northern hemisphere map, the footpoints of the Cluster spacecraft constellation are indicated by the crosses (X), mapped using the TA15 model with the same parameterisation described in Sect. 2.
Figure 4b shows two 2 min integration SuperDARN maps of the southern hemisphere ionospheric convection pattern, beginning at 00:30 UT and ending at 00:34 UT. The associated footpoints of the Cluster spacecraft are indicated by the plus signs (+). Although the coverage of radar data is much less than in the northern hemisphere, there are data in the pre- and post-midnight sectors which appear to be influencing the location of the flow reversal region at the nightside end of the dusk cell. Opposite to the northern hemisphere case, it is the dusk cell in the south which is extending towards or just beyond the midnight meridian. This is also consistent with a large-scale positive IMF By influence, owing to the expected north–south asymmetry of the influence of IMF By in the magnetosphere (e.g. Pettigrew et al., 2010). The significance of these observations is further discussed in Sect. 4.1.
We have presented observations of a dynamic interval of plasma flows and magnetic field in the Earth's magnetotail. In this section we discuss our rationale for interpreting the flows observed by C1 as being inconsistent with the large-scale convection expected based on the spacecraft location and magnetotail untwisting considerations, as well as our alternative interpretation of their relationship to current sheet flapping.
4.1 Evidence for an inconsistency with large-scale magnetotail untwisting
During the 5 min interval studied (00:28–00:33 UT), C1 measured a continually fluctuating Bx component (Fig. 3(i)), indicative of multiple crossings of the tail current sheet. C1 was the only spacecraft to measure this signature across the interval (although similar signatures had been observed a few minutes earlier by C2 and C4). C1 also measured a series of earthward convective magnetotail fast flows with varying dusk–dawn components. The data in Fig. 3(i) and (v) illustrate that when Bx was positive (negative) a duskward (dawnward) v⊥y was generally observed. The observed dawnward flow in the southern hemisphere, in particular, is inconsistent with the expected symmetric duskward flow at the pre-midnight location of C1 which was, however, observed by C3. This suggests that the typical “symmetrical” Dungey Cycle return flow (e.g. Kissinger et al., 2012) cannot provide an explanation for the flow observations made by C1. We thus turn our attention to other possible explanations which we explore in detail, below.
The data in Fig. 3(ii) show that C1 tended to observe a negative By component. According to the magnetotail untwisting hypothesis (e.g. Pitkänen et al., 2015), these flow and magnetic field observations are consistent with a negative IMF By penetration. The IMF data presented in Fig. 2a, on the other hand, revealed that IMF By was generally positive for several hours prior to the fast flow interval (00:28–00:33 UT). Based on the IMF data alone, therefore, one might expect that a positive IMF By will have penetrated into the magnetosphere and thus ought to have determined the “expected” dusk–dawn direction of the flow. In that case, the flows observed here would have a dusk–dawn sense that is not explained by current theoretical models of magnetotail untwisting, meaning they are not IMF By-controlled (e.g. Grocott et al., 2007). There are a number of possible explanations for this discrepancy, and we address each one in turn.
The first possibility is that our conclusion regarding the expected sense of IMF By control is incorrect. As discussed above, the flows observed by Cluster would be consistent with the magnetotail untwisting hypothesis in the case that we had IMF By<0 penetration. We noted in Sect. 3.1 that there were three small negative IMF By excursions prior to our Cluster observations interval. Although the propagation of the IMF to the bow shock is accounted for in the OMNI data, there is uncertainty regarding the time it takes for the IMF By to “propagate” into the magnetotail. Uncertainties in IMF By propagation times (e.g. Case and Wild, 2012) have previously been cited as an explanation for observing an unexpected asymmetry (e.g. Pitkänen et al., 2013). Studies such as Tenfjord et al. (2015, 2017) and Case et al. (2018), for example, have suggested a reconfiguration time (to the prevailing IMF By conditions) for nightside closed field lines of around 40 min. At ∼ 00:28 UT (the beginning of our specific interval of interest), the IMF By had been positive for around 50 min. Based on the Tenfjord timescale, this would thus imply that our interval was wholly IMF By>0 driven. Other studies, on the other hand, such as Browett et al. (2017), have shown that longer timescales of a few hours may be important.
However, for such long timescales to play a role, one would expect to have observed a relatively persistent IMF By component during that time. The integrated IMF By over the hours prior to our interval was certainly convincingly By-positive, and it seems highly unlikely that a few minute-long fluctuations into the opposite IMF By polarity, 1 or 2 h prior to the flows we observed, could have a significant influence. We can thus be confident that positive IMF By was governing the global magnetospheric dynamics in this case.
Despite this convincing argument that the IMF data alone imply a positive IMF By penetration, we performed an additional analysis to further ensure that these negative excursions did not lead to a change in the global nature of the magnetosphere–ionosphere system. We inspected the concurrent northern hemisphere SuperDARN data (presented in Fig. 4a) to provide evidence of the large-scale convection pattern. If the large-scale flow is consistent with a positive IMF By component, then the magnetotail flows that we observed must be deviating from this for some reason and cannot be related to IMF By control. The SuperDARN data indeed confirm that the large-scale morphology of the system was consistent with a positive IMF By component (e.g. Lockwood, 1993; Grocott, 2017; Reistad et al., 2018). This can be inferred from the general shape of the convection pattern, whereby across multiple maps (00:24–00:34 UT) the pattern was rotated clockwise, with the dawn cell having extended into the pre-midnight sector. That this is the expected convection pattern for an IMF By-driven magnetosphere is also supported by the concurrent low level of geomagnetic activity. The Auroral Upper (AU) and Auroral Lower (AL) indices (not shown) confirm that this interval is geomagnetically quiet (AU and |AL| both less than – or of the order of – 10 nT), such that the nightside ionospheric convection asymmetry should be driven by IMF By rather than conductivity-driven features such as the Harang reversal which might otherwise complicate the auroral zone flows (e.g. Grocott et al., 2007, 2008; Reistad et al., 2018).
The validity of the convection observations is further supported by the coverage of nightside data which were used to constrain the model convection pattern. The data used to create a SuperDARN convection map are supplemented by data from a statistical model (in this case Ruohoniemi and Greenwald, 1996), which is typically parameterised by the instantaneous IMF conditions. In the case that there is a lack of real data coverage, a created SuperDARN map will be strongly influenced by the model data, as opposed to real data, and thus would reflect a prediction of convection based on the IMF conditions. The maps shown in Fig. 4a illustrate that there were dozens of SuperDARN vectors in the midnight sector which were fitted to create the global convection maps. To confirm that these data were sufficient and that the observed large-scale convection pattern was not being driven by model data, we parameterised the model in our analysis with IMF By=0. Despite this, a clear IMF By asymmetry exists, thus demonstrating that the observed large-scale IMF By>0 global convection patterns must be data-driven.
A second possible explanation for the discrepancy between the dusk–dawn direction of the local and global-scale convection concerns the certainty with which we can determine the location of the spacecraft with respect to the large-scale convection pattern. The untwisting hypothesis, as considered by Pitkänen et al. (2013, 2017), relies on the assumption that the convection cell to which the spacecraft is connected should be a factor of only hemisphere and the sense of IMF By. In other words, as discussed above, for IMF By>0, the hypothesis dictates that C1 ought to be located on the dawn cell when above the neutral sheet and the dusk cell when below, at least in the case that the spacecraft is close to midnight (Grocott et al., 2007). This might be true statistically, but it does not account for the dusk–dawn location of the spacecraft, which in this case was . If, as a result, the spacecraft was actually located on the dusk cell when above the neutral sheet and on the dawn cell when below the neutral sheet, then the sense of the observed plasma sheet flows would actually be consistent with the large-scale convection.
One way to specify which cell the spacecraft is located within is to map its location onto the ionosphere. This has been done using TA15 and is shown by the crosses (X) on the northern hemisphere convection maps and by plus signs (+) on the southern hemisphere convection maps, in Fig. 4a and b, respectively. For the northern hemisphere maps, there appears to be insufficient scatter to determine the exact division between the dusk and dawn convection cells, such that it is inconclusive as to which cell the Cluster spacecraft map to when above the neutral sheet. If Cluster in fact mapped to the dusk convection cell, however, then the duskward flows in the northern hemisphere plasma sheet observed by C1 would actually be consistent with the large-scale convection pattern. Furthermore, given that the C2–C4 magnetic field observations are consistent with the local By being dominated by magnetotail flaring (as opposed to IMF By) at the pre-midnight location of Cluster, it is likely that we would expect the return sense of the convection to be dominated here by the symmetric (duskward) element both above and below the neutral sheet (see Pitkänen et al., 2019).
If we instead consider the southern hemisphere maps in Fig. 4b, we can be more certain of which cell the spacecraft map to. Owing to the IMF By positive nature of the convection (i.e. the more extended southern hemisphere dusk cell) and the pre-midnight location of the spacecraft, the footpoints are located quite convincingly on the dusk cell. This is despite the dusk–dawn asymmetry being less pronounced than that seen in the northern hemisphere (and the associated poorer coverage of southern hemisphere SuperDARN data). When below the neutral sheet, C1 observed dawnward flows, meaning it would have to have been on the southern hemisphere dawn cell to be consistent with the large-scale convection, which is clearly not the case. Indeed, the observed dawnward flow in the southern hemisphere at this location could only be interpreted in terms of the untwisting hypothesis for a situation where we had clear IMF By<0 penetration (and associated extended dawn cell), which has already been ruled out. C3, meanwhile, continually observed duskward flow, which appears to be consistent with the larger-scale convection. It seems much more likely, therefore, that C1 observed flow that was associated with localised magnetic field dynamics rather than being a signature of the large-scale convection.
4.2 Evidence for a local perturbation in the magnetotail
The lack of consistency with the large-scale convection leads us to a third explanation for our observations, which is that there is a local perturbation within the tail that is independent of any large-scale, IMF By-controlled asymmetry associated with magnetotail untwisting. This is supported by the observations from the other Cluster spacecraft. The low level of flow seen by C3 is mostly duskward (Fig. 3(v)), which would be consistent with untwisting for IMF By>0, given its southern hemisphere location. We note, however, that due to the pre-midnight location of C3, one would also rightly expect to observe duskward flow even in the case that there was no IMF By>0 control (e.g. Kissinger et al., 2012). Further, in Fig. 2b(v), up until the rapid Bx variations began at ∼ 00:24 UT, fast duskward flow in the southern hemisphere was also seen by C1. The fact that C3 continued to then observe steady duskward flow and no significant Bx change suggests that the change in the nature of the C1 observations after 00:24 UT must in fact be due to some localised process that was responsible for driving the dawnward component of the flows which was only observed by C1.
This idea of a local perturbation is also supported by the variations in the local By component. Figure 3(ii) illustrates the in situ variations in By with time across the interval. Despite there clearly being positive IMF By penetration globally (as confirmed by inspection of the OMNI and SuperDARN data), C1, C2 and C4 all recorded mostly negative local By values. In the studies of, for example, Pitkänen et al. (2013, 2017), this observation would have been offered as evidence of a negative of IMF By penetration, thus supporting the untwisting hypothesis. However, it is important to note that a negative local By component may be wholly consistent with positive IMF By. There are, in fact, multiple sources of By in the tail, such as magnetotail flaring (Fairfield, 1979), as well as tilt effects and current sheet warping (see Petrukovich et al., 2005), in addition to a penetration of the IMF By. To fully interpret the magnetic field observations, we must therefore consider the possible effects of these phenomena on the presence of By in the tail at the specific location of each spacecraft.
To aid in this interpretation, we present TA15 model magnetic field data in Fig. 5 to provide an indication of the expected background By component at the time of our interval. These data, from , are plotted against Y (GSM) position on the horizontal axis and against the Bx component on the vertical axis. We have reversed the conventional direction of the horizontal axis (negative to positive from left to right) to be consistent with a view looking earthward from downtail. In Fig. 5a we show the field for the case that IMF By=0 and in Fig. 5b the case that IMF nT (the 1 h mean-averaged IMF By in the hour prior to 00:28 UT). The first conclusion we can make from consideration of the By component in Fig. 5a is how, even under no IMF By penetration, a “background” By value will exist in the tail purely dependent on location. In such a “symmetric” tail, one would expect the background By value to appear as one moves away from midnight toward the dusk–dawn flanks, as well as further above and below the neutral sheet. Pre-midnight, we would expect to observe negative By above the neutral sheet (Bx>0) and positive By below the neutral sheet (Bx<0), with the opposite effect post-midnight. This is the well-known magnetotail flaring effect (Fairfield, 1979).

Figure 5TA15 model magnetic field data. In each case, plotted is Y vs. Bx (GSM) (at , i.e. the X position of C1 at ∼ 00:28 UT on 12 October 2006), with the TA15 modelled By value shown by the colour bar on the right. The black triangle shows the Y location of C1, at Bx=0. In panel (a) we have imposed IMF By=0, and for panel (b) we have used the 1 h mean-averaged IMF By (+1.56 nT) in the hour prior to 00:28 UT.
The data in Fig. 5a also show the effect of the negative (tailward) dipole tilt (as appropriate to our study interval) and current sheet warping on the local By component. According to Petrukovich (2011), the current sheet warping (controlled by the dipole tilt) is expected to add a negative By component pre-midnight and a positive By component post-midnight. Furthermore, the “even tilt” effect is expected to add a negative By component to both the pre- and post-midnight sectors for a negative tilt. This leads to the effect seen in Fig. 5a where in the pre-midnight sector the location of the By polarity change occurs in the southern hemisphere (at nT).
Figure 5b illustrates the scenario relevant to our case study, where we have additionally a global positive IMF By penetration. This additional positive By has the effect of moving the location of the pre-midnight By polarity change back up towards the neutral sheet. This explains why the Cluster spacecraft observed By≈0 at times of Bx≈0 during the few tens of minutes prior to our interval, as noted in Sect. 3.2. This also explains why C2–C4 observed the polarity of By that they did throughout the interval. It is thus clear that positive IMF By penetration does not mean we should expect to observe positive By everywhere in the tail; rather, it simply means that there is expected to be some positive By perturbation to the already present background By at a particular location. As Fig. 5b demonstrates, C2 and C4 (located above the neutral sheet) are expected to have observed negative By even though positive IMF By has penetrated into the magnetotail, illustrating that the flaring effect is generally dominant at the spacecraft location. The background By expected at their location (pre-midnight, Bx>0) is negative, and the IMF By-associated perturbation was not large enough to enforce a sign change in By.
The Cluster spacecraft in our study were all located pre-midnight (+Y GSM). From Fig. 3, C2 and C4 observed positive Bx and negative By, and at ∼ 00:28 UT they were located at around (Fig. 1). C3, however, observed negative Bx and positive By, and it was located at around . The location of the neutral sheet at UT can therefore be said (locally) to have been somewhere between −1 and −2.5RE in Z. C1 was located at around and, throughout the 5 min interval, observed a Bx which continually fluctuated from positive to negative yet observed mostly weakly negative By. For By to have remained negative despite C1 moving above and below the neutral sheet, suggests that there was a By negative kink in the magnetotail that was localised to the vicinity of C1. This is further supported by the fact that numerous (albeit brief) positive By excursions occurred when C1 was above the neutral sheet (as noted in Sect. 3.2). We use the term kink to highlight a deformation in the nearby field lines which results in the observed perturbations to the local By component. We suggest that this deformation could be relatively small in terms of field line length, much like a kink in a cable or wire. In the following section, we investigate this kink in relation to the observed current sheet flapping.
4.3 Evidence for current sheet flapping as a source of the asymmetric flows
If a localised magnetic field perturbation was associated with the lack of observation of the expected dusk–dawn flow for magnetotail untwisting, investigating its cause seems a worthwhile endeavour. The clear sinusoidal-like variation in Bx observed by C1, which is evidence of current sheet flapping (e.g. Runov et al., 2009), provides us with a starting point for this investigation. This flapping must be either highly localised or low in amplitude, as at the time of our 5 min flow interval (00:28–00:33 UT) only C1 observed the flapping. Minimum Variance Analysis (Sonnerup and Cahill, 1967) suggests that the flapping was a kink-like wave which was propagating dawnward (Rong et al., 2015; Wu et al., 2016) and therefore may have been a source of the observed dusk–dawn flow.
The causes of current sheet flapping have been discussed previously (Runov et al., 2009; Wei et al., 2019). One such cause has been attributed to localised, periodical reconnection – a process known to drive bursty bulk flows (BBFs) in the magnetotail (Angelopoulos et al., 1994; Zhang et al., 2016). In fact, BBFs excited directly as a result of reconnection in the tail have been previously linked to magnetic fluctuations in the current sheet (Nakamura et al., 2009; Wu et al., 2016). Examining the data presented in Fig. 3(iii) and (iv), we note that C1 measured a generally positive Bz, with a few negative blips, as well as continually fast (vx>200 km s−1) earthward flow, peaking at over 370 km s−1 with bursts of enhanced convective flow (vx>200 km s−1) also apparent. These observations are fairly consistent with (if slightly slower than) the original definition of a BBF (Angelopoulos et al., 1994). This, along with the absence of similar flow observations in the C3 data, suggests that C1 may have been located earthward of a localised reconnection site (owing to Bz>0), where persistent, localised reconnection was exciting fast earthward flow. The reconnection process may then have been driving the current sheet flapping, inducing the localised kink in the field and ultimately controlling the dusk–dawn direction of the convective flow.
It is well known that the magnetic tension force is responsible for the acceleration of plasma following reconnection (Karlsson et al., 2015). Our observations of a dusk–dawn flow component may be related to the localised magnetic tension forces driving and directing plasma flows in association with the flapping. In order to provide some scope to this suggestion, we attempted to find the direction of the J×B forces acting on the plasma. We used the curlometer technique (Dunlop et al., 1988, 2002) to estimate the average current density, J, flowing through the volume bound by the spacecraft tetrahedron. The J×B force density [N m−3] is then calculated, firstly, by taking the cross product of J with the average magnetic field vector B from the four spacecraft (BAVG). We also calculate J×B using solely B from C1 (BC1), in order to provide a more local estimate for J×B at the location of C1.
In order to check the validity of using the curlometer approach, we calculated the quality parameter, Q, defined as . It is generally accepted that a value of Q<0.5 is required for a current estimate to be valid. Hence, the value of Q, along with due consideration of the spacecraft configuration and its orientation relative to the magnetic field structure, may be used as a monitor of how reliable the curlometer approach is (Dunlop et al., 2002). This is discussed further below, in reference to the analysis shown in Fig. 6.
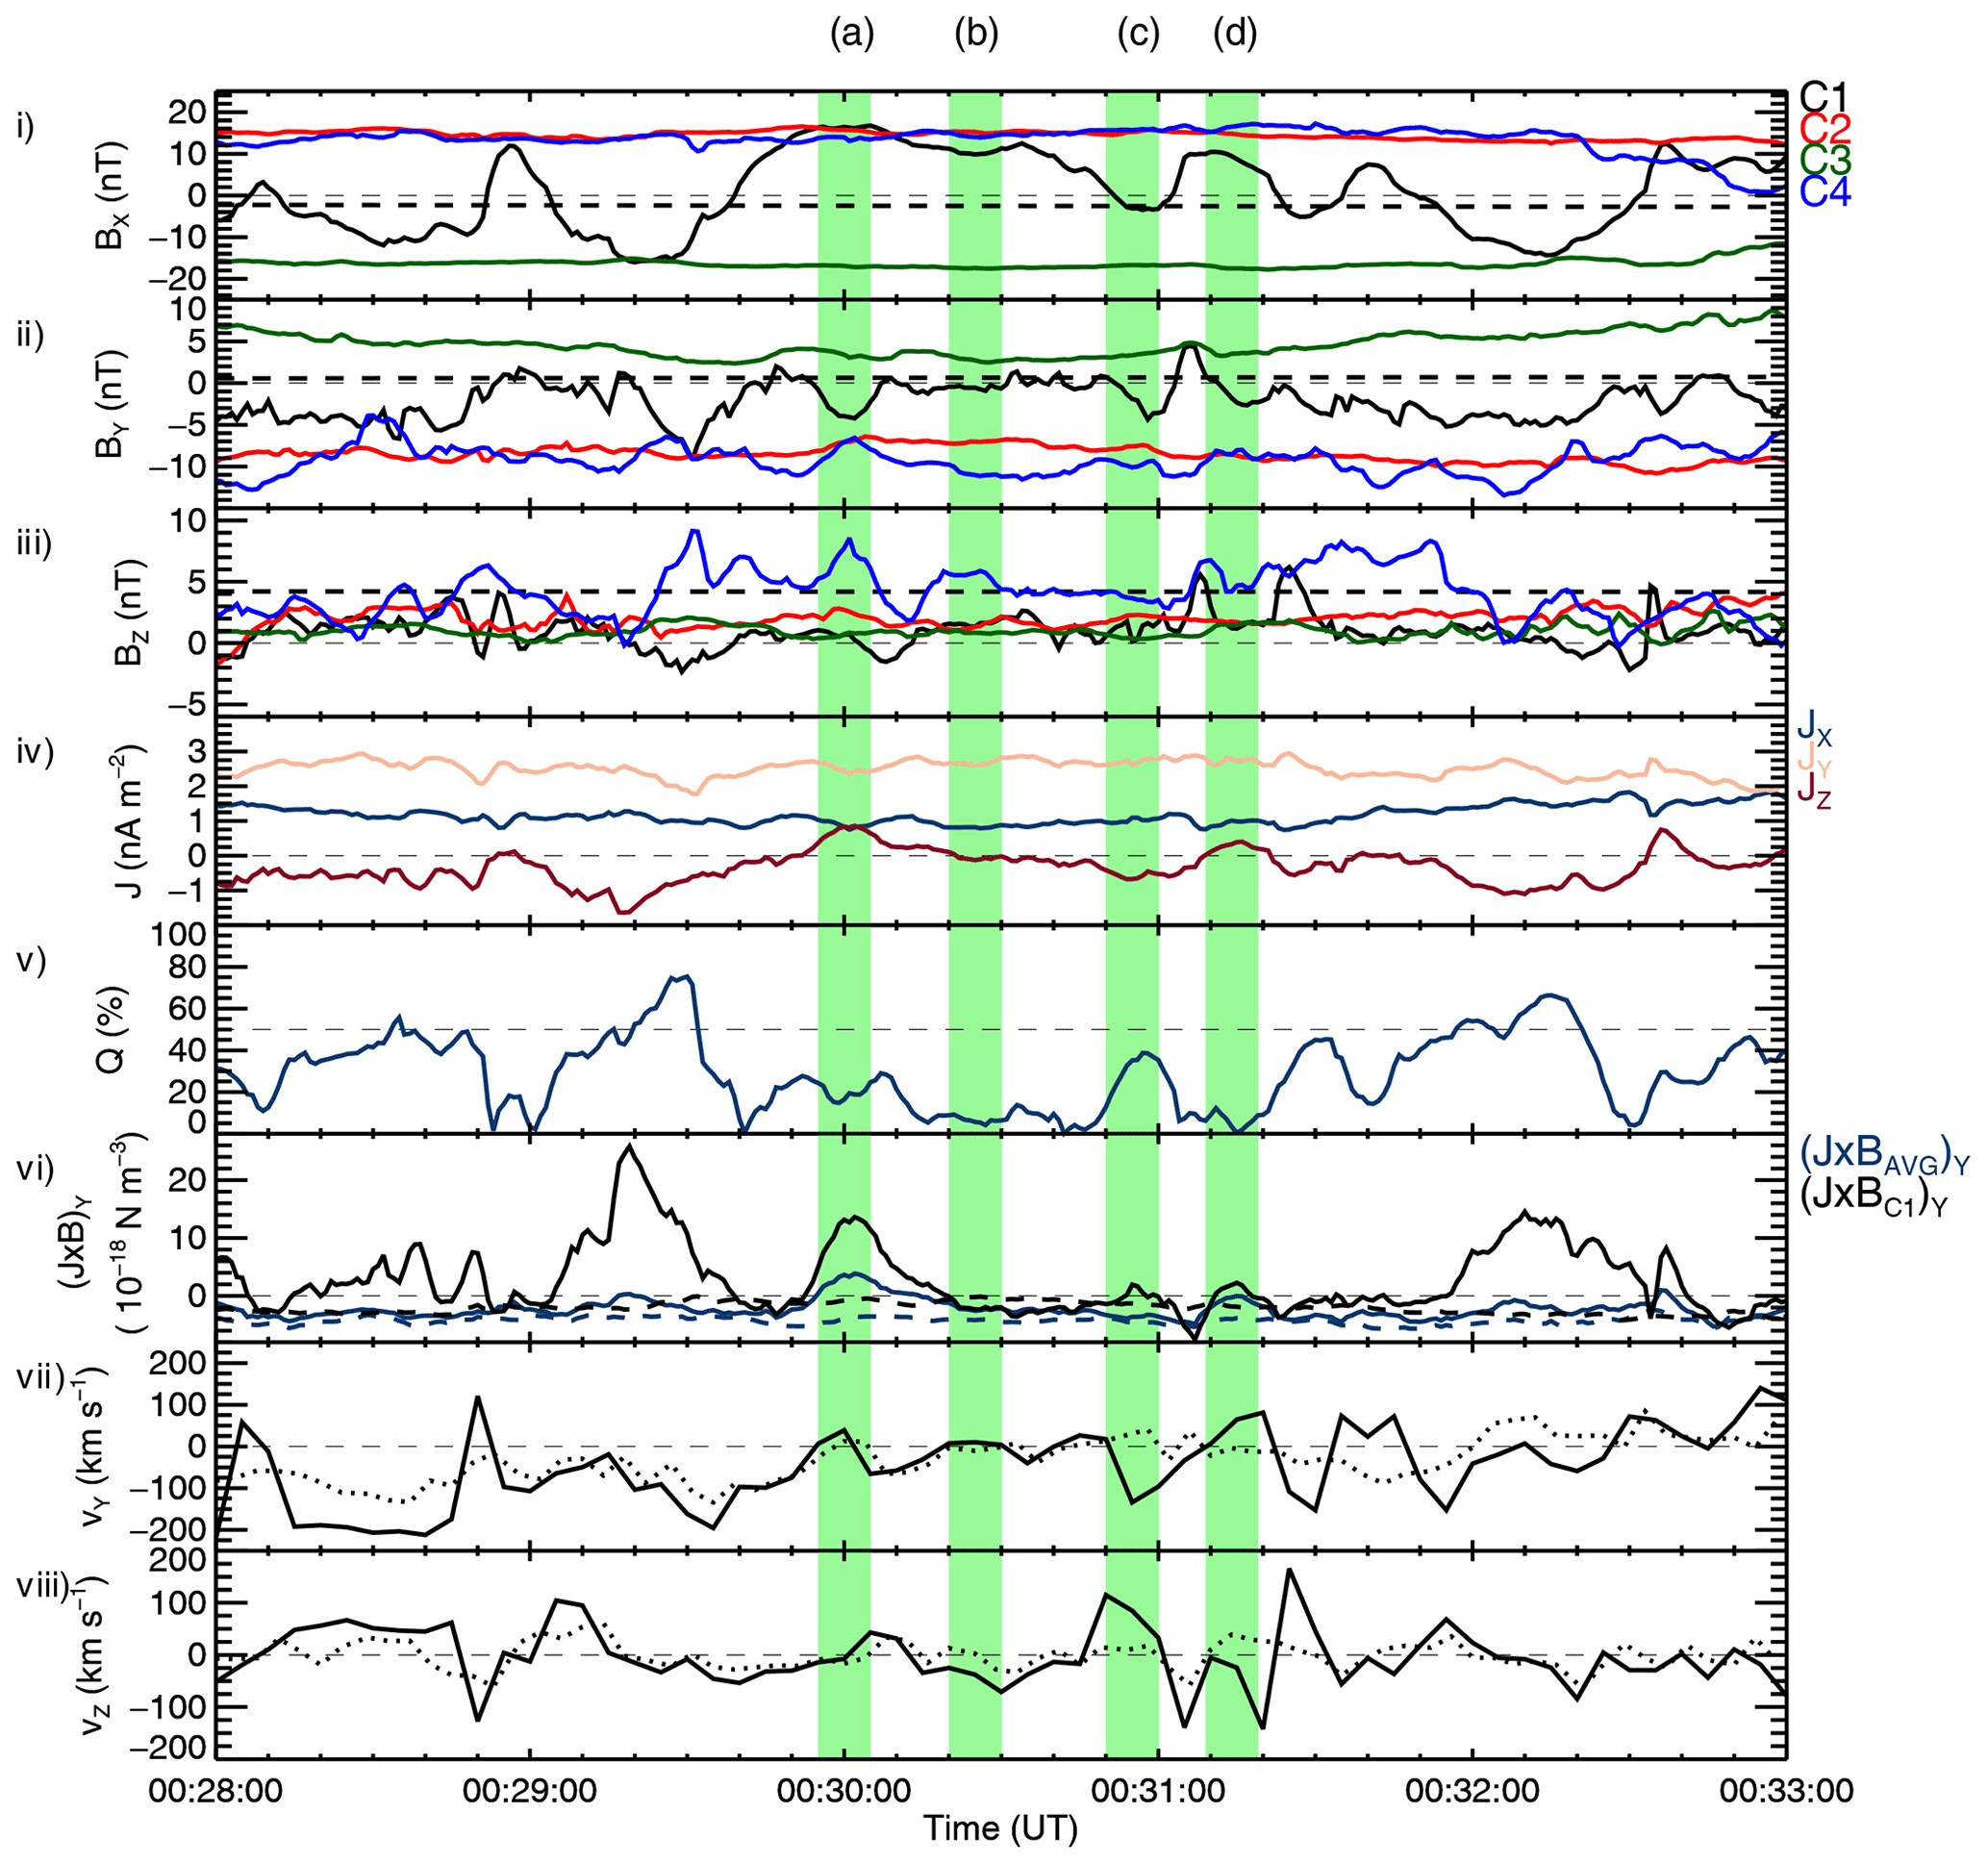
Figure 6(i–iii) The local magnetic field vector B (Bx, By, Bz) observed by C1–C4, as shown previously (solid lines), and the TA15 modelled B vector for C1 (dashed black lines). (iv) The components of the current density vector J (Jx, Jy, Jz), (v) Q, (vi) (J×BAVG)y (solid blue line) and (J×BC1)y (solid black line). The dashed blue and black lines indicate the equivalent calculation where the TA15 model B field of C1 has been used (see the text). (vii) vy (v⊥y in solid lines), observed by C1, and (viii) vz (v⊥z in solid lines), also observed by C1. The green highlighted regions labelled (a–d) correspond to four specific time windows of interest (discussed in the text).
Shown in Fig. 6(i–iii) are the local magnetic field Bx, By and Bz components, as presented previously. In Fig. 6(iv) are the current density Jx, Jy and Jz components determined from the curlometer analysis. In Fig. 6(vi) is the dusk–dawn component of J×BAVG and J×BC1. Finally, in Fig. 6(vii) and (viii) are the dusk–dawn and north–south components of the flow (and field-perpendicular flow) observed by C1, as shown previously. In Fig. 6(i–iii), the dashed black line represents the TA15 modelled magnetic field (see Sect. 4.2) at the location of C1. In Fig. 6(vi) the dashed blue and black lines represent the (J×BAVG)y and (J×BC1)y forces, respectively, where J and J×B have been computed using the model field at the location of C1 and the true magnetic fields measured by C2–C4. These “model (J×B)y forces” have been computed to provide an illustration of what one would expect the “unperturbed” magnetic field of C1 and the associated (J×B)y force to look like, in the absence of any dynamical effects such as current sheet flapping or field line “kinking”. In both cases, the model (J×B)y forces are weakly dawnward, consistent with the “background curvature” of the magnetic field at this pre-midnight location (see Fig. 7). Figure 6(v) suggests that our curlometer approach is generally appropriate, as Q mostly remains below 50 % (horizontal dashed line) for the 5 min interval. We note that, unlike in previous studies which have used the curlometer technique at inter-spacecraft separation distances of ≪1RE (e.g. Dunlop et al., 2002; Runov et al., 2003), in our case the Cluster spacecraft separation is large (1RE). Therefore, the curlometer is likely to be an underestimate of the true current at these scale sizes. Critically, however, the spacecraft configuration is such that the estimate of the direction of the currents should be stable. Thus, although the volume enclosed by the spacecraft is greater than the scale sizes of the current sheet flapping and kink, a reliable estimate of the direction of the net J×B force within the enclosed volume may still be obtained.
Two key features of Fig. 6 are apparent. Firstly, it appears as though the perturbations to (J×B)y are mostly associated with the magnetic field perturbations generally only observed by C1. This is made apparent by comparing (J×BC1)y with (J×BAVG)y, where the perturbations are much larger in magnitude for (J×BC1)y. We also note that both (J×BAVG)y and (J×BC1)y are effectively always positive with respect to their model equivalents. However, (J×BAVG)y is still mostly net negative whereas (J×BC1)y is net positive. This suggests that using BC1, rather than BAVG in calculating (J×B)y has overall reduced the effects of the larger-scale background field curvature (incorporated by including the other spacecraft). Second, the magnetic field and flow dynamics evident in Fig. 6 appear to almost always be associated with positive (duskward) enhancements in (J×B)y, in contrast to the model dawnward sense of (J×B)y. This is particularly evident in the case of (J×BC1)y but also generally true in the case of (J×BAVG)y. We therefore suggest that the dynamic behaviour of (J×B)y is simply consistent with the localised kinks and flapping in the magnetic field that are associated with the transient perturbations to the dusk–dawn flow observed by C1.
4.4 Visualisation of the observed dynamics
In an effort to visualise these plasma sheet dynamics, we show in Fig. 7 a series of sketches that attempt to associate the observed magnetic field perturbations with the observed dusk–dawn convective flows. The panels correspond to the four time windows indicated in Fig. 6 by the highlighted regions labelled a–d. In each panel, we indicate the approximate relative position of the four Cluster spacecraft in GSM coordinates, and the appropriate sense of By measured by each spacecraft is shown by the purple arrows at each spacecraft location (the Z component of the field was in fact generally small, and has been exaggerated here for illustrative purposes). We also superimpose nominal plasma sheet field lines (again with an exaggerated extent in Z) that display the sense of By implied by the TA15 data presented in Fig. 5 (long blue curved arrows). The dashed lines represent the location of the neutral sheet at the end of each time window. This is tilted slightly, as appropriate for IMF By>0, but with the end state of the “flap” of the current sheet implied by the sign of Bx observed by C1. In red is the perturbation to the field implied by the sign of By observed by C1.
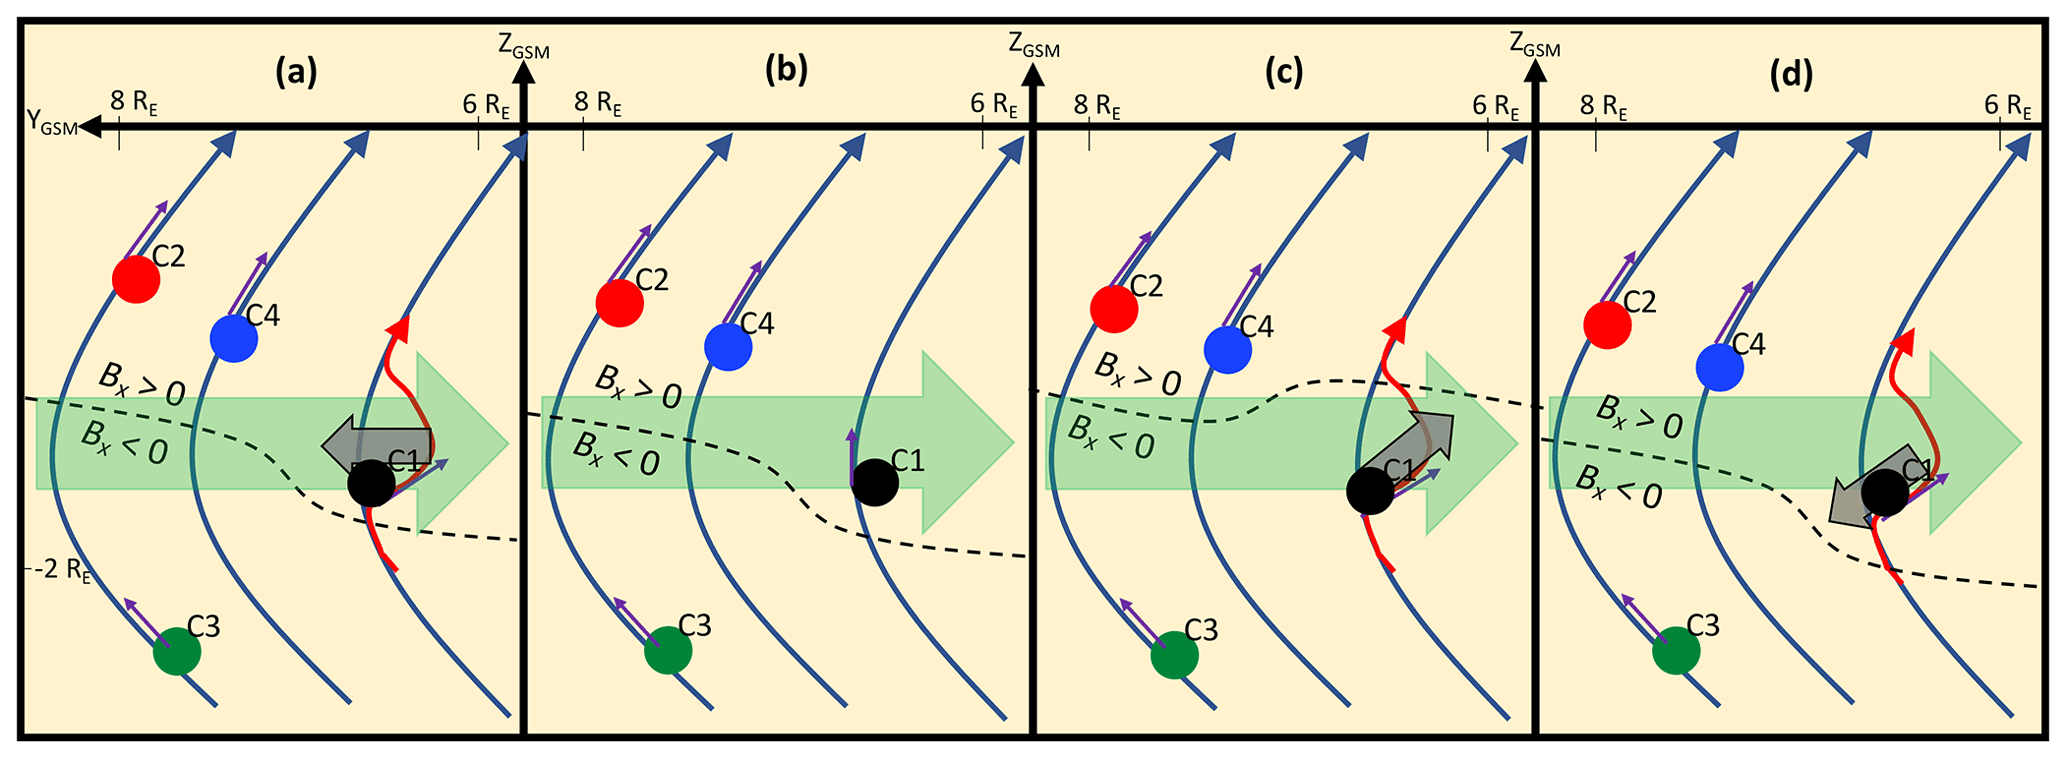
Figure 7Schematic diagrams of the observed magnetic field perturbations and dusk–dawn convective flows during the time windows indicated in Fig. 6 by the highlighted regions. The approximate locations of the four Cluster spacecraft relative to one another in the Y–Z GSM plane are indicated (not to scale) by the coloured circles. The curved blue arrows represent magnetic field lines, and the short purple arrow indicates the local sense of By at the location of each spacecraft. The dashed black line indicates the current sheet. In panels (a), (c) and (d), the curved red arrow shows the “kinked” magnetic field line. The long thick green arrow shows the direction of the model (J×B)y force associated with the background curvature of the magnetic field, and the small thick grey arrow shows the direction of the dusk–dawn convective flow observed by C1.
In Fig. 7a C1 is located above the current sheet and measured negative By. A weakly duskward convective flow was observed at this time (as indicated by the thick grey arrow), consistent with the duskward sense of the (J×B)y force, and opposite to the sense of the model (J×B)y force associated with the background curvature of the magnetic field. In Fig. 7b, C1 is still above the current sheet but measured By≈0 and no dusk–dawn convective flow. In Fig. 7c C1 is shown below the current sheet, where the background By would be positive (see Fig. 5b). C1 instead observed an increasingly negative By, which we suggest is associated with the presence of the kink in the field. At the same time, C1 also observed a convective plasma flow with dawnward and slightly upward (+Z) component (thick grey arrow). We therefore suggest that the flow was associated with the upward/dawnward flap of the current sheet, and the dawnward sense of the flow likely also resulted in the increase in negative By seen during the time window shown in Fig. 6c. The positive (J×BC1)y at this time, whilst inconsistent with the dawnward sense of the flow, is therefore consistent with the curvature of the magnetic field associated with the kink. (J×BAVG)y, meanwhile, was negative, likely due to incorporating the larger-scale background curvature of the magnetic field observed by the other spacecraft. In Fig. 7d, C1 is shown above the current sheet, where it observed a weakly negative By. In this case, C1 observed a convective plasma flow with duskward and slightly downward (−Z) component. Similarly to in Fig. 7a, this flow occurred in concert with a positive enhancement in (J×B)y relative to the model (J×B)y. This flow would therefore seem to be associated with the downward flap of the current sheet, and its duskward sense could indicate that it is acting to reduce the negative kink in By that is apparent over the time window shown in Fig. 6d.
Whilst we acknowledge a degree of uncertainty in the details of the interpretation presented above of the specific relationship between the flows and the field, it serves to illustrate three observations about this interval of which we can be very certain. (1) The IMF, ionospheric convection and comparison of the plasma sheet magnetic field observations to the TA15 model field all lead to the expectation of an IMF By>0 large-scale asymmetry in the magnetosphere. (2) The Cluster 1 spacecraft observed convective flow with a dusk–dawn component that was inconsistent with current theories of IMF By-induced dusk–dawn flows associated with magnetotail untwisting. Notably, the observed dawnward flow in the southern hemisphere, whilst inconsistent with IMF By>0, was also inconsistent with the expected (symmetric) duskward flow at this pre-midnight location even in the absence of IMF By control. (3) Magnetic field perturbations that were indicative of a localised current sheet flapping and dusk–dawn kink in the field occurred coincident with the flows. It therefore seems likely that in this case the IMF By-driven asymmetry or indeed the symmetric flow expected at the spacecraft location was being overridden by the localised dynamics in governing the dusk–dawn component of the flow.
We have presented a case study from 12 October 2006 revealing a dynamic interval of plasma flows and current sheet flapping, observed by the Cluster 1 spacecraft. The key observations presented in this study may be summarised as follows:
-
The OMNI data revealed that the IMF By had been positive for several hours prior to our interval of Cluster data, with the exception of three short-lived negative excursions.
-
The SuperDARN ionospheric convection observations revealed a large-scale asymmetry consistent with IMF By>0, confirming the absence of a large-scale asymmetry in the flow pattern that might explain the dawnward flows observed by C1.
-
C1 observed a changing Bx magnetic field component and associated duskward () flow when in the northern magnetic hemisphere and dawnward () flow in the southern magnetic hemisphere.
-
The C2, C3 and C4 magnetic field observations suggested that the local By was being dominated by magnetotail flaring, as opposed to IMF By. C3 also observed duskward flow in the southern magnetic hemisphere, consistent with the symmetric flow expected owing to the pre-midnight location of the spacecraft.
Contrary to the results of a number of previous studies in the literature, during this particular interval, the dusk–dawn sense of the convective magnetotail flows (v⊥y) and, in particular, the dawnward flow observed in the southern hemisphere do not agree with expectations based on the theoretical understanding of global magnetotail untwisting and the prevailing positive IMF By conditions; they also do not agree with expectations based on the location of the spacecraft and associated magnetotail flaring. We instead attribute the flows to a localised magnetic field perturbation or kink in the magnetotail, which appears to have been independent of any large-scale dynamics and may have instead been related to the observed current sheet flapping. We attributed the current sheet flapping to being driven by localised reconnection, itself inferred from the presence of the observed bursty fast earthward flow (vx≈200 km s−1). Analysis using the curlometer technique suggests that the (J×B)y force is consistent with the localised kinks and flapping in the magnetic field that are associated with the transient perturbations to the dusk–dawn flow observed by C1.
Although evidence for the large-scale penetration of IMF By>0 is apparent, the IMF By>0 penetration at the location of C1 appears to have been unable to override the variable dusk–dawn flow associated with the current sheet flapping. Further studies by the authors are currently underway to determine if such flows are a frequent occurrence and to consider and account for localised tail dynamics more fully in a statistical analysis of the magnetotail flows.
The Cluster data used in this study are available from the Cluster Science Archive at https://www.cosmos.esa.int/web/csa (Laakso et al., 2010). The solar wind and IMF data are available from OMNIWeb at https://omniweb.gsfc.nasa.gov (King and Papitashvili, 2005). The SuperDARN data were accessed using the BAS data mirror at http://bslsuperdarnc.nerc-bas.ac.uk:8093/docs (Breen, 2016) and processed using the Radar Software Toolkit v4.2 from https://doi.org/10.5281/zenodo.1403226 (Thomas et al., 2018). The auroral electrojet indices data were acquired from http://wdc.kugi.kyoto-u.ac.jp/aedir/ (Odagi et al., 2020).
JHL processed the data, performed the data analysis and drafted the manuscript. AG, NAC, and MTW all made substantial and ongoing contributions toward the interpretation and discussion of the observations, in addition to the writing of the article.
The contact author has declared that neither they nor their co-authors have any competing interests.
Publisher's note: Copernicus Publications remains neutral with regard to jurisdictional claims in published maps and institutional affiliations.
The authors would like to thank the Fluxgate Magnetometer (FGM) and Cluster Ion Spectrometry (CIS) teams as part of the Cluster mission and OMNIWeb for providing the solar wind and IMF data. We would also like to acknowledge the use of SuperDARN data. SuperDARN is a collection of radars funded by the national scientific funding agencies of Australia, Canada, China, France, Italy, Japan, Norway, South Africa, United Kingdom and United States of America, and we thank the international principal investigator team for providing the data. We would also like to thank the WDC for Geomagnetism, Kyoto, for use of the auroral electrojet indices. Additionally, we are grateful to Haje Korth for providing the IDL Geopack DLM containing the Tsyganenko magnetic field model routines and coordinate system conversions, and we wish to thank Nikolai Tsyganenko for useful discussion of his magnetic field models. Furthermore, we are thankful for the advice of Malcolm Dunlop regarding the applicability of the curlometer technique at large spacecraft separations. Finally, we would also like to thank the reviewers for their very helpful suggestions which improved the article.
This research has been supported by UK Research and Innovation (grant no. ST/R000816/1; Nathan A. Case, Adrian Grocott; and grant nos. NE/P001556/1 and NE/T000937/1; Maria-Theresia Walach, Adrian Grocott) and a Lancaster University Faculty of Science and Technology studentship (James H. Lane).
This paper was edited by Minna Palmroth and reviewed by three anonymous referees.
Angelopoulos, V., Baumjohann, W., Kennel, C. F., Coroniti, F. V., Kivelson, M. G., Pellat, R., Walker, R. J., Lühr, H., and Paschmann, G.: Bursty bulk flows in the inner central plasma sheet, J. Geophys. Res., 97, 4027–4039, https://doi.org/10.1029/91JA02701, 1992.
Angelopoulos, V., Kennel, C. F., Coroniti, F. V., Pellat, R., Kivelson, M. G., Walker, R. J., Russell, C. T., Baumjohann, W., Feldman, W. C., and Gosling, J. T.: Statistical characteristics of bursty bulk flow events, J. Geophys. Res., 99, 21257–21280, https://doi.org/10.1029/94JA01263, 1994.
Balogh, A., Carr, C. M., Acuña, M. H., Dunlop, M. W., Beek, T. J., Brown, P., Fornacon, K. -H., Georgescu, E., Glassmeier, K.-H., Harris, J., Musmann, G., Oddy, T., and Scwingenschuh, K.: The Cluster magnetic field, Ann. Geophys., 19, 1207–1217, https://doi.org/10.5194/angeo-19-1207-2001, 2001.
Baumjohann, W., Paschmann, G., and Cattell, C. A.: Average Properties in the Central Plasma Sheet, J. Geophys Res., 94, 6597–6606, https://doi.org/10.1029/JA094iA06p06597, 1989.
Breen, P. M.: SuperDARN Mirror Catalogue API 3.0, available at: http://bslsuperdarnc.nerc-bas.ac.uk:8093/docs/index.html (last access: 28 July 2021), 2016.
Browett, S. D., Fear, R. C., Grocott, A., and Milan, S. E.: Timescales for the penetration of IMF By into the Earth's magnetotail, J. Geophys. Res.-Space, 122, 579–593, https://doi.org/10.1002/2016JA023198, 2017.
Cao, J. B., Ma, Y. D., Parks, G., Rème, H., Dandouras, I., Nakamura, R., Zhang, T. L., Zong, Q., Lucek, E., Carr, C. M., Liu, Z. X., and Zhou, G. C.: Joint observations by Cluster satellites of bursty bulk flows in the magnetotail, J. Geophys. Res., 111, A04206, https://doi.org/10.1029/2005JA011322, 2006.
Case, N. A. and Wild, J.: A statistical comparison of solar wind propagation delays derived from multispacecraft techniques, J. Geophys Res., 117, A02101, https://doi.org/10.1029/2011JA016946, 2012.
Case, N. A., Grocott, A., Haaland, S., Martin, C. J., and Nagai, T.: Response of the Earth's Neutral Sheet to Reversals in the IMF By component, J. Geophys. Res., 123, 8206–8218, https://doi.org/10.1029/2018JA025712, 2018.
Chisham G., Lester, M., Milan, S. E., Freeman, M. P., Bristow, W. A., Grocott, A., McWilliams, K. A., Ruohoniemi, J. M., Yeoman, T. K., Dyson, P. L., Greenwald, R. A., Kikuchi, T., Pinnock, M., Rash, J. P. S., Sato, N., Sofko, G. J., Villain, J.-P., and Walker, A. D. M.: A decade of the Super Dual Auroral Radar Network (SuperDARN): scientific achievements, new techniques and future directions, Surv. Geophys., 28, 33–109, https://doi.org/10.1007/s10712-007-9017-8, 2007.
Cowley, S. W. H.: Magnetospheric asymmetries associated with the y-component of the IMF, Planet Space Sci., 29, 79–96, https://doi.org/10.1016/0032-0633(81)90141-0, 1981.
Dungey, J. W.: Interplanetary magnetic field and the auroral zones, Phys. Rev. Lett., 6, 47–48, https://doi.org/10.1103/PhysRevLett.6.47, 1961.
Dunlop, M. W., Southwood, D. J., Glassmeier, K.-H., and Neubauer, F. M.: Analysis of multipoint magnetometer data, Adv. Space Res., 8, 273–277, https://doi.org/10.1016/0273-1177(88)90141-X, 1988.
Dunlop, M. W., Balogh, A., Glassmeier, K.-H., and Robert, P.: Four-point Cluster application of magnetic field analysis tools: The Curlometer, J. Geophys. Res., 107, 1384, https://doi.org/10.1029/2001JA005088, 2002.
Escoubet, C. P., Fehringer, M., and Goldstein, M.: The Cluster Mission, Ann. Geophys., 19, 1197–1200, https://doi.org/10.5194/angeo-19-1197-2001, 2001.
Fairfield, D. H.: On the Average Configuration Of The Geomagnetic Tail, J. Geophys. Res., 84, 1950–1958, https://doi.org/10.1029/JA084iA05p01950, 1979.
Frühauff, D. and Glassmeier, K.-H.: Statistical analysis of magnetotail fast flows and related magnetic disturbances, Ann. Geophys., 34, 399–409, https://doi.org/10.5194/angeo-34-399-2016, 2016.
Grocott, A.: Time Dependence of Dawn-Dusk Asymmetries in the Terrestrial Ionospheric Convection Pattern, in: Dawn-Dusk Asymmetries in Planetary Plasma Environments, edited by: Haaland, S., Runov, A., and Forsyth, C., the American Geophysical Union, Washington, DC, and John Wiley & Sons, Inc, Hoboken, USA, 107–123, 2017.
Grocott, A., Badman, S. V., Cowley, S. W. H., and Cripps, P. J.: The influence of the IMF By on the nature of the nightside high-latitude ionospheric flow during intervals of positive IMF Bz, Ann. Geophys., 22, 1755–1764, https://doi.org/10.5194/angeo-22-1755-2004, 2004a.
Grocott, A., Yeoman, T. K., Cowley, S. W. H., and Rème, H.: Multi-instrument observations of bursty bulk flows and their ionospheric counterparts, in: Proc. Seventh Internat. Conf. on Substorms, FMI, Helsinki, Finland, UDK-52-854, 107–110, 2004b.
Grocott, A., Yeoman, T. K., Nakamura, R., Cowley, S. W. H., Frey, H. U., Rème, H., and Klecker, B. J.: Multi-instrument observations of the ionospheric counterpart of a bursty bulk flow in the near-Earth plasma sheet, Ann. Geophys., 22, 1061–1075, https://doi.org/10.5194/angeo-22-1061-2004, 2004c.
Grocott, A., Yeoman, T. K., Milan, S. E., and Cowley, S. W. H.: Interhemispheric observations of the ionospheric signature of tail reconnection during IMF-northward non-substorm intervals, Ann. Geophys., 23, 1763–1770, https://doi.org/10.5194/angeo-23-1763-2005, 2005.
Grocott, A., Yeoman, T. K., Milan, S. E., Amm. O., Frey, H. U., Juusola, L., Nakamura, R., Owen, C. J., Rème, H., and Takada, T.: Multi-scale observations of magnetotail flux transport during IMF-northward non-substorm intervals, Ann. Geophys., 25, 1709–1720, https://doi.org/10.5194/angeo-25-1709-2007, 2007.
Grocott, A., Milan, S. E., and Yeoman, T. K.: Interplanetary magnetic field control of fast azimuthal flows in the nightside high-latitude ionosphere, Geophys. Res. Lett., 35, L08102, https://doi.org/10.1029/2008GL033545, 2008.
Haaland, S., Runov, A., and Forsyth, C.: Dawn-Dusk Asymmetries in Planetary Plasma Environments, in: Geophysical Monograph 230, 1st Edn., the American Geophysical Union, Washington, DC, and John Wiley & Sons, Inc, Hoboken, USA, 2017.
Karlsson, T., Hamrin, M., Nilsson, H., Kullen, A., and Pitkänen, T.: Magnetic forces associated with bursty bulk flows in the Earth's magnetotail, Geophys. Res. Lett., 42, 3122–3128, https://doi.org/10.1002/2015GL063999, 2015.
Khurana, K. K., Walker, R. J., and Ogino, T.: Magnetospheric convection in the presence of interplanetary magnetic field By: A conceptual model and simulations, J. Geophys. Res., 101, 4907–4916, https://doi.org/10.1029/95JA03673, 1996.
Kiehas, S. A., Runov, A., Angelopoulos, V., Hietala, H., and Korovinksiy, D.: Magnetotail Fast Flow Occurrence Rate and Dawn-Dusk Asymmetry at , J. Geophys. Res.-Space, 123, 1767–1778, https://doi.org/10.1002/2017JA024776, 2018.
King, J. H. and Papitashvili, N. E.: Solar wind spatial scales in and comparisons of hourly Wind and ACE plasma and magnetic field data, J. Geophys. Res., 110, A02104, https://doi.org/10.1029/2004JA010649, 2005.
Kissinger, J., McPherron, R. L., Hsu, T.-S., and Angelopoulos, V.: Diversion of plasma due to high pressure in the inner magnetosphere during steady magnetospheric convection, J. Geophys. Res., 117, A05206, https://doi.org/10.1029/2012JA017579, 2012.
Kubyshkina, D. I., Sormakov, D. A., Sergeev, V. A., Semenov, V. S., Erkaev, N. V., Kubyshkin, I. V., Ganushkina, N. Y., and nd Dubyagin, S. V.: How to distinguish between kink and sausage modes in flapping oscillations?, J. Geophys. Res., 119, 3002–3015, https://doi.org/10.1002/2013JA019477, 2014.
Laakso, H., Perry, C., McCaffrey, S., Herment, D., Allen, D. J., Harvey, C. C., Escoubet, C. P., Gruenberger, C., Taylor, M. G. G. T., and Turner, R.: Cluster Active Archive: Overview, in: The Cluster Active Archive, Astrophysics and Space Science Proceedings, edited by: Laakso, H., Taylor, M. and Escoubet, C. P., Springer, Dordrecht, Heidelberg, London, New York, 3–37, 2010.
Lockwood, M.: Modelling high-latitude ionosphere for time-varying plasma convection, IEE Proceedings-H, 140, 91–100, https://doi.org/10.1049/ip-h-2.1993.0015, 1993.
Malova, H. V., Zelenyi, L. M., Popov, V. Y., Petrukovich, A. A., and Runov, A. V.: Asymmetric thin current sheets in the Earth's magnetotail, Geophys. Res. Lett., 34, L16108, https://doi.org/10.1029/2007GL030011, 2007.
McPherron, R. L., Hsu, T.-S., Kissinger, J., Chu, X., and Angelopoulos, V.: Characteristics of plasma flows at the inner edge of the plasma sheet, J. Geophys. Res., 116, A00133, https://doi.org/10.1029/2010JA015923, 2011.
Nakamura, R., Baumjohann, W., Klecker, B., Bogdanova, Y., Balogh, A., Rème, H., Bosqued, J. M., Dandouras, I., Sauvaud, J. A., Glassmeier, K.-H., Kistler, L., Mouikis, C., Zhang, T. L., Eichelberger, H., and Runov, A.: Motion of the dipolarization front during a flow burst event observed by Cluster, Geophys. Res. Lett., 29, 1942, https://doi.org/10.1029/2002GL015763, 2002.
Nakamura, R., Retinò, A., Baumjohann, W., Volwerk, M., Erkaev, N., Klecker, B., Lucek, E. A., Dandouras, I., André, M., and Khotyainstev, Y.: Evolution of dipolarization in the near-Earth current sheet induced by Earthward rapid flux transport, Ann. Geophys., 27, 1743–1754, https://doi.org/10.5194/angeo-27-1743-2009, 2009.
Ness, N. F.: The Earth's Magnetic Tail, J. Geophys. Res., 70, 2989–3005, https://doi.org/10.1029/JZ070i013p02989, 1965.
Newell, P. T., Sotirelis, T., Liou, K., Meng, C.-I., and Rich, F. J.: A nearly universal solar wind-magnetosphere coupling function inferred from 10 magnetospheric state variables, J. Geophys. Res., 112, A01206, https://doi.org/10.1029/2006JA012015, 2007.
Nishitani, N., Ruohoniemi, J. M., Lester, M., Baker, J. B. H., Koustov, A. V., Shepherd, S. G., Chisham, G., Hori, T., Thomas, E. G., Makarevich, R. A., Marchaudon, A., Ponomarenko, P., Wild, J. A., Milan, S. E., Bristow, W. A., Devlin, J., Miller, E., Greenwald, R. A., Ogawa, T., and Kikiuchi, T.: Review of the accomplishments of mid-latitude Super Dual Auroral Radar Network (SuperDARN) HF radars, Progr. Earth Planet. Sci., 6, 27, https://doi.org/10.1186/s40645-019-0270-5, 2019.
Odagi, Y., Toh, H., and Taguchi, S.: World Data Center (WDC) for Geomagnetism, Kyoto, available at: http://wdc.kugi.kyoto-u.ac.jp/catmap/index.html (last access: 5 January 2021), 2020.
Ohma, A., Østgaard, N., Reistad, J. P., Tenfjord, P., Laundal, K. M., Moretto Jørgensen, T., Haaland, S. E., Krcelic, P., and Milan, S.: Observations of Asymmetric Lobe Convection for Weak and Strong Tail Activity, J. Geophys. Res.-Space, 124, 9999–10017, https://doi.org/10.1029/2019JA026773, 2019.
Pettigrew, E. D., Shepherd, S. G., and Ruohoniemi, J. M.: Climatological patterns of high-latitude convection in the Northern and Southern hemispheres: Dipole tilt dependencies and interhemispheric comparisons, J. Geophys. Res., 115, A07305, https://doi.org/10.1029/2009JA014956, 2010.
Petrukovich, A. A.: Origins of plasma sheet By, J. Geophys. Res., 116, A07217, https://doi.org/10.1029/2010JA016386, 2011.
Petrukovich, A. A., Baumjohann, W., Nakamura, R., Schödel, R., and Mukai, T.: Are earthward bursty bulk flows convective or field-aligned?, J. Geophys. Res., 106, 21211–21215, https://doi.org/10.1029/2001JA900019, 2001.
Petrukovich, A. A., Baumjohann, W., Nakamura, R., Runov, A., and Balogh, A.: Cluster vision of the magnetotail current sheet on a macroscale, J. Geophys. Res., 110, A06204, https://doi.org/10.1029/2004JA010825, 2005.
Pitkänen, T., Hamrin, M., Norqvist, P., Karlsson, T., and Nilsson, H.: IMF dependence of the azimuthal direction of earthward magnetotail fast flows, Geophys. Res. Lett., 40, 5598–5604, https://doi.org/10.1002/2013GL058136, 2013.
Pitkänen, T., Hamrin, M., Norqvist, P., Karlsson, T., Nilsson, H., Kullen, A., Imber, S. M., and Milan, S. E.: Azimuthal velocity shear within an earthward fast flow: further evidence for magnetotail untwisting?, Ann. Geophys., 33, 245–255, https://doi.org/10.5194/angeo-33-245-2015, 2015.
Pitkänen, T., Hamrin, M., Karlsson, T., Nilsson, H., and Kullen, A.: On IMF By-Induced Dawn-Dusk Asymmetries in Earthward Convective Fast Flows, in: Dawn-Dusk Asymmetries in Planetary Plasma Environments, edited by: Haaland, S., Runov, A., and Forsyth, C., John Wiley and Sons, Inc., the American Geophysical Union, Washington, DC, and John Wiley & Sons, Inc, Hoboken, USA, 107–123, 2017.
Pitkänen, T., Kullen, A., Laundal, K. M., Tenfjord, P., Shi, Q. Q. Park. J. -S., Hamrin, M., De Spiegeleer, A., Chong, G. S., and Tian, A. M.: IMF By Influence on Magnetospheric Convection in Earth's Magnetotail Plasma Sheet, Geophys. Res. Lett., 46, 11698–11708, https://doi.org/10.1029/2019GL084190, 2019.
Reistad, J. P., Østgaard, N., Tenfjord, P., Laundal, K. M., Snekvik, K., Haaland, S., Milan, S. E., Oksavik, K., Frey, H. U., and Grocott, A.: Dynamic effects of restoring footprint symmetry on closed magnetic field lines, J. Geophys. Res.-Space, 121, 015JA022058, https://doi.org/10.1002/2015JA022058, 2016.
Reistad, J. P., Østgaard, N., Laundal, K. M., Ohma, A., Snekvik, K., Tenfjord, P., Grocott, A., Oksavik, K., Milan, S. E., and Haaland, S.: Observations of asymmetries in ionospheric return flow during different levels of geomagnetic activity, J. Geophys. Res., 123, 4638–4651, https://doi.org/10.1029/2017JA025051, 2018.
Rème, H., Bosqued, J. M., Sauvaud, J. A., Cros, A., Dandouras, J., Aoustin, C., Bouyssou, J., Camus, Th., Cuvilo, J., Martz, C., Médale, J. L., Perrier, H., Romefort, D., Rouzaud, J., d'Uston, C., Möbius, E., Crocker, K., Granoff, M., Kistler, L. M., Popecki, M., Hovestadt, D., Klecker, B., Paschmann, G., Scholer, M., Carlson, C. W., Curtis, D. W., Lin, R. P., McFadden, J. P., Formisano, V., Amata, E., Bavassano-Cattaneo, M. B., Baldetti, P., Belluci, G., Bruno, R., Chionchio, G., Di Lellis, A., Shelley, E. G., Ghielmetti, A. G., Lennartsson, W., Korth, A., Rosenbauer, H., Lundin, R., Olsen, S., Parks, G. K., McCarthy, M., and Balsiger, H.: The Cluster Ion Spectrometry (CIS) Experiment, Space Sci. Rev., 79, 303–350, https://doi.org/10.1007/978-94-011-5666-0_12, 1997.
Rong, Z. J., Barabash, S., Stenberg, G., Futaana, Y., Zhang, T. L., Wan, W. X., Wei, Y., and Wang, X.-D.: Technique for diagnosing the flapping motion of magnetotail current sheets based on single-point magnetic field analysis, J. Geophys. Res.-Space, 120, 3462–3474, https://doi.org/10.1002/2014JA020973, 2015.
Runov, A., Nakamura, R., Baumjohann, W., Zhang, T. L., Volwerk, M., Eichelberger, H.-U., and Balogh, A.: Cluster observations of a bifurcated current sheet, Geophys. Res. Lett., 30, 1036, https://doi.org/10.1029/2002GL016136, 2003.
Runov, A., Angelopoulos, V., Sergeev, V. A., Glassmeier, K. -H., Auster, U., McFadden, J., Larson, D., and Mann, I.: Global properties of magnetotail current sheet flapping: THEMIS perspectives, Ann. Geophys., 27, 319–328, https://doi.org/10.5194/angeo-27-319-2009, 2009.
Ruohoniemi, J. M. and Baker, K. B.: Large-scale imaging of high-latitude convection with Super Dual Auroral Radar Network HF radar observations, J. Geophys. Res., 103, 20797–20811, https://doi.org/10.1029/98JA01288, 1998.
Ruohoniemi, J. M. and Greenwald, R. A.: Statistical patterns of high-latitude convection obtained from Goose Bay HF radar observations, J. Geophys. Res., 101, 21743–21763, https://doi.org/10.1029/96JA01584, 1996.
Sergeev, V. A., Angelopoulos, V., Gosling, J. T., Cattell, C. A., and Russell, C. T.: Detection of localised, plasma-depleted flux tubes or bubbles in the midtail plasma sheet, J. Geophys. Res., 101, 10817–10826, https://doi.org/10.1029/96JA00460, 1996.
Sonnerup, B. U. Ö. and Cahill Jr., L. J.: Magnetopause structure and attitude from Explorer 12 observations, J. Geophys. Res., 72, 171–183, https://doi.org/10.1029/JZ072i001p00171, 1967.
Tenfjord, P., Østgaard, N., Snekvik, K., Laundal, K. M., Reistad, J. P., Haaland, S., and Milan, S. E.: How the IMF By induces a By component in the closed magnetosphere and how it leads to asymmetric currents and convection patterns in the two hemispheres, J. Geophys. Res.-Space, 120, 9368–9384, https://doi.org/10.1002/2015JA021579, 2015.
Tenfjord, P., Østgaard, N., Strangeway, R., Haaland, S., Snekvik, K., Laundal, K. M., Reistad, J. P., and Milan, S. E.: Magnetospheric response and reconfiguration times following IMF By reversals, J. Geophys. Res.-Space, 122, 417–431, https://doi.org/10.1002/2016JA023018, 2017.
Thomas, E. G. and Shepherd, S. G.: Statistical Patterns of Ionospheric Convection Derived From Mid-Latitude, High-Latitude and Polar SuperDARN HF Observations, J. Geophys. Res.-Space, 123, 3196–3216, https://doi.org/10.1002/2018JA025280, 2017.
Thomas, E. G., Ponomarenko, P. V., Billett, D. D., Bland, E. C., Burrell, A. G., Kotyk, K., Reimer, A. S., Schmidt, M. T., Shepherd, S. G., Sterne, K. T., and Walach, M.-T.: SuperDARN Radar Software Toolkit (RST) 4.2 (v4.2), Zenodo [code], https://doi.org/10.5281/zenodo.1403226, 2018.
Tsyganenko, N. A. and Andreeva, V. A.: A forecasting model of the magnetosphere driven by an optimal solar wind coupling function, J. Geophys. Res., 120, 8401–8425, https://doi.org/10.1002/2015JA021641, 2015.
Volwerk, M., Zhang, T. L., Glassmeier, K.-H., Runov, A., Baumjohann, W., Balogh, A., Rème, H., Klecker, B., and Carr, C.: Study of waves in the magnetotail region with cluster and DSP, Adv. Space Res., 41, 1593–1597, https://doi.org/10.1016/j.asr.2007.04.005, 2008.
Wei, X. H., Cai, C. L., Cao, J. B., Rème, H., Dandouras, I., and Parks, G. K.: Flapping motions of the magnetotail current sheet excited by nonadiabatic ions, Geophys. Res. Lett., 42, 4731–4735, https://doi.org/10.1002/2015GL064459, 2015.
Wei, Y. Y., Huang, S. Y., Rong, Z. J., Yuan, Z. G., Jiang, K., Deng, X. H., Zhou, M., Fu, H. S., Yu, X. D., Xu, S. B., He, L. H., and Deng, D.: Observations of Short-period Current Sheet Flapping Events in the Earth's Magnetotail, Astrophys. J. Lett., 874, L18, https://doi.org/10.3847/2041-8213/ab0f28, 2019.
Wu, M., Lu, Q., Volwerk, M., Vörös, Z., Ma, X., and Wang, S.: Current sheet flapping motions in the tailward flow of magnetic reconnection, J. Geophys. Res., 121, 7817–7827, https://doi.org/10.1002/2016JA022819, 2016.
Zhang, L. Q., Baumjohann, W., Wang, C., Dai, L., and Tang, B. B.: Bursty bulk flows at different magnetospheric activity levels: Dependence of IMF conditions, J. Geophys. Res., 121, 8773–8789, https://doi.org/10.1002/2016JA022397, 2016.
streamof ions and electrons – forming the interplanetary magnetic field (IMF). The IMF can introduce asymmetries in the Earth's magnetic field, giving plasma flowing within it a direction dependent on IMF orientation. Electric currents in near-Earth space can also influence these plasma flows. We investigate these two competing mechanisms and find that the currents can prevent the IMF from controlling the flow.
streamof ions...