the Creative Commons Attribution 4.0 License.
the Creative Commons Attribution 4.0 License.
 | 24 Jun 2020
Ionospheric Pc1 waves during a storm recovery phase observed by the China Seismo-Electromagnetic Satellite
Xiaochen Gou
Lei Li
Bin Zhou
Yongyong Feng
Bingjun Cheng
Tero Raita
Ji Liu
Zeren Zhima
Xuhui Shen
During the storm recovery phase on 27 August 2018, the China Seismo-Electromagnetic Satellite (CSES) detected Pc1 wave activities in both the Northern Hemisphere and Southern Hemisphere in the high-latitude, post-midnight ionosphere with a central frequency of about 2 Hz. Meanwhile, the typical Pc1 waves were simultaneously observed for several hours by the Sodankylä Geophysical Observatory (SGO) stations on the ground. In this paper, we study the propagation characteristics and possible source regions of those waves. Firstly, we find that the Pc1 waves observed by the satellites exhibited mixed polarisation, and the wave normal is almost parallel with the background magnetic field. The field-aligned Poynting fluxes point downwards in both hemispheres, implying that the satellites are close to the wave injection regions in the ionosphere at about L=3. Furthermore, we also find that the estimated position of the plasmapause calculated by models is almost at L=3. Therefore, we suggest that the possible sources of waves are near the plasmapause, which is consistent with previous studies in that the outward expansion of the plasmasphere into the ring current during the recovery phase of geomagnetic storms may generate electromagnetic ion cyclotron (EMIC) waves, and these EMIC waves propagate northwards and southwards along the background magnetic field to the ionosphere at about L=3. Additionally, the ground station data show that Pc1 wave power attenuates with increasing distance from L=3, supporting the idea that the CSES observes the wave activities near the injection region. The observations are unique in that the Pc1 waves are observed in the ionosphere in nearly conjugate regions where transverse Alfvén waves propagate down into the ionosphere.
- Article
(3260 KB) - Full-text XML
- BibTeX
- EndNote


Electromagnetic ion cyclotron (EMIC) waves are in the typical frequency range of 0.1–5 Hz that correspond to Pc1 pulsations on the ground. Generally, in the magnetosphere, EMIC waves can be excited by the cyclotron instability of hot ions (1–100 keV) with temperature anisotropy () near the Earth's magnetic equator – particularly, in the region with a large plasma density and weak magnetic field, such as the plasmapause, ring current, and plasma sheet (Cornwall et al., 1965; Erlandson et al., 1993; Horne and Thorne, 1993; Anderson et al., 1996; Lin et al., 2014). Previous studies indicate that hot ion temperature anisotropy () near the Earth's magnetic equator can be caused by several possible mechanisms, such as plasmapause expanding into the ring current region during the storm recovery phase (Cornwall et al., 1970; Russell and Thorne, 1970), mid-energy ions penetrating into the ring current region from the plasma sheet (Bossen et al., 1976), the solar wind dynamic pressure enhancement, or the magnetosphere compression (Olson and Lee, 1983; Anderson and Hamilton, 1993; McCollough et al., 2010; Usanova et al., 2012). Statistical results show that EMIC waves are associated with increased magnetic activity and have a peak occurrence during the storm recovery phase (Wentworth, 1964; Erlandson and Ukhorskiy, 2001; Bortnik et al., 2008).
Generally, EMIC waves are excited at or near the Earth's magnetic equator and propagate along the background magnetic field towards the high-latitude region where they can penetrate into the upper ionosphere under certain conditions. The left-hand polarised (LHP) Alfvén waves incident from the magnetosphere can couple with the right-hand polarised (RHP), compressional isotropic waves in the ionosphere due to the anisotropic ionospheric Hall currents (Fraser, 1975a, b; Fujita and Tamao, 1988). Since the wavelength of EMIC waves with a frequency of about 1 Hz is comparable with the scale size of the ionospheric minimum in the Alfvén speed, it can be trapped and ducted in this region of low Alfvén speed (Lysak et al., 1999). Thus, the EMIC waves can be observed at both the low earth orbit (LEO) and on the ground as Pc1 geomagnetic pulsations with different characteristics.
At ionospheric altitudes, satellite observations of Pc1 waves are usually provided by the on-board magnetometers. Magsat observed Pc1 waves at an ionospheric altitude of 350–550 km, with both left-hand (LH) and right-hand (RH) polarisations in a latitudinally narrow (<100 km) region (Iyemori and Hayashi, 1989). In recent years, with the development of LEO satellites, various statistical studies of EMIC waves have been carried out to reveal the global propagation characteristics, spatial distribution, and geomagnetic dependence of Pc1 waves. Since the field-aligned currents mask the Pc1 pulsations in the high-latitude zone, by excluding data at auroral latitudes, Park et al. (2013) found, according to the statistical analysis of CHAllenging Minisatellite Payload (CHAMP) satellite data during one solar cycle, that Pc1 waves are mostly linearly polarised, have a peak occurrence at sub-auroral latitudes, and are weakly dependent on the magnetic activity and solar wind velocity. Similarly, the Swarm satellite data show a peak occurrence rate of Pc1 waves at the middle latitude, including the sub-auroral region. Moreover, these waves are dominated by linear polarisation, which propagate obliquely to the background magnetic field, and preferably occur during the late recovery phase of magnetic storms (Kim et al., 2018).
In this paper, we report on a Pc1 wave event observed by the China Seismo-Electromagnetic Satellite (CSES) and the Swarm satellite. Based on both the electric and magnetic field measurements, we study the propagation characteristics and possible source regions of those Pc1 waves occurring at a high latitude in the northern and southern hemispheric ionosphere during the recovery phase of the geomagnetic storm of 25–28 August 2018.
On 2 February 2018, the CSES was launched into a sun-synchronous circular orbit at an altitude of 507 km with an inclination angle of 97.4∘. The local time of the descending node is 14:00 LT We use magnetic field data from the high-precision magnetometer (HPM) and electric field data from the electric field detector (EFD) on board the CSES. The HPM includes two three-component fluxgate sensors to collect vector magnetic field data with a sampling rate of 60 Hz, and the noise of the sensors is less than 0.02 nT Hz at 1 Hz (Zhou et al., 2018, 2019). The EFD consists of four spherical sensors, which can realise the three-component electric field detection with a frequency bandwidth of about 3.5 MHz, in which the ultra-low frequency (ULF) band provides a 125 Hz sampled waveform signal (Huang et al., 2018). The Swarm was launched on 22 November 2013 and has three satellites (Alpha, Bravo, and Charlie) at altitudes of 450–550 km, with an inclination angle of 88∘ (Friis-Christensen et al., 2006). For this study, we used magnetic field data from Swarm A, with a high sampling rate of 50 Hz and a noise level of 0.01 nT Hz at 1 Hz (Merayo, 2014). We also used the Finnish pulsation magnetometer data from the Sodankylä Geophysical Observatory (SGO), including data from Sodankylä (SOD), Oulu (OUL), and Nurmijärvi (NUR), with a sampling rate of 40 Hz. In addition, the solar wind data of OMNI are from the NASA Coordinated Data Analysis Web (CDAWeb). The disturbed storm time (Dst) index is from the World Data Center (WDC) website, and the plasmapause simulation data are from NASA Community Coordinated Modeling Center (CCMC) website.
Figure 1 shows the variation of the solar wind parameters and geomagnetic index during the Pc1 wave event in this study. The Dst index, interplanetary magnetic field, solar wind speed, and solar wind dynamic pressure from 25 to 29 August 2018 are shown from top to bottom. It can be seen that the Dst index decreased to −170 nT during the magnetic storm at 08:00 UTC on 26 August 2018. The Pc1 waves were observed by the CSES and Swarm between 22:50 and 23:30 UTC (indicated by the black box in Fig. 1), with a northward interplanetary magnetic field (IMF) and a minor increase in the Dst index in the magnetic storm recovery phase on 27 August 2018.
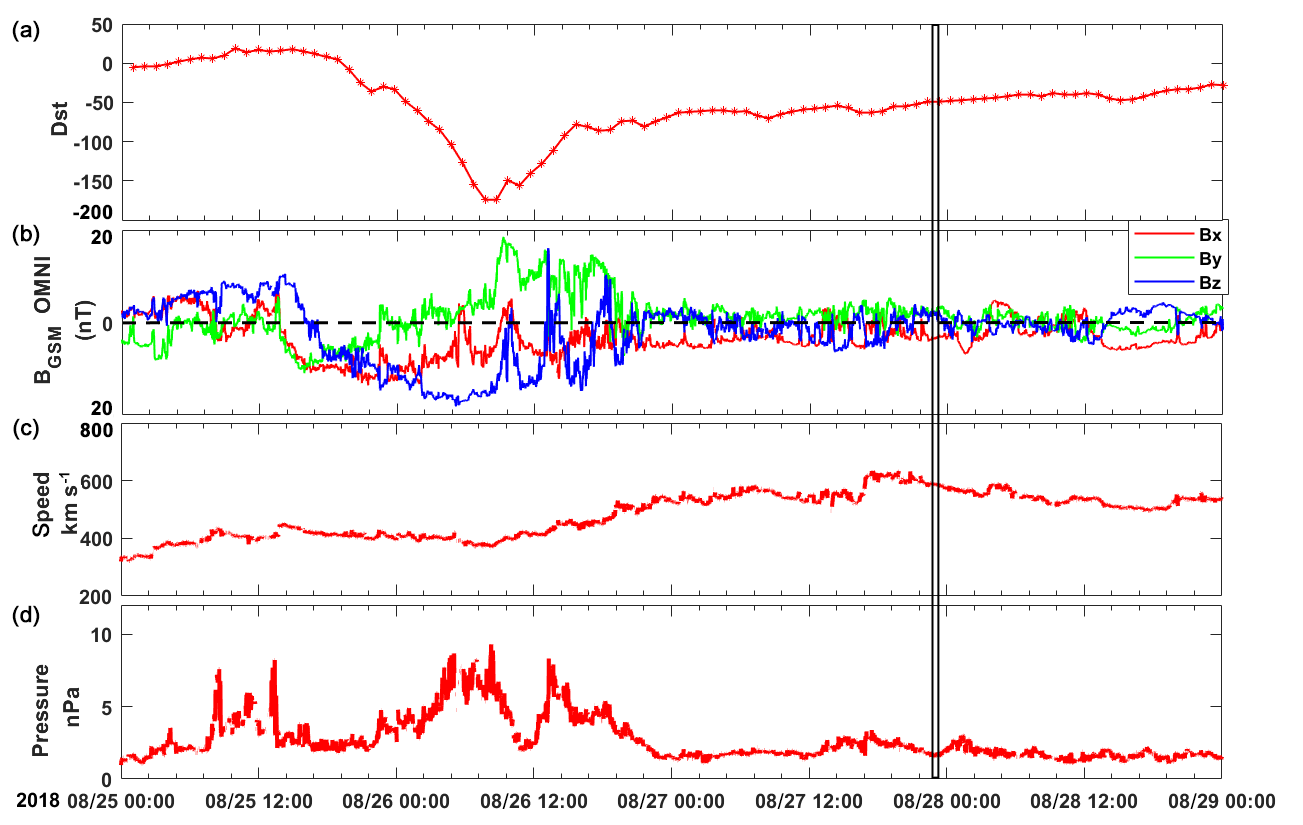
Figure 1The solar wind conditions and geomagnetic index from 25 to 29 August 2018. From top to bottom: Dst index (a), interplanetary magnetic field (b), solar wind speed (c), and solar wind dynamic pressure (d), respectively. CSES observation of Pc1 waves is indicated by the black lines.
3.1 Spatio-temporal characteristics of Pc1 waves
On 27 August 2018, CSES and Swarm-A satellites passed through the ionospheric Pc1 wave regions three times in the Northern Hemisphere and Southern Hemisphere, as indicated by the squares (CSES) and triangles (Swarm) in Fig. 2. Firstly, at around 23:00 UTC (local time about 02:06 to 02:34), the Swarm-A and CSES satellites successively observed Pc1 waves in the Southern Hemisphere at a geomagnetic latitude of about 56–53∘ S with an L-shell value of about 3.0–3.4. The distance between the two satellites is about 300 km. Swarm-A observed the Pc1 waves at about 22:50 UTC (quasi-dipole latitude (QD-LAT) = 56∘ S, L=3.4), which was about 10 min before the CSES, with a maximum amplitude of about 12 nT and a central frequency of about 2 Hz that lasted for 1 min, as shown in Fig. 3. Then, the CSES observed the Pc1 waves at 23:02 UTC (QD-LAT = 54∘ S, L=3.1), with the HPM (shown in Fig. 4) at a maximum amplitude of about 1.5 nT and a central frequency of about 2 Hz that lasted 1.5 min. Thereafter, at about 23:30 UTC (local time at about 01:27 to 01:22), the CSES flew away to the Northern Hemisphere and passed through the Pc1 wave region again at geomagnetic latitudes of about 54∘ N, with L values of about 3.1. As shown in Fig. 5, the maximum amplitude is about 10 nT, and the central frequency is about 2 Hz with a duration of about 1 min. Since the Swarm satellite was about 6000 km northeast of the CSES satellite, no Pc1 waves were observed by the Swarm around this time.
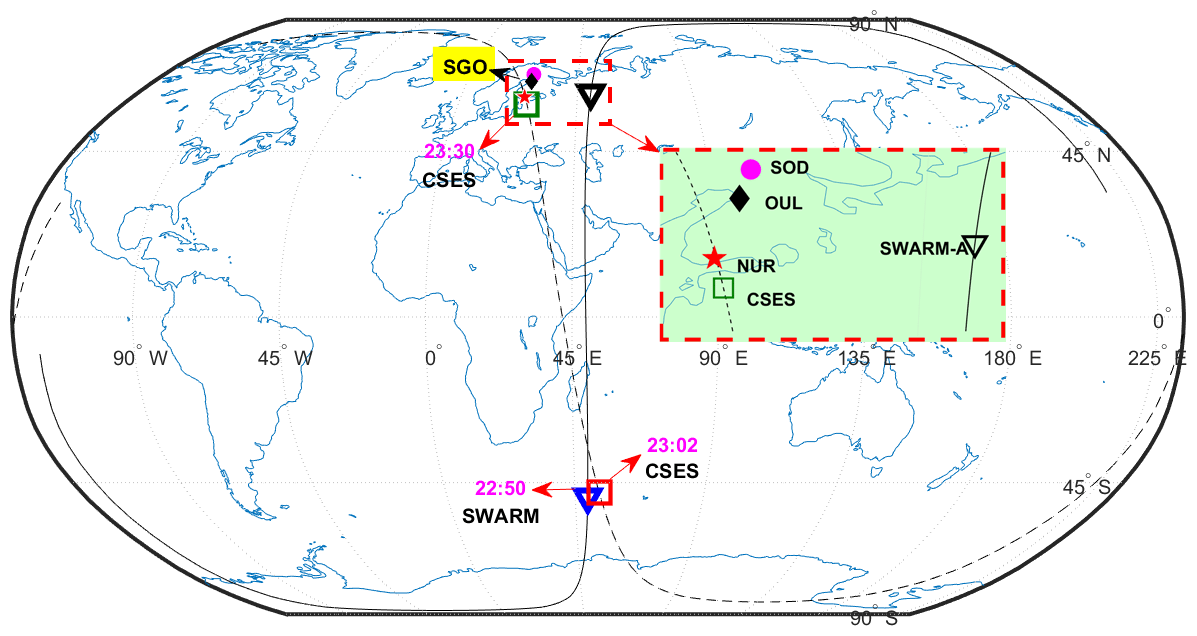
Figure 2The locations of Pc1 waves observed by the CSES (squares) and Swarm (triangles) satellites. The red star, black diamond, and pink dot represent the following three SGO stations: Nurmijärvi (NUR – L=3.4, 57.1∘ N, 101.2∘ E, QD); Oulu (OUL – L=4.5, 61.9∘ N, 104.1∘ E, QD); and Sodankylä (SOD – L=5.3, 64.3∘ N, 105.6∘ E, QD), respectively. The broken and solid black lines denote the trajectories of the CSES and Swarm-A satellites, respectively, and the red arrows represent three Pc1 wave observations.
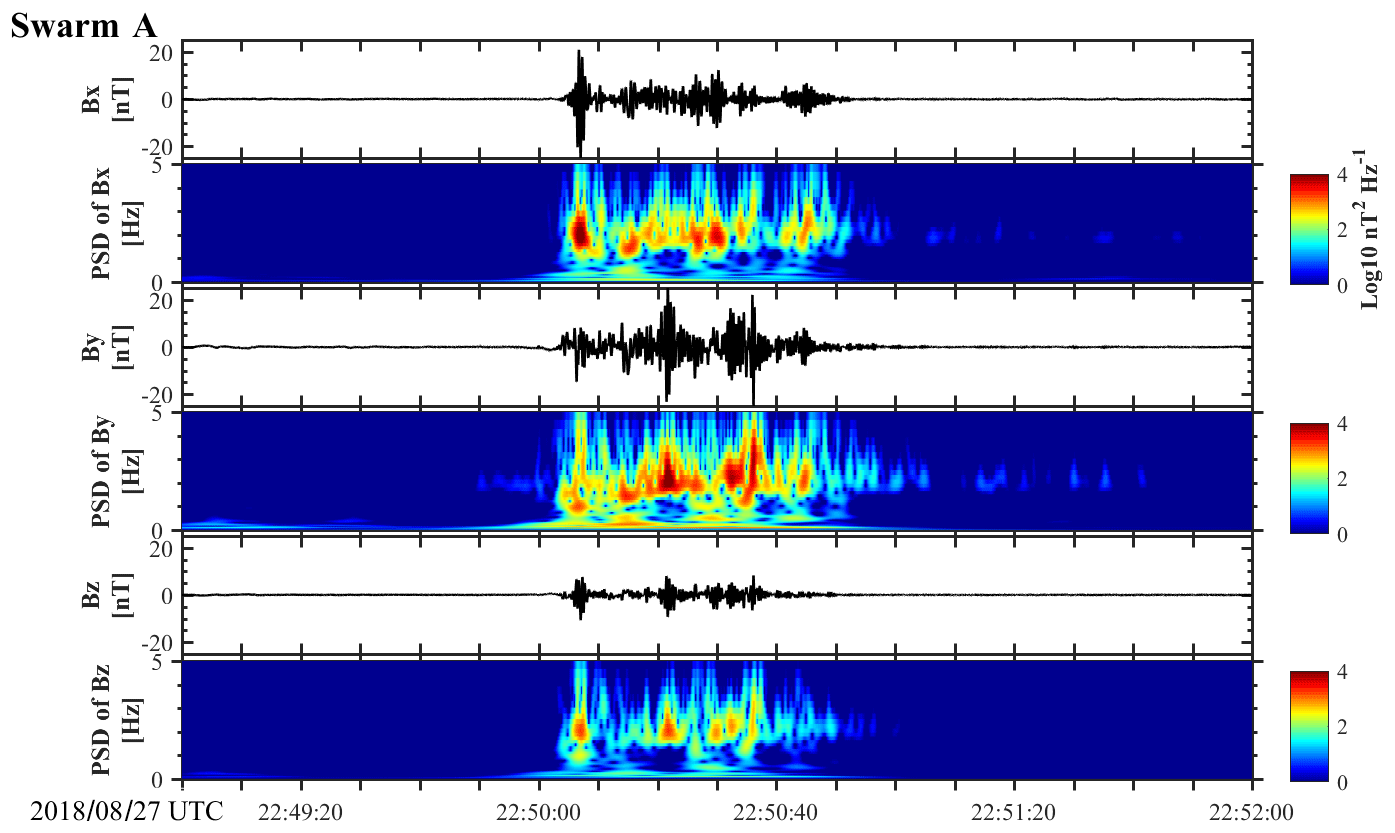
Figure 3The power spectral densities (PSDs) of the magnetic fields in the local north-east-down (NED) coordinates during the Pc1 wave period (22:50–22:51 UTC) observed by the Swarm-A satellite.
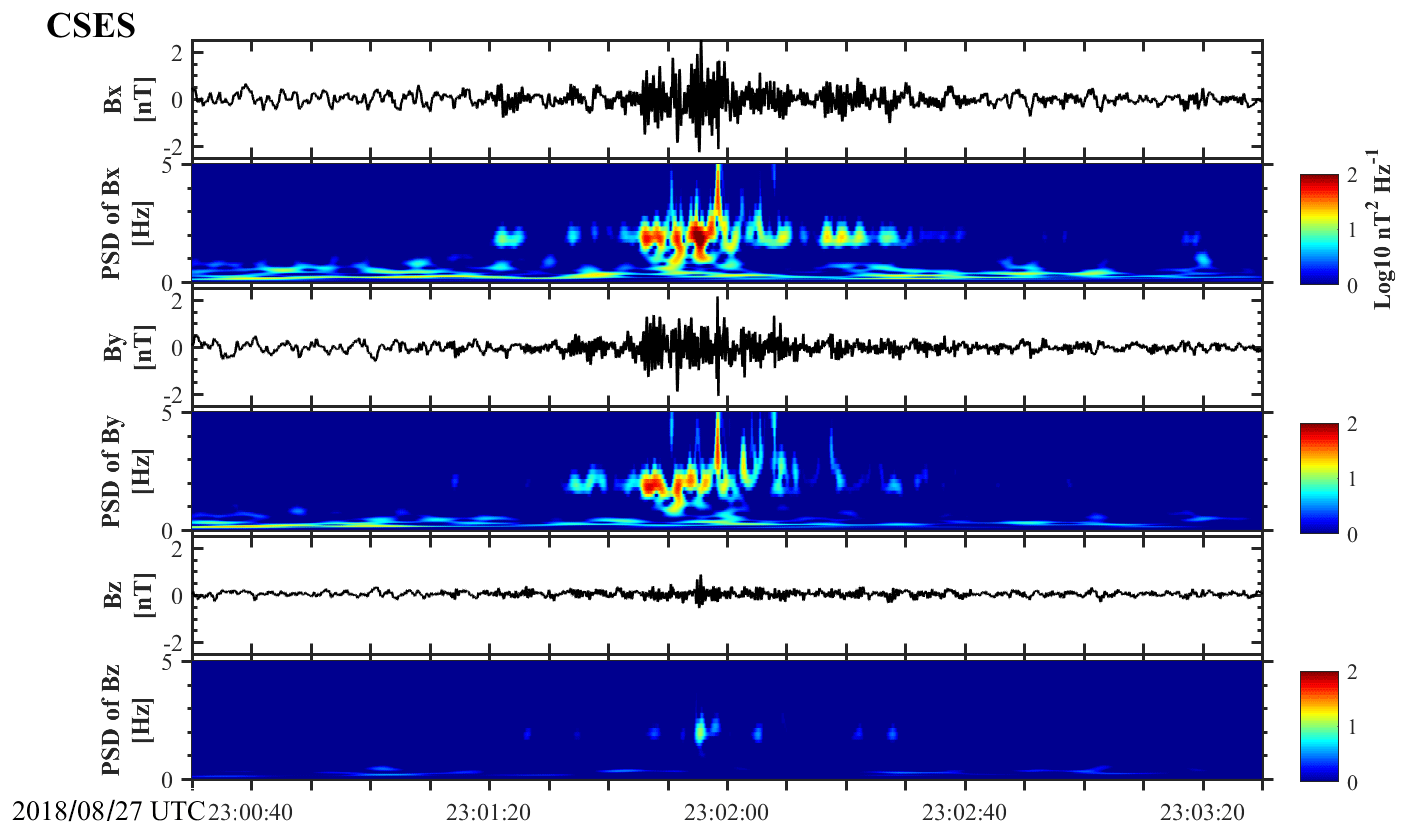
Figure 4The power spectral densities (PSDs) of the magnetic fields in the local NED coordinates during the Pc1 wave period (23:01–23:02 UTC) observed by the CSES.

Figure 5The power spectral densities (PSDs) of the magnetic fields in the local NED coordinates during the Pc1 wave period (23:30–23:31 UTC) observed by the CSES.
At the same time, the typical Pc1 waves were also observed for several hours by the SGO stations on the ground. As shown in Fig. 6, from 21:35 to 24:00 UTC the SGO stations recorded continuous pulsations with a central frequency of about 2–3 Hz. In Fig. 6 the observations from the SGO stations are shown from top to bottom, as follows: Sodankylä (SOD – L=5.3, 64.3∘ N, 105.6∘ E, QD); Oulu (OUL – L=4.5, 61.9∘ N, 104.1∘ E, QD); and Nurmijärvi (NUR – L=3.4, 57.1∘ N, 101.2∘ E, QD) from ∼ 21:00 to 24:00 UTC. The wave power of the Pc1 pulsations increases monotonically with the decrease in the L-shell values of the SGO stations, and the maximum power is at the NUR station, which is close to the region where the CSES observed Pc1 in the Northern Hemisphere. Because of the ducting effect of Pc1 waves in the ionospheric waveguide, Pc1 waves are likely to be seen a long distance away from the source region (e.g. Fujita and Taomaplao, 1988; Kim et al., 2010). Since the boundary of the waveguide is not a perfect conductor, some absorption may happen when waves propagate in the waveguide, resulting in the attenuation of the wave power. So, by comparing the wave power observed at different ground stations, it is possible to infer the probable location of the wave source. Therefore, in our case, we suggest that the injection source region of the Pc1 waves in the Northern Hemisphere should be near (QD-LAT = 54–56∘ N, ), where the CSES and NUR observed the pulsations. After incidence on the ionosphere, the waves were ducted towards the northeast and observed by the ground stations located at higher latitudes.

Figure 6The power spectral densities (PSDs) of the magnetic fields in the local north-east-up (NEU) coordinates during the Pc1 waves period (21:35–24:00 UTC) observed by the SGO ground stations at different L-shell values.
3.2 Propagation characteristics of Pc1 waves
Wave polarisation is another property that provides information on the wave source and the spatial characteristics of wave propagation. According to theoretical studies, the incident LHP Alfvén waves in the ionosphere can gradually change to RHP as the waves propagate away from the injection region in the ionosphere (e.g. Fujita and Taomao, 1986). The polarisation pattern is usually complex when it is close to the injection region because the waves near the injection source are combined with incident waves and ducting waves (Hayashi et al., 1981; Kim et al., 2010).
We further analysed the propagation characteristics of Pc1 waves observed by the CSES and Swarm satellites in the Northern Hemisphere and Southern Hemisphere during the magnetic storm recovery phase. Firstly, we converted the magnetic field into field-aligned coordinates (FAC) and then applied polarisation analysis according to the method of Means (1972). From top to bottom, Fig. 7a–e show the following: Swarm magnetic field components in FAC (including perpendicular components Br and Ba marked in blue and green and the parallel component Bz marked in red); the magnetic wave power spectrum in the perpendicular direction and the parallel direction; wave normal angle (where 0∘ indicates the parallel propagation and 90∘ indicates the perpendicular propagation to the background magnetic field); and ellipticity (positive indicates RHP and negative indicates LHP). For the CSES, electric components in the FAC, the electric wave power spectrum in the perpendicular and parallel directions, and a field-aligned Poynting flux are also included in Figs. 8 and 9.
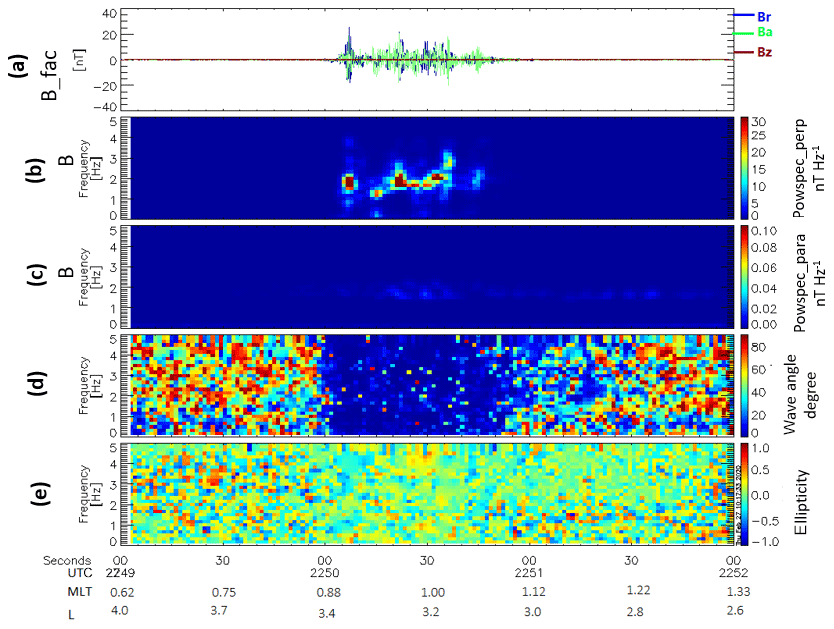
Figure 7The wave propagation and polarisation features of the Pc1 waves observed by Swarm. From top to bottom: (a) magnetic field components (including perpendicular components Ba and Br marked in blue and green and the parallel component Bz marked in red); wave power spectrum in (b) perpendicular and (c) parallel directions; and (d) wave normal angle and (e) ellipticity computed by the wave vector analysis of Means (1972), where positive indicates right-handed polarisation and negative indicates left-handed polarisation.
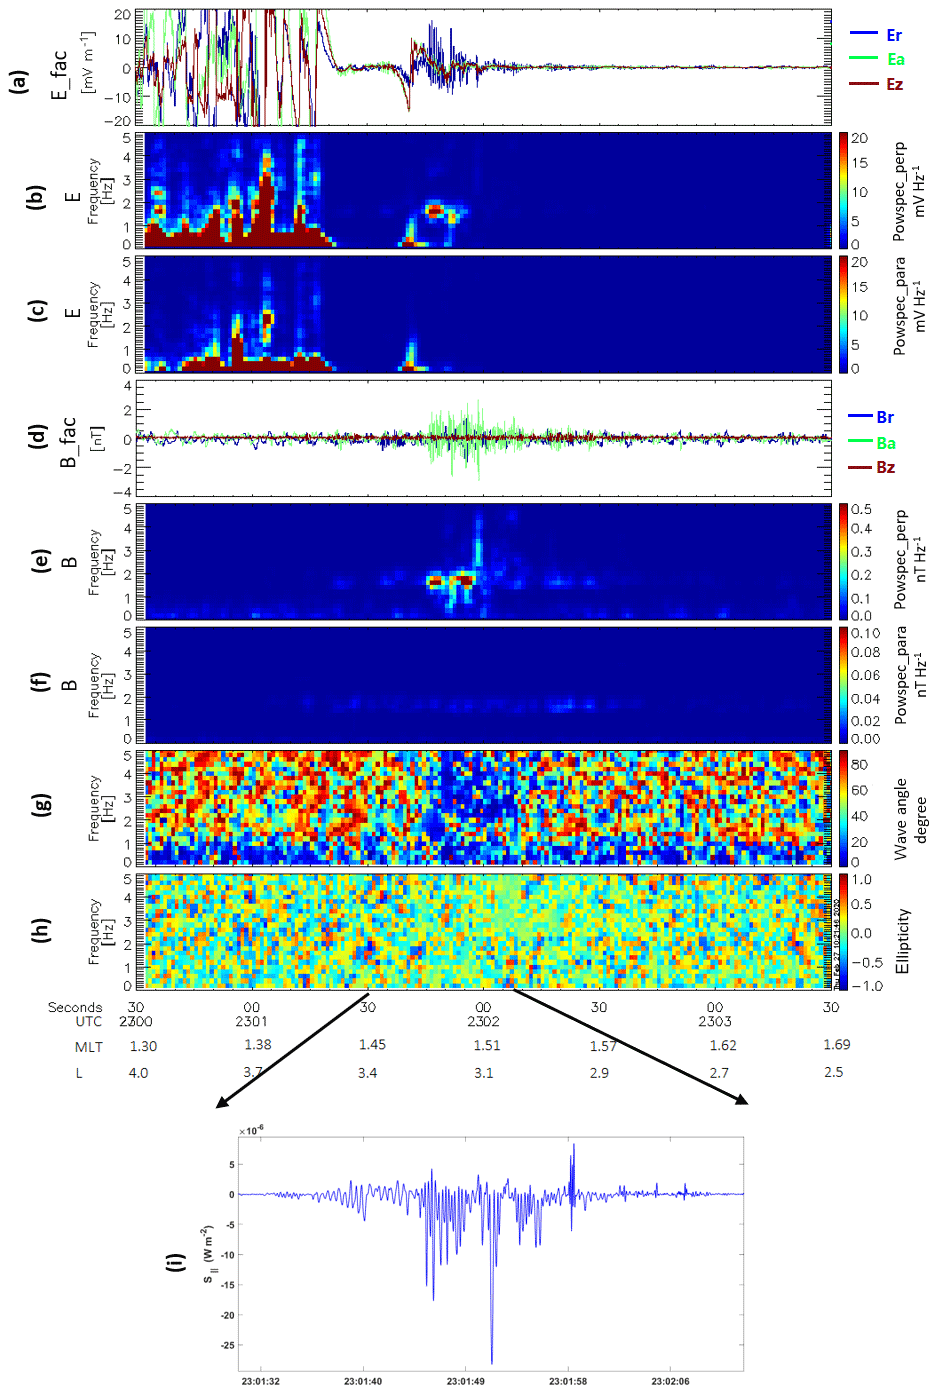
Figure 8The wave propagation and polarisation features of the Pc1 waves observed by the CSES in the Southern Hemisphere. From top to bottom: (a) electric field components (including perpendicular components Ea and Er marked in blue and green and the parallel component Ez marked in red); electric wave power spectrum in (b) perpendicular and (c) parallel directions; (d) magnetic field components (including perpendicular components Ba and Br marked in blue and green and the parallel component Bz marked in red); wave power spectrum in (e) perpendicular and (f) parallel directions; (g) magnetic wave normal angle and (h) ellipticity; and (i) the field-aligned Poynting fluxes.
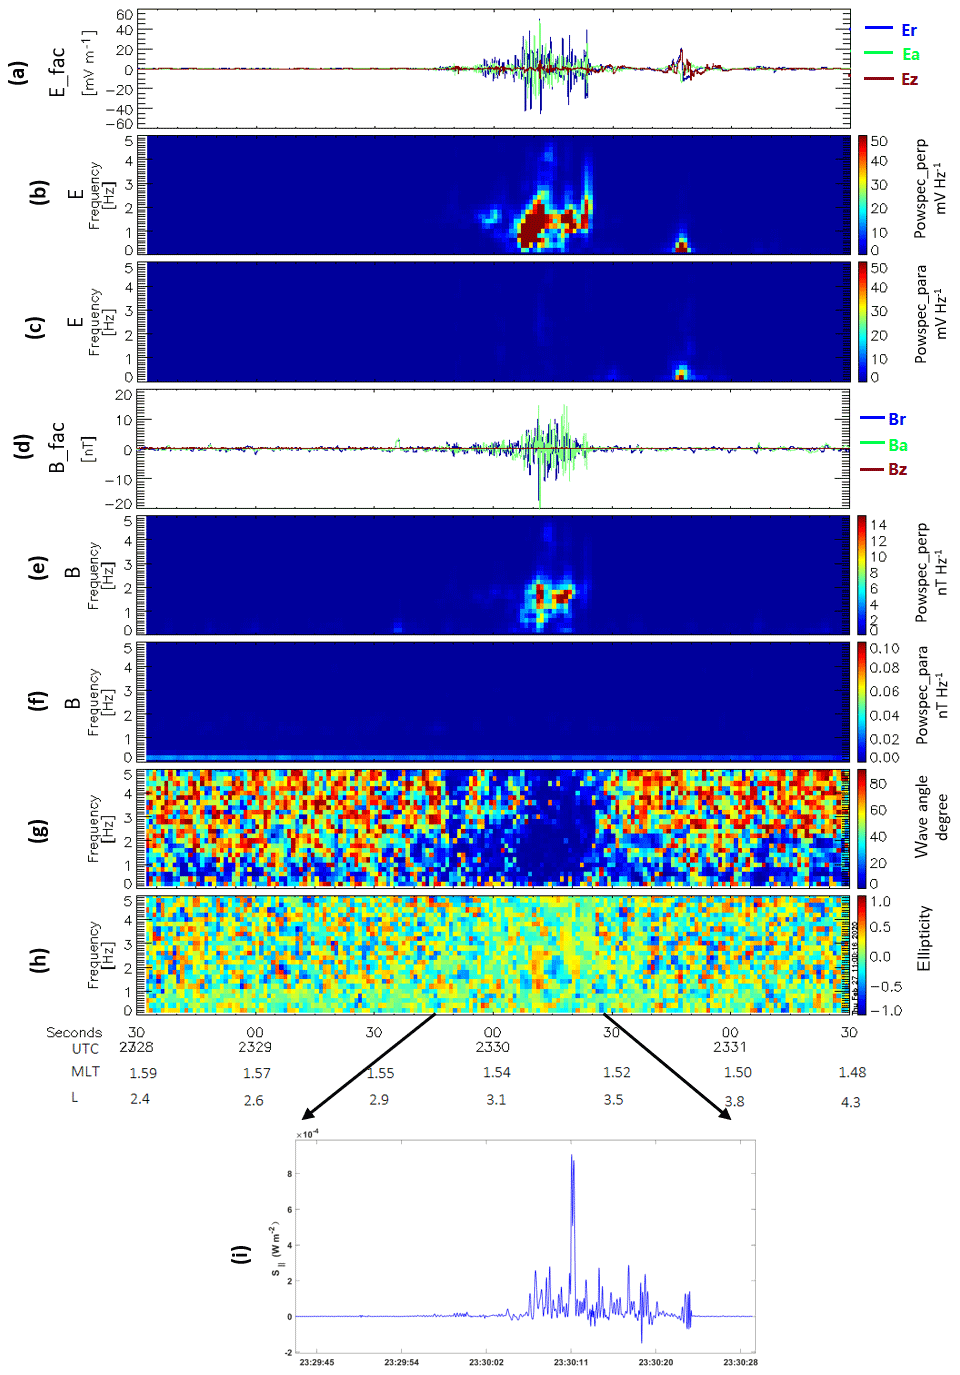
Figure 9The wave propagation and polarisation features of the Pc1 waves observed by the CSES in the Northern Hemisphere (same as Fig. 8).
It can be seen from the Swarm and CSES data in the Southern Hemisphere (Figs. 7 and 8) and Northern Hemisphere (Fig. 9) that wave normal angles (Figs. 7d, 8g, and 9g) predominate below ∼20∘, indicating that Pc1 waves propagated almost parallel to the background magnetic field. Our result is somewhat different from the nightside observations in the ionosphere by Píša et al. (2015) and Kim et al. (2018) in that it shows that the wave normal angles in their observations are scattered or have different tendencies between the two hemispheres. For the CSES, based on the HPM and EFD data, we also calculated the field-aligned Poynting flux of Pc1 waves (shown in Figs. 8i and 9i), which is positive in the Northern Hemisphere and negative in the Southern Hemisphere, indicating that Pc1 waves observed by the CSES propagate downwards along the background magnetic field into the ionosphere in both hemispheres.
Additionally, we find that the waves have dominant perpendicular power, and the parallel power (compressional power) is almost 0 (shown in Figs. 7b–c, 8e–f, and 9e–f), which means that the waves are transverse. The transverse wave is one of the characteristics of the incident wave near the wave injection region (Engebretson et al., 2008; Kim et al., 2010). The transverse wave also explains why the downward (upward) component in the local north-east-down (NED; or north-east-up – NEU) coordinates has the minimum wave power, as observed by the satellites and ground stations (Figs. 2–3, 6). Near the injection region, with a geomagnetic latitude of ∼55∘, the dip angle of the geomagnetic field is about 73∘. For a transverse wave, the power projected in the downward direction should be small. We further find that the wave normal, electric field vector, and background magnetic field lie in almost the same plane (not shown) with a deviation of less than ±8∘, which confirms that the incident transverse wave is Alfvénic.
From Figs. 7e, 8h, and 9h, the ellipticity of Pc1 waves shows mixed polarisation for the waves detected by the CSES and Swarm in both hemispheres. To check whether our calculation results truly represent these wave properties, we also use the minimum and maximum variance analysis (MVA; Sonnerup and Scheible, 1998) to obtain the MVA hodograph and the wave normal direction (not shown), which are also consistent with current results. Therefore, it seems that all the Pc1 waves observed by the CSES and Swarm have mixed ellipticities and propagate along the background magnetic field.
In 1970, Cornwall et al. (1970) proposed that, during the storm recovery phase, the plasmapause expanding into the ring current region can excite EMIC waves. Through a simulation, Horne and Thorne (1993) found that the growth rate of EMIC waves inside the plasmapause was obviously lower than that outside the plasmapause and that its peak was near the plasmapause.
To identify the source of the Pc1 waves observed by the CSES and Swarm, we use the dynamic plasmasphere model from the Community Coordinated Modeling Center (CCMC; Pierrard and Stegen, 2008) to obtain the variation of the position of the plasmapause during the magnetic storm on 26 August 2018 (shown in Fig. 10). The dots correspond to the position of the plasmapause, and the red star represents the conjugate location of Pc1 waves observed by the CSES in the Southern Hemisphere. From 11:00 to 21:00 magnetic local time (MLT) there is a plume rotating with the plasmasphere in an easterly direction. Such plumes are mostly formed during the geomagnetic storm recovery phase (Pierrard and Lemaire, 2004). Meanwhile, the simulation cycle of the dynamic plasmasphere model always starts at 02:00 MLT because the plasma are unstable in the post-midnight magnetosphere where the convection electric field has the largest value. Additionally, the simulation does not stop after one full cycle at 02:00 MLT but continues further up to 05:00 MLT, showing two plasmapause branches between 02:00 and 05:00 MLT, and the gaps are caused by the loss of some of the plasma elements at large Kp jumps (Verbanac et al., 2018; Bandić at al., 2019). Results show that the plasmapause moves outwards at about 23:00 UTC on 27 August 2018, and the L value reaches about 3 near the local time of 02:00. Moreover, based on the formula in Carpenter and Anderson (1992; shown below in Eq. 1), the position of the plasmapause is estimated to be at about L=2.84 according to the maximum Kp value in the preceding 24 h. Therefore, we suggest that the possible sources of Pc1 waves are nearly located at the plasmapause, and this is consistent with previous studies in that the outward expansion of the plasmasphere into the ring current during the recovery phase of geomagnetic storms may generate EMIC waves that propagate along the background magnetic field to the ionosphere and may be observed by multi-ground stations (Wentworth, 1964; Cornwall et al., 1970; Russell and Thorne, 1970).
According to the wave analysis performed using the CSES and Swarm data together with ground station observations, we suggest that the satellites are close to the wave injection regions in the Southern Hemisphere and Northern Hemisphere during the recovery phase of the storm. The incident waves propagate almost along the background magnetic field as transverse Alfvén waves, which have long been predicted by theoretical studies – although direct observations are rare. However, the ellipticity of the waves shows a complex pattern that is different from the polarisations of EMIC waves (LHP) in the magnetosphere found by previous works (Fraser, 1975a, b; Erlandson et al., 1990). Theoretical studies predict that EMIC waves trigged near the Earth's magnetic equator propagate towards the ionosphere, which changes wave characteristics, such as ellipticity and wave normal angle, when they pass through multicomponent plasma (Denton, 2018; Johnson and Cheng, 1999; Kim and Johnson, 2016). The mixed polarisation pattern observed in our case might either result from incident waves with a complex polarisation pattern or be attributed to the interference between the incident waves and ducting waves in the ionospheric waveguide.
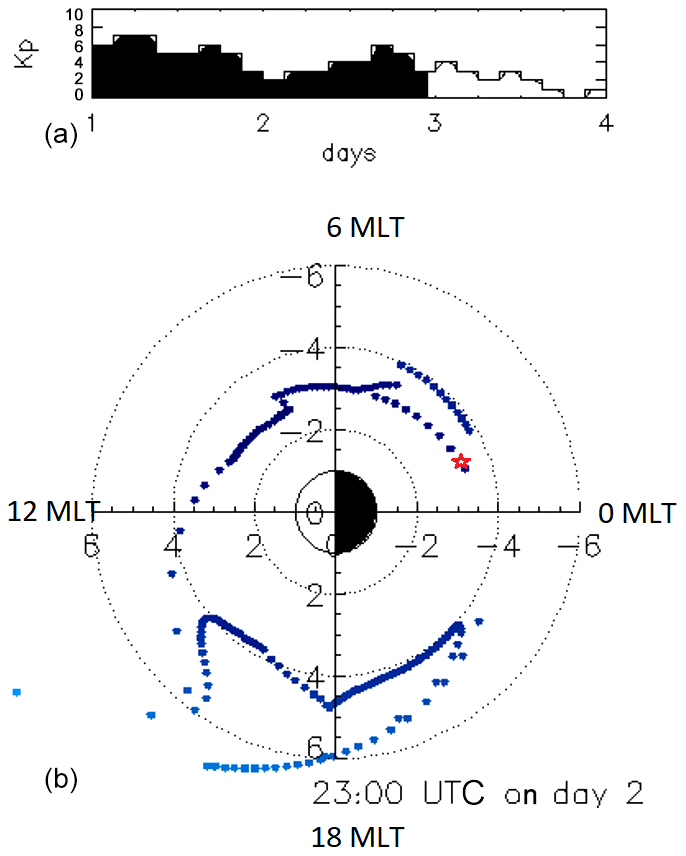
Figure 10The Kp index (a) and the simulated plasmapause location (b) in the geomagnetic equatorial plane (marked by all of the blue dots) at 23:00 UTC on 27 August 2018 from the CCMC website. The red star represents the conjugate location of Pc1 waves observed by the CSES in the Southern Hemisphere.
Joint magnetic field and electric field observations on board the CSES provide unambiguous evidence that Pc1 waves propagate downwards into the ionosphere in the nearly conjugate ionospheric regions. Although the observations in the Northern and Southern hemispheres are temporally separated by about 30 min, it seems reasonable to infer that the EMIC waves simultaneously propagate northwards and southwards from the magnetic equatorial region and that the wave reflection from the ionosphere is insignificant. Our result is in accordance with the Combined Release and Radiation Effects Satellite (CRRES) measurements reported by Loto'aniu (2005), which observed that, outside a region of about ±11∘ magnetic latitude (MLAT) around the magnetic equator, the Poynting vectors of the EMIC waves are directed away from the Equator along the magnetic field lines.
Pc1 waves sometimes have repetitive wave packet structures that have been explained by a bouncing wave packet (BWP) model (e.g. Jacobs and Watanabe, 1964). According to this model, a wave packet triggered in the equatorial region travels along the magnetic field line and is reflected between conjugate hemispheres. The Poynting vector is an important parameter for establishing the propagation direction of wave packet energy. The CSES observations of the Poynting vector in the ionospheric do not seem to support this model.
In this paper, using the simultaneous observations from the CSES and Swarm satellites together with the ground geomagnetic stations data, we investigated the typical Pc1 waves in the northern and southern ionospheric hemispheres. Our principal results are as follows:
-
During the storm recovery phase on 27 August 2018, the typical Pc1 waves were recorded by the SGO stations on the ground for several hours. Meanwhile, the Pc1 waves were detected by the China Seismo-Electromagnetic Satellite (CSES) and Swarm satellites in both the Northern Hemisphere and Southern Hemisphere in the high-latitude post-midnight ionosphere region with a central frequency of about 2 Hz.
-
In the field-aligned coordinate system, the power spectrum, ellipticity, normal wave angle and Poynting vector are analysed. Results show that the satellites observed transverse Alfvén waves with mixed polarisations that propagated almost parallel to the background magnetic field downward to the ionosphere, which implies that the satellites were close to the wave injection region in the ionosphere at about L=3. The attenuation of Pc1 wave power at ground stations with increasing distances from L=3 also supports the idea that the CSES observes the wave activity near the injection region.
-
Furthermore, it is also found that the position of the plasmapause calculated by the CCMC model and the equation of Carpenter and Anderson is almost at L=3. Therefore, we suggest that the possible sources of waves are near the plasmapause, which is consistent with previous studies in that the outward expansion of the plasmasphere into the ring current during the recovery phase of geomagnetic storms may generate electromagnetic ion cyclotron (EMIC) waves. Downward-pointing Poynting fluxes measured by the CSES at nearly conjugate hemispheres suggest that the EMIC waves simultaneously propagate northwards and southwards to the ionosphere at about L=3.
The data used in this paper are available from the following sources: CSES data at http://www.leos.ac.cn (CSES, 2020); Swarm data at https://earth.esa.int/ (SWARM, 2020); SGO data from the PI (Tero Raita) of geomagnetic pulsation data; Dst index at http://wdc.kugi.kyoto-u.ac.jp/dstdir/index.html (World Data Center, 2020); OMNI data at https://cdaweb.sci.gsfc.nasa.gov/index.html/ (NASA Goddard Space Flight Center, 2020); and the plasmapause simulation data at https://ccmc.gsfc.nasa.gov/ (NASA CCMC, 2020).
XG, LL and YZ carried out the data analysis and discussed all of the results. BZ and BC contributed to the analysis of the CSES data. YF, JL, ZZ and XS provided comments on the discussion of the results. TR performed the SGO data analysis and concurred with the discussion of the results. All authors approved the final version of the paper.
The authors declare that they have no conflict of interest.
This research made use of the data from a CSES mission, a project funded by China National Space Administration (CNSA) and China Earthquake Administration (CEA). Additionally, the authors wish to thank the CSES teams for providing HPM and EFD data (http://www.leos.ac.cn/, last access: 9 June 2020); the ESA Swarm teams for providing Swarm FGM data (ftp://Swarm-diss.eo.esa.int/, last access: 9 June 2020); the PI of the pulsation magnetometers from the Sodankylä Geophysical Observatory (SGO) for providing the geomagnetic pulsation data (https://www.sgo.fi/Data/Pulsation/, last access: 9 June 2020); the NASA CDAWeb (https://cdaweb.sci.gsfc.nasa.gov/index.html/, last access: 9 June 2020) for providing the OMNI solar wind and magnetic field data; and NASA CCMC (https://ccmc.gsfc.nasa.gov/, last access: 9 June 2020) for providing the plasmapause simulation data.
This work has been supported by the NSFC (grant no. 41904147) and the National Key Research and Development Programmes of the Ministry of Science and Technology of the People's Republic of China (MOST; grant nos. 2016YBF0501503 and 2018YFC1503501).
This paper was edited by Steve Milan and reviewed by two anonymous referees.
Anderson, B. J. and Hamilton, D. C.: Electromagnetic ion cyclotron waves stimulated by modest magnetospheric compressions, J. Geophys. Res., 98, 11369, https://doi.org/10.1029/93ja00605, 1993.
Anderson, B. J., Denton, R. E., Ho, G., Hamilton, D. C., Fuselier, S. A., and Strangeway, R. J.: Observational test of local proton cyclotron instability in the Earth's magnetosphere, J. Geophys. Res.-Space, 101, 21527–21543, https://doi.org/10.1029/96ja01251, 1996.
Bandić, M., Verbanac, G., and Pierrard, V.: Relationship between global plasmapause characteristics and plasmapause structures in the frame of interchange instability mechanism, J. Geophys. Res.-Space, 125, e2019JA026768, https://doi.org/10.1029/2019ja026768, 2019.
Bortnik, J., Cutler, J. W., Dunson, C., Bleier, T. E., and McPherron, R. L.: Characteristics of low-latitude Pc1 pulsations during geomagnetic storms, J. Geophys. Res.-Space, 113, A04201, https://doi.org/10.1029/2007ja012867, 2008.
Bossen, M., McPherron, R. L., and Russell, C. T.: A statistical study of Pc 1 magnetic pulsations at synchronous orbit, J. Geophys. Res., 81, 6083–6091, https://doi.org/10.1029/ja081i034p06083, 1976.
Carpenter, D. L. and Anderson, R. R.: An ISEE/whistler model of equatorial electron density in the magnetosphere, J. Geophys. Res., 97, 1097, https://doi.org/10.1029/91ja01548, 1992.
CSES: CSES data, available at: http://www.leos.ac.cn, last access: 9 June 2020.
Cornwall, J. M.: Cyclotron instabilities and electromagnetic emission in the ultralow frequency and very low frequency ranges, J. Geophys. Res., 70, 61–69, https://doi.org/10.1029/jz070i001p00061, 1965.
Cornwall, J. M., Coroniti, F. V., and Thorne, R. M.: Turbulent loss of ring current protons, J. Geophys. Res., 75, 4699–4709, https://doi.org/10.1029/JA075i025p04699,1970.
Denton, R. E.: Electromagnetic Ion Cyclotron Wave fields in a Realistic Dipole Field, J. Geophys. Res.-Space, 123, 1208–1223, https://doi.org/10.1002/2017ja024886, 2018.
Engebretson, M. J., Posch, J. L., Westerman, A. M., Otto, N. J., Slavin, J. A., Le, G., Strangeway, R. J., and Lessard, M. R.: Temporal and spatial characteristics of Pc1 waves observed by ST5, J. Geophys. Res.-Space, 113, A07206, https://doi.org/10.1029/2008ja013145, 2008.
Erlandson, R. E. and Ukhorskiy, A. J.: Observations of electromagnetic ion cyclotron waves during geomagnetic storms: Wave occurrence and pitch angle scattering, J. Geophys. Res.-Space, 106, 3883–3895, https://doi.org/10.1029/2000ja000083, 2001.
Erlandson, R. E., Zanetti, L. J., Potemra, T. A., Block, L. P., and Holmgren, G.: Viking magnetic and electric field observations of Pc 1 waves at high latitudes, J. Geophys. Res., 95, 5941, https://doi.org/10.1029/ja095ia05p05941, 1990.
Erlandson, R. E., Aggson, T. L., Hogey, W. R., and Slavin, J. A.: Simultaneous observations of subauroral electron temperature enhancements and electromagnetic ion cyclotron waves, Geophys. Res. Lett., 20, 1723–1726, https://doi.org/10.1029/93gl01975, 1993.
Fraser, B. J.: Polarization of Pc1 pulsations at high and middle latitudes, J. Geophys. Res., 80, 2797–2807, https://doi.org/10.1029/ja080i019p02797, 1975a.
Fraser, B. J.: Ionospheric duct propagation and Pc1 pulsation sources, J. Geophys. Res., 80, 2790–2796, https://doi.org/10.1029/ja080i019p02790, 1975b.
Friis-Christensen, E., Lühr, H., and Hulot, G.: Swarm: A constellation to study the Earth's magnetic field, Earth Planets Space, 58, 351–358, https://doi.org/10.1186/BF03351933, 2006.
Fujita, S. and Tamao, T.: Duct propagation of hydromagnetic waves in the upper ionosphere, 1, Electromagnetic field disturbances in high latitudes associated with localized incidence of a shear Alfvén wave, J. Geophys. Res., 93, 14665, https://doi.org/10.1029/ja093ia12p14665, 1988.
Hayashi, K., Kokubun, S., Oguti, T., Tsuruda, K., Machida, S., Kitamura, T., Saka, O., and Watanabe, T.: The extent of Pc 1 source region in high latitudes, Can. J. Phys., 59, 1097–1105, https://doi.org/10.1139/p81-145, 1981.
Horne, R. B. and Thorne, R. M.: On the preferred source location for the convective amplification of ion cyclotron waves, J. Geophys. Res., 98, 9233, https://doi.org/10.1029/92ja02972, 1993.
Huang, J., Lei, J., Li, S., Zeren, Z., Li, C., Zhu, X., and Yu, W.: The Electric Field Detector (EFD) onboard the ZH-1 satellite and first observational results, Earth Planetary Phys., 2, 469–478, https://doi.org/10.26464/epp2018045, 2018.
Iyemori, T. and Hayashi, K.: PC 1 micropulsations observed by Magsat in the ionospheric F region, J. Geophys. Res., 94, 93, https://doi.org/10.1029/ja094ia01p00093, 1989.
Jacobs, J. A. Watanabe, T.: Micropulsation whistlers, J. Atmos. Terr. Phys., 26, 825–829, https://doi.org/10.1016/0021-9169(64)90180-1, 1964.
Johnson, J. R. and Cheng, C. Z.: Can Ion Cyclotron Waves Propagate to the Ground?, Geophys. Res. Lett., 26, 671–674, https://doi.org/10.1029/1999gl900074, 1999.
Kim, E.-H. and Johnson, J. R.: Full-wave modeling of EMIC waves near the He+ gyrofrequency, Geophys. Res. Lett., 43, 13–21, https://doi.org/10.1002/2015gl066978, 2016.
Kim, H., Lessard, M. R., Engebretson, M. J., and Lühr, H.: Ducting characteristics of Pc 1 waves at high latitudes on the ground and in space, J. Geophys. Res.-Space, 115, A09310, https://doi.org/10.1029/2010ja015323, 2010.
Kim, H., Hwang, J., Park, J., Bortnik, J., and Lee, J.: Global characteristics of electromagnetic ion cyclotron waves deduced from Swarm satellites, J. Geophys. Res.-Space, 123, 1325–1336, https://doi.org/10.1002/2017JA024888, 2018.
Lin, R. L., Zhang, J. C., Allen, R. C., Kistler, L. M., Mouikis, C. G., Gong, J. C., Liu, L. Q., Klecker, B., Sauvaud, J. A., and Dunlop, M. W.: Testing linear theory of EMIC waves in the inner magnetosphere: Cluster observations, J. Geophys. Res.-Space, 119, 1004–1027, https://doi.org/10.1002/2013ja019541, 2014.
Loto'aniu, T. M.: Propagation of electromagnetic ion cyclotron wave energy in the magnetosphere, J. Geophys. Res., 110, A07214, https://doi.org/10.1029/2004ja010816, 2005.
Lysak, R. L: Propagation of Alfven waves through the ionosphere: Dependence on ionospheric parameters, J. Geophys. Res., 104, 10017, https://doi.org/10.1029/1999JA900024, 1999.
McCollough, J. P., Elkington, S. R., Usanova, M. E., Mann, I. R., Baker, D. N., and Kale, Z. C.: Physical mechanisms of compressional EMIC wave growth, J. Geophys. Res.-Space, 115, A10214, https://doi.org/10.1029/2010ja015393, 2010.
Means, J. D.: Use of the three-dimensional covariance matrix in analyzing the polarization properties of plane waves, J. Geophys. Res., 77, 5551–5559, https://doi.org/10.1029/ja077i028p05551, 1972.
Merayo, J. M. G.: The Swarm Vector Field Magnetometer (VFM): instrument commissioning & performance assessment, 3rd Swarm Science Meeting, 19–20 June 2014, Copenhagen, Denmark, 2014.
NASA CCMC: Plasmapause simulation data, available at: https://ccmc.gsfc.nasa.gov/, last access: 9 June 2020.
NASA Goddard Space Flight Center: Coordinated Data Analysis Web (CDAWeb), available at: https://cdaweb.sci.gsfc.nasa.gov/index.html/, last access: 9 June 2020.
Olson, J. V. and Lee, L. C.: Pc1 wave generation by sudden impulses, Planet. Space Sci., 31, 295–302, https://doi.org/10.1016/0032-0633(83)90079-x, 1983.
Park, J., Lühr, H., and Rauberg, J.: Global characteristics of Pc1 magnetic pulsations during solar cycle 23 deduced from CHAMP data, Ann. Geophys., 31, 1507–1520, https://doi.org/10.5194/angeo-31-1507-2013, 2013.
Pierrard, V. and Lemaire, J. F.: Development of shoulders and plumes in the frame of the interchange instability mechanism for plasmapause formation, Geophys. Res. Lett., 31, L05809, https://doi.org/10.1029/2003gl018919, 2004.
Pierrard, V. and Stegen, K.: A three-dimensional dynamic kinetic model of the plasmasphere, J. Geophys. Res., 113, A10209, https://doi.org/10.1029/2008JA013060, 2008.
Píša, D., Parrot, M., Santolík, O., and Menietti, J. D.: EMIC waves observed by the low-altitude satellite DEMETER during the November 2004 magnetic storm, J. Geophys. Res.-Space, 120, 5455–5464, https://doi.org/10.1002/2014JA020233, 2015.
Russell, C. T. and Thorne, R. M.: on the structure of the inner magnetosphere, Cosmic Electrodynamics, 1, 67–89, 1970.
Sonnerup, B. U. O. and Scheible, M.: Minimum and maximum variance analysis, Chap. 1, in: Analysis methods for multi-spacecraft data, edited by: Paschmann, G. and Daly, P. W., No. SR-001 in ISSI Scientific Reports, 185–220, ESA Publications Division, Noordwijk, the Netherlands, 1998.
SWARM: Earth Online, available at: https://earth.esa.int/, last access: 9 June 2020.
Usanova, M. E., Mann, I. R., Bortnik, J., Shao, L., and Angelopoulos, V.: THEMIS observations of electromagnetic ion cyclotron wave occurrence: Dependence on AE, SYMH, and solar wind dynamic pressure, J. Geophys. Res.-Space, 117, A10218, https://doi.org/10.1029/2012ja018049, 2012.
Verbanac, G., Bandić, M., Pierrard, V., and Cho, J.: MLT Plasmapause Characteristics: Comparison Between THEMIS Observations and Numerical Simulations, J. Geophy. Res.-Space, 123, 2000–2017, https://doi.org/10.1002/2017ja024573, 2018.
Wentworth, R. C.: Enhancement of hydromagnetic emissions after geomagnetic storms, J. Geophys. Res., 69, 2291–2298, https://doi.org/10.1029/JZ069i011p02291, 1964.
World Data Center: Geomagnetic Equatorial Dst index Home Page, available at: http://wdc.kugi.kyoto-u.ac.jp/dstdir/index.html, last access: 9 June 2020.
Zhou, B., Yang, Y. Y., Zhang, Y. T., Gou, X. C., Cheng, B. J., Wang, J. D., and Li, L.: Magnetic field data processing methods of the China Seismo-Electromagnetic Satellite, Earth Planet. Phys., 2, 455–461, https://doi.org/10.26464/epp2018043, 2018.
Zhou, B., Cheng, B. J., Gou, X. C., Li, L., Zhang, Y. T., Wang, J. D., Magnes, W., Lammegger, R., Pollinger, A., Ellmeier, M., Xiao, Q., Zhu, X. H., Yua, S. G., Yang, Y. Y., and Shen, X. H.: First in-orbit results of the vector magnetic field measurement of the High Precision Magnetometer onboard the China Seismo-Electromagnetic Satellite, Earth Planets Space, 71, 119, https://doi.org/10.1186/s40623-019-1098-3, 2019.