the Creative Commons Attribution 4.0 License.
the Creative Commons Attribution 4.0 License.
 | 24 Jun 2020
Relation between the asymmetric ring current effect and the anti-sunward auroral currents, as deduced from CHAMP observations
Yun-Liang Zhou
During magnetically active periods the storm-time disturbance signal on the ground commonly develops an azimuthal asymmetry. Negative deflections of the magnetic horizontal (H) component are enhanced in the 18:00 local time sector and smallest in the morning sector. This is commonly attributed to the asymmetric ring current effect. In this study we investigate the average characteristics of anti-sunward net currents that are not closing in the ionosphere. Their intensity is growing proportionally with the amount of solar wind input to the magnetosphere. There is almost twice as much current flowing across the polar region in the winter hemisphere as on the summer side. This seasonal dependence is more pronounced in the dusk sector than in the dawn sector. Event studies reveal that anti-sunward currents are closely related to the main phase of a magnetic storm. Since the asymmetry of storm-time disturbances also builds up during the main phase, we suggest a relation between these two phenomena. From a statistical study of ground-based disturbance levels during magnetically active periods, we obtain support for our suggestion. We propose a new 3D current system responsible for the zonally asymmetric storm-time disturbance signal that does not involve the ring current. The high-latitude anti-sunward currents are connected at their noon and midnight ends to field-aligned currents that lead the currents to the outer magnetosphere. The auroral net current branch on the morning side is closed along the dawn flank near the magnetopause, and the evening side currents flow along the dusk flank magnetosphere. Regardless through which loop the current is flowing, near-Earth storm-time disturbance levels will in both cases be reduced in the morning sector and enhanced in the evening.
- Article
(3880 KB) - Full-text XML
- BibTeX
- EndNote


At auroral latitudes intense electric currents are flowing. Due to the anisotropic conductivity distribution in the ionosphere, different current types exist. Quite prominent are the field-aligned currents (FACs), which can transfer energy and momentum over large distances from the magnetosphere and deposit them in the high-latitude upper atmosphere. Horizontal Pedersen currents typically close these FACs in the ionosphere. Furthermore, there are Hall currents, flowing perpendicularly to the electric and magnetic fields. These are generally regarded as source-free, and they close in the ionosphere.
The intensity of currents that close FACs in the ionosphere can be estimated from magnetic field measurements of low-Earth orbit (LEO) satellites on near-polar orbits. By integrating the along-track magnetic field component over the full orbit, the net current flowing transverse to the orbital plane can be determined reliably. Corresponding results for anti-sunward net currents have been obtained from Magsat (e.g. Suzuki and Fukushima, 1984). Stauning and Primdahl (2000) used Ørsted magnetic field measurements to estimate the dawn to dusk net currents. Equally, from CHAMP data Zhou and Lühr (2017) could determine the ionospheric net currents for all local times. Net currents increase up to several Mega Ampère (MA) during magnetically active periods. They can be divided into two principle types. Most prominent are the cross-polar cap Pedersen currents closing excessive Region 1 (R1) FACs, which are not balanced by R2 FACs. About half as strong are the anti-sunward net currents connecting excessive downward FACs on the dayside with upward FACs on the nightside. These anti-sunward currents, carried predominantly by Hall currents, were first confirmed observationally from Magsat data (Suzuki and Fukushima, 1982, 1984). Their intensity, derived from the ring integral of the along-track field component, is clearly controlled by magnetic activity. Later Yamashita et al. (2002) used a somewhat different approach. They interpreted the azimuthal, By component of the Ørsted magnetic field data at middle and low latitudes to estimate FACs flowing into and out of the ionosphere. These authors also deduced anti-sunward net current intensities, dependent on magnetic activity, from their data. The advantage of this latter approach is that it can also be applied to ground-based observations (see Nakano and Iyemori, 2005, and references therein). But the disadvantage is that important assumptions have to be made for the interpretation in terms of net currents. Strangely, the more intense dawn to dusk net currents are obviously not sensed by this approach.
More recently Zhou and Lühr (2017) provided a detailed study on auroral zone net currents. Making use of 5 years of high-resolution CHAMP magnetic field data, they could, for all local times, derive the dependence of these currents on season, solar wind input and solar flux. In particular, by estimating currents separately for the two hemispheres, these dependences emerged very clearly. The cross-polar cap duskward net current peaks at local summer when the ionospheric conductivity is high. Conversely, the anti-sunward net current attains its largest values during local winter when conductivity gradients between the auroral region and the polar cap maximise. At these gradients Hall currents can be diverted into FACs. The out-of-phase variation of these two current types causes quite different responses of net current intensities in the two hemispheres to magnetic activity.
There are still a number of open questions about the relationship between auroral zone net currents and the asymmetric storm-time disturbances during the main phase. Suzuki and Fukushima (1984) proposed a closure of the net anti-sunward current through the duskside partial ring current. Conversely, Crooker and Siscoe (1981) argued that the magnetic signals from the excessive FACs around noon and midnight are sufficient to explain the asymmetry signal, but they did not tell anything about current closure in the magnetosphere. Ground-based measurements of the magnetic field eastward component at mid and low latitudes have been used to estimate anti-sunward net currents (for a review, see Iyemori, 2000). This author offers several options for magnetospheric return currents on the duskside located somewhere between the magnetopause and the ring current. Furthermore, it has never been investigated how the anti-sunward net current flow is split between the dawnside and duskside auroral regions. What is the effect of hemispheric differences in current strength due to seasonal variation? Can a detailed consideration of all these facts provide hints on the actual 3D geometry of the net anti-sunward current closure in the magnetosphere?
The C/NOFS satellite on its low-inclination orbit can be used to investigate the ring current asymmetry. On every revolution it samples ring current signals from all local times. Magnetic field readings of C/NOFS during the years 2008 through 2010 have been considered by Le et al. (2011) to study the ring current evolution during storms. The authors show that the disturbance signal is azimuthally symmetric before and after the storm. But during the main phase a clear asymmetry builds up, with enhanced amplitudes around the 18:00 LT sector and reduced values around 06:00 LT. During the storm recovery phase, the disturbance signal returns to symmetric distribution. The degree of asymmetry grows as the magnetic activity gets larger, but the local time sector in which the largest amplitudes are observed stays around 18:00 LT. Similar results concerning the asymmetry of the ring current effect have been derived from ground-based observations (e.g. Love and Gannon, 2009). These authors claim that the dawn–dusk asymmetry in the disturbance field is on average proportional to Dst. Newell and Gjerloev (2012) made use of a large number of magnetometers from the SuperMAG data repository. Their SMR index is similar to Dst but provides local time resolution with four sectors (SMR-00, SMR-06, SMR-12, SMR-18). By means of a superposed epoch analysis Newell and Gjerloev (2012) determined the response of their index to a magnetic storm. They found a clear dominance of the disturbance signal at 18:00 LT and the smallest deflections at 06:00 LT. All this is consistent with the notion of a partial ring current on the duskside. To check that inference, Lühr et al. (2017) had a look at in situ ring current density measurements by Cluster and other spacecraft. They could not confirm the enhancement of ring current intensity in the dusk sector. The strongest ring current parts during a magnetic storm are rather observed by these missions in the post-midnight sector. The difference in ring current interpretation from near-Earth observations and in situ measurements has been described in more detail by Lühr et al. (2017), but it is still an open issue.
In this study we make use of CHAMP data and follow up on the results presented by Zhou and Lühr (2017) to address the open questions listed above. Of special interest is the relation between the net anti-sunward current and the asymmetric storm-time effect at low latitudes. The prime basis for the investigations is the CHAMP magnetic field dataset from the 5 years 2001–2005. But recordings from geomagnetic observatories are also taken into account to characterise the near-Earth magnetic effects.
In the sections to follow we will first shortly introduce the data and basic processing algorithms for determining net currents. Section 3 presents a statistical survey of net currents at all local times. The dependence of anti-sunward net currents on solar wind input and season is analysed in Sect. 4. Section 5 presents for one magnetic storm a direct comparison between anti-sunward currents and ground-based disturbance levels. The mean characteristics of the ring current signal during magnetically active periods (Kp>6), as observed on the ground, are outlined in Sect. 6. In Sect. 7 the various observations are discussed, focusing on the comparison between anti-sunward currents and storm-time disturbance signals, and a new 3D current system is proposed for closing the anti-sunward net currents in the magnetosphere. Finally, in Sect. 8 the results are summarised.
The CHAMP satellite was launched into a near-circular polar orbit (inclination: 87.3∘) with an initial altitude of 456 km on 15 July 2000 (Reigber et al., 2002). By the end of the mission, 19 September 2010, the orbit had decayed to 250 km. The orbital plane covers all local times within 130 d when considering upleg and downleg arcs. The Fluxgate Magnetometer (FGM) onboard CHAMP recorded the vector magnetic field every 0.02 s with a resolution of 0.1 nT. The FGM magnetic field readings are calibrated routinely by using the observations of the onboard absolute scalar Overhauser Magnetometer. In this study the fully calibrated Level-3 magnetic field products (product identifier: CH-ME-3-MAG) are used (Rother and Michaelis, 2019), which are provided in the North-East-Center (NEC) framework with a time resolution of 1 Hz. The time period used in this study comprises the 5 years from 2001 to 2005, experiencing solar and magnetic activities from high to moderate levels. Five years of CHAMP magnetic field observations are just needed to sample all local times 14 times, evenly distributed over all seasons.
The approach for deriving net currents in the auroral region from CHAMP magnetic field data has been described in detail by Zhou and Lühr (2017). Here we use the same dataset and adopt their processing algorithm. Calculations are based on Ampère's law in integral form:
where I is the net current flowing through the closed integration contour, μ0 is the permeability of free space, BAT is the along-track magnetic field component caused by the current I, and dl is a differential path element along the CHAMP orbit. Equation (1) can be written in discrete form as
where m is the summation index, and Δl is the path length per increment (here 7.56 km for 1 s). To derive the along-track magnetic field component, BAT, we have subtracted from the CHAMP data the main field, crustal field and large-scale magnetospheric field, as represented by the POMME-6 high-resolution model (Maus et al., 2010). From the set of magnetic residuals the component BAT, aligned with the velocity vector, is calculated.
Zhou and Lühr (2017) derived net currents from integration along full CHAMP orbits. In addition, they applied integration loops confined to one hemisphere and could study hemispheric differences. Here we go one step further by estimating net currents flowing through a loop from subauroral latitudes up to the geomagnetic pole. In this way we get current estimates for all local times and can compare directly net current intensities on the dawnside with those on the duskside and noon with midnight results. The penalty for further detailing of the results is that we have to make certain assumptions about the magnetic fields along parts of the integration path where no direct observations are available. The considered integration paths for the two local time sectors along the orbit are sketched in Fig. 1. CHAMP magnetic field readings are taken from 50∘ magnetic latitude (MLat) (point A) up to the highest MLat reached along the orbit (point B). From there the virtual return path goes vertically down to point C, follows the Earth's surface until point D and goes vertically up to the start point A. The second loop follows the same scheme, taking CHAMP readings along the track from E to F and closing the loop along the virtual path (F–G–H–E).
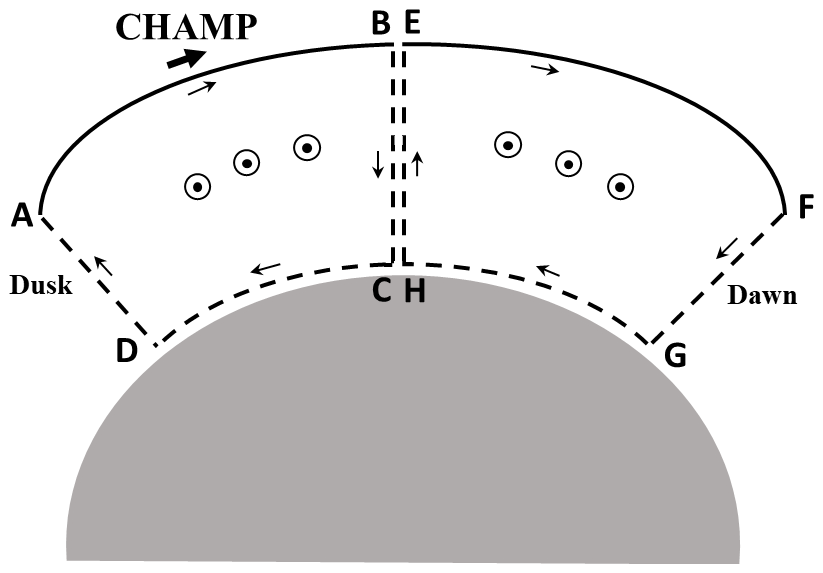
Figure 1Schematic drawing of the anti-sunward net current (small circles with dots) determination by the ring-integral approach at auroral latitudes, separately for the dawn and dusk local time sectors. Small arrows indicate the direction of integration. The unsampled but estimated virtual return paths are shown as dashed lines.
Since there are no measurements along the return path, we have to make assumptions about the magnetic field along that track. Here we follow the same reasoning and approach as successfully applied in the work of Zhou and Lühr (2017). Auroral net currents are connected to FACs on both ends. According to Fukushima's theorem (Fukushima, 1976), magnetic signatures from a pair of anti-parallel FACs closed by ionospheric currents vanish at the Earth's surface. The current configuration in our case, however, differs somewhat from the ideal case presented by Fukushima (1976); therefore, the theorem might not be fully applicable here.
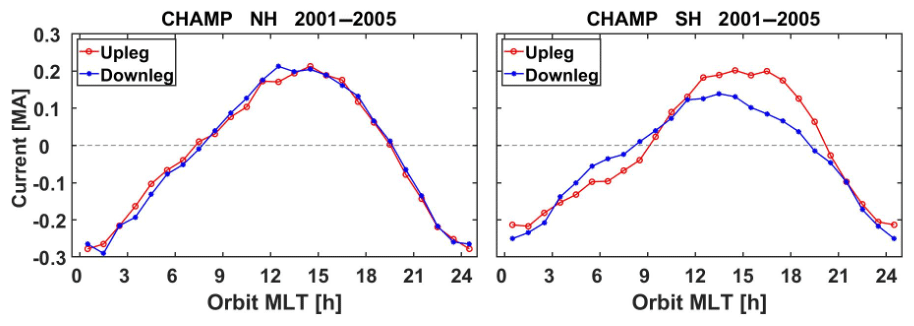
Figure 2Local time dependence of auroral net currents separately for results from upleg and downleg passes. Best matches, shown here, are obtained when the contributions from the vertical paths B–C and H–E are neglected.
To estimate the contributions from the unsampled parts, the following assumptions are made. (1) The contribution from C → D is similar in shape to that from A → B. (2) The contributions from D → A are proportional to the vertical field component Bz at point A since the radial magnetic field varies only smoothly through the current sheet altitude. We have modelled E-region currents flowing along the auroral oval connected to FACs on the noon and midnight ends. Resulting magnetic signals along a closed path as outlined in Fig. 1 were calculated. An outcome of this exercise is that the integral over A → B has to be multiplied by 1.2 to include the contributions from paths C to D and that the vertical magnetic field component, Bz, has to be multiplied by 11 times the orbital altitude and divided by the permeability of free space to represent the contributions from path D → A. For further validation of these corrections, see Zhou and Lühr (2017), Sect. 4.2. The same approach described here is also applied to the contour E–F–G–H–E. The remaining paths in the integration loops are B–C and E–H. Here again, the observed Bz component at point B (E) has been taken as a measure for scaling the missing contribution. We have tested a series of different factors multiplied by the Bz value at the top-side corners. There is a statistical way to validate the suitability of the applied factors. Each local time sector is sampled in two ways, on upleg passes and 130 d later on downleg passes. In these two groups the ring integral is calculated in opposite directions. Only in the case of a proper scaling of this vertical contribution are both results on average identical. From this test we found that the best agreement is obtained when the contributions from the vertical path elements in the middle are neglected. Figure 2 shows the final comparison for both hemispheres and all local times. For the Northern Hemisphere (left frame) we obtain, when ignoring the vertical paths, an almost perfect match between upleg and downleg results. The agreement is not as good for the Southern Hemisphere, but any additional contribution from this vertical path element makes the agreement between the curves worse. Our resulting assumption of insignificant contributions from the vertical path elements at the poles does not affect the total net current flowing over a polar region. It may just affect the partitioning of anti-sunward currents between the dawnside and duskside.
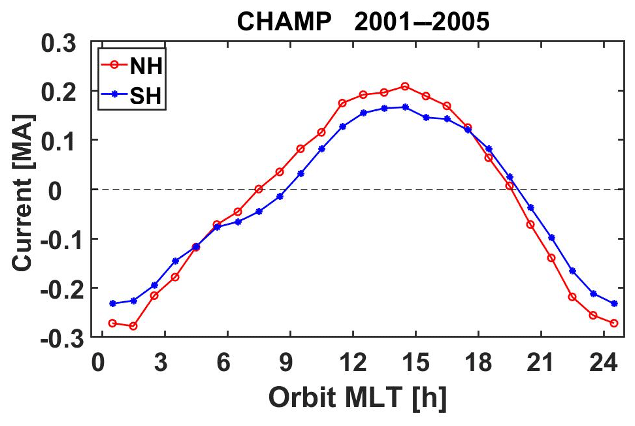
Figure 3Local time dependence of mean auroral net currents; comparison between the two hemispheres.
To obtain the average distribution of net currents at all local times, we consider CHAMP magnetic field data from the 5 years, 2001–2005. Overall 24 440 orbits with clean data are available. From each orbit we obtain two net current results for both hemispheres. This results in a large number (∼105) of samples for this study. Figure 3 shows the average local time variations of net currents in the Northern Hemisphere and Southern Hemisphere (upleg and downleg results are combined). Positive values represent eastward currents. On average we find somewhat larger values in the Northern Hemisphere than in the Southern Hemisphere. This is consistent with the observations of Zhou and Lühr (2017). Positive (eastward) net currents prevail within the local time sector 07:00–19:00 MLT, representing a dawn to dusk flow. The opposite sign is found around the 24:00 MLT sector, reflecting also dominant dawn to dusk currents.

Figure 4Distribution of mean eastward net currents in local time versus month of year frames separately for the two polar regions. Currents in the noon sector are strongest during the local summer season in the two hemispheres.
There is not only a local time variation of the net currents, but also a dependence on season. Figure 4 shows the distribution of current strength in a magnetic local time (MLT) versus month of year frame separately for the two hemispheres. We clearly find the strongest currents during local summer months, in particular around the noon sector in both polar regions. This figure should be compared with Fig. 6 in Zhou and Lühr (2017). The obtained current distributions agree very well with each other; just the amplitudes are reduced by a factor of 2 in the present case. This is expected since we integrate here the currents only from mid-latitude up to the pole. We regard the good match between the two independently derived figures as a verification for the present current calculations that are based on more assumptions about the integration path than the earlier results.
As outlined by Zhou and Lühr (2017), the larger net currents derived from noon/midnight orbits can be related to the cross-polar cap Pedersen currents closing the excessive Region 1 (R1) FACs. These are strongly dependent on ionospheric conductivity. The positive values around noon and the negative ones around midnight are both consistent with that notion. In this study we are more interested in the anti-sunward net currents on the dawnside and duskside. Therefore, we consider the average values from orbits within the local time sectors 03:00–09:00 MLT and 15:00–21:00 MLT as dawnside and duskside net currents, respectively. From Fig. 3 it is evident that a negative (westward) average current results from the 03:00–09:00 MLT sector and a positive (eastward) one from the 15:00–21:00 MLT sector. This means both sides contribute to an anti-sunward net current. The characteristics of these anti-sunward currents are of prime interest for this study.
Similarly to Zhou and Lühr (2017), we also investigate the dependence of anti-sunward net currents on magnetic activity. Differently from them, we look at the fractions flowing on the dawnside and duskside separately. As a measure for the solar wind input, we use the coupling function as defined by Newell et al. (2007). By somewhat rescaling this function, we obtain the so-called merging electric field, Em, which represents approximately the solar wind electric field in units of mV m−1
where VSW is the solar wind velocity in km s−1, By and Bz, both in nT, are the interplanetary magnetic field (IMF) components in GSM coordinates, and θ is the clock angle of the IMF. Em values have been smoothed over 15 min, and the propagation time from the bow shock to the ionosphere has been considered by a delay of 20 min (for more details, see Zhou and Lühr, 2017).
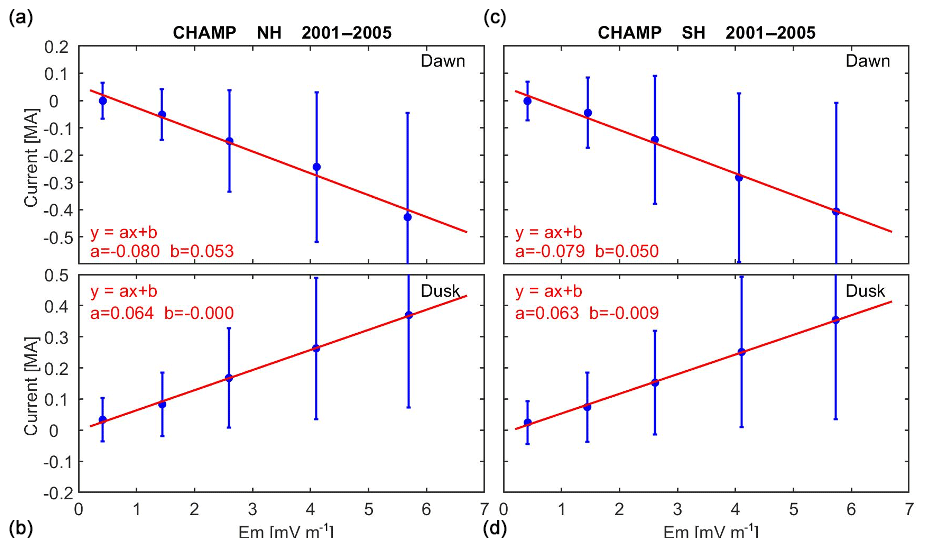
Figure 5The merging electric field, Em, dependence of net currents on the dawnside and duskside, separately for the Northern Hemisphere (a, b) and Southern Hemisphere (c, d). The solid dots with vertical bars indicate the mean values and standard deviation of the net eastward current for five levels of Em. Parameters of the linear fits (red lines) are listed in the top left corner of each frame.
Figure 5 shows the mean dependence of the eastward net currents on the dawnside and duskside on the merging electric field, Em, separately for the Northern Hemisphere and Southern Hemisphere. The current values had been grouped into five activity classes (, , , , mV m−1). Blue dots represent the mean values within these classes and the blue bars reflect the standard deviations. The mean values infer a good linear relationship between current intensity and merging electric field in all cases, as confirmed by the fitted red lines. On the dawnside westward currents get stronger with growing Em and correspondingly eastward currents intensify on the duskside. This confirms in all four cases an increase in anti-sunward currents with growing activity. Slopes are somewhat steeper on the dawnside than on the duskside. Interestingly, the net currents on the dawnside show a small positive bias (∼52 kA) for vanishing solar wind input. We relate that to the effect of net anti-sunward plasma flows driven by intense day-to-night winds in the early morning sector (e.g. Lühr et al., 2007) during very quiet periods.
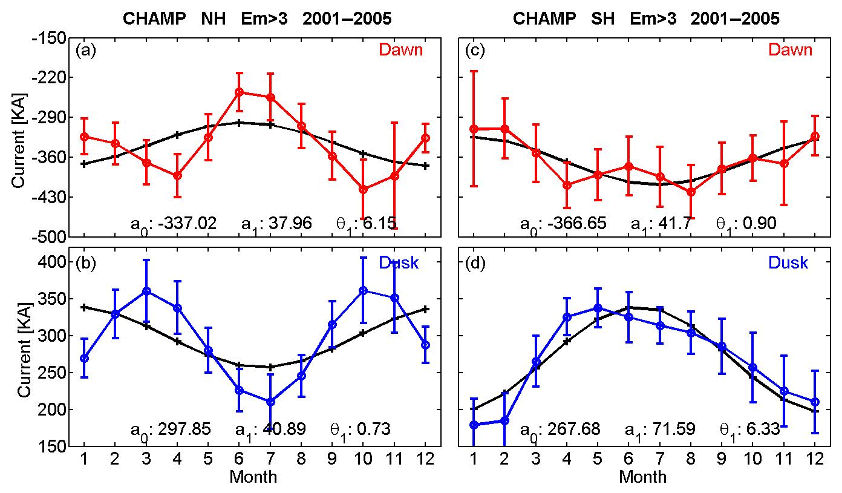
Figure 6The seasonal variation of eastward net currents. Presented are dawnside (a, c) and duskside (b, d) currents derived from high-latitude passes over the Northern Hemisphere (a, b) and Southern Hemisphere (c, d). Vertical bars represent the uncertainty of the monthly means. Black curves are sinusoidal fits to the observations. In each panel the constant term, a0, annual amplitude, a1 (both in kA), and the phases of the peaks, θ1 (in months), are listed.
As expected, the net currents on the flanks depend also on season. Figure 6 shows the mean annual variation of eastward net currents on the dawnside and duskside separately for the two hemispheres. Vertical bars represent the formal uncertainty of the mean value for each month. This analysis is based on data from more active periods with Em>3 mV m−1 (approximately ) since anti-sunward net currents are phenomena increasing with magnetic activity. We find in both hemispheres weaker anti-sunward currents in the summer hemisphere than at local winter. This holds for the dawnside and duskside and is consistent with the results of Zhou and Lühr (2017). Compared to the mean values, the relative annual variations are not too large (15 %–20 %) and have comparable sizes in both hemispheres. In the Northern Hemisphere a semi-annual signature is quite prominent, commonly referred to as the Russel–McPherron effect (Russel and McPherron, 1973). It reflects the typical annual variation of magnetic activity with maxima at equinoxes and a minimum around June solstice. The semi-annual variation is not so obvious in the Southern Hemisphere, but the annual amplitude is larger.
Table 1The Em dependence of the net eastward currents during the June and December solstice months for both the dawnside and duskside.
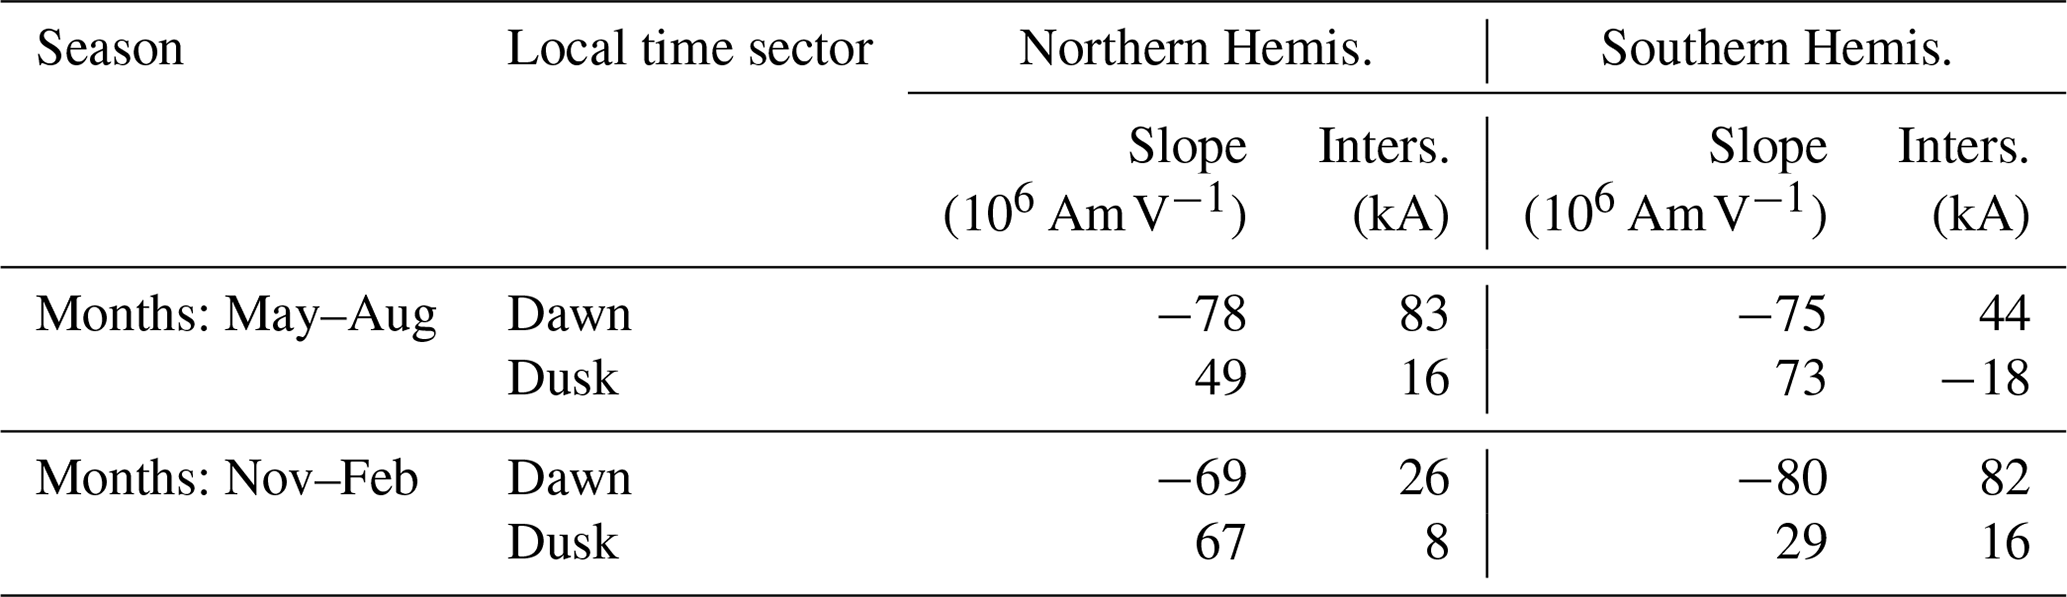
For completeness we have also calculated the dependence of the dawnside and duskside net eastward currents on solar wind input separately for the June and December solstice months and for the two hemispheres. Obtained results are listed in Table 1. The negative signs of the slopes on the dawnside and the positive ones on the duskside both represent increasing anti-sunward current intensity with enhanced solar wind input. When comparing the slopes of the dawnside and duskside between the two solstices, one finds a smaller seasonal difference on the dawnside than on the duskside. At dusk the factor is partly reduced to less than half during local summer with respect to local winter. Net currents in the dawn sector are obviously less dependent on sunlight in the ionosphere. This is consistent with Guo et al. (2014), who report that the eastward auroral electrojet intensity shows a larger seasonal variation (stronger in local summer) than the westward jet. Finally, it is interesting to note that in Table 1 the intercepts on the dawnside show systematically large sunward net currents (82 kA) in the summer hemispheres. This is consistent with the stronger day-to-night wind in the sunlit polar region (e.g. Lühr et al., 2007) which seems to control the anti-sunward plasma flow over the dawnside polar region during quiet times.
It has been suggested for quite some time that the anti-sunward currents are connected via FACs to the ring current (e.g. Suzuki et al., 1985). In particular, it is believed that net currents feed the partial ring current on the duskside. Here we want to check to which degree the CHAMP data support this inference. The partial ring current generally forms during the main phase of a magnetic storm.

Figure 7(b) Solar wind velocity and interplanetary magnetic field components (GSM) variations for the storm starting on 17 August 2003. (a) The SYM-H index evolution during the storm and the total anti-sunward net current are shown for comparison.
To investigate these connections in more detail, we have selected the geomagnetic storm on 17 August 2003. This event is well suited because CHAMP is crossing the auroral oval on orbits close to dawn/dusk. The storm is initiated by a sudden storm commencement (SSC) at 14:20 UT on 17 August. From the solar wind and IMF variations, shown in Fig. 7 (bottom), we can deduce that a sudden increase in solar wind speed from about 420 km s−1 to more than 500 km s−1 is responsible for the SSC. About an hour later, when IMF Bz turns negative, the main phase of the storm starts and extends into the next day. On that day the storm-time disturbance index reached a minimum of nT (see Fig. 7, top frame). It follows a typical recovery phase lasting several days. During part of that time IMF Bz is still negative, but the solar wind speed has returned to pre-event levels.
For comparison we present in the top frame of Fig. 7 the storm-time evolutions of the total anti-sunward net currents (blue curves), including contributions from both hemispheres, together with the SYM-H index (red curves). The SYM-H values are averages over the 10 min intervals when CHAMP crossed the polar regions. Right after the southward turning of IMF Bz intense anti-sunward currents (negative values) commence. About 4 h later currents recover to a moderate value but intensify again early next morning. This intermittent occurrence of net current continues into the recovery phase of the storm but with decreasing amplitudes.
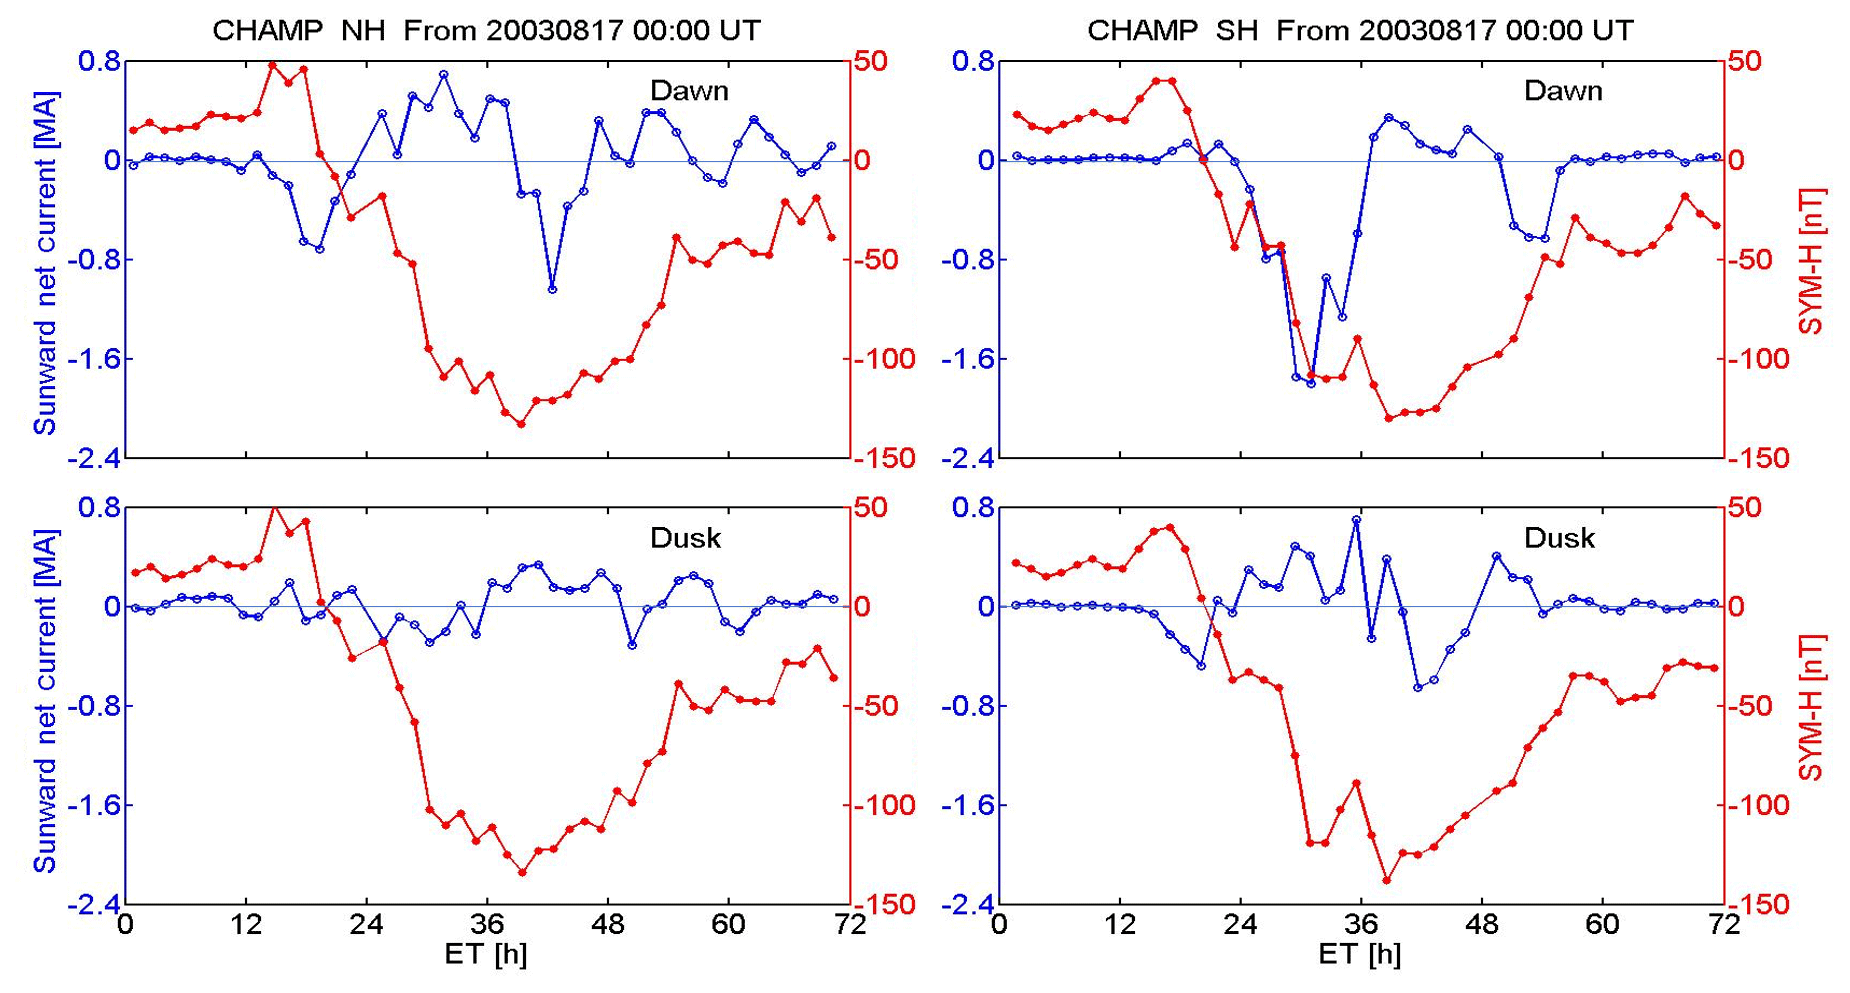
Figure 8Temporal evolutions of the SYM-H index and the net currents separately for both hemispheres and for dawnside and duskside during the storm on 17–20 August 2003. Magnetic local time ranges are the following. NH dawn passes: 06:00–09:00 MLT, NH dusk passes: 17:00–21:00 MLT, SH dawn passes: 03:00–10:00 MLT, and SH dusk passes: 17:00–23:00 MLT.
So far, we have seen the evolution of total net current intensity during the magnetic storm on 17 August. More details can be derived from Fig. 8, where the contributions from the two hemispheres are shown separately. The current signatures are quite different in the four sectors. Before the SSC, net currents in all frames are close to zero. Particularly intense anti-sunward currents, up to 2 MA, appear in the Southern Hemisphere (SH) on the dawnside during the main phase. Some hours before this strong signal, less intense anti-sunward currents are observed on the dawnside in the Northern Hemisphere (NH) and the duskside SH. It is interesting to note that there is in general a synchronous variation of net currents in these two antipodal sectors with somewhat smaller amplitudes in the south. For example, the prominent negative peaks around 42 h event time (ET) in both hemispheres, which occur at the start of the recovery phase. Even later in the recovery phase (∼55 h ET) a sizable anti-sunward current appears in the SH dawn sector. Different to the other sectors, there is only little net current activity on the NH duskside. Quite common for all four sectors, there is hardly any net current activity during times of northward IMF.
For the interpretation of the observations, we have to remember that the event takes place towards the end of northern summer. More intense anti-sunward currents are therefore expected in the SH. Also, the quietness on the NH duskside is consistent with our previously shown statistical results for that season. The quasi-synchronous variation of net currents at NH dawn and SH dusk could convincingly be explained with a control by IMF By on related FACs in the polar cap. Stronger anti-sunward currents are expected on the NH dawnside for negative IMF By and on the SH dawnside for positive IMF By. A direct comparison with the IMF observations, shown in Fig. 7, reveals a qualitative agreement. For example, the intense SH dawn current matches well with the positive excursion of IMF By around 30 h ET, but the details of phasing do not fit so well in other cases. At least for this event we can state that in both hemispheres more intense anti-sunward net currents are observed on the dawnside than on the duskside.
It would have been desirable to study more individual storms in this detail. But an event has to satisfy a number of conditions to provide instructive results on the temporal evolution of anti-sunward currents during a storm. The storm should occur close to one of the solstice seasons, and the local time of the CHAMP orbit has to be close to dawn/dusk. We have considered all storms during the CHAMP era (2000–2010) with Dst exceeding −100 nT. Just the presented event satisfied all these requirements reasonably well.
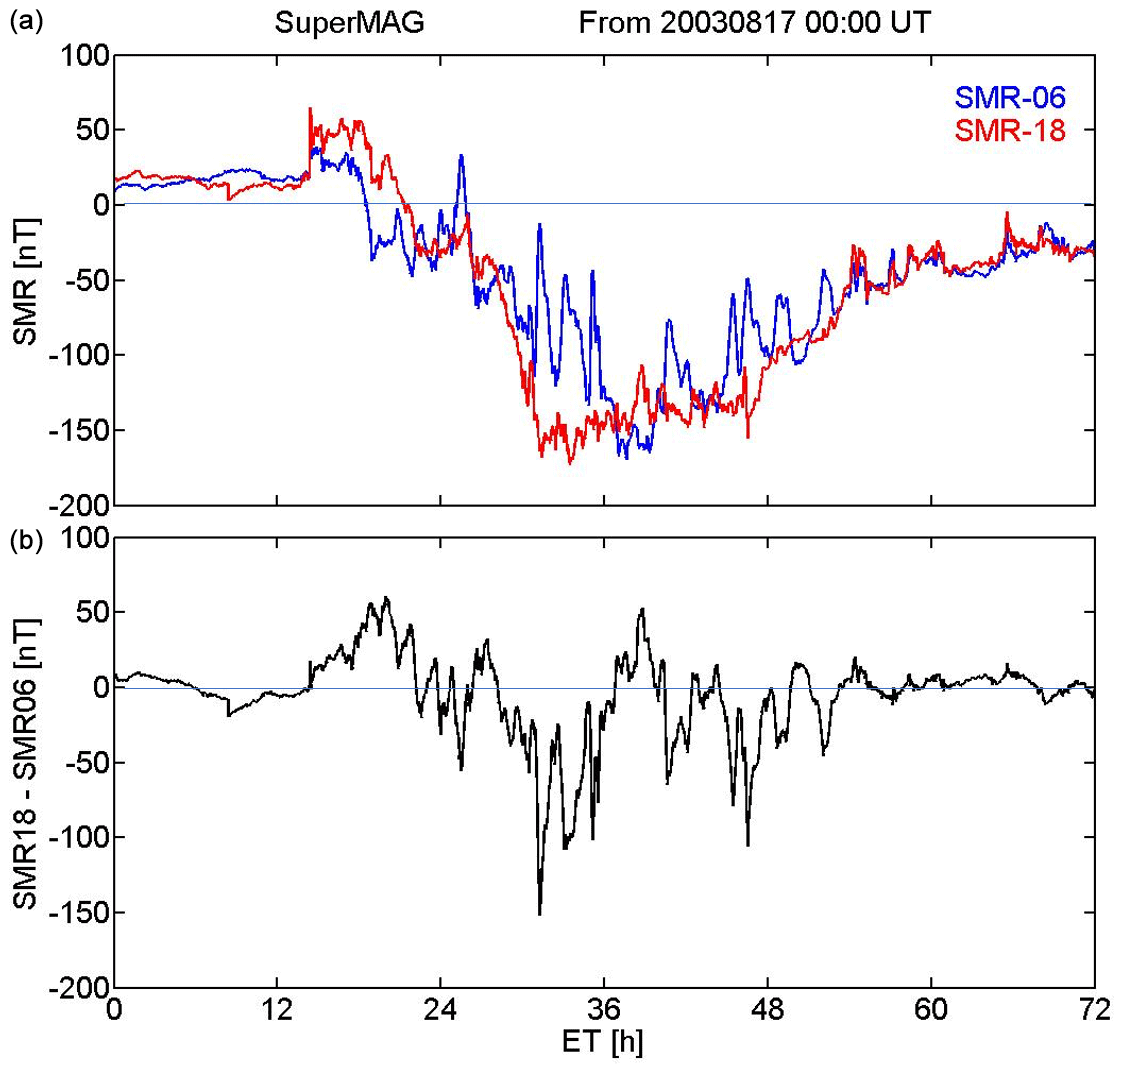
Figure 9(a) Temporal evolution of the SMR storm-time index from the 06:00 and 18:00 local time sectors. (b) Differences between the two time sectors (SMR-06 − SMR-18).
The observed anti-sunward currents are connected on both ends to FACs. These field-aligned currents have to close somewhere in the magnetosphere. Depending on the route these currents take, corresponding magnetic signatures are expected at the Earth's surface. Traditionally the Dst index (or SYM-H, as shown in Figs. 7 and 8) is used to describe the evolution of a storm. But this index reflects only the azimuthally symmetrical part of the magnetospheric fields. Therefore, it is not well suited for quantifying the asymmetric effects possibly caused by the auroral net currents. More appropriate for this purpose seems to be the SuperMAG ring current index, SMR. It is a quantity comparable to Dst or SYM-H but provides local time resolution from four sectors (SMR-00, SMR-06, SMR-12, SMR-18). More details about the SMR index can be found in Newell and Gjerloev (2012). By comparing the evolution of magnetic signatures on the evening and morning sides (SMR-18 and SMR-06), we may see the effect of a partial ring current. Figure 9 shows in the top frame the field deflections in these two time sectors during our storm. As expected, there are larger amplitudes observed on the evening side, in particular towards the end of the main phase. In the lower frame the differences between the two traces, SMR-18 minus SMR-06, are plotted. In this way we try to eliminate the contribution of the symmetrical ring current. Before and after the active phase of the storm the difference stays close to zero. Shortly after the SSC we find first positive deflections, i.e. a dominance of the dawn sector, and around the end of the main phase the prominent minimum, i.e. larger effects on the duskside. Thereafter the difference signal is more variable. A closer comparison between the SMR difference signal and the net currents in Fig. 8 reveals that the best (but not perfect) match is found with the CHAMP SH dawnside currents. However, these should, according to the traditional picture, weaken the ring current in the morning sector. At least for this storm the asymmetric Dst effect cannot be explained by an intensification of the duskside ring current. We will revisit this issue in the Discussion, Sect. 7.
From our study of the anti-sunward net currents, we know that the effects can be significantly different in the two hemispheres, mainly depending on the season. Although SMR provides information on local time differences, it does not distinguish between hemispheric sources.
In order to obtain more information on the net current seasonal effects in ground observations, we analysed magnetic field data from a meridional chain of observatories. Stations involved are Wingst (WNG, 54.15∘ DLat), L'Aquila (AQU, 42.45∘ DLat), Tamanrasset (TAM, 24.80∘ DLat), Bangui (BNG, 4.36∘ DLat), and Hermanus (HER, −33.86∘ DLat), where DLat is the latitude in dipole coordinates. Our study has shown that net currents are particularly strong during magnetic storms. We are therefore interested in magnetic field deflections at the observatories during disturbed times. The disturbance signal is determined from times with a magnetic activity index . Here the values around 06:00 and 18:00 MLT are considered since they are expected to show the largest difference. To study them, we had a look at the hourly averages of the horizontal component, H, from 03:00–06:00 UT and 15:00–18:00 UT, respectively. A quiet-time background field is subtracted, determined from hourly averages of the same UT times as above, but only data within the Kp=0–1 range are selected. In order to make the result well comparable with our net currents, we considered the same 5 years (2001–2005) as for CHAMP.

Figure 10Mean deflections of the H component in the dawn and dusk sectors at five considered observatories separately for different seasons during active times ().
The obtained mean horizontal disturbance fields are shown in Fig. 10 separately for the three Lloyd seasons: June solstice (May–August), December solstice (November–February) and combined equinoxes (March + April, September + October). As expected for such active periods, we get negative mean values (southward fields) in all the cases. The values in the evening sector are more negative than those from the morning sector. An exception is station WNG. Here the fields on the duskside are more positive, in contrast to the other observatories, than those from dawn. This observatory is located obviously too far north. Therefore, its readings are also affected by the auroral electrojet during severe storms, not only by the ring current. For that reason, we have not considered it any further in the analysis.
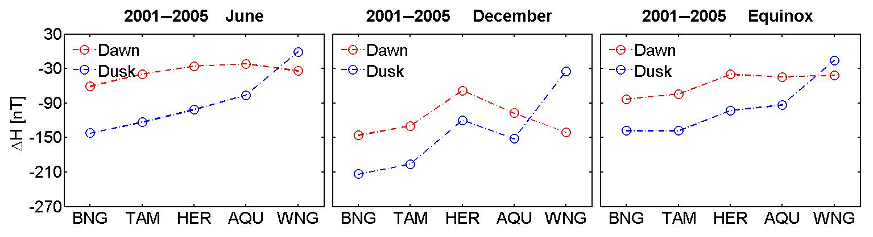
Figure 11Comparison of the mean H component deflections between the dawn and dusk sectors at the five observatories separately for different seasons during active times ().
The larger amplitudes at dusk than on the dawnside are traditionally attributed to the effect of the partial ring current. For a more quantitative evaluation of the asymmetry, we calculated the mean values of the hours 03:00 + 04:00 UT, representing the dawn levels and the means of 16:00 + 17:00 UT for the dusk values. These UT periods take into account the longitudes of the stations. The obtained mean values of H component deflections in the two time sectors are listed in Table 2. They are the basis for subsequent assessments. In addition, the latitudinal distribution of disturbance fields is shown in Fig. 11, separately for the three seasons. As can be seen, the expected dawn − dusk difference is consistently observed at all stations up to AQU. Furthermore, the overall largest negative deflections are obtained for the months around December and are smallest around June. This reflects the seasonal distribution of strong storms during the 5 years considered.
Table 2Mean deflections of the H component (in nT) from the years 2001–2005 at five observatories for different seasons during active times (Kp>=6). Dawn values are from 03:00 + 04:00 UT hourly averages and 16:00 + 17:00 UT averages for the dusk sector.
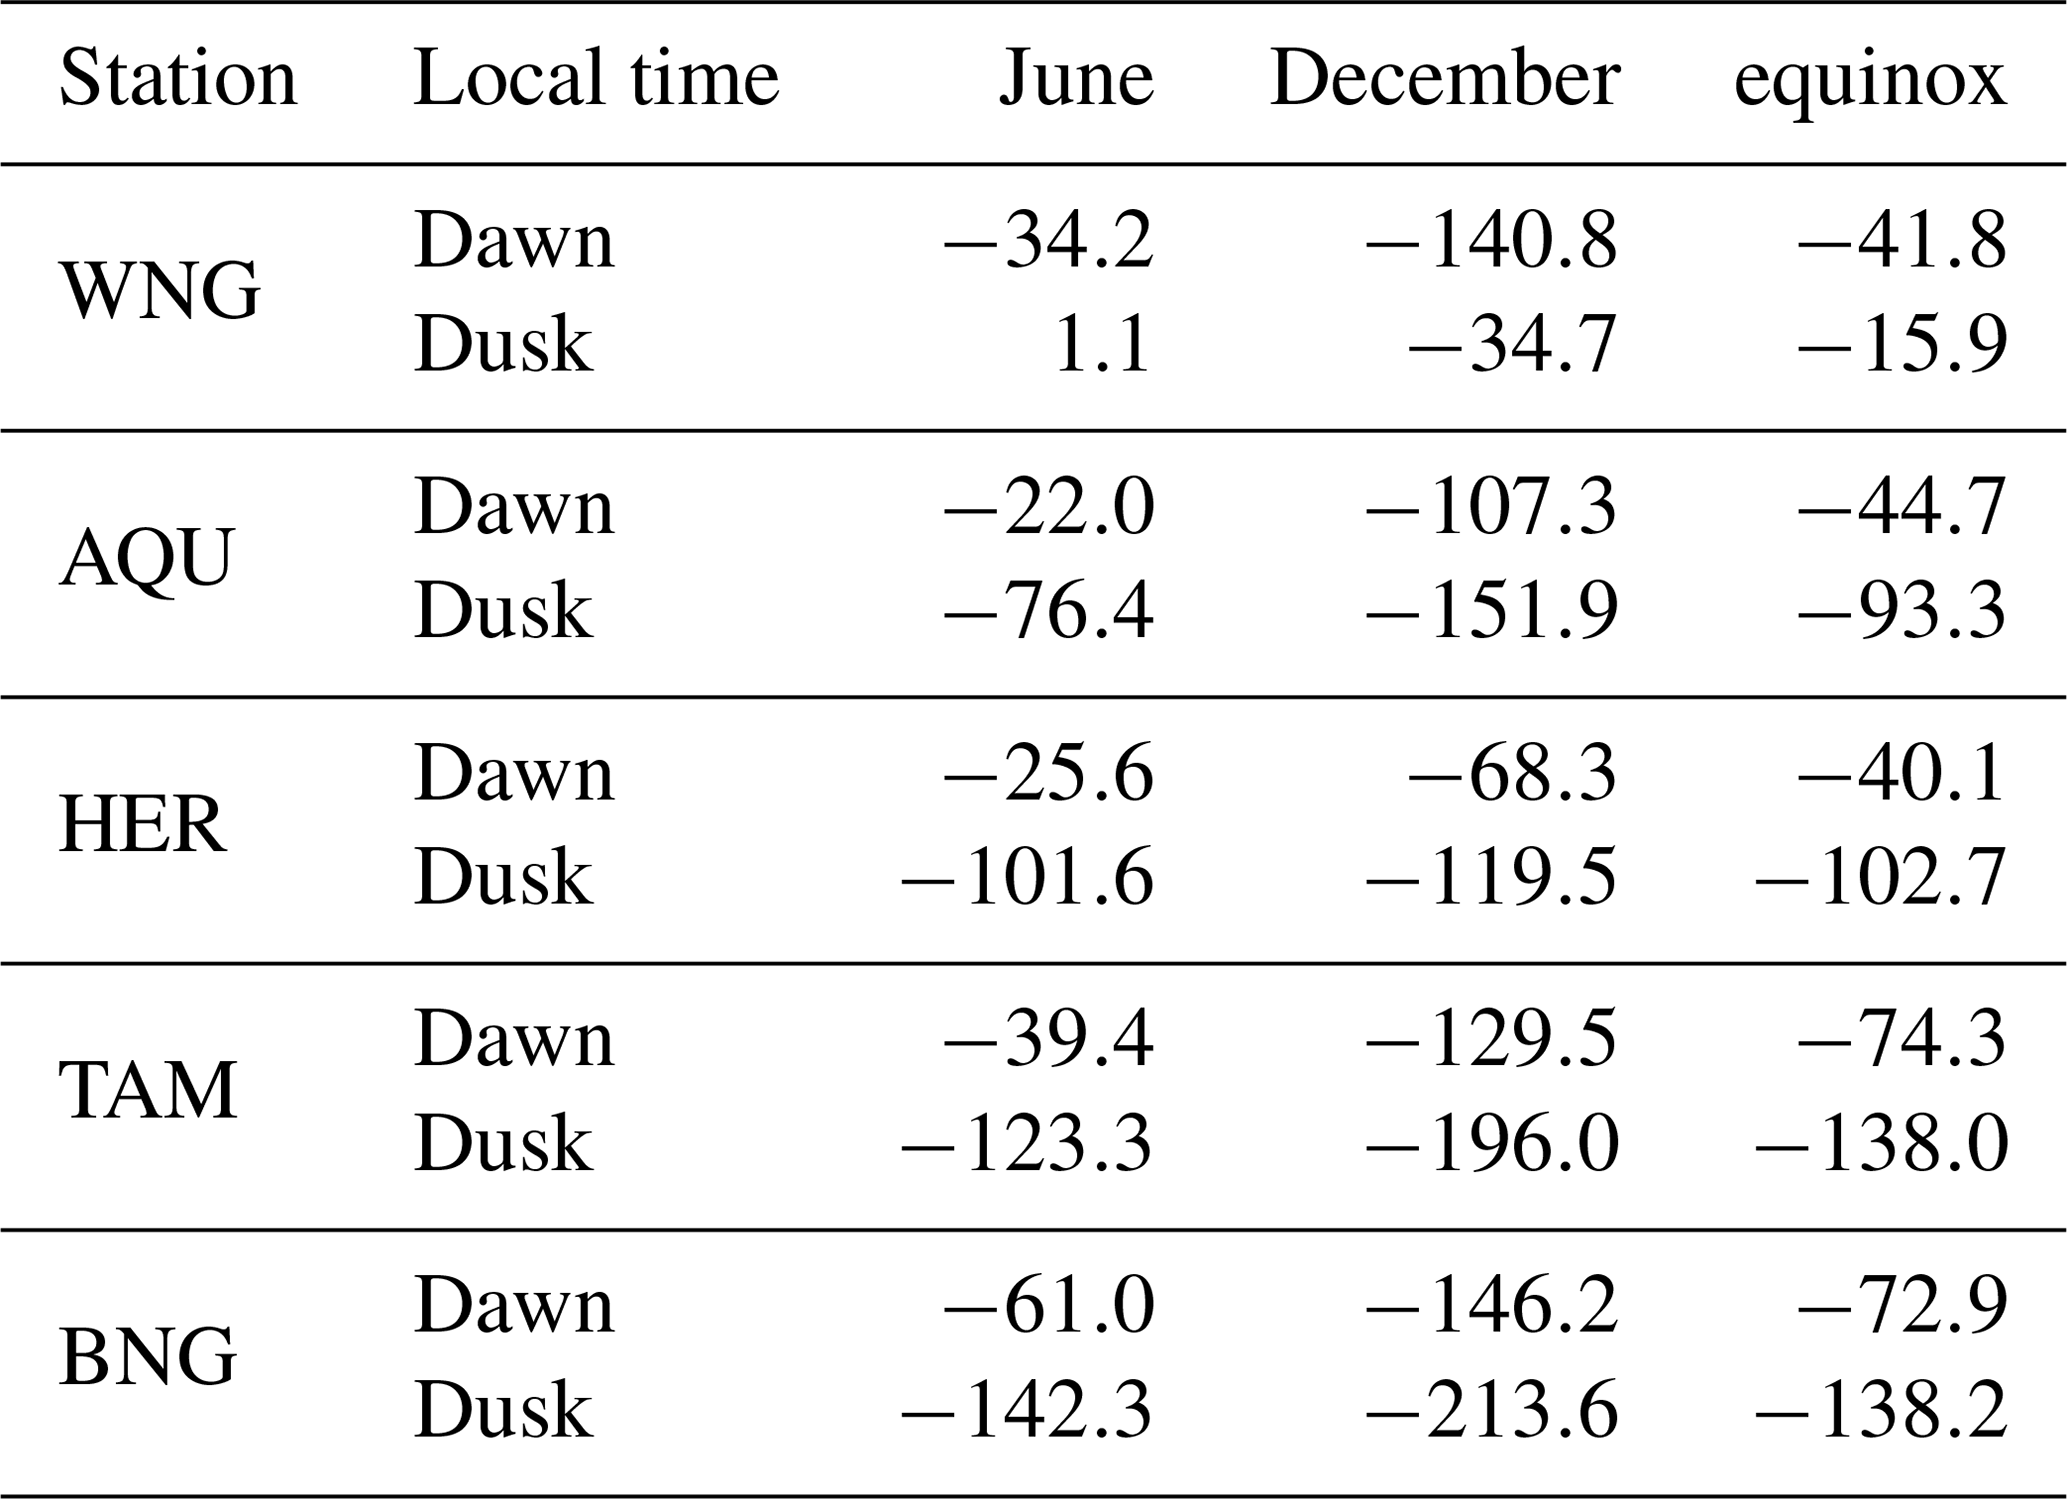
Table 3Mean dawn − dusk differences of the H component values (in nT) from Table 2 at four observatories for different seasons during active times (Kp>=6).
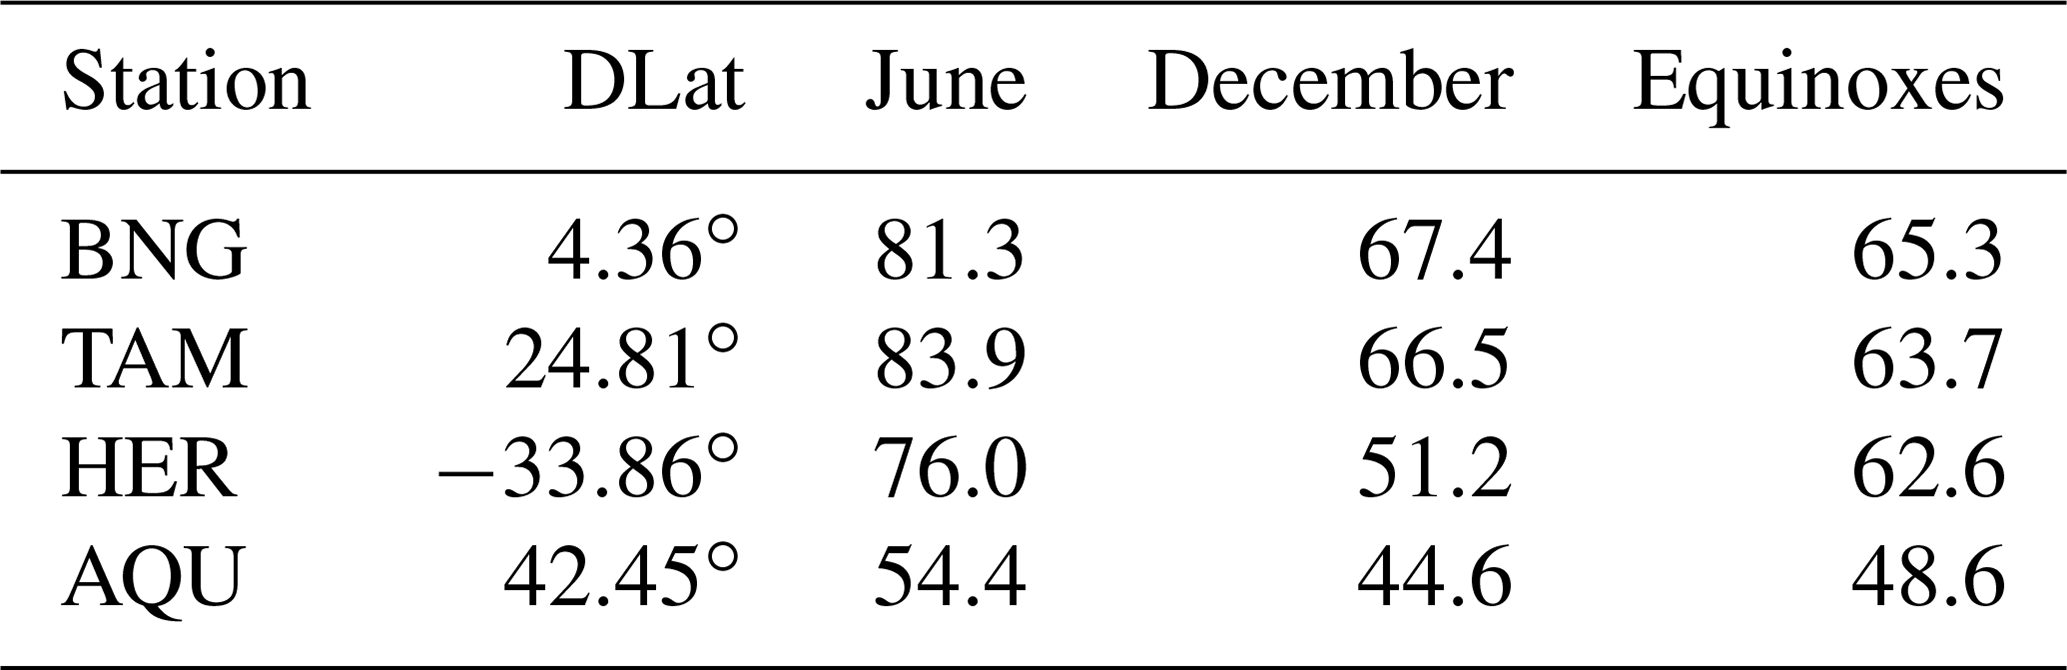
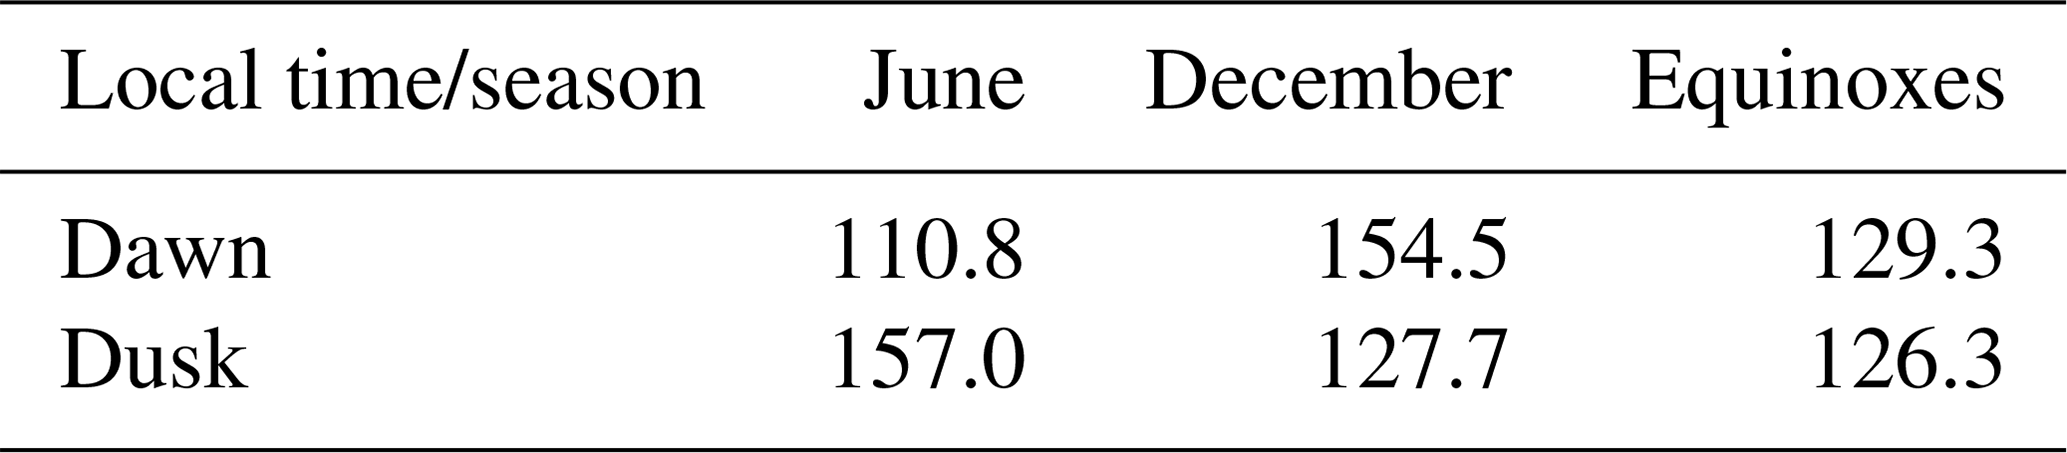
Here we are more interested in the asymmetry of the disturbance. The mean values of Hdawn−Hdusk, by considering all seasons, are BNG: 71.3 nT, TAM: 71.4 nT, HER: 63.3 nT, and AQU: 49.2 nT. The differences decrease with the distance from the geomagnetic equator. However, these morning − evening differences vary from season to season. In Table 3 the values are listed separately for the seasons. Clearly the largest asymmetries result for June solstice months. This is surprising because the relatively small negative H deflections around June compared to those of December months (see Table 2) indicate stronger storms in the latter season. For an explanation of this apparent inconsistency, we may have a look at the magnetic activities prevailing during the relevant periods. It has to be realised that the deflections on the dawnside and duskside are not measured simultaneously by our single chain of observatories. As a consequence, our selection criterion () is commonly fulfilled only in one time sector during a day. By the statistical approach we hoped that variations in magnetic activity would average out, which is obviously not the case. Table 4 lists the mean aP values for the three seasons and two local times. For equinox conditions the activity levels in the two sectors match well, but this is not the case for the solstice seasons. During months around June, duskside measurements are from clearly larger activity periods than the corresponding dawnside samples. In that case a stronger ring current effect at dusk will add to the asymmetry and therefore cause the enhanced differences in Table 3. Just the opposite scenario is true for the events around the December solstice. Here the reduced ring current activity on the duskside compared to dawn reduces the resulting asymmetry effect. As a consequence, we have to state, our ground-based observations are not sufficient to reveal the seasonal effect of the storm-time disturbance asymmetry. But there are other valuable results that can be deduced from them. The average result (2001–2005) of the ground-based observations reveals a mean disturbance field asymmetry of about 72 nT at the Equator, obtained for a weighted mean magnetic activity level of aP=134 nT (Kp∼7). This can be compared with the total anti-sunward current flowing under these conditions. On average a merging electric field, Em=1 mV m−1, corresponds to an activity level of aP=21 nT, giving Em=6.4 mV m−1 for aP=134 nT. By multiplying the corresponding Em=6.4 mV m−1 by the slopes of the regression lines in Fig. 5, we obtain a global anti-sunward net current of about 1.7 MA relating to the disturbance asymmetry of 72 nT.
Table 4Mean aP values (in nT) of the times considered for the ground-based study, separately for the three seasons and the two local times.
The ring current signal has also been measured by the C/NOFS satellite. On its low-latitude orbit any azimuthal asymmetries of this signal can well be detected. In a dedicated study, Le et al. (2011) clearly confirmed the appearance of an asymmetry during the storm main phase. During the recovery phase the signal becomes symmetric again. In a later study Lühr et al. (2017) performed a statistical survey of the type of asymmetry. For different classes of magnetic activity, the mean differences between dawn and dusk deflections were determined and the local time where the maximum appeared. For high activity, Kp>6, they obtained a center displacement of 38 nT, half the difference between dawn and dusk signals. This can be compared with the difference of disturbance levels that we derived here for periods of Kp>6 from the observatories. We obtained a mean value of 72 nT near the Equator, which is slightly less than the corresponding result from C/NOFS (76 nT). An explanation for the difference between the two values could be our averaging over 2 h of dawnside and duskside measurements, while in the case of C/NOFS the actual minimum and maximum values are compared. Overall, the two independent types of measurements confirm each other, including the level of disturbance asymmetry.
In this study we investigated the statistical properties of anti-sunward net currents in the auroral regions and their relation to ground-based signatures at middle and low latitudes. The general properties of auroral net currents had been presented by Zhou and Lühr (2017). Here we go one step further by determining the anti-sunward currents flowing on the dawnside and duskside separately.
7.1 Dependence on season and solar wind input
As expected, the net current intensity is directly proportional to the solar wind coupling function, Em. This has been reported earlier (e.g. Nakano and Iyemori, 2005). When looking at annual averages the resulting net currents are about the same for enhanced activity (e.g. Em>3 mV m−1) in the dawn and dusk sectors and in both hemispheres (see Fig. 6). However, obvious differences appear when taking the local seasons into account. From Table 1 we can deduce that the slopes of the current intensity curves with respect to Em are similar on the dawnsides for local summer and local winter. Conversely on the duskside, the obtained Em dependences are clearly steeper for winter than for summer conditions. This is valid for both hemispheres. We interpret it as an indication that the conductivity gradient on the duskside between the auroral region and the polar cap is much steeper in the winter hemisphere than in the sunlit summer. Differently from that, dawnside conductivity gradients seem to be less season dependent.
When evaluating the average hemispheric net current characteristics from Table 1, we obtain for Em=6 mV m−1 () intensities of about 640 and 810 kA in each hemisphere for summer and winter conditions, respectively. It has been reported earlier (e.g. Guo et al., 2014) that the intensity of the eastward electrojet on the duskside depends more directly on the Sun-induced conductivity. Obviously, the stronger summer-time eastward electrojet contributes less to the anti-sunward net currents. The closure of those electrojet currents across the polar cap seems to be quite efficient during the sunlit season.
A detail, interesting to note, is that for vanishing solar wind input, Em=0, i.e. due northward IMF, we obtain, in particular on the dawnside during the summer season, sunward net currents of about 80 kA in both hemispheres. The reason for this is probably the day-to-night wind over the polar cap that is driving anti-sunward plasma drift, overcoming the dawn to dusk electric field effect and causing net currents in opposite directions. More dedicated studies would be needed to elucidate the details of a high-latitude wind dynamo under such special conditions.
7.2 Comparison with ground-based observations
We have shown that the magnetic field effects of anti-sunward currents are also observable on the ground. Our satellite results imply that the asymmetry between dawn and dusk disturbance signals during magnetically active periods should be larger in the winter hemisphere and the seasonal effect more prominent at mid-latitude ground stations than near the Equator. However, our statistical study of recordings from a single European–African meridional chain is not sufficient to confirm the seasonal difference between hemispheres. It would require at least two meridional chains separated by about 180∘ in longitude to monitor storm-time disturbances in the morning and evening sectors simultaneously.
Nakano and Iyemori (2005) had deduced anti-sunward net currents from eastward magnetic field deflections at mid-latitude stations around noon and midnight. They report, consistent with our satellite results, that ground-based signals are larger in the winter hemisphere than in the sunlit hemisphere. Since the asymmetric storm-time disturbance signal is expected to result mainly from the connected field-aligned currents, mid-latitude stations in the same hemisphere are predominantly affected by it. This implies that recordings in the summer hemisphere underestimate the disturbance level during active periods. Because of the Northern Hemisphere dominance of Dst stations, this is expected to happen in summer. An over-proportional reduction of the mean Dst index during months around June solstice, compared to other activity indices, e.g. Kp, was reported earlier (e.g. Mursula and Karinen, 2005). In their Fig. 1 they show that the average H component deflections at the Northern Hemisphere index observatories reach almost 0 nT at the beginning of July, while at Hermanus the zero level is attained around New Year. In our view this Northern Hemisphere Dst minimum can be explained by the combined effect of the well-known annual July magnetic activity minimum with the weaker asymmetric disturbance signal in the summer hemisphere. At Hermanus the July minimum is much less prominent, but therefore December and January values are reduced by the asymmetric disturbance. Just for completeness, we may note that Mursula and Karinen (2005) offered another explanation for the Dst July minimum which we do not regard as so convincing.
Rather interesting features are revealed from the event study of the magnetic storm on 17 August 2003. The evolution of sunward currents, as shown in Fig. 8, is quite different on the dawnside and duskside in the two hemispheres. Several of the statistical features presented in the previous sections can also be found in this event that occurred under northern summer conditions. The largest currents are detected in the Southern, winter Hemisphere on the dawnside during the storm main phase. In the Northern, summer Hemisphere, the duskside currents exhibit only small amplitudes. This is consistent with the mean seasonal dependences of that local time sector (see Table 1). Sizable net currents appear on the dawnside in the Northern Hemisphere at times when they are low in the Southern Hemisphere. This hemispheric alternation in current flow can be related to the varying direction of the IMF By component.
To check the magnetic effects of the net currents on the ground, we had a look at the SMR index for this event (see Fig. 9). We expected a clear dominance of SMR-18 over SMR-06. But only a moderate negative difference appears towards the end of the main phase in the lower frame of that figure. Over large parts of the storm-time the signal varies about the zero line. For the interpretation of this result, we have to note that most of the observatories contributing to the SMR index are located in the Northern Hemisphere. Because of the prevailing summer season, the asymmetry is expected to be underestimated.
There is a certain anti-phase variation of the SMR difference in Fig. 9, with the sunward currents in Fig. 8 on the NH dawnside and SH duskside. Prominent peaks appear around 19 and 41 h ET in both figures but with opposite sign. This indicates that at the listed peak times the negative deflections in the Northern Hemisphere are stronger on the dawnside than on the duskside. The largest negative peak in the SMR difference signal, around 30 h ET, is well aligned with the strong anti-sunward current on the SH dawnside, but it is not as large as expected from the strong SH net current deduced from CHAMP data. This observation provides clear evidence that the effect of auroral net currents can be recognised by the asymmetry of mid-latitude observatory readings, but the two hemispheres should be interpreted separately. It may be more instructive to have separate asymmetry values from the SuperMAG stations for the Northern Hemisphere and Southern Hemisphere. With the present distribution of stations, contributing to SMR, it is expected that this effect will be underestimated around June solstice and overestimated during December.
7.3 Suggestion for a 3D current circuit
When comparing the CHAMP net currents at the four quadrants with the temporal evolution of the SYM-H or SMR indices, we find the strongest net currents in the dawn sector and particularly in the Southern, winter Hemisphere (see Fig. 8) during the storm main phase. The traditional suggestion was that the auroral net currents, in particular those from the evening sector, are connected to the ring current and intensify the part in the dusk sector (e.g. Suzuki et al., 1985). But just on the duskside we find only weak anti-sunward currents during our August 2003 storm. In previous works the term “partial ring current effect” is frequently used. This was mainly meant as an acronym for an azimuthally asymmetric disturbance signal during magnetic storms (e.g. Iyemori, 2000). The presented observations in this paper and previous publications considering in situ ring current density distributions (see Lühr et al., 2017, for a review) provide little evidence of a direct connection between auroral net currents and the ring current. Here we want to introduce our idea of the 3D current circuit connected with the anti-sunward currents.
From electrodynamic considerations it can be assumed that the FACs on the nightside are connected to the net currents at steep conductivity gradients. This locates them at fairly high latitudes near the border between auroral oval and polar cap. Field lines from this border do not connect to the ring current, but reach out close to the magnetopause. During the storm main phase a lot of current flows along the electrojets from the day to night sides, which cannot be returned to the dayside across the poorly conducting polar cap (in particular in the dark hemisphere). The excessive current flows out along field lines to the outer magnetosphere on the dawnside and duskside flanks.
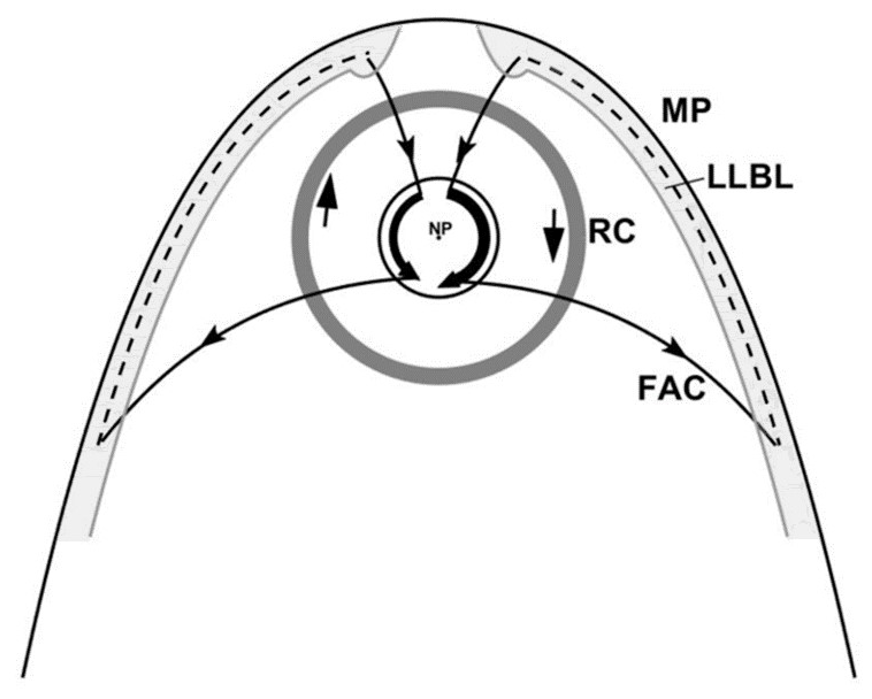
Figure 12Schematic drawing of the suggested 3D current circuits causing the storm-time disturbance asymmetries. Field-aligned currents flowing out of the dynamo region on the dayside feed the anti-sunward net currents in the polar region. On the nightside FACs lead the currents into the outer magnetosphere on the dawn and dusk flanks. Here the currents are assumed to flow sunward within the low-latitude boundary layer (LLBL) to close the loops. Equivalent current circuits are expected in the Southern Hemisphere.
Figure 12 presents a schematic drawing of the envisaged 3D current circuit. Shown is a view of the Northern Hemisphere. Equivalent current routes are assumed on the southern side. No connection to the ring current is foreseen.
For the field-aligned currents flowing on the dayside into the ionosphere, we assume that they originate from a dynamo region in the low-latitude boundary layer (LLBL). In a comprehensive review, Lundin (1988) describes important properties of the magnetospheric boundary layer. In his Sects. 6 and 7 he outlines dynamo action and the connection between the LLBL dynamo and the ionosphere. Following an injection of magnetosheath plasma into the LLBL, due to reconnection, the initially existing plasma at rest is accelerated tailward, which will set up polarisation electric fields in the dynamo region. As a consequence, FACs flow into the ionosphere. Dependent on the orientation of IMF By, the injection takes place before or after local noon. Already Bythrow et al. (1981) noticed from observations the excessive FAC flow, besides the Region 1 and Region 2 systems, into the ionosphere near noon. In our schematic picture, Fig. 12, the LLBL is depicted by grey shading and the dynamo regions are indicated by the bulges around the earthward FACs. Current closer is envisioned through the LLBL from the tail region to the dayside.
A current flowing through our dawnside circuit will generate a northward magnetic field on the ground, thus reducing the Dst effect. Conversely, net currents through the dusk loop cause a southward field, enhancing the ring current effect. Regardless of the side on which the net currents close, the same kind of asymmetry results. The near-Earth disturbance signals at middle latitudes from these current circuits are dominated by the magnetic effects of the connecting FACs. For the resulting asymmetries, it does not make a big difference at which distance in the magnetosphere the currents close, in the ring current or further out near the magnetopause.
With the 3D current circuit suggested here, it is no problem to understand why enhanced disturbance levels always appear around 18:00 MLT (see Le et al., 2011) independent of the magnetic activity level. Already Love and Gannon (2009) had noticed that storm-time disturbances are commonly higher around the 18:00 MLT sector. They even suggested a linear relation between the asymmetry amplitude and the Dst value. The asymmetry should amount on average to about 20 % of the Dst value. This claim was challenged by Siscoe et al. (2012). These authors tried to identify a magnetospheric process that could systematically enhance the ring current intensity in the dusk sector. In the end they were not able to offer a convincing explanation.
We claim that our 3D current circuit, driven by plasma injection through magnetic reconnection on the dayside, can better explain the observed features of the asymmetry signal. It seems to be a quite stable circuit in space. Therefore, the localisation to 18:00 MLT independent of activity is achievable. We do not believe in a dependence of the asymmetry amplitude on the Dst value. But in a statistical sense, Em and Dst are related; therefore, the result of Love and Gannon (2009) can be explained. More correlated studies of magnetic fields and currents in the outer magnetosphere and near-Earth observations are needed to confirm our 3D current configuration.
In this study we have investigated the auroral net currents flowing anti-sunward. For the first time, we present the partitioning of contributions from the dawnside and duskside and from the two hemispheres to the total net current. These magnetic storm-time phenomena show significant dependences on solar wind input, season, and IMF By orientation. Of particular interest here is the complete current circuit including the field-aligned currents attached to the anti-sunward currents and the closure in the magnetosphere. Important results may be summarised as follows.
-
Anti-sunward currents grow on average proportionally with the solar wind input (merging electric field, Em). This is valid for the dawnside and duskside and for all seasons.
-
More intense currents are observed in the winter hemisphere than in the summer hemisphere. We relate that to the steeper conductivity gradients between auroral zone and polar cap during dark seasons. In the winter hemisphere a larger part of the electrojet return current has to be by-passed through the magnetosphere via FACs.
-
The seasonal dependence of net currents is significantly larger on the duskside than on the dawnside. In the sunlit summer hemisphere the anti-sunward current intensity in the evening sector is greatly reduced compared to its value under winter conditions (see Table 1). On an annual average, more anti-sunward current is flowing on the dawnside (10 %–20 %).
-
Event studies of magnetic storms confirm the connection between anti-sunward auroral currents and the asymmetric storm-time disturbance signal. From the event studied we see that this claim holds for the total net current. But the partitioning of the current through the different loops can change during a storm several times between the dawnside and duskside and the two hemispheres. Responsible for the preferred path are the prevailing season and the IMF By orientation.
-
We propose a 3D current system causing the asymmetric storm-time disturbances that is driven by reconnection-related plasma injections on the dayside. Earthward-directed field-aligned currents around noon feed the anti-sunward high-latitude net currents, and around midnight FACs carry the currents into the outer magnetosphere on the tailside. A closure of the loops is anticipated by currents through the low-latitude boundary layers on the dawn and dusk flanks. We do not find evidence of a connection of this circuit with the ring current.
To confirm our claims about the large-scale current system causing the asymmetric storm-time magnetic disturbances, more observations in the outer magnetosphere should be analysed.
The ground observations of the magnetic field are available at http://www.intermagnet.org (last access: 18 June 2020) (INTERMAGNET, 2020). The CHAMP magnetic field data (product identifier: CH-ME-3-MAG, https://doi.org/10.5880/GFZ.2.3.2019.004; Rother and Michaelis, 2019) are available at ftp://isdcftp.gfz-otsdam.de/champ/ME/Level3/MAG/ (last access: 18 June 2020). The POMME-6 geomagnetic field model can be downloaded from the website at http://geomag.colorado.edu/pomme-6-magnetic-model-of-the-earth.html (last access: 18 June 2020) (CIRES, 2020). The OMNI data are available at https://spdf.gsfc.nasa.gov/pub/data/omni/high_res_omni/ (last access: 18 June 2020) (NASA, 2020). The SMR data are downloaded from http://supermag.jhuapl.edu/indices/ (last access: 18 June 2020) (SuperMAG, 2020).
The study concept and the first draft of the manuscript were contributed by HL. Data collection and analysis were performed by YLZ. Both authors responded to review comments and approved the final manuscript.
The authors declare that they have no conflict of interest.
The authors thank Ingo Michaelis for his great effort in improving the CHAMP Level 3 magnetic field data. The CHAMP mission was sponsored by the Space Agency of the German Aerospace Center (DLR) through funds of the Federal Ministry of Economics and Technology. The work of Yun-Liang Zhou is supported by the National Key R&D Program of China (no. 2018YFC1407303).
The work of Yun-Liang Zhou is supported by the National Key R&D Program of China (grant no. 2018YFC1407303).
The article processing charges for this open-access
publication were covered by a Research
Centre of the Helmholtz Association.
This paper was edited by Anna Milillo and reviewed by two anonymous referees.
Bythrow, P. F., Heelis, R. A., Hanson, W. B., Power, R. A., and Hoffman, R.: Observational evidence for a boundary layer source of dayside Region 1 field-aligned currents, J. Geophys. Res., 86, 5577–5589, 1981.
CIRES: POMME-6CE2 geomagnetic field model, available at: http://geomag.colorado.edu/pomme-6-magnetic-model-of-the-earth.html, last access: 18 June 2020.
Crooker, N. U. and Siscoe, G. L.: Birkeland Currents as the Cause of the Low-Latitude Asymmetric Disturbance Field, J. Geophys. Res., 86, 11201–11210, 1981.
Fukushima, N.: Generalized theorem for no ground magnetic effect of vertical currents connected with Pedersen currents in the uniform-conductivity ionosphere, Rept. Ionos. Space Res. Japan, 30, 35–40, 1976.
Guo, J., Liu, H., Feng, X., Pulkkinen, T. I., Tanskanen, E. I., Liu, C., Zhong, D., and Wang, Y.: MLT and seasonal dependence of auroral electrojets: IMAGE magnetometer network observations, J. Geophys. Res.-Space, 119, 3179–3188, https://doi.org/10.1002/2014JA019843, 2014.
INTERMAGNET: Ground-based geomagnetic field data, available at: http://www.intermagnet.org, last access: 18 June 2020.
Iyemori, T.: Formation of the storm-time ring current and the Dst field: Some recent topics, in: Magnetospheric Current Systems, Geophys. Monogr. Ser., edited by: Ohtani, S., Fujii, R., Hesse, M., and Lysak, R., AGU, Washington, D.C., 118, 331–338, https://doi.org/10.1029/GM118p0331, 2000.
Le, G., Burke, W. J., Pfaff, R. F., Freudenreich, H., Maus, S., and Lühr, H.: C/NOFS measurements of magnetic perturbations in the low-latitude ionosphere during magnetic storms, J. Geophys. Res.-Space, 116, A12230, https://doi.org/10.1029/2011JA017026, 2011.
Love, J. J. and Gannon, J. L.: Revised Dst and the epicycles of magnetic disturbance: 1958–2007, Ann. Geophys., 27, 3101–3131, https://doi.org/10.5194/angeo-27-3101-2009, 2009.
Lühr, H., Rentz, S., Ritter, P., Liu, H., and Häusler, K.: Average thermospheric wind patterns over the polar regions, as observed by CHAMP, Ann. Geophys., 25, 1093–1101, https://doi.org/10.5194/angeo-25-1093-2007, 2007.
Lühr, H., Xiong, C., Olsen, N., and Le, G.: Near-Earth magnetic field effects of large-scale magnetospheric currents, Space Sci. Rev., 206, 521–545, https://doi.org/10.1007/s11214-016-0267-y, 2017.
Lundin, R.: On the magnetospheric boundary layer and solar wind energy transfer into the magnetosphere, Space Sci. Rev., 48, 263–320, 1988.
Maus, S., Manoj, C., Rauberg, J., Michaelis, I., and Lühr, H.: NOAA/NGDC candidate models for the 11th generation International Geomagnetic Reference Field and the concurrent release of the 6th generation POMME magnetic model, Earth Planets Space, 62, 729–735, 2010.
Mursula, K. and Karinen, A.: Explaining and correcting the excessive semiannual variation in the Dst index, Geophys. Res. Lett., 32, L14107, https://doi.org/10.1029/2005GL023132, 2005.
Nakano, S. and Iyemori, T.: Storm-time field-aligned currents on the nightside inferred from ground-based magnetic data at midlatitudes: Relationships with the interplanetary magnetic field and substorms, J. Geophys. Res., 110, A07216, https://doi.org/10.1029/2004JA010737, 2005.
NASA: OMNI solar wind data available at https://spdf.gsfc.nasa.gov/pub/data/omni/high_res_omni/, last access: 18 June 2020.
Newell, P. T. and Gjerloev, J. W.: SuperMAG-based partial ring current indices, J. Geophys. Res., 117, A05215, https://doi.org/10.1029/2012JA017586, 2012.
Newell, P. T., Sotirelis, T., Liou, K., Meng, C.-I., and Rich, F. J.: A nearly universal solar wind-magnetosphere coupling function inferred from 10 magnetospheric state variables, J. Geophys. Res., 112, A01206, https://doi.org/10.1029/2006JA012015, 2007.
Reigber, C., Lühr, H., and Schwintzer, P.: CHAMP mission status, Adv. Space Res., 30, 129–134, https://doi.org/10.1016/S0273-1177(02)00276-4, 2002.
Rother, M. and Michaelis, I.: CH-ME-3-MAG – CHAMP 1 Hz combined magnetic field time series (Level 3), GFZ Data Services, https://doi.org/10.5880/GFZ.2.3.2019.004, 2019.
Russell, C. T. and McPherron, R. L.: Semiannual variation of geomagnetic activity, J. Geophys. Res., 78, 92–108, https://doi.org/10.1029/JA078i001p00092, 1973.
Siscoe, G. L., Love, J. J., and Gannon, J. L.: Problem of the Love-Gannon relation between the asymmetric disturbance field and Dst, J. Geophys. Res., 117, A09216, https://doi.org/10.1029/2012JA017879, 2012.
Stauning, P. and Primdahl, F.: First detection of global dawn-dusk ionospheric current intensities using Ampère's integral law on Ørsted orbits, Geophys. Res. Lett., 27, 3273–3276, https://doi.org/10.1029/2000GL011954, 2000.
SuperMAG: SMR index data available at http://supermag.jhuapl.edu/indices/, last access: 18 June 2020.
Suzuki, A. and Fukushima, N.: Sunward or anti-sunward electric current in space below the MAGSAT level, Geophys. Res. Lett., 9, 345–347, https://doi.org/10.1029/GL009i004p00345, 1982.
Suzuki, A. and Fukushima, N.: Anti-sunward current below the MAGSAT level during magnetic storms, J. Geomagn. Geoelectr., 36, 493–506, https://doi.org/10.5636/jgg.36.493, 1984.
Suzuki, A., Yanagisawa, M., and Fukushima, N.: Anti-sunward space currents below the MAGSAT level during magnetic storms and its possible connection with partial ring current in the magnetosphere, J. Geophys. Res., 90, 2465–2471, 1985.
Yamashita, S., Iyemori, T., Nakano, S., Kamei, T., and Araki, T.: Antisunward net Birkeland current system deduced from the Oersted satellite observation, J. Geophys. Res., 107, 1263, https://doi.org/10.1029/2001JA900160, 2002.
Zhou, Y.-L. and Lühr, H.: Net ionospheric currents closing field-aligned currents in the auroral region: CHAMP results, J. Geophys. Res.-Space, 122, 4436–4449, https://doi.org/10.1002/2016JA023090, 2017.
- Abstract
- Introduction
- Dataset and calculation of net auroral currents
- Statistical survey of net current distribution
- Dependence of anti-sunward net current on solar wind input and on season
- Variation of anti-sunward net currents during a magnetic storm
- Ground-based signature related to anti-sunward net current
- Discussion
- Summary and conclusions
- Data availability
- Author contributions
- Competing interests
- Acknowledgements
- Financial support
- Review statement
- References