the Creative Commons Attribution 4.0 License.
the Creative Commons Attribution 4.0 License.
 | 21 Apr 2020
Cosmic noise absorption signature of particle precipitation during interplanetary coronal mass ejection sheaths and ejecta
Emilia Kilpua
Liisa Juusola
Maxime Grandin
Antti Kero
Stepan Dubyagin
Noora Partamies
Adnane Osmane
Harriet George
Milla Kalliokoski
Tero Raita
Timo Asikainen
Minna Palmroth
We study here energetic-electron (E>30 keV) precipitation using cosmic noise absorption (CNA) during the sheath and ejecta structures of 61 interplanetary coronal mass ejections (ICMEs) observed in the near-Earth solar wind between 1997 and 2012. The data come from the Finnish riometer (relative ionospheric opacity meter) chain from stations extending from auroral (IVA, 65.2∘ N geomagnetic latitude; MLAT) to subauroral (JYV, 59.0∘ N MLAT) latitudes. We find that sheaths and ejecta lead frequently to enhanced CNA (>0.5 dB) both at auroral and subauroral latitudes, although the CNA magnitudes stay relatively low (medians around 1 dB). Due to their longer duration, ejecta typically lead to more sustained enhanced CNA periods (on average 6–7 h), but the sheaths and ejecta were found to be equally effective in inducing enhanced CNA when relative-occurrence frequency and CNA magnitude were considered. Only at the lowest-MLAT station, JYV, ejecta were more effective in causing enhanced CNA. Some clear trends of magnetic local time (MLT) and differences between the ejecta and sheaths were found. The occurrence frequency and magnitude of CNA activity was lowest close to midnight, while it peaked for the sheaths in the morning and afternoon/evening sectors and for the ejecta in the morning and noon sectors. These differences may reflect differences in typical MLT distributions of wave modes that precipitate substorm-injected and trapped radiation belt electrons during the sheaths and ejecta. Our study also emphasizes the importance of substorms and magnetospheric ultra-low-frequency (ULF) waves for enhanced CNA.
- Article
(5506 KB) - Full-text XML
- BibTeX
- EndNote


Precipitation of high-energy (E>30 keV) electrons from the inner magnetosphere into the Earth's ionosphere is an interesting fundamental plasma process that can have significant consequences on the atmospheric chemistry (e.g. Rodger et al., 2010; Andersson et al., 2014; Seppälä et al., 2015; Turunen et al., 2016; Newnham et al., 2018). This process is also of particular interest for climate models (e.g. Matthes et al., 2017), but its details and external factors governing the efficiency of precipitation are currently not well understood. The electron precipitation can result from substorm injections from the nightside plasma sheet or from the scattering of trapped electrons in the Van Allen radiation belts surrounding the Earth. Precipitation can occur also during pulsating aurora and exhibit modulation at similar timescales as the auroral emission (e.g. Grandin et al., 2017b).
Substorm injections occur predominantly from before midnight to midnight (e.g. Aminaei et al., 2006; Beharrell et al., 2015) from geostationary orbit to about 9 Earth radii (e.g. Spanswick et al., 2010), and electrons then drift around the Earth along the morning side (e.g. Kavanagh et al., 2007; Grandin et al., 2017a). The precipitation signatures also vary depending on the substorm phase. The growth phase is characterized by a relatively weak but intensifying precipitation region which extends in longitude (in particular westward) and moves to lower latitudes (e.g. Hargreaves et al., 1975; Ranta et al., 1981). Short duration spikes are identified during the onset associated with rapid particle acceleration into the ionosphere (e.g. Hargreaves et al., 2001), while in the growth phase precipitation proceeds to lower latitudes (e.g. Pytte et al., 1976). For both the freshly injected substorm electrons and the electrons trapped in the Van Allen belts, the precipitation is considered to be primarily facilitated through pitch-angle scattering following interaction with very-low-frequency (VLF) waves – in particular, due to cyclotron resonance with the lower-band chorus whistler waves. The precipitation via whistler waves is considered most efficient for a few tens of kiloelectronvolts of energy electrons, while they mostly accelerate higher-energy (>500 keV) electrons (e.g. Bortnik and Thorne, 2007; Lam et al., 2010). A high-amplitude chorus can, however, cause microburst precipitation of megaelectronvolt trapped electrons (e.g. Thorne et al., 2005; Osmane et al., 2016; Douma et al., 2019). Ultra-low-frequency (ULF) Pc5 waves also play an important role. The Coroniti and Kennel (1970) theory predicts that ULF waves may enhance energetic-electron precipitation by periodically increasing the growth rate of whistler waves. Observational evidence supporting this theory was provided by Motoba et al. (2013) during a conjunction between the Cluster satellites and a ground-based riometer (relative-ionospheric-opacity-meter) station.
Another wave mode that is invoked to precipitate electrons through gyroresonance are electromagnetic-ion-cyclotron (EMIC) waves. They have been shown to be able to precipitate both megaelectronvolt (e.g. Usanova et al., 2014) and sub-megaelectronvolt electrons (e.g. Blum et al., 2019; Hendry et al., 2019), although the efficiency of sub-megaelectronvolt electron precipitation is still debated. Both chorus and EMIC waves occur outside the high-density plasmasphere, whose outer boundary, the plasmapause, varies significantly in location with geomagnetic activity and also with the magnetic local time (MLT) (O'Brien and Moldwin, 2003). Inside the plasmasphere, precipitation occurs primarily due to plasmaspheric hiss (Li et al., 2015). Hiss waves can scatter electrons over a wide range of energies, but the scattering times increase significantly with increasing electron energy and decreasing hiss wave power (e.g. Selesnick et al., 2003; Summers et al., 2008; Kavanagh et al., 2018). For a few tens to a few hundred kiloelectronvolts of energy scattering typically requires time periods from hours to days.
The occurrence of above-described wave modes has a strong dependence on MLT: chorus waves are observed predominantly in the morning sector and at noon (e.g. Aryan et al., 2014; Li et al., 2009) as they arise from gyroresonance instability due to anisotropic distribution of substorm-injected electrons (Smith et al., 1996). Hiss waves are concentrated on the dayside magnetosphere extending to dusk and dawn sectors (e.g. Malaspina et al., 2016) with the strongest amplitude recorded at dusk (Kim and Shprits, 2019). They are believed to result from nonlinear growth of chorus waves when they transfer into the plasmasphere (e.g. Bortnik et al., 2008; Hartley et al., 2018). The EMIC waves in turn occur predominantly in the duskside of the magnetosphere close to the plasmapause, as they are generated by anisotropic ring current proton distributions (Zhang et al., 2016; Saikin et al., 2016).
Several statistical studies have highlighted differences in geomagnetic and radiation belt responses and in precipitation signatures during different large-scale solar-wind drivers (e.g. Huttunen et al., 2002; Borovsky and Denton, 2006; Potapov, 2013; Kilpua et al., 2015; Asikainen and Ruopsa, 2016; Kilpua et al., 2017b; Shen et al., 2017; Grandin et al., 2017a; Benacquista et al., 2018), namely interplanetary coronal mass ejections (ICMEs; e.g. Kilpua et al., 2017a) and slow–fast stream interaction regions (SIRs; e.g. Richardson, 2018). ICMEs are generally known to drive the strongest geomagnetic storms, while SIRs and the following fast streams cause more moderate, but sustained, geomagnetic activity (e.g. Borovsky and Denton, 2006; Grandin et al., 2019). At the geostationary orbit (), SIR-/fast-stream-driven storms more efficiently enhance megaelectronvolt radiation belt electrons than ICME-driven storms that cause deeper and longer depletions. Shen et al. (2017), however, showed that at the heart of the outer belt (–5) and low L shells ICMEs enhance more effectively both megaelectronvolt and lower-energy electron fluxes. A comparison of energetic-particle precipitation during ICMEs and SIRs shows that the former tend to produce a higher riometer precipitation signal during the first hours of the geomagnetic storm (Longden et al., 2008), whereas the latter may lead to energetic-electron precipitation for up to 4 d following the storm onset (Grandin et al., 2017a). A case study of an ICME event by Longden et al. (2007) found that most of the precipitation observed during the related geomagnetic storm was produced by substorm-injected particles on the nightside. On the dayside, precipitation events occurred in good correlation with solar-wind dynamic-pressure pulses. Kavanagh et al. (2012) performed an extensive epoch analysis of electron precipitation during high-speed streams using riometer data. The study showed that precipitation enhances at the arrival of the SIR, peaks about half a day after its arrival and typically continues for several days during the following high-speed stream, in agreement with Longden et al. (2008). The MLT distribution of precipitation suggests that it is related to substorm activity.
Most studies consider ICMEs as a single entity, although they consist of two highly different solar-wind structures, the turbulent sheath with a high dynamic pressure and the considerably smoother ejecta where the solar-wind dynamic pressure tends to be low (e.g. Kilpua et al., 2017a). As a consequence, the sheaths and ejecta lead to very distinct forcing of the magnetosphere and hence very different geomagnetic disturbances (e.g. Huttunen et al., 2002; Nikolaeva et al., 2011; Krauss et al., 2015; Kilpua et al., 2017b): sheaths perturb the high-latitude magnetosphere more efficiently, while ejecta drive strong ring current disturbances more efficiently. The work by Kilpua et al. (2013) also showed that the interplanetary magnetic field (IMF) and the solar-wind dynamic-pressure fluctuation power in the Pc5 range is significantly higher in the sheaths than in the ejecta. As a consequence, it is expected that the inner magnetosphere responds differently to sheaths and ejecta. Recent studies (e.g. Kilpua et al., 2015, 2019b; Lugaz et al., 2015; Turner et al., 2019) have indeed highlighted that sheaths and ejecta have distinct responses in energetic-electron fluxes in the radiation belts. A key characteristic of sheaths is that they cause long and sustained depletions of electron fluxes at a wide range of energies and L shells. While ejecta often deplete the belt as well, they induce less strong depletions, and fluxes also tend to rise during them. The effectiveness of sheaths to deplete the belts is partly related to their strong dynamic pressure that can effectively enhance magnetopause shadowing. On the other hand, the average ULF Pc5 and EMIC wave powers in the inner magnetosphere are higher during sheaths than during ejecta (Kalliokoski et al., 2019; Kilpua et al., 2019b).
In this paper, we perform detailed statistical analysis of energetic-electron precipitation during the sheath and ejecta parts of ICMEs. Our key data come from the Finnish riometer chain operated and maintained by the Sodankylä Geophysical Observatory (SGO). The precipitation response during sheath and ejecta is studied as well as the dependence on MLT. In particular our investigation of MLT dependence in the coverage of enhanced precipitation and magnitude of precipitation signal in riometer data reveals some interesting features and distinct differences between the sheaths and ejecta. We also perform a case study for an ICME event that consisted of particularly turbulent sheath and a flux-rope-type ejecta featuring extended intervals of steadily southward interplanetary magnetic field. This more detailed information on general characteristics of precipitation in ICME substructures is important for understanding the precipitation and physical mechanisms leading to precipitation. The paper is organized as follows: in Sect. 2 we present the data used in the study. In Sect. 3 we present our case study of an ICME on 14–17 July 2012, and in Sect. 4 we present the statistical results. In Sect. 5 we discuss and summarize our results.
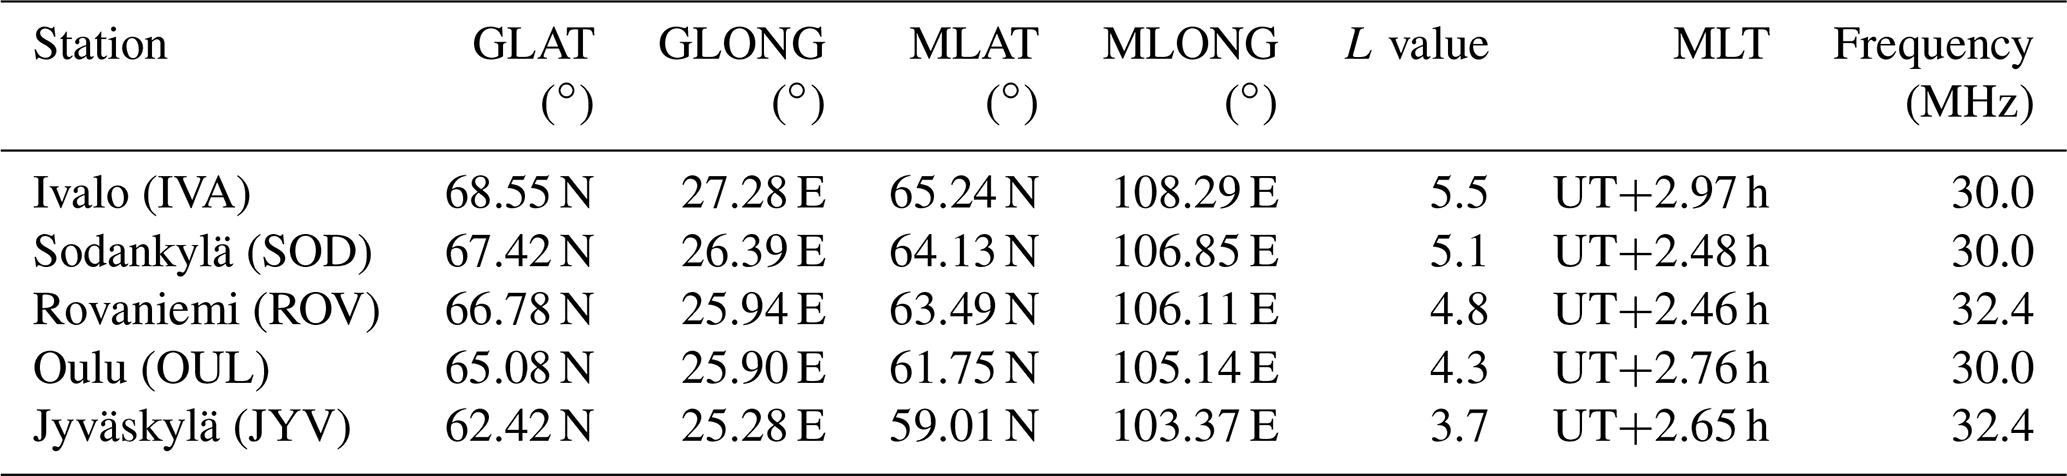
Riometers (relative ionospheric opacity meters; e.g. Shain, 1951; Little and Leinbach, 1959; Hargreaves, 1969) are passive radars recording the power of cosmic radio noise that reaches the ground. Their main application is the study of energetic-particle (E>30 keV) precipitation, which enhances the ionization in the D region of the ionosphere and leads to absorption of the cosmic radio noise. By subtracting the power measured by a riometer during a geomagnetic event from a quiet-day curve, one obtains the cosmic noise absorption (CNA), which is proportional to the height-integrated D region electron density enhancement due to energetic-particle precipitation. In this study, we use CNA data from five stations of the SGO riometer chain in Finland, whose locations are indicated with red triangles in Fig. 1 and whose coordinates and observed frequencies are given in Table 1. The stations are equipped with narrow-band wide-beam (60∘) riometers that operate at about 30 MHz frequencies. More details on the CNA derivation (in particular the determination of the quiet-day curve) from SGO riometer observations can be found in Sect. 2.1.3 of Grandin (2017).
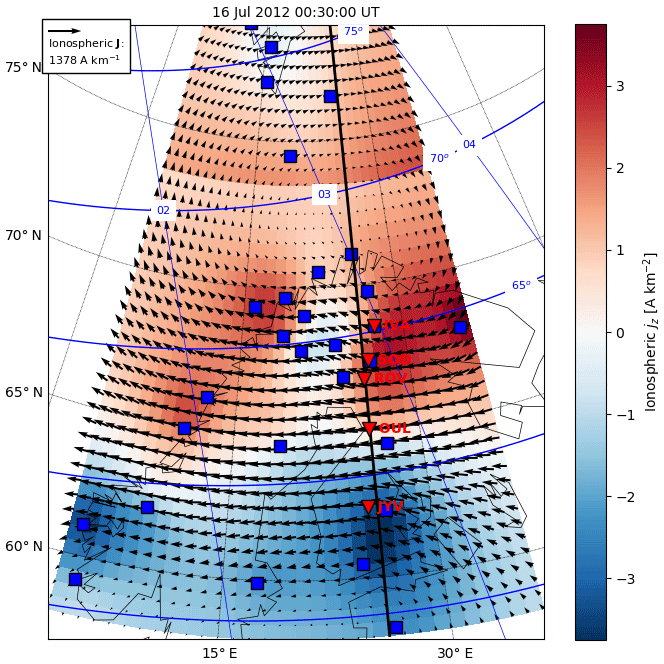
Figure 1Locations of the riometer stations IVA, SOD, ROV, OUL, and JYV (red) and IMAGE magnetometers (blue). The vectors and colour show the ionospheric equivalent current density and its curl, derived from IMAGE data. The vertical black line marks the longitude along which latitude profiles of the east–west component of the equivalent current density and the curl have been extracted in order to create Fig. 2. The blue grid indicates the magnetic latitudes and magnetic local times.
We manually removed the cases where clear disturbances in the data occurred, e.g. due to interference from human-made systems. Following the study by Grandin et al. (2017b), we set the CNA threshold value for significant energetic-particle precipitation to 0.5 dB, which is clearly above the noise level in the original 1 min CNA data (∼0.1–0.2 dB).
We have used 10 s International Monitor for Auroral Geomagnetic Effects (IMAGE; https://space.fmi.fi/image/, last access: 4 April 2020) magnetometer data to derive latitude–longitude maps of the ionospheric equivalent current density with the 2-D Spherical Elementary Current System (SECS) method (Amm, 1997; Amm and Viljanen, 1999; Pulkkinen et al., 2003) as described by Juusola et al. (2016). Before applications of the 2-D SECS method, a baseline was subtracted from the measurements according to van de Kamp (2013). Figure 1 shows the locations of the magnetometer stations with data available for this event and an example of the derived equivalent current density distribution (arrows) for one time instance. The background colour shows the curl of the equivalent current density as a proxy for the field-aligned current density. Positive values indicate the downward direction of the current, and negative values indicate the upward direction. Although the curl does not provide correct values for the field-aligned current density, Weygand and Wing (2016) have shown that it can be used to estimate the location of the region-1/region-2 current boundary. The analysis has been carried out in geographic coordinates, but the magnetic (quasi-dipole; Richmond, 1995) latitude and magnetic local time (MLT) grid is indicated in the plot for reference. This example shows a strong westward electrojet with a downward region-1 current on the poleward flank and an upward region-2 current on the equatorward flank, consistent with the early-morning sector, MLT. The black vertical line in the plot marks the longitude 26∘ E, along which the riometer stations are roughly located. We have extracted latitude profiles of the east–west component of the equivalent current density and the curl along this longitude from a time series of such plots and used them to construct Fig. 2.
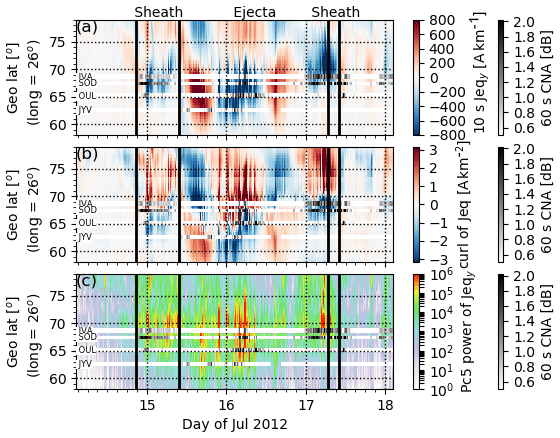
Figure 2(a) Geographic latitude profiles of the auroral ionosphere eastward electrojet current density (Jeqy) at 26∘ E, derived from 10 s IMAGE magnetometer measurements, (b) curl of the equivalent current density as a proxy for field-aligned current density (positive downward), and (c) Pc5 pulsation power, estimated by integrating Jeqy wavelet power over the Pc5 period range. All panels include 60 s cosmic noise absorption (CNA) as a function of UT, derived from IVA, SOD, OUL, and JYV riometer measurements. CNA can be used as an indicator of energetic-electron (>30 keV) precipitation. Time is given in MLT at the geomagnetic longitude of the riometer stations (here MLT ≈ UT+2.5 h).
We also use near-Earth solar-wind measurements and the geomagnetic indices AL (Davis and Sugiura, 1966) and SYM-H (Wanliss and Showalter, 2006). These data come from the 1 min OMNI near-Earth solar wind database (King and Papitashvili, 2005) that is collected at the time of this study primarily from the spacecraft located at the Lagrangian point L1 (ACE and Wind). In the OMNI database, the measurements are propagated from L1 to the nose of the terrestrial bow shock.
The events in this study are selected from the list of sheath regions published in Kilpua et al. (2019a) for the years 1997 to 2012 when nearly continuous CNA data were available from the SGO riometer chain. We used the subset of sheaths that were followed by clear ejecta (for a review of typical ejecta signatures in interplanetary space, see e.g. Zurbuchen and Richardson, 2006; Kilpua et al., 2017a, and references therein). The list is given Table S1 in Supplement.
Table 1Summary of the riometers used in this study. The station name and abbreviation, geographic latitude and longitude (GLAT and GLONG), geomagnetic latitude and longitude (MLAT and MLONG) as computed from the International Geomagnetic Reference Field (IGRF) 2008 model, L value, MLT time in relation to universal time (UT) at different stations, and frequency.
3.1 Example event
We will first investigate in more detail an event that occurred on 14–17 July 2012. The solar-wind conditions, geomagnetic indices, and riometer CNA data are shown in Fig. 3. The panels give the (a) IMF magnitude, (b) IMF components in geocentric-solar-magnetic (GSM) coordinates, (c) solar-wind speed, (d) solar-wind dynamic pressure, and (e) subsolar magnetopause position from the Shue et al. (1998) model. The next panel gives the (f) geomagnetic indices SYM-H (blue) and AL (grey). The bottom four panels (g–j) give riometer CNA data from four stations from which the data were available during the event organized from the highest geomagnetic latitude (MLAT) to the lowest MLAT (IVA, SOD, OUL, and JYV). Note that the CNA plots have different scales. The horizontal lines indicate CNA =0.5 dB. The time is given in MLT corresponding to the location of the SGO chain riometer stations, i.e. here MLT ≈ UT+2.5 h.
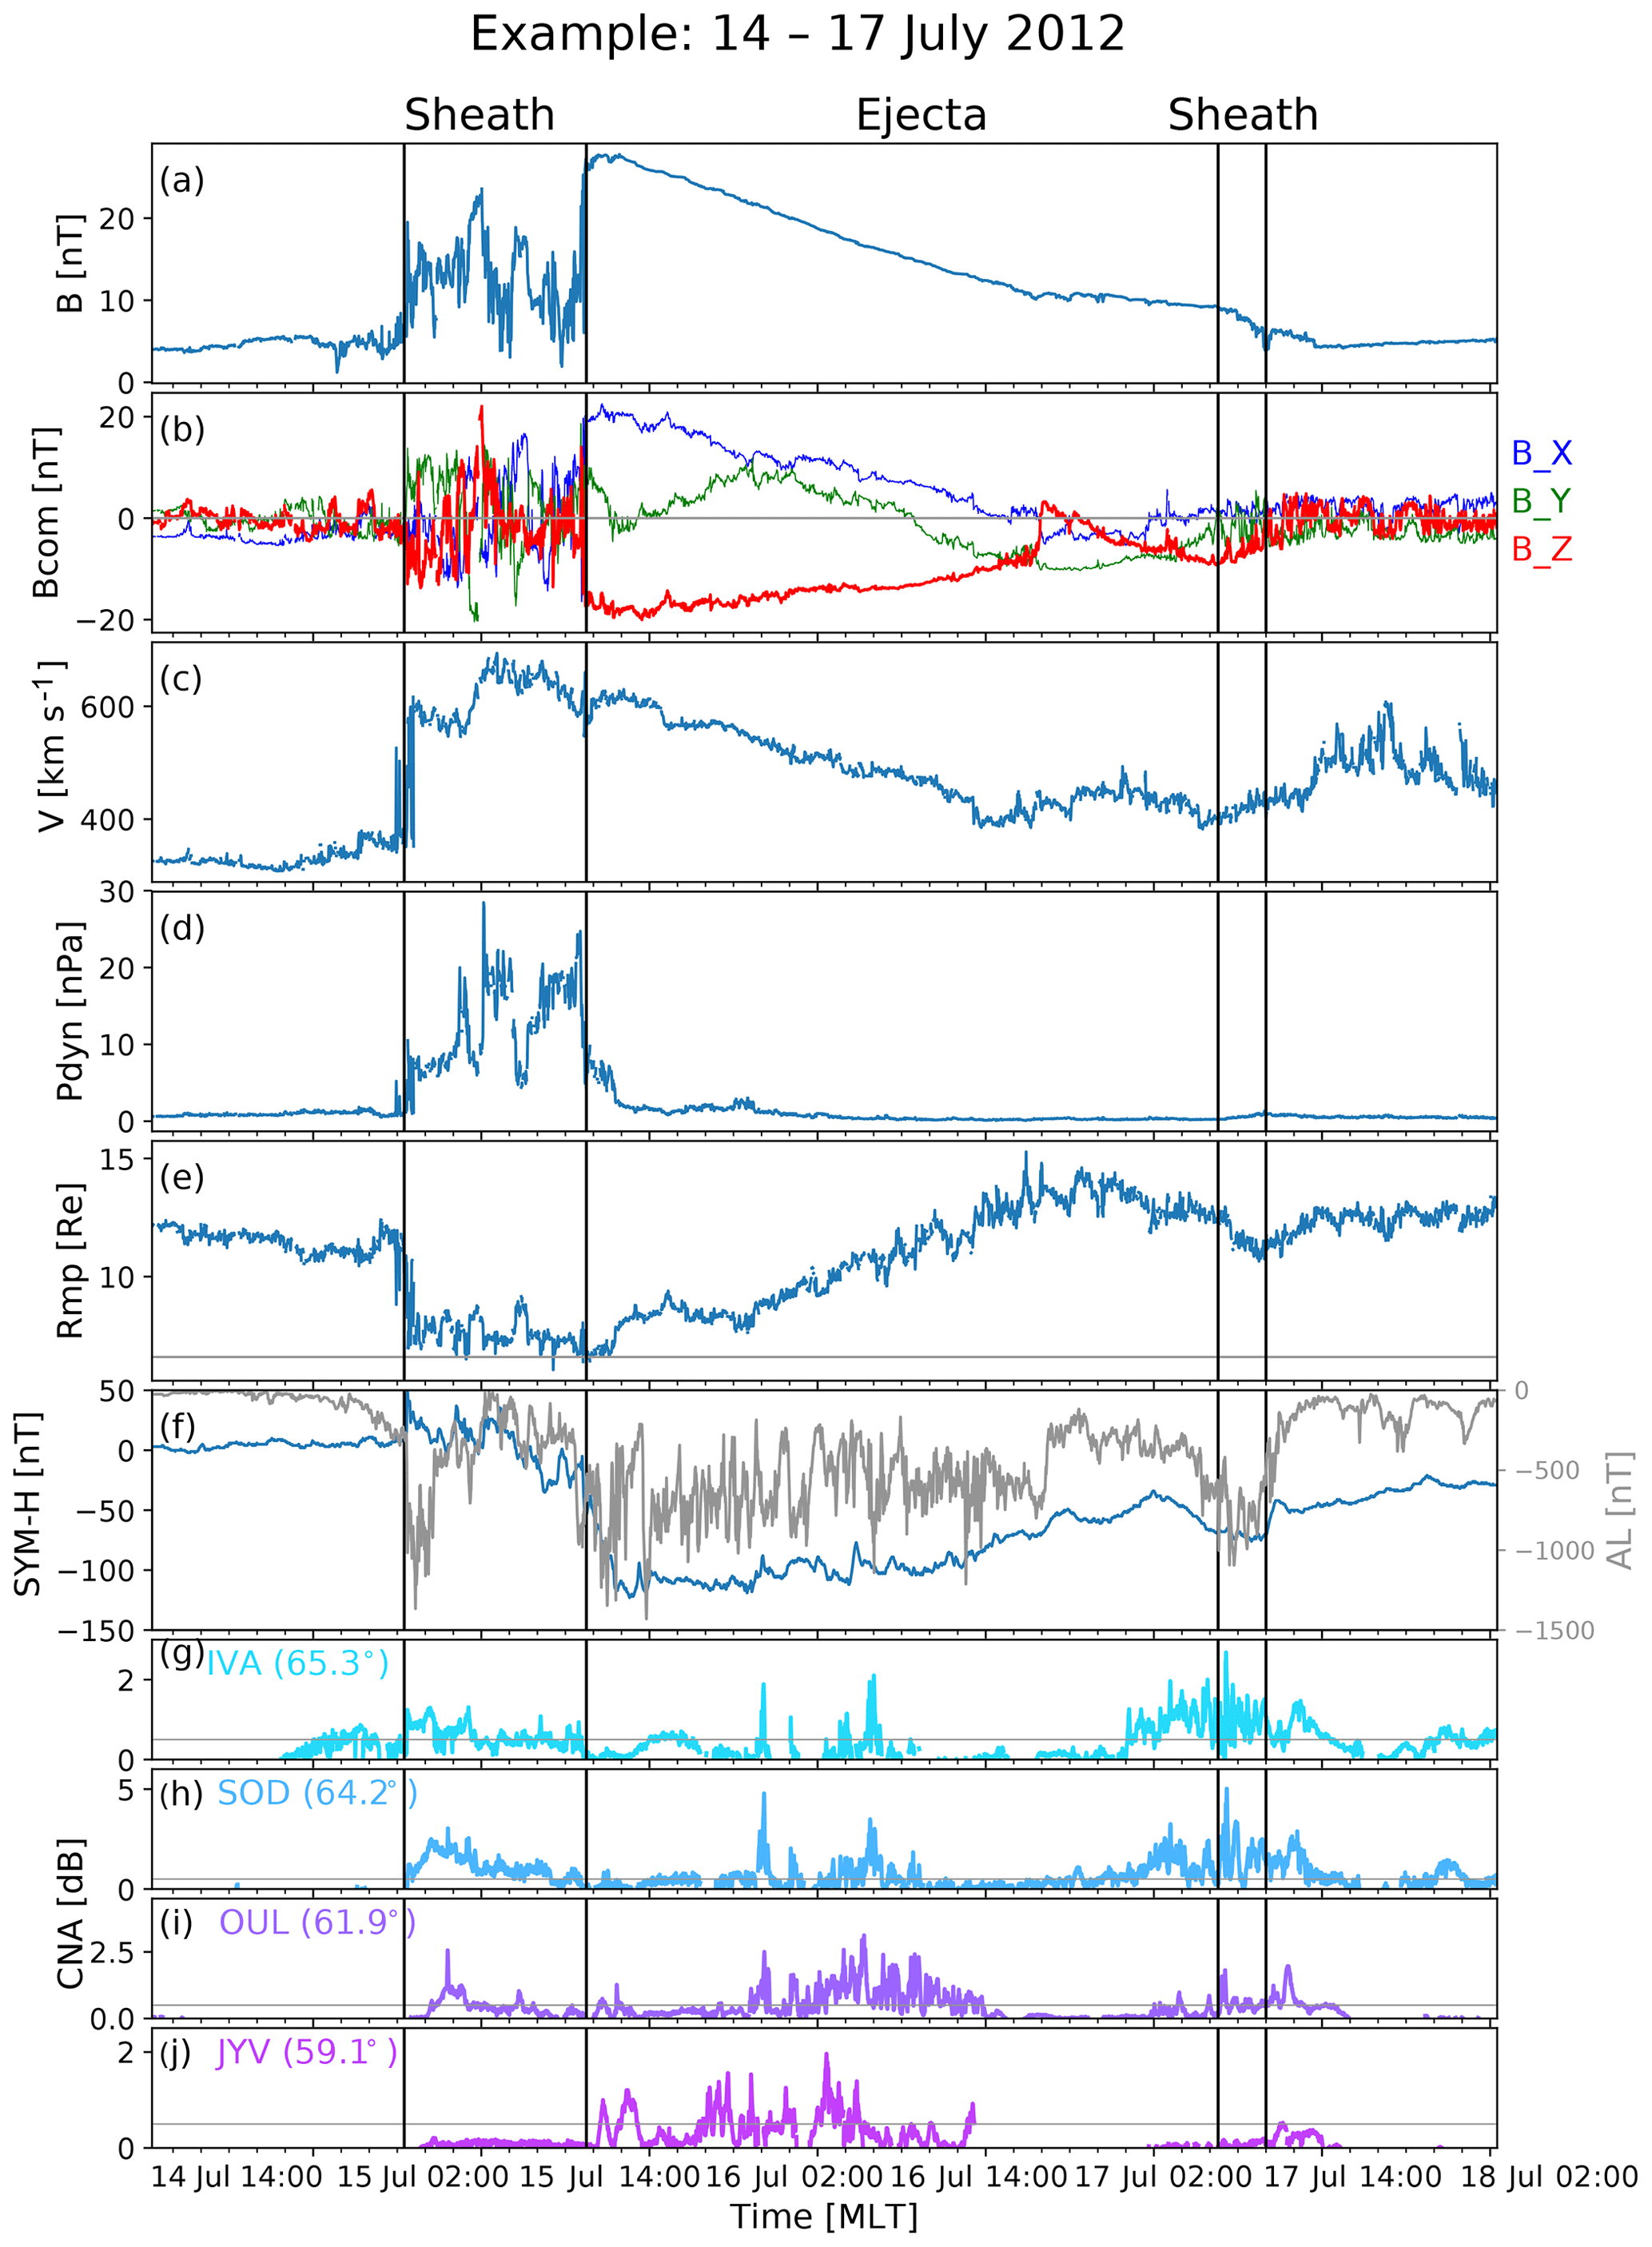
Figure 3The ICME event of 14–17 July 2012. The top seven panels give (a) the IMF magnitude, (b) IMF components in GSM coordinates (blue: BX, green: BY, and red: Bz), (c) solar-wind speed, (d) solar-wind dynamic pressure, (e) subsolar magnetopause position from Shue et al. (1998), and (f) SYM-H (blue) and AL (grey). The bottom four panels (g–j) give riometer CNA data for IVA, SOD, OUL, and JYV. Time is given in MLT at the geomagnetic longitude of the riometer stations (here MLT ≈ UT+2.5 h). The vertical lines limit the sheath, flux rope, and “back sheath” (see text for details).
Our example ICME drove a clear interplanetary shock, featured by abrupt and simultaneous jumps in the magnetic-field magnitude, solar-wind speed, and dynamic pressure. The shock is followed by a very turbulent sheath, while in the ejecta the field direction rotates in a coherent manner. This smooth field rotation is a signature of a magnetic flux rope (e.g. Klein and Burlaga, 1982; Kilpua et al., 2017b). Solar-wind speed rises to about 700 km s−1 in the sheath and then declines monotonically through the flux rope, indicating that the flux rope was expanding while moving past the Earth. The solar-wind dynamic pressure is also high (up to 30 nPa) and variable in the sheath but low in the ejecta. As a consequence, the subsolar magnetopause is strongly compressed during the sheath, reaching geostationary orbit, and its position relaxes back towards the nominal position during the flux rope.
An intense isolated substorm occurs at the beginning of the sheath (AL reaches nT) just after the shock where the magnetic field exhibits large-amplitude fluctuations with a predominantly southward orientation. At this time, however, the SYM-H index is positive, signalling the storm sudden commencement (SSC). The auroral activity subsides for the rest of the sheath due to fluctuating fields having a primarily northward orientation. At the flux rope leading edge, the magnetic field turns strongly southward and rotates then slowly back towards a more northward position. The SYM-H index decreases rapidly, and strong substorms occur. Although the southward field component weakens as the flux rope progresses, its southward orientation keeps auroral activity and SYM-H at disturbed levels. Geomagnetic activity subsides at the end of the flux rope due to a northward Bz period but enhances again for a few hours during the “back sheath”, which forms due to interactions of the ICME with the trailing solar wind. The minimum SYM-H value is −134 nT (i.e. intense geomagnetic storm), and it is reached at the front part of the ejecta.
The bottom panels of Fig. 3 show that at the auroral riometer stations IVA and SOD and at the subauroral station OUL, enhanced CNA (CNA >0.5 dB) was observed already during the front part of the sheath when the isolated substorm occurred around 20:00–24:00 MLT. Some sporadic enhanced CNA values, although lower in amplitude, were also measured during the northward Bz part of the sheath at these stations from midnight to morning hours. During this period, solar-wind dynamic pressure was high and variable. At the front part of the flux rope when the SYM-H index is most disturbed, the CNA levels hardly reach 0.5 dB from IVA to OUL, but enhanced absorption is recorded at the lowest-MLAT station, JYV (∼10:00–20:00 MLT). From about 22:00 MLT on 15 July, enhanced absorption takes place at all stations until about 06:00 MLT (extending to 14:00 MLT at OUL) on 16 July, coinciding with continuous substorm activity in the mid-part of the flux rope. During the end part of the flux rope when Bz is close to zero/positive, CNA values are mostly below 0.5 dB. The absorption intensifies again during the southward fields and related substorm activity in the back sheath from 02:00 to 14:00 MLT with magnitudes similar or even higher than observed during the earlier intervals of this event. We note that CNA momentarily reaches levels greater than 2 dB at IVA, greater than 4 dB at SOD, greater than 2.5 dB at OUL, and greater than 1.5 dB at JYV.
Next we will compare ionospheric currents and ground Pc5 pulsations and precipitation signatures. Figure 2a shows the east–west component (positive eastward) of the ionospheric equivalent current density (Jeqy) as a function of MLT at the geomagnetic longitude of the riometer stations (here MLT ≈ UT +2.5 h). CNA have also been included in the plot. Figure 2b shows the curl of the equivalent current density, with red indicating a downward and blue indicating an upward field-aligned current. Pc5 pulsation power, estimated by integrating Jeqy wavelet power over the Pc5 period range (150–600 s), is shown in Fig. 2c.
Figure 2a shows a stronger signature of either positive (red) or negative (blue) values at lower latitudes and a slightly weaker signature of opposite polarity at higher latitudes at a given time. The stronger signature can be interpreted as the eastward or westward auroral ionospheric electrojet, and the weaker signature can be interpreted as polar cap currents. The eastward electrojet typically dominates in the local afternoon and the westward electrojet around midnight and in the morning. Occasionally, especially in the pre-midnight sector, both electrojets can exist at the same time, with the eastward electrojet located equatorward of the westward electrojet. Fig. 2a illustrates the equatorward expansion and poleward contraction of the auroral electrojets during ambient southward and northward IMF conditions, respectively. Shorter timescale poleward expansions of the poleward electrojet boundary are related to substorm expansion phase activity. According to Fig. 2a and b, there are a downward region-1 current and an upward region-2 current in the poleward and equatorward parts of the westward electrojet, respectively, and an upward region-1 current and a downward region-2 current in the poleward and equatorward parts of the eastward electrojet. Apart from the beginning of the event, when the magnetosphere was being compressed by the increasing dynamic pressure, energetic-electron precipitation can be observed in the region dominated by a region-2 current, more typically an upward region-2 current (blue) than a downward region-2 current (red). The region-2 current is believed to map to the ring current (e.g. Zheng et al., 2006), indicating that the magnetospheric source of the observed energetic-electron precipitation could be in the same area.
Finally, Fig. 2c shows that the power of Pc5 pulsations is enhanced during the times when enhanced precipitation occurs, in particular in the middle of the flux rope and close to the back sheath. We also note that Pc5 power is elevated during the dominantly northward IMF in the sheath region when enhanced CNA was also observed.
3.2 Statistical results
Our statistical study includes in total 61 sheaths and ejecta. The mean duration of the sheaths in our data set is 9.5 h with a standard deviation of 4.4 h. The shortest sheath lasted for 2.5 h, and the longest one lasted for 21.7 h. The average duration of the ejecta is 21.5 h with a standard deviation of 13.3 h. The shortest ejecta lasted for 4.2 h, and the longest one lasted for 63 h. Table 2 gives the number of sheaths and ejecta from the 61 events investigated when the CNA data are available. Stations ROV and JYV have several events without the CNA data, while for the other stations there are data for nearly all events.
For each station, Table 2 lists the number of events with enhanced CNA (i.e. CNA >0.5 dB), the mean time, , in minutes during the sheaths and ejecta when enhanced CNA occurred, and the mean relative occurrence of enhanced CNA, , i.e. the mean value of the ratios of samples with CNA >0.5 dB divided by all samples within a given sheath and ejecta. The last column gives the mean CNA magnitude, , calculated considering only values >0.5 dB. Nearly all (>80 %) sheaths and ejecta included in this study resulted in enhanced CNA except at the lowest-MLAT station, JYV, where only 44 % of the sheaths and 65 % of the ejecta resulted in CNA >0.5 dB. In addition, only 67 % of the sheath-induced enhanced CNA at IVA, while this was the case for 87 % of the ejecta. The ejecta are also associated with longer periods of enhanced CNA than the sheaths. At auroral stations SOD and ROV, sheaths induce enhanced CNA on average for 2.5–3 h, while the ejecta-related enhanced CNA lasts on average 6–7 h. JYV exhibits clearly the shortest time of enhanced CNA from all investigated stations both for the sheaths and ejecta; for the sheaths the mean duration is only 40 min. Longer periods of enhanced CNA for the ejecta could be at least partly explained by their longer duration (on average twice as long compared to the sheaths in our study; see above). Sheaths and ejecta have also very different IMF Bz profiles, with ejecta having smooth field changes, thus being capable of providing sustained periods of southward IMF, while sheaths are more turbulent in nature. The mean relative occurrences are more similar between the sheaths and ejecta. This suggests that these structures cause almost equally effectively precipitation. The mean magnitude of CNA is also very similar at SOD, ROV, and OUL between the sheaths and ejecta. At IVA in turn the sheaths have larger , while at JYV the ejecta induce somewhat stronger CNA values on average.
Table 2The first two columns give the number of sheaths and ejecta for which CNA data were available and for which enhanced CNA (CNA >0.5 dB) occurred (the percentage of the events with enhanced CNA from the events for which data were available is shown in parentheses). The next columns give the mean time when enhanced CNA was observed (in minutes), the mean relative occurrence of enhanced CNA (defined as the ratio of samples n with enhanced CNA to all samples), and the mean magnitude of CNA (considering only values >0.5 dB). The total number of events analysed is 61.

3.2.1 Superposed epoch analysis
The superposed epoch analysis results of solar-wind conditions and geomagnetic indices during the studied ICME events are shown in Fig. 4. We use here the double superposed epoch analysis (e.g. Kilpua et al., 2015), where the first epoch time is at the time of the ICME-driven shock and the second epoch time corresponds to the leading edge time of the ejecta. We have also resampled the data (increased or decreased the time between the time intervals) during the sheath and ejecta structures to the same average durations of 9.5 and 21.5 h, respectively (for a similar approach see e.g. Kilpua et al., 2015; Masías-Meza et al., 2016; and Yermolaev et al., 2018). This approach is useful for investigating overall patterns in solar-wind and geomagnetic conditions and precipitation signatures for structures that exhibit a large range of durations (e.g. Kilpua et al., 2017b). The possible fluctuations, such as variations in the magnetic-field directions, can, however, partly average out. The parameters shown in the figure are (Fig. 4a) interplanetary-magnetic-field (IMF) magnitude, (Fig. 4b) IMF north–south magnetic-field component (Bz), (Fig. 4c) 1 min root mean square (RMS) of the magnetic field () as the measure of the IMF fluctuation level, (Fig. 4d) solar-wind speed, (Fig. 4e) solar-wind dynamic pressure, and (Fig. 4f) AL and (Fig. 4g) SYM-H indices. The thick curves in each panel give the median values, and the thinner curves indicate the upper and lower quartiles.
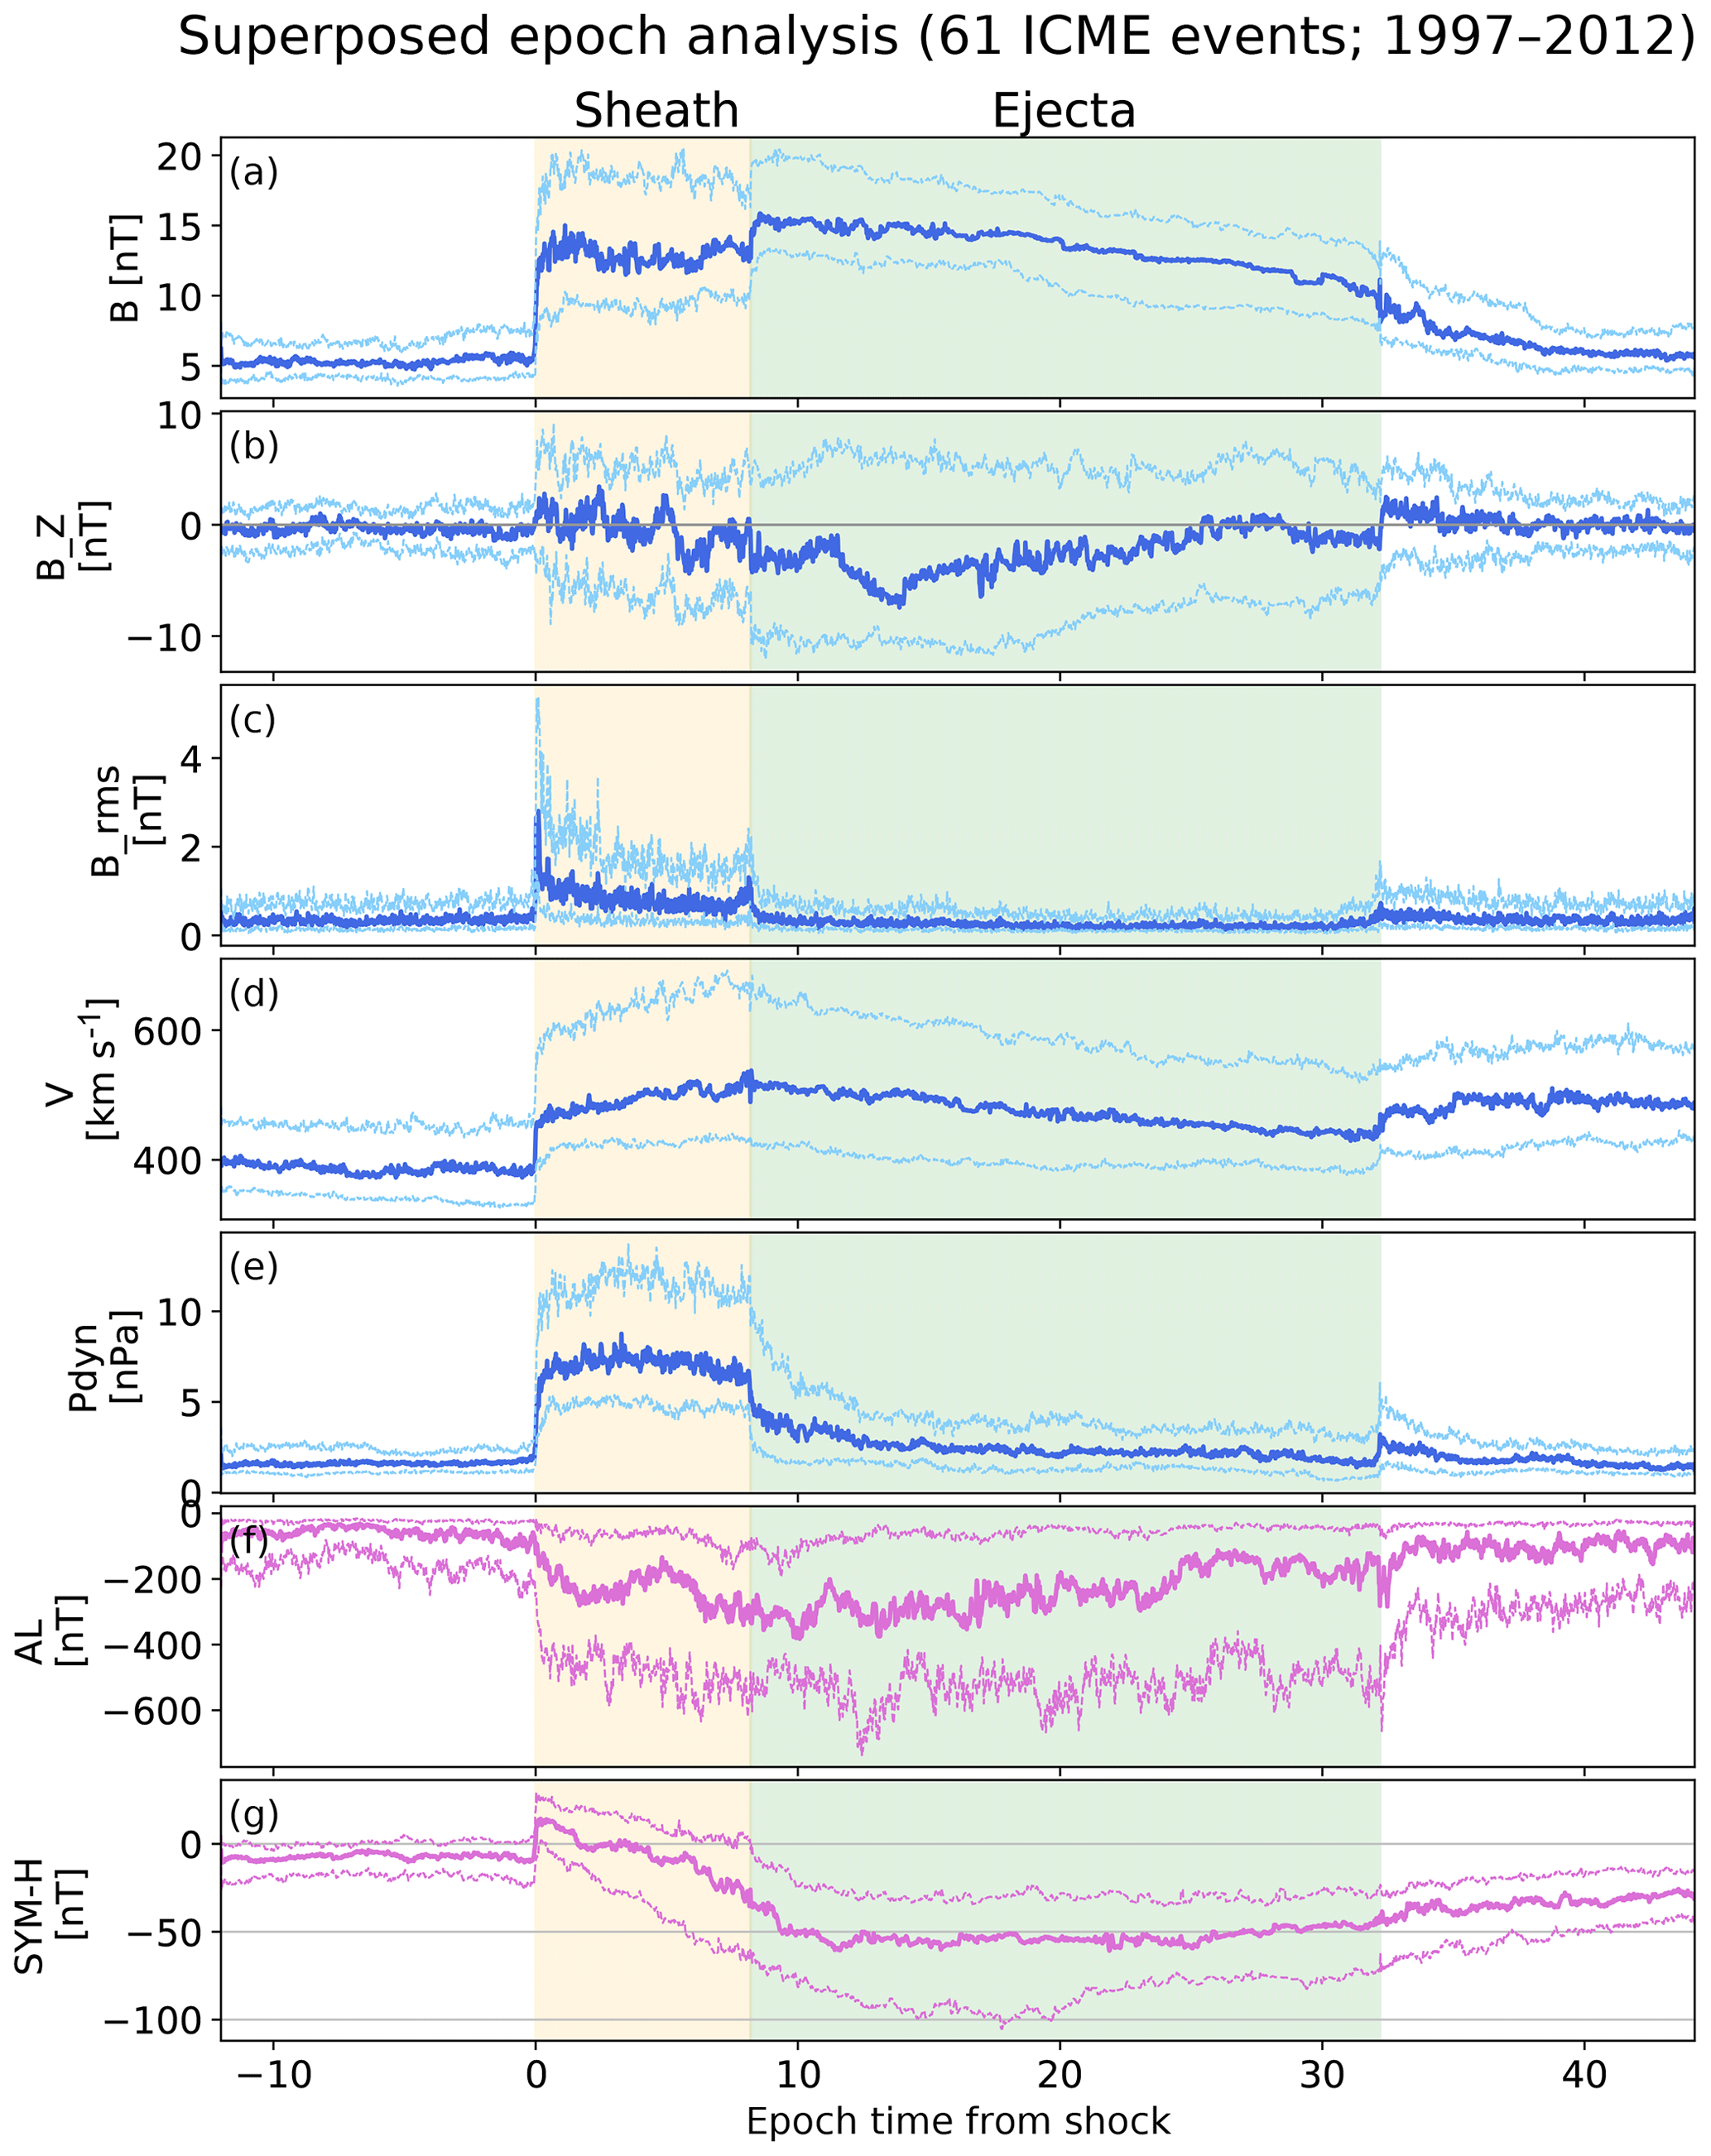
Figure 4Superposed epoch analysis of solar-wind conditions and geomagnetic indices during 61 ICME events detected in the near-Earth solar wind during 1997–2012. The thick curves show the median, and thinner curves show the lower and upper quartiles. The sheath and ejecta substructures are resampled to the same duration (see the text for details). The panels give the (a) magnetic-field magnitude, (b) north–south magnetic-field component, (c) root mean square of the magnetic field, (d) solar-wind speed, (e) solar-wind dynamic pressure, (f) AL index, and (g) SYM-H index. The data are 1 min OMNI data. Horizontal grey line in panel (a) indicates Bz=0. In panel (g) horizontal grey lines indicate SYM-H =0 nT, −50 nT (moderate-storm limit) and −100 nT (intense-storm limit).
The sheaths and ejecta in our data set have on average similar magnetic-field magnitudes and solar-wind speeds, both enhanced clearly with respect to the ambient values. They however feature some clear differences; sheaths have much higher levels of magnetic-field fluctuations and a higher solar-wind dynamic pressure. The latter is due to much higher densities in sheaths than in ejecta (data not shown; see e.g. Kilpua et al., 2017b). The sheaths and ejecta cause quite comparable AL activity, while SYM-H reaches clearly more disturbed values during the ejecta. We also note that while for the ejecta even the lower quartile SYM-H curve reaches the weak storm level (SYM-H nT), a significant fraction of the sheaths have mostly positive SYM-H values throughout. This occurs in particular in the front part of the sheaths, following the shock impact.
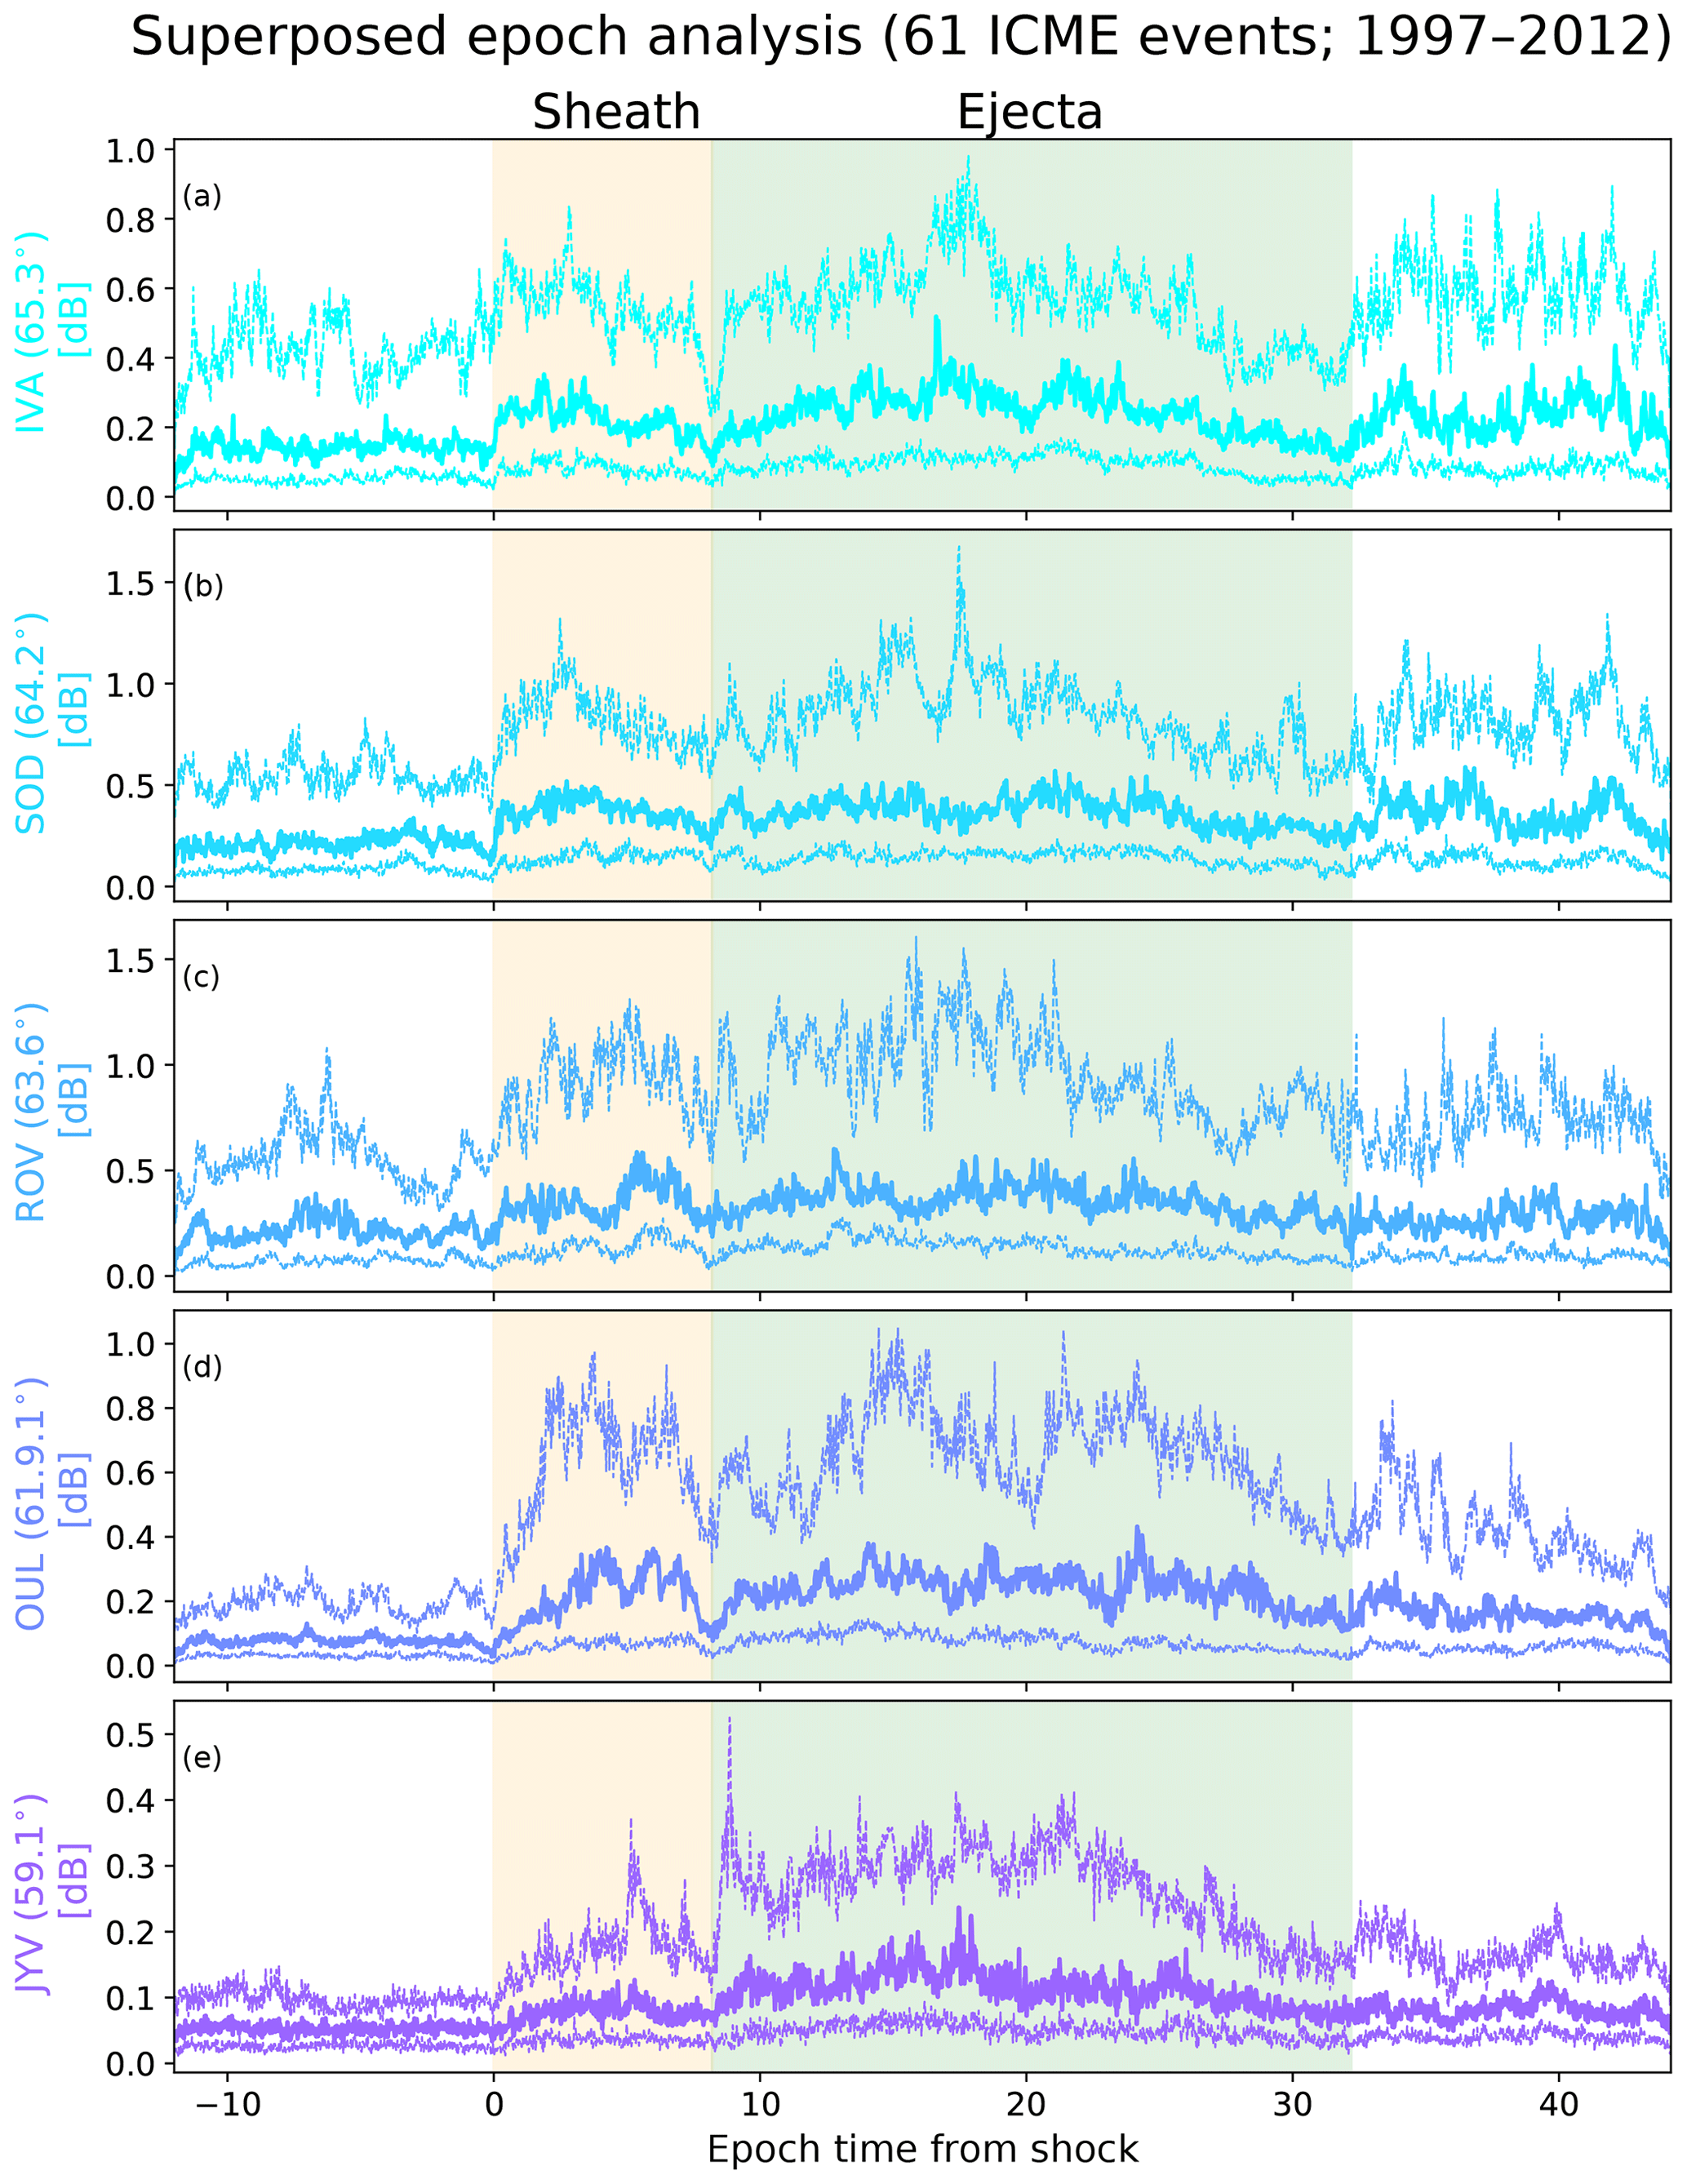
Figure 5Superposed epoch analysis of CNA for 61 ICME events occurring between 1997 and 2012. The thick curves show the median, and thinner curves show the lower and upper quartiles. The data are shown for five stations in the SGO chain (Ivalo, Sodankylä, Rovaniemi, Oulu, and Jyväskylä) that are organized according to their MLAT from highest to lowest.
Figure 5 shows the superposed epoch analysis results of 1 min CNA values measured at the five stations listed in Table 1. Again, the sheaths and ejecta are resampled to the same average duration. The lower-quartile CNA curves are approximately at the same level throughout the ICME and also only slightly enhanced when compared with the ambient solar wind. When the median and upper quartiles are considered, the effect of the ICME is more striking, in particular when considering the upper-quartile curve and the subauroral stations OUL and JYV. The CNA response in the superposed plot is also of a comparable magnitude for the sheaths and ejecta, except at JYV, where the response is strongest in the ejecta. CNA values tend to be somewhat higher in the middle of the sheaths and ejecta than at their boundaries, but no obvious temporal trends can be detected from the superposed plot. This is consistent with the fact that southward field in sheaths and ejecta (during which the strongest CNA is expected) can occur anywhere in these structures (e.g. Huttunen et al., 2005; Kilpua et al., 2019a). Flux-rope-type ejecta show a solar-cycle trend in their magnetic polarity (e.g. Bothmer and Schwenn, 1998), but since our data set covers almost two solar cycles, no clear effect from this is expected. For all of the investigated stations, the solar wind trailing the ICME has higher CNA levels than the preceding solar wind. This likely reflects the effect of the high-speed stream with Alfvénic fluctuations that often follows the ICME and that keeps also geomagnetic activity elevated (see Fig. 4f–g).
3.2.2 MLT variations
The superposed epoch analysis performed in the previous section gives only a rather-limited understanding of the CNA response that can be very sporadic and have a strong MLT dependence. In this section, we will therefore investigate differences in the CNA response during the sheaths and ejecta as a function of MLT.
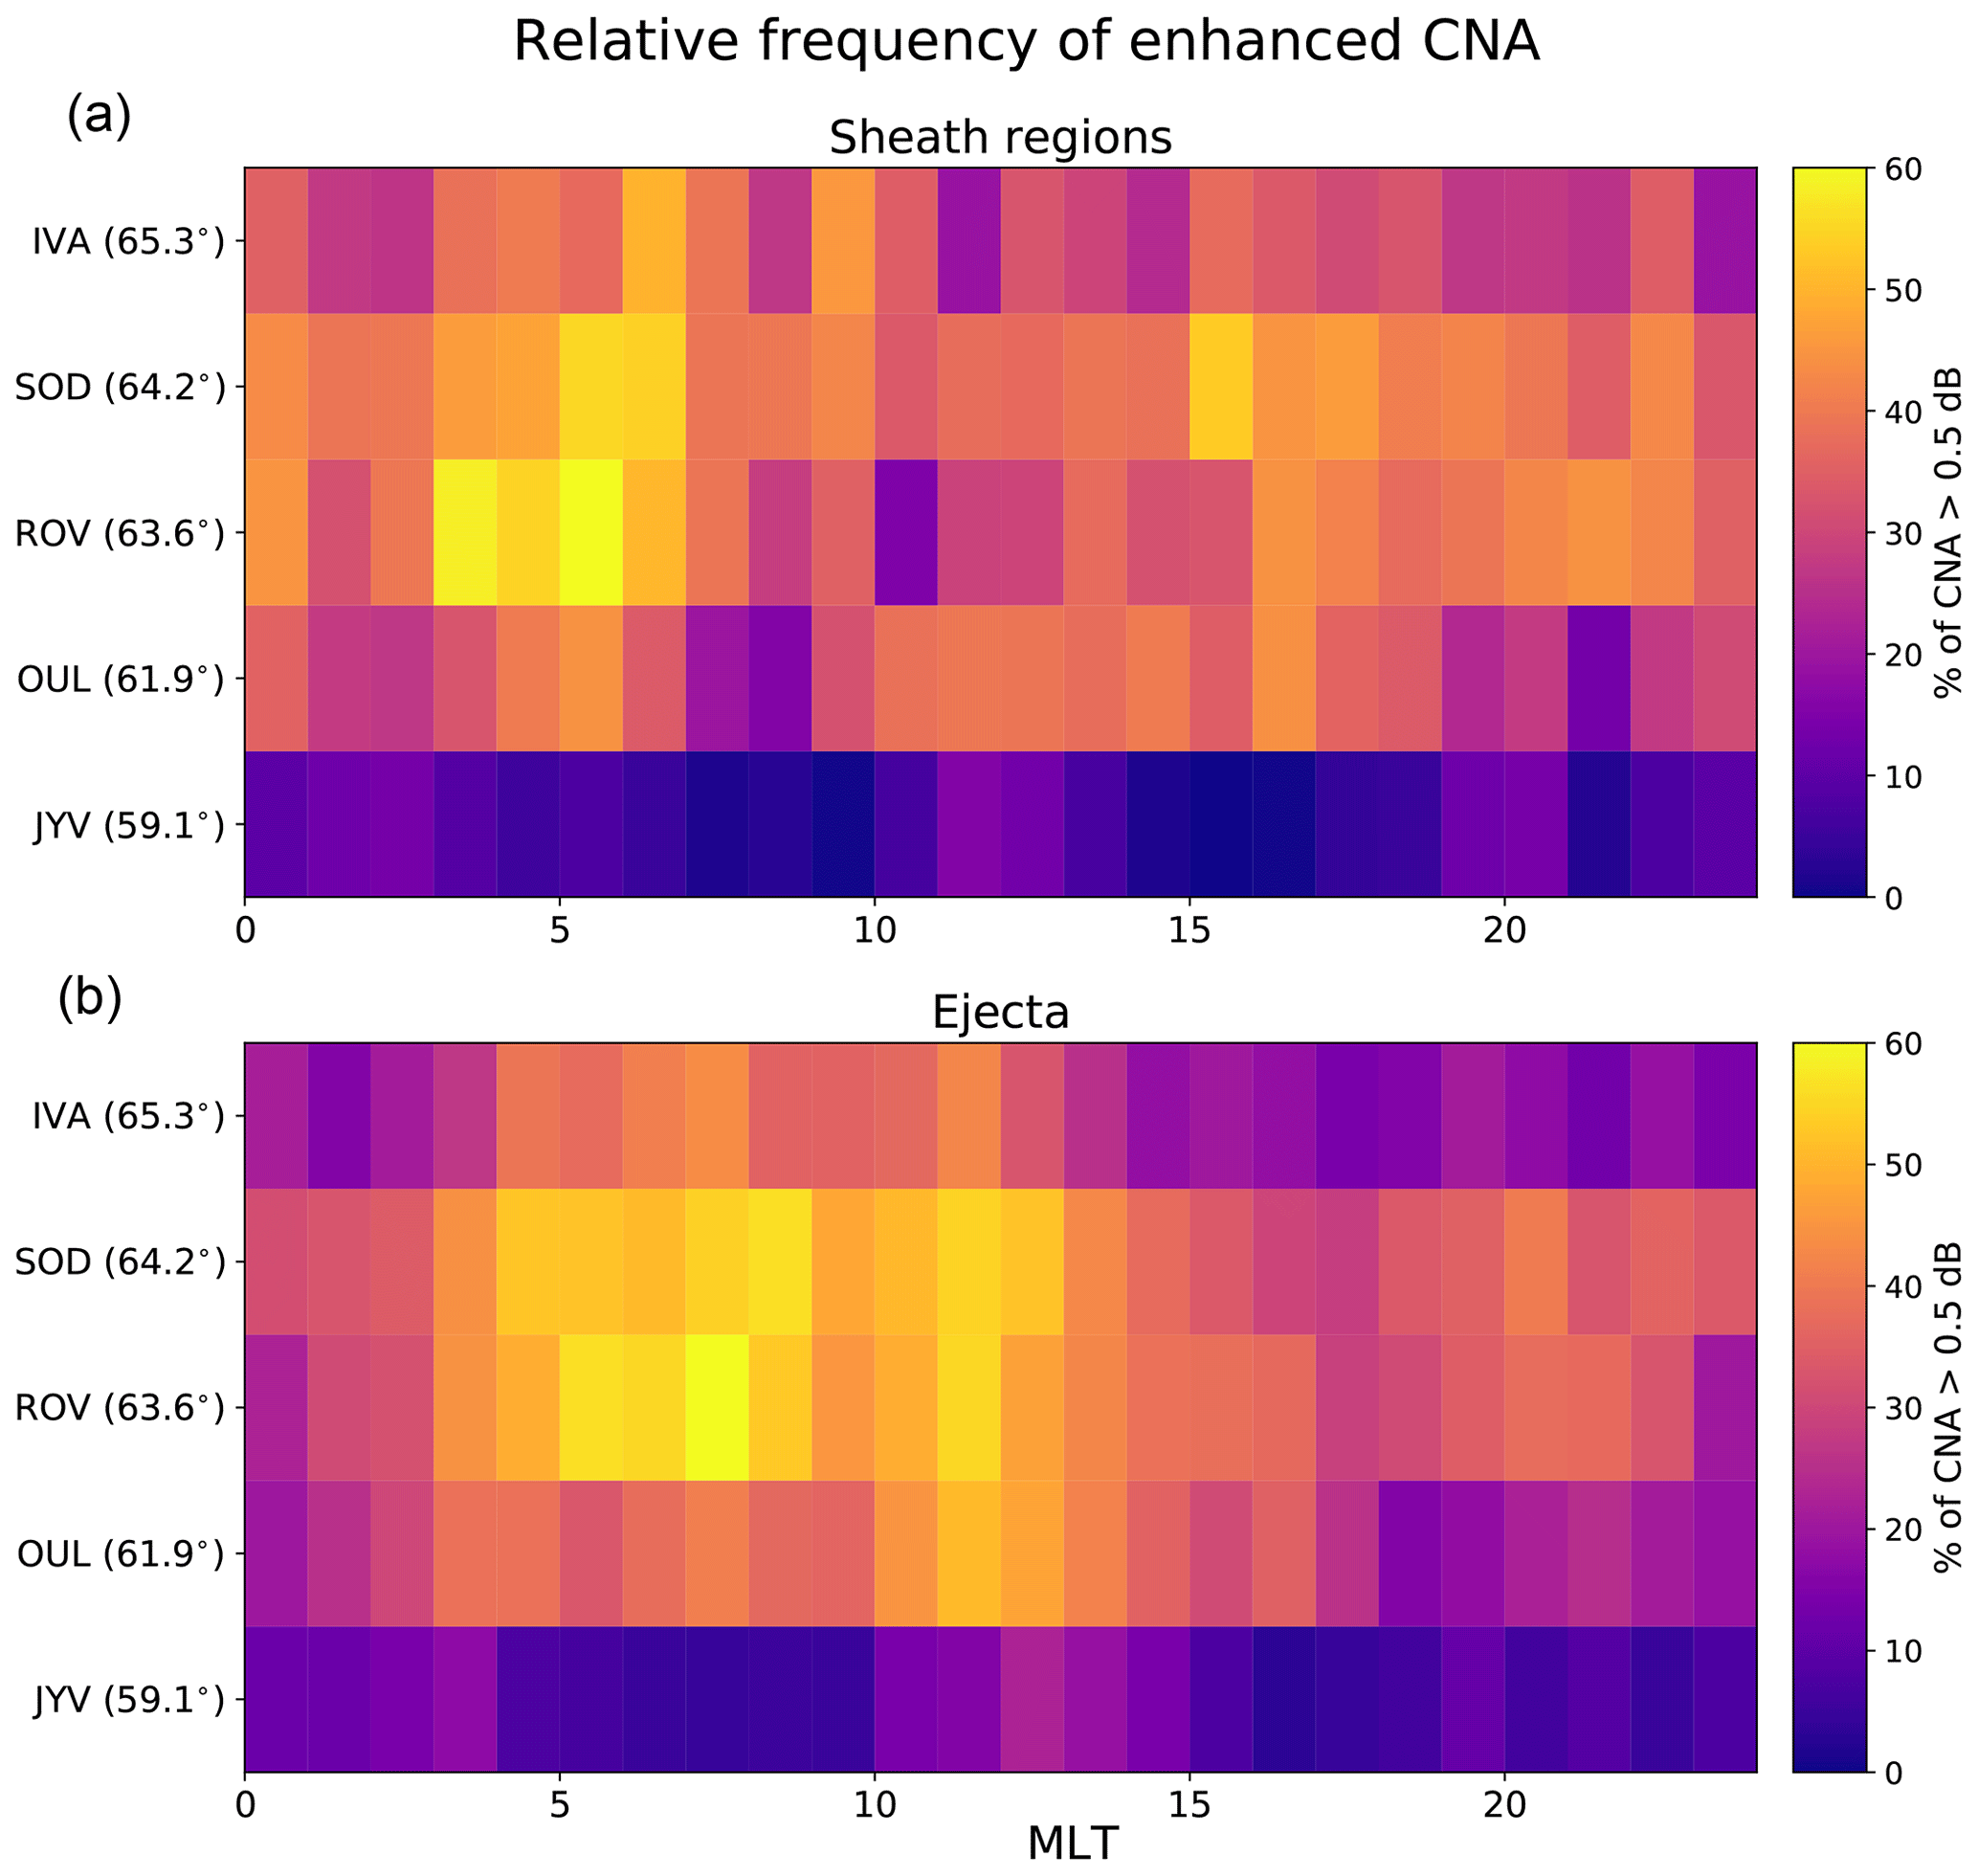
Figure 6The relative-occurrence frequency of CNA samples with >0.5 dB for (a) sheath regions and (b) ejecta as a function of MLT (in 1 h bins). Stations are organized according to their MLAT (∘ N) that is indicated in parenthesis for each station.
Figure 6 shows the relative frequency of occurrence of CNA >0.5 dB periods as a function of MLT for the five stations under investigation. Each 1 h bin shows the fraction of 1 min data points with CNA >0.5 dB considering all samples measured during the sheaths and ejecta. In Fig. 7 we also give the medians and interquartile ranges (IQRs) calculated over the relative frequency of occurrence of CNA >0.5 dB of individual events. Note that for several cases the majority of events had zero occurrences of enhanced CNA in a given MLT bin, and medians are thus zero. The horizontal lines indicate the bootstrapped standard error of the median calculated using 10 000 random subsets of the original median data.
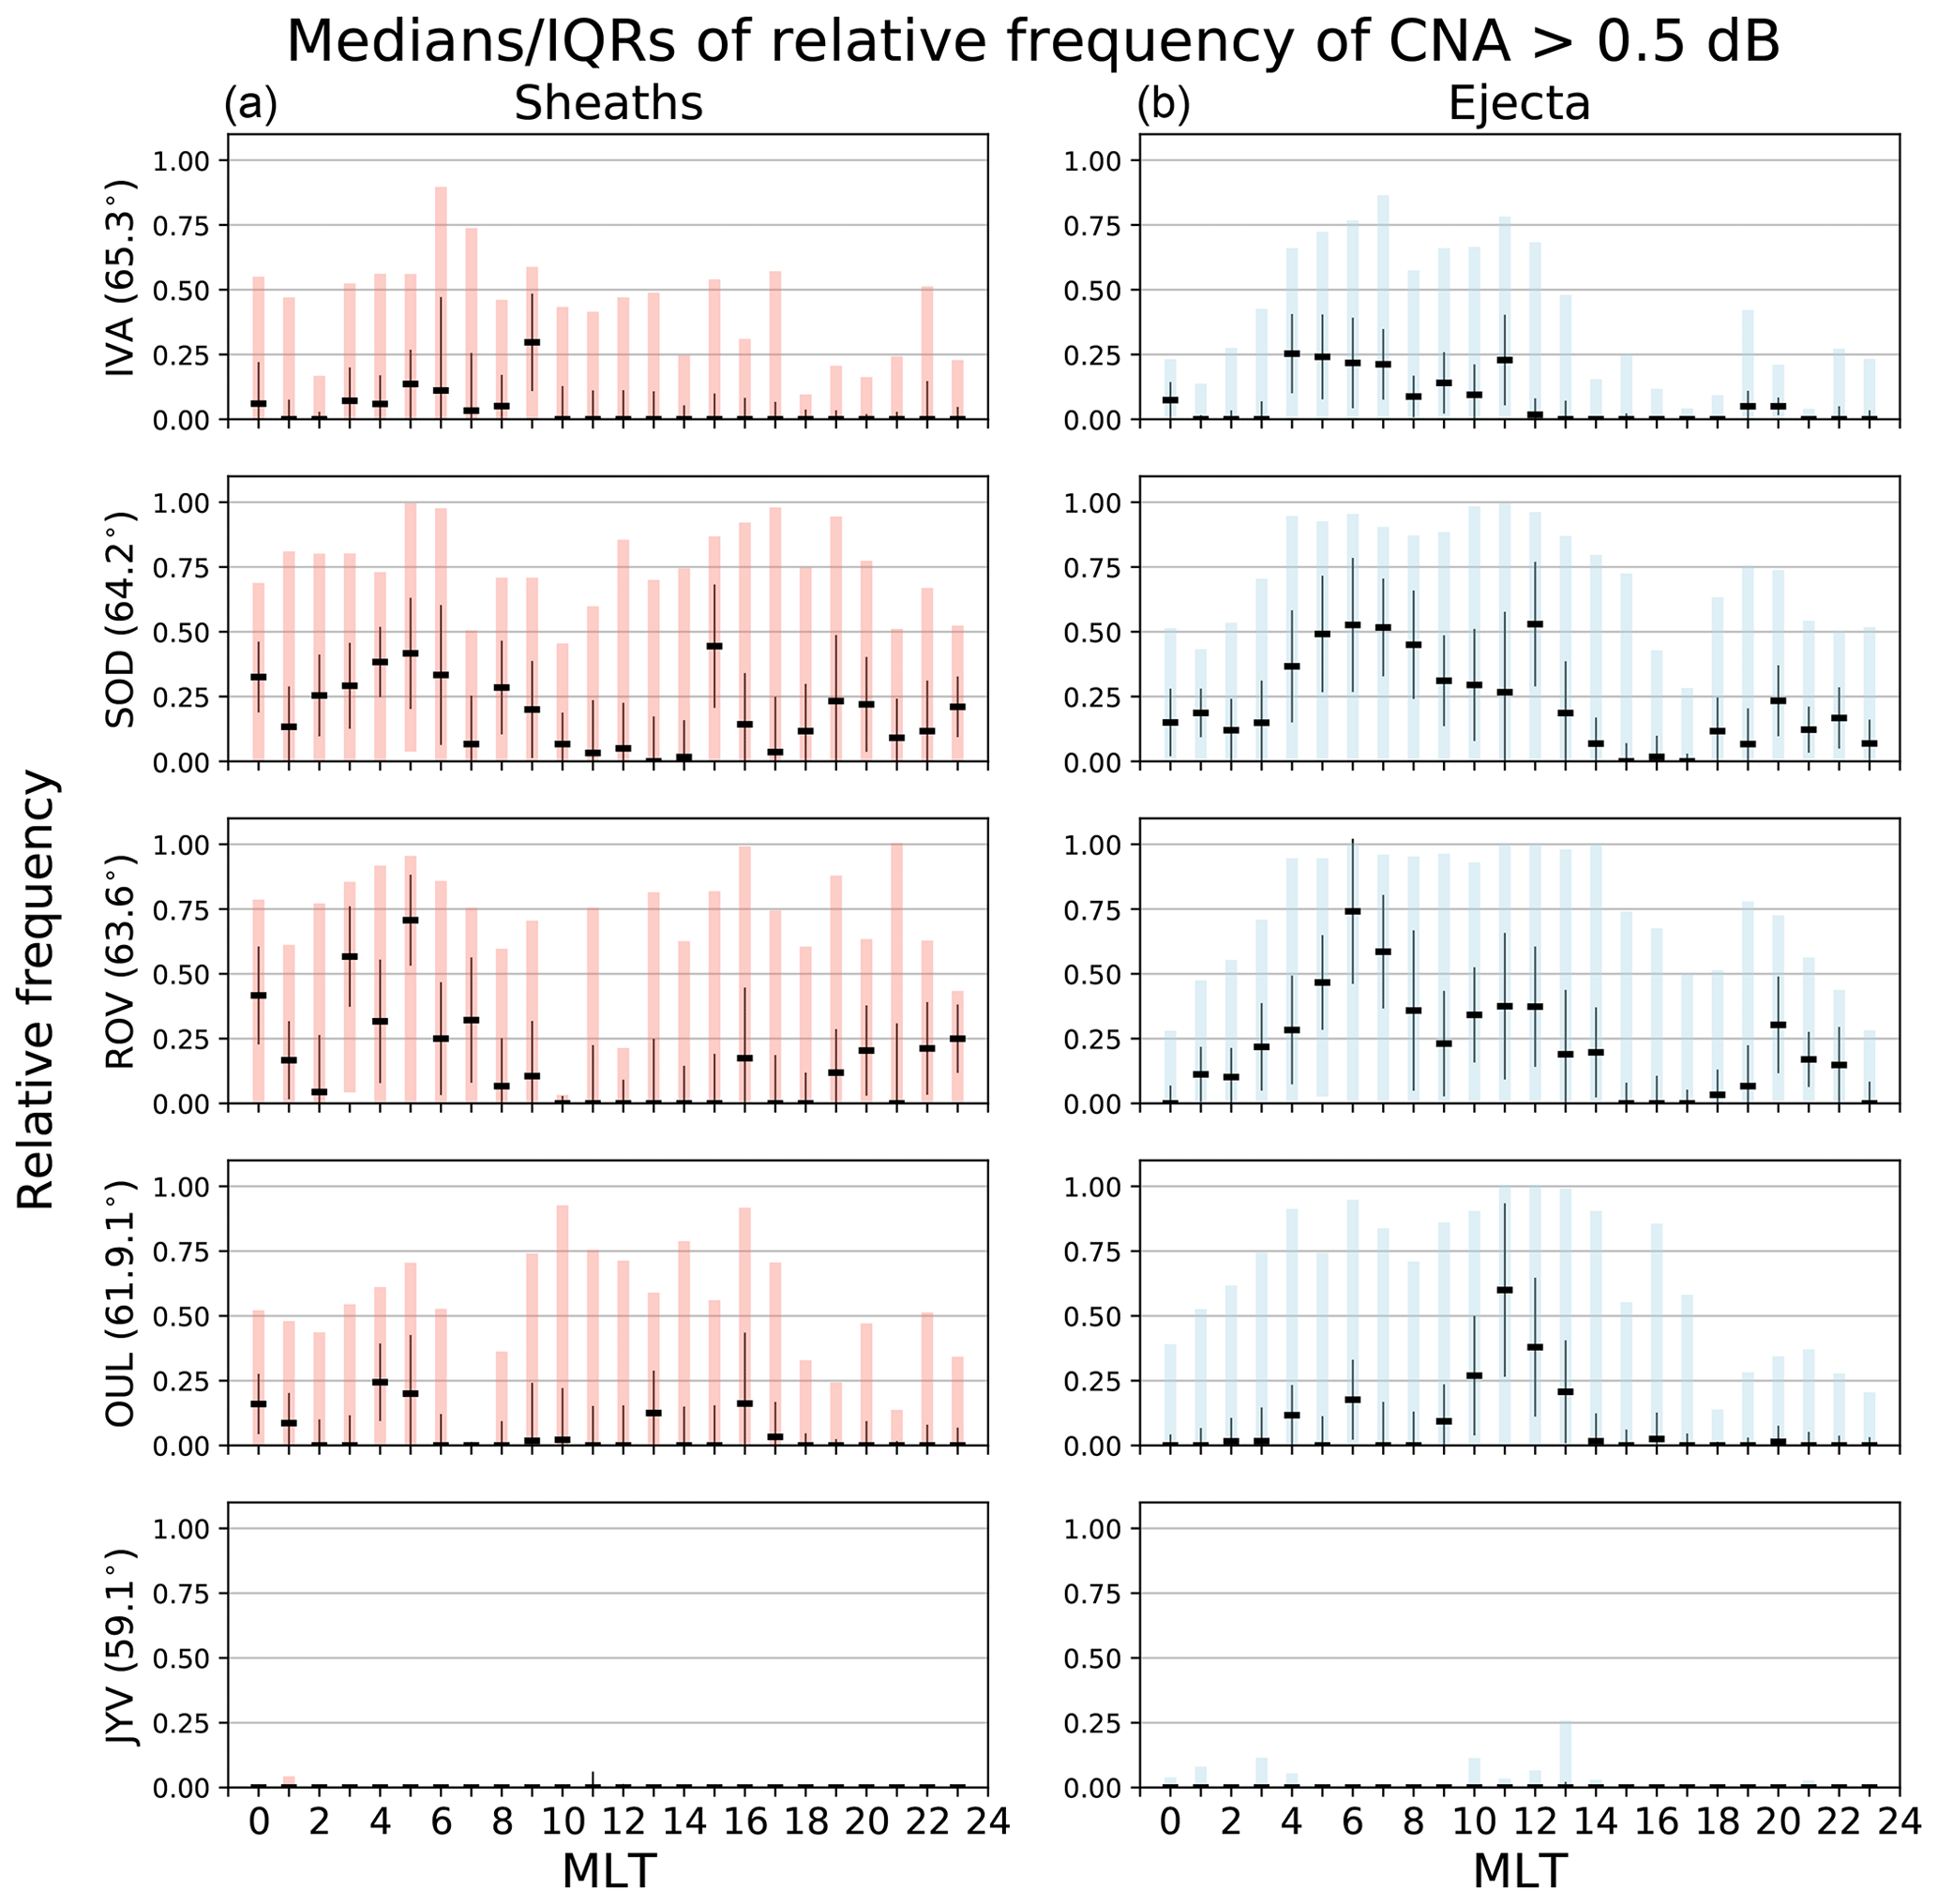
Figure 7The medians and interquartile range (IQRs) calculated over relative-occurrence frequencies of CNA >0.5 are shown by the thick black horizontal bars and coloured vertical bars (dB) for (a) sheaths and (b) ejecta. Stations are organized according to their MLAT (∘ N) that is indicated in parenthesis for each station. Vertical lines give the bootstrap errors calculated using 10 000 samples.
We will first study the occurrence of enhanced CNA at auroral stations IVA, SOD, and ROV. Figure 6 shows that for the sheaths the occurrence peaks in morning hours from 04:00 to 07:00 MLT, being ∼50 %–60 % at SOD and ROV and ∼35 %–45 % at IVA. At SOD and ROV frequency is also high (∼40 %–45 %) in afternoon and evening hours. It stays over 30 % for all MLT bins at SOD and for the majority of bins at ROV, while at IVA it drops below 30 % in a few bins. Figure 7 shows that the largest fraction of sheaths with zero or a low frequency of enhanced CNA occur at noon and at IVA also in early-morning/late-evening hours. The largest fraction of sheaths with high-occurrence frequencies occur in morning and afternoon/early evening (in MLT; at ROV and SOD), consistent with Fig. 6. In general IQRs are wide, suggesting a large spread in occurrence frequencies. For the ejecta, Fig. 6 shows that the frequency of enhanced CNA at auroral stations peaks in morning and noon hours, with SOD and ROV being ∼50 %–60 % from 03:00 to 12:00 MLT, while at IVA the highest frequencies (about 35 %–40 %) occur in the morning sector. Similar to sheaths, at SOD and ROV the majority of MLT bins have over 30 % frequency, but at IVA it is below 30 % from noon to midnight and in the early morning. Figure 7 reveals again a large variations in the median frequencies and wide IQRs. The median frequencies have a bimodal MLT distribution with a strong peak at morning hours that extends to noon and another, considerably weaker peak, in evening hours.
We will next investigate the occurrence frequency of enhanced CNA at subauroral stations OUL and JYV. Figure 6 shows that at OUL, enhanced CNA occurs still relatively frequently. The frequency drops below 30 % only for a few MLT bins in morning and evening hours for the sheaths and from 18:00 to 01:00 MLT for the ejecta. For the sheaths the highest frequencies (∼40 %–50 %) occur at 05:00 and 16:00 MLT and at noon. For the ejecta the frequency peaks from 10:00 to 12:00 MLT (∼50 %) and is relatively high also in early-morning and afternoon hours. At the lowest-MLAT station, JYV, the occurrence frequency drops below 25 % for all MLT bins for both the sheaths and ejecta. The enhanced-CNA activity is most frequent at noon and in early-morning and late-evening hours and almost vanishes in the late-morning and afternoon sectors. Figure 7 reveals for the ejecta at OUL a clear drop in the medians of occurrence frequencies in the afternoon/event sector and at midnight, while a distinct peak occurs at noon. The upper quartiles are particularly wide for most MLTs. At JYV, the majority of MLTs had zero occurrences of CNA >0.5 dB for both the sheaths and ejecta.

Figure 8The medians (thick black horizontal bars) and interquartile ranges (IQRs; coloured boxes) of the CNA magnitude as a function of MLT for (a) sheaths and (b) ejecta. Only the cases with more than five samples exceeding 0.5 dB during a 1 h MLT bin are plotted. Stations are organized according to their MLAT (∘ N) that is indicated in the parenthesis for each station. Vertical lines give the bootstrap errors calculated using 10 000 samples.
The magnitude of the CNA response is investigated in Fig. 8, which shows the medians and IQRs of the median CNA response for the sheaths and ejecta separately as a function of MLT. Only CNA values >0.5 dB are considered, and we have plotted only the cases when the number of events with enhanced CNA exceeded five. The horizontal lines indicate, similar to Fig. 7, the bootstrapped standard error of the median calculated using 10 000 random subsets of the original median data.
For the sheaths, the largest absorption from IVA to OUL takes place from noon to evening hours, while the ejecta absorption is strongest from the morning sector to noon hours. At JYV the magnitude of CNA is largest at noon for the ejecta, while for the sheaths only a small fraction of events reached CNA >0.5 dB values. Figure 8 also shows that in general there are no drastic differences in the magnitude of CNA between the sheaths and ejecta. At IVA and OUL, sheaths have some MLT bins with considerably larger upper quartiles than the ejecta. Another interesting feature is that the magnitude of CNA is generally weakest near midnight for both the sheaths and ejecta.
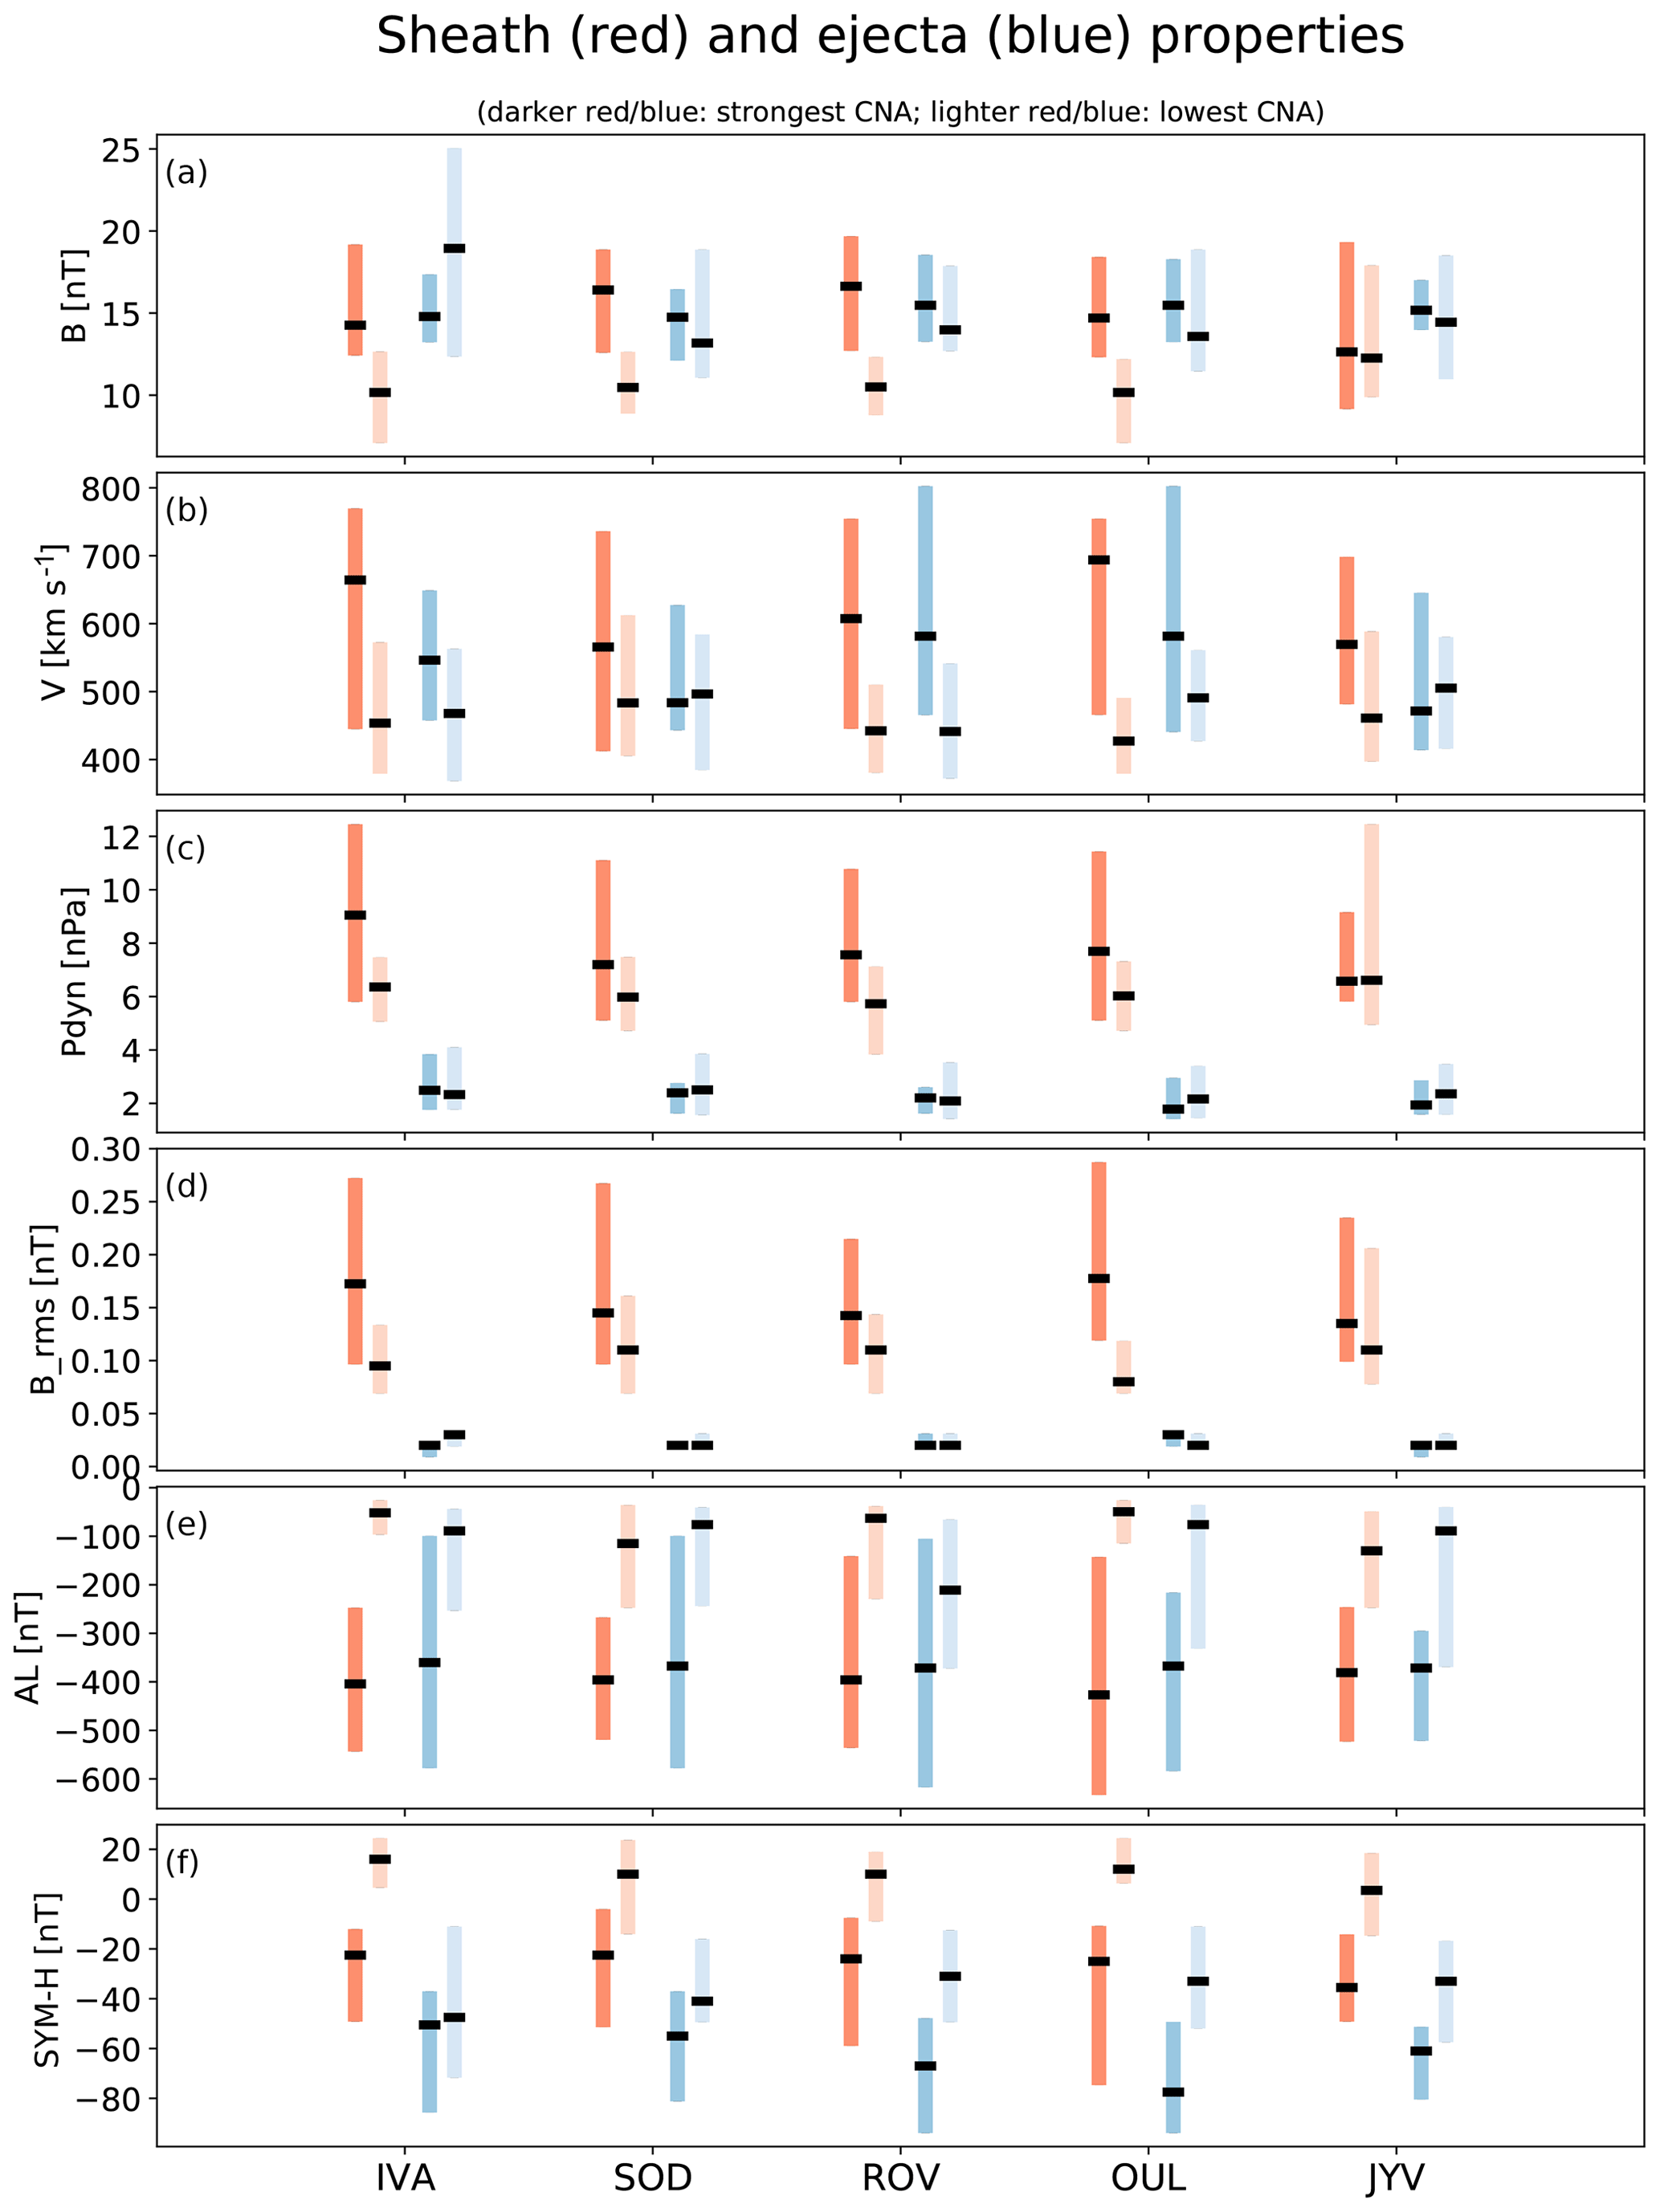
Figure 9The medians (thick black horizontal bars) and interquartile range (IQR; coloured boxes) of (left) sheath and (right) ejecta properties and associated geomagnetic responses. The darker-red and blue boxes show the IQRs for events associated with strongest CNA, and lighter-red and blue boxes show the events associated with weakest CNA. The panels give the (a) interplanetary-magnetic-field magnitude, (b) solar-wind speed, (c) dynamic pressure, (d) magnetic-field fluctuations estimated from root mean square, and (e) AL and (f) SYM-H indices.
3.2.3 Dependence on driver characteristic
Figure 9 shows the overall properties of the subsets of the sheath and ejecta that were associated with strong and weak absorption. The division to these subsets is made by first calculating median CNA for each event (considering only values >0.5 dB) and setting the median to zero for those events for which CNA values did not exceed 0.5 dB at all. Then the weak-absorption (strong-absorption) sheath subset is composed of those sheaths whose median CNA is below (above) the lower (upper) quartile for all sheaths and similarly for the ejecta. The figure gives the medians (black bars) and IQR (coloured bars) of the (a) magnetic-field magnitude, (b) solar-wind speed, (c) dynamic pressure, (d) RMS of the magnetic field, and (e) AL and (f) SYM-H indices. The magnetic-field magnitude and solar-wind speed of the ejecta are calculated using the first 6 h as they typically show a declining trend throughout the event (also visible in our example event shown in Fig. 3). For other parameters, the values are calculated for the whole sheath and ejecta intervals, respectively.
According to Fig. 9, the strongest absorption generally occurs during sheaths and ejecta that have strong magnetic fields and large speeds and that are clearly more geoeffective in terms of both the AL and SYM-H indices than those related to the weakest absorption. The strongest CNA sheaths also have higher solar-wind dynamic-pressure and IMF fluctuation levels than the sheaths related to the weakest CNA. The dynamic-pressure and IMF fluctuations are much weaker in ejecta, and thus they do not show such obvious trends.
We note that the variability in the properties of sheaths and ejecta that caused the strong CNA is however large, as indicated by generally wide IQRs. It is important to note that slower and weaker sheaths and ejecta that are only mildly geoeffective can also cause significant CNA activity; in particular, this is the case for the sheaths when their geoeffectiveness in determined in terms of SYM-H.
We have studied in this paper riometer cosmic noise absorption (CNA) during key structures in ICMEs, namely the sheath and ejecta. Our data set consists of 61 sheaths and ejecta that were identified in the near-Earth solar wind during 1997–2012. We performed a superposed epoch analysis by resampling the sheaths and ejecta to the population mean duration and investigated the CNA response as a function of magnetic local time (MLT) and geomagnetic latitude (MLAT). Five stations of the Finnish riometer chain from auroral N (IVA) to subauroral N (JYV) MLAT were considered in the study. These stations map from L=5.5 to L=3.7, covering roughly the outer parts and the heart of the outer radiation belt. The comparison of precipitation between the sheaths and ejecta was motivated by distinct differences in their typical solar-wind conditions and geomagnetic responses, summarized in the Introduction and shown also in the superposed epoch analysis results in this paper.
Our study shows that sheaths and ejecta frequently cause enhanced precipitation (defined here as CNA >0.5 dB). The interval of enhanced CNA lasts on average 2.5–3 h for the sheaths and 6.5–7 h for the ejecta, which corresponds to about 40 % of their durations (note that ejecta are considerably longer in duration than sheaths, in our data set approximately twice as long). When the relative frequency of enhanced CNA was considered, we found the sheaths and ejecta to be almost equally effective in inducing enhanced CNA. The fraction of ICMEs causing enhanced CNA was high (mostly ∼80 %–95 %) at auroral latitudes (IVA, SOD, and ROV) and at the subauroral station, OUL, but dropped clearly at the lowest-MLAT station, JYV. In particular, the fraction of sheaths causing enhanced CNA as well as the average duration and fraction of CNA >0.5 dB values were considerably lower at JYV than at the other stations. The fraction of sheaths inducing enhanced CNA at the highest-MLAT station, IVA, was also lower (67 %) than for the other auroral stations. The fact that ejecta are associated with more enhanced CNA at JYV than sheaths likely results from their stronger geoeffectiveness measured with SYM-H, which implies to an equatorward motion of the auroral oval and of the region of energetic-electron precipitation. The auroral activity was in turn at a more similar level between the sheath and ejecta, as indicated by the AL index.
The magnitude of enhanced CNA was also found to be roughly at similar levels for the sheaths and ejecta for all investigated stations. At IVA and OUL the sheaths had clearly higher upper quartiles of CNA magnitude for a few MLT bins, suggesting that some sheaths induce sporadically relatively strong precipitation. On average, the magnitude of CNA was relatively modest both during the sheaths and ejecta, with medians being mostly around 1 dB or a bit lower and upper quartiles being below 2 dB. We note that these are similar with the magnitudes for the ULF-associated high-speed-stream (HSS) events studied by Grandin et al. (2017a). For the substorm associated events, the authors found median CNA values of 1.5–2.4 dB in the morning sector. This is interesting as sheaths and ejecta are on average associated with stronger geomagnetic disturbances, both in terms of SYM-H/Dst (disturbance storm time) and auroral indices, than HSSs (e.g. Kilpua et al., 2017b, and references therein). HSSs and preceding slow–fast stream interaction regions (SIRs) cause in turn effectively sustained and moderate-level substorm activity that is associated with the continuous excitation of chorus waves in the inner magnetosphere (e.g. Miyoshi et al., 2013; Jaynes et al., 2015). Asikainen and Ruopsa (2016) also found using NOAA Polar-orbiting Environmental Satellites (POES) energetic-electron precipitation data that at >30 keV energies HSSs had a dominant contribution over ICMEs, although annual fluxes were about at the same level. Another difference between the HSS- and ICME-associated events is that for ICMEs, enhanced CNA occurred less frequently and was weaker in magnitude at IVA than at SOD and ROV (also the case for our example event shown in Fig. 3), while for the HSS events in Grandin et al. (2017a), this was the opposite. This could be related to equatorward expansion of auroral oval during more geoeffective ICMEs. For example, Holappa et al. (2014) showed that ICMEs cause relatively more activity at subauroral stations than HSSs.
We found that the sheaths and ejecta cause enhanced CNA at all MLTs. Only at the lowest-MLAT station, JYV, did the CNA activity almost vanish in the morning and evening sectors. Our study also revealed some clear MLT dependencies and differences in the CNA response between the ejecta and sheaths. Sheaths caused high-occurrence frequencies of enhanced CNA more evenly over a wider range of MLTs than the ejecta with a bias also towards afternoon and evening hours. For the ejecta in turn the highest occurrence frequencies occurred at noon and in the morning sector. The magnitude of the enhanced CNA for the sheaths was highest in the afternoon sector and for the ejecta at noon and during early-morning hours. For both sheaths and ejecta, the occurrence frequencies and CNA magnitudes were relatively small near midnight.
The reasons for these tendencies are not obvious. Some of these features are in good agreement with the previous studies. For instance, Kavanagh et al. (2004) (see also Hargreaves, 1966) reported based on observations from Imaging Riometer for Ionospheric Studies (IRIS) at Kilpisjärvi, Finland (69.05∘ N), from 1995 to 2001 that the mean CNA peaks at dawn and prenoon hours, around 07:00–11:00 MLT. Another smaller maximum was found at midnight, with a clear minimum at dusk, around 18:00 MLT. These trends persist also during SIRs/high-speed streams (Kavanagh et al., 2012; Grandin et al., 2017a) and sawtooth events (Kavanagh et al., 2007). The results by Kavanagh et al. (2012) based on epoch analysis for a large number of SIR and fast-stream events suggested that the MLT dependence of CNA was consistent with substorm-injected electrons in the nightside plasma sheet that drift to the dayside (in about 30 min) and precipitate due to wave–particle interactions with chorus waves. This scenario was also suggested by Grandin et al. (2017a) to explain ULF-type CNA events on the dayside (see also e.g. Østgaard et al., 1999). As discussed in the Introduction, chorus waves occur from the morning sector to noon, which can effectively precipitate injected electrons as well as trapped radiation belt electrons. The excitation of chorus waves is modulated by ULF waves that are generally enhanced both in the ejecta and in sheaths (Kalliokoski et al., 2019). This thus implies that the magnitude of precipitation from direct substorm injections is lower compared to the magnitude of precipitation associated with wave–particle injections later during the drift around the Earth. Another factor explaining low-occurrence frequencies and magnitudes close to midnight could be that on the nightside free electrons efficiently produce negative ions, decreasing electron density, while on the dayside they can stay longer due to the competing photo-detachment process (e.g. Rodger et al., 2012). Some sheaths can also induce relatively strong and sustained absorption near noon. The physical mechanism could be related to the impact of interplanetary shock at the beginning of the sheath and pressure pulses within the sheath leading to increased ULF Pc5 power in particular at the dayside magnetosphere (e.g. Kepko and Spence, 2003; Claudepierre et al., 2008; Wang et al., 2017) and consequently to the enhancement of whistler mode wave growth rates and precipitation (e.g. Belakhovsky et al., 2017). Another possibility is the direct sudden impulse absorption events. The impact of a shock or a pressure pulse launches a compressional low-frequency wave in the magnetosphere. If there is a significant pre-existing high energy electron population in the belts, the wave can interact with the electrons and lead to direct precipitation (e.g. Brown et al., 1961; Perona, 1972; Brown, 1978).
The strong and relatively frequent enhanced CNA for the sheaths during afternoon hours could result from scattering of trapped radiation belt electrons by EMIC waves when outside the plasmasphere and by hiss when inside the plasmasphere (e.g. Rodger et al., 2007; Clilverd et al., 2008). The latter may occur also at geomagnetically quieter times at the lowest-MLAT stations when the plasmapause expands to higher L shells. According to Kalliokoski et al. (2019) and Kilpua et al. (2019b), EMIC waves are particularly enhanced in sheaths, including in those sheaths that are only mildly geoeffective or not geoeffective at all. As mentioned in the Introduction, it is currently not clear how effectively EMIC waves can precipitate electrons from a few kiloelectronvolts to a few hundred kiloelectronvolts, which are believed to be the main source of CNA in riometer signal (e.g. Kellerman et al., 2015). In the recovery phase of a storm low-intensity chorus waves are also observed at all MLTs (Bingham et al., 2019) that could contribute to precipitation and enhanced CNA, in particularly for the ejecta that have more symmetric ring current than sheaths (e.g. Pulkkinen et al., 2007). The enhanced precipitation during evening hours can result from substorm injections. This region maps with the location of the westward electrojet (and upward R2 current).
Our example event highlighted the temporal variability in the occurrence and magnitude of CNA at each investigated station during a particularly turbulent sheath and smooth flux-rope-type ejecta. Enhanced CNA was observed throughout the event when substorms occurred and when the strongest ULF Pc5 power was detected. The latter supports the conclusion made above and in previous studies that ULF waves play a key role in controlling the growth of chorus waves and thus indirectly modulating the energetic-electron precipitation (e.g. Coroniti and Kennel, 1970). The importance of substorms was also highlighted in our statistical study. Those sheaths and ejecta that were related to the strongest CNA were associated with considerably more disturbed AL than those cases that caused the weakest CNA response. The SYM-H index in turn does not need to be strongly disturbed. Sheaths in particular can cause significant CNA activity even though SYM-H does not even reach the weak storm levels (−30 nT). For our example event, enhanced CNA occurred at auroral latitudes also during the parts of the sheaths with northward IMF when substorm activity subsided. This CNA activity is likely related to high and variable solar-wind dynamic pressure in the sheath. Our results are therefore also consistent with Longden et al. (2008), who related nightside CNA to substorms and dayside CNA to solar-wind dynamic-pressure pulses during an ICME event (see the Introduction). We further found, as expected, that the strongest precipitation occurs during fast and strong (in terms of the magnetic field) solar-wind drivers. The sheaths associated with strongest CNA also had a tendency towards large solar-wind dynamic-pressure and magnetic-field fluctuation levels.
To conclude, the sheaths and ejecta can both effectively induce moderate-level CNA activity over a wide range of MLTs. These ICME structures appear however less effective than high-speed streams in inducing strong CNA. The MLT trends in the magnitude and occurrence frequencies of enhanced CNA (>0.5 dB) between the sheaths and ejecta found here can reflect differences in the dominant occurrence of wave modes that precipitate the substorm-injected and radiation belt electrons. It will be left for a future study to investigate in more detail the MLT distributions and wave power for waves, in particular chorus waves, in the inner magnetosphere during the sheaths and ejecta.
The OMNI data were obtained through CDAWeb (https://cdaweb.sci.gsfc.nasa.gov/index.html/, NASA, 2020). The riometer data are open access upon request (https://www.sgo.fi/Data/Riometer/, Sodankylä Geophysical Observatory, 2020). Image data are available from the Finnish Meteorological Institute at https://space.fmi.fi/image/ (last access: 4 April 2020).
EK did the data analysis and compiled figures with contributions from LJ and MG. AK and TR provided the riometer data. All authors provided comments and contributed to the writing of the paper.
The authors declare that they have no conflict of interest.
The Finnish Centre of Excellence in Research of Sustainable Space is funded through the Academy of Finland (grant no. 312351. We also gratefully acknowledge the Academy of Finland. Emilia Kilpua acknowledges the Academy of Finland (project no. 1310445). This project has received funding from the European Research Council (ERC) under the European Union's Horizon 2020 research and innovation programme (grant no. ERC-COG 724391). The work by Noora Partamies is partly supported by the Norwegian Research Council (CoE contract nos. 223252 and 287427). Timo Asikainen acknowledges support by the Academy of Finland to the ReSoLVE Center of Excellence (project no. 307411) and to the PROSPECT (project no. 321440) research project. The work of Minna Palmroth is supported by the European Research Council Consolidator (grant no. 682068-PRESTISSIMO) and the Academy of Finland (grant nos. 1312351 and 1309937). The work of Antti Kero is funded by the Tenure Track Project in Radio Science at the Sodankylä Geophysical Observatory of the University of Oulu.
We thank the institutes who maintain the IMAGE magnetometer array: the Tromsø Geophysical Observatory of UiT The Arctic University of Norway (Norway), the Finnish Meteorological Institute (Finland), the Institute of Geophysics of the Polish Academy of Sciences (Poland), the GFZ German Research Centre for Geosciences (Germany), the Geological Survey of Sweden (Sweden), the Swedish Institute of Space Physics (Sweden), the Sodankylä Geophysical Observatory of the University of Oulu (Finland), and the Polar Geophysical Institute (Russia). The Sodankylä Geophysical Observatory is acknowledged for the riometer data. The authors are thankful to all of the Van Allen Probes, Wind, and OMNI teams for making their data available to the public.
This research has been supported by the European Research Council (grant nos. 724391 SolMAG and 682068-PRESTISSIMO), the Norwegian Research Council (grant nos. 223252 and 287427), the Academy of Finland, Luonnontieteiden ja Tekniikan Tutkimuksen 5 Toimikunta (grant nos. 312351, 307411, 310445, 321440, 1312351, and 1309937), and the Tenure Track Project in Radio Science at the Sodankylä Geophysical Observatory of the University of Oulu.
This paper was edited by Yoshizumi Miyoshi and reviewed by two anonymous referees.
Aminaei, A., Honary, F., Kavanagh, A. J., Spanswick, E., and Viljanen, A.: Characteristics of night-time absorption spike events, Ann. Geophys., 24, 1887–1904, https://doi.org/10.5194/angeo-24-1887-2006, 2006. a
Amm, O.: Ionospheric elementary current systems in spherical coordinates and their application, J. Geomagn. Geoelectr., 49, 947–955, 1997. a
Amm, O. and Viljanen, A.: Ionospheric disturbance magnetic field continuation from the ground to ionosphere using spherical elementary current systems, Earth Planet. Space, 51, 431–440, 1999. a
Andersson, M. E., Verronen, P. T., Rodger, C. J., Clilverd, M. A., and Seppälä, A.: Missing driver in the Sun-Earth connection from energetic electron precipitation impacts mesospheric ozone, Na. Commun., 5, 5197, https://doi.org/10.1038/ncomms6197, 2014. a
Aryan, H., Yearby, K., Balikhin, M., Agapitov, O., Krasnoselskikh, V., and Boynton, R.: Statistical study of chorus wave distributions in the inner magnetosphere using Ae and solar wind parameters, J. Geophys. Res.-Space, 119, 6131–6144, https://doi.org/10.1002/2014JA019939, 2014. a
Asikainen, T. and Ruopsa, M.: Solar wind drivers of energetic electron precipitation, J. Geophys. Res.-Space, 121, 2209–2225, https://doi.org/10.1002/2015JA022215, 2016. a, b
Beharrell, M. J., Honary, F., Rodger, C. J., and Clilverd, M. A.: Substorm-induced energetic electron precipitation: Morphology and prediction, J. Geophys. Res.-Space, 120, 2993–3008, https://doi.org/10.1002/2014JA020632, 2015. a
Belakhovsky, V. B., Pilipenko, V. A., Sakharov, Y. A., Lorentzen, D. L., and Samsonov, S. N.: Geomagnetic and ionospheric response to the interplanetary shock on January 24, 2012, Earth Planet. Space, 69, 105, https://doi.org/10.1186/s40623-017-0696-1, 2017. a
Benacquista, R., Boscher, D., Rochel, S., and Maget, V.: Variations of the Electron Fluxes in the Terrestrial Radiation Belts Due To the Impact of Corotating Interaction Regions and Interplanetary Coronal Mass Ejections, J. Geophys. Res.-Space, 123, 1191–1199, https://doi.org/10.1002/2017JA024796, 2018. a
Bingham, S. T., Mouikis, C. G., Kistler, L. M., Paulson, K. W., Farrugia, C. J., Huang, C. L., Spence, H. E., Reeves, G. D., and Kletzing, C.: The Storm Time Development of Source Electrons and Chorus Wave Activity During CME- and CIR-Driven Storms, J. Geophys. Res.-Space, 124, 6438–6452, https://doi.org/10.1029/2019JA026689, 2019. a
Blum, L. W., Artemyev, A., Agapitov, O., Mourenas, D., Boardsen, S., and Schiller, Q.: EMIC Wave-Driven Bounce Resonance Scattering of Energetic Electrons in the Inner Magnetosphere, J. Geophys. Res.-Space, 124, 2484–2496, https://doi.org/10.1029/2018JA026427, 2019. a
Borovsky, J. E. and Denton, M. H.: Differences between CME-driven storms and CIR-driven storms, J. Geophys. Res.-Space, 111, A07S08, https://doi.org/10.1029/2005JA011447, 2006. a, b
Bortnik, J. and Thorne, R. M.: The dual role of ELF/VLF chorus waves in the acceleration and precipitation of radiation belt electrons, J. Atmos. Sol.-Terr. Phys., 69, 378–386, https://doi.org/10.1016/j.jastp.2006.05.030, 2007. a
Bortnik, J., Thorne, R. M., and Meredith, N. P.: The unexpected origin of plasmaspheric hiss from discrete chorus emissions, Nature, 452, 62–66, https://doi.org/10.1038/nature06741, 2008. a
Bothmer, V. and Schwenn, R.: The structure and origin of magnetic clouds in the solar wind, Ann. Geophys., 16, 1–24, https://doi.org/10.1007/s00585-997-0001-x, 1998. a
Brown, R. R.: On the poleward expansion of ionospheric absorption regions triggered by sudden commercements of geomagnetic storms, J. Geophys. Res., 83, 1169–1171, https://doi.org/10.1029/JA083iA03p01169, 1978. a
Brown, R. R., Hartz, T. R., Landmark, B., Leinbach, H., and Ortner, J.: Large-Scale Electron Bombardment of the Atmosphere at the Sudden Commencement of a Geomagnetic Storm, J. Geophys. Res., 66, 1035–1041, https://doi.org/10.1029/JZ066i004p01035, 1961. a
Claudepierre, S. G., Elkington, S. R., and Wiltberger, M.: Solar wind driving of magnetospheric ULF waves: Pulsations driven by velocity shear at the magnetopause, J. Geophys. Res.-Space, 113, A05218, https://doi.org/10.1029/2007JA012890, 2008. a
Clilverd, M. A., Rodger, C. J., Brundell, J., BäHr, J., Cobbett, N., Moffat-Griffin, T., Kavanagh, A. J., SeppäLä, A., Thomson, N. R., Friedel, R. H. W., and Menk, F. W.: Energetic electron precipitation during substorm injection events: High-latitude fluxes and an unexpected midlatitude signature, J. Geophys. Res.-Space, 113, A10311, https://doi.org/10.1029/2008JA013220, 2008. a
Coroniti, F. V. and Kennel, C. F.: Electron precipitation pulsations, J. Geophys. Res., 75, 1279–1289, https://doi.org/10.1029/JA075i007p01279, 1970. a, b
Davis, T. N. and Sugiura, M.: Auroral electrojet activity index AE and its universal time variations, J. Geophys. Res., 71, 785–801, https://doi.org/10.1029/JZ071i003p00785, 1966. a
Douma, E., Rodger, C. J., Blum, L. W., O'Brien, T. P., Clilverd, M. A., and Blake, J. B.: Characteristics of Relativistic Microburst Intensity From SAMPEX Observations, J. Geophys. Res.-Space, 124, 5627–5640, https://doi.org/10.1029/2019JA026757, 2019. a
Grandin, M.: Multi-instrument and modelling studies of the ionospheres at Earth and Mars, Ph.D. thesis, University of Oulu, available at: http://urn.fi/urn:isbn:9789526216157 (last access: 4 April 2020), 2017. a
Grandin, M., Aikio, A. T., Kozlovsky, A., Ulich, T., and Raita, T.: Cosmic radio noise absorption in the high-latitude ionosphere during solar wind high-speed streams, J. Geophys. Res.-Space, 122, 5203–5223, 2017a. a, b, c, d, e, f, g
Grandin, M., Kero, A., Partamies, N., McKay, D., Whiter, D., Kozlovsky, A., and Miyoshi, Y.: Observation of pulsating aurora signatures in cosmic noise absorption data, Geophys. Res. Lett., 44, 5292–5300, https://doi.org/10.1002/2017GL073901, 2017b. a, b
Grandin, M., Aikio, A. T., and Kozlovsky, A.: Properties and Geoeffectiveness of Solar Wind High-Speed Streams and Stream Interaction Regions During Solar Cycles 23 and 24, J. Geophys. Res.-Space, 124, 3871–3892, https://doi.org/10.1029/2018JA026396, 2019. a
Hargreaves, J. K.: On the variation of auroral radio absorption with geomagnetic activity, Planet. Space Sci., 14, 991–1006, https://doi.org/10.1016/0032-0633(66)90136-X, 1966. a
Hargreaves, J. K.: Auroral absorption of HF radio waves in the ionosphere: A review of results from the first decade of riometry, IEEE Proceed., 57, 1348–1373, 1969. a
Hargreaves, J. K., Chivers, H. J. A., and Axford, W. I.: The development of the substorm in auroral radio absorption, Planet. Space Sci., 23, 905–911, https://doi.org/10.1016/0032-0633(75)90177-4, 1975. a
Hargreaves, J. K., Ranta, A., Annan, J. D., and Hargreaves, J. C.: Temporal fine structure of nighttime spike events in auroral radio absorption, studied by a wavelet method, J. Geophys. Res., 106, 24621–24636, https://doi.org/10.1029/2001JA900008, 2001. a
Hartley, D. P., Kletzing, C. A., Santolík, O., Chen, L., and Horne, R. B.: Statistical Properties of Plasmaspheric Hiss From Van Allen Probes Observations, J. Geophys. Res.-Space, 123, 2605–2619, https://doi.org/10.1002/2017JA024593, 2018. a
Hendry, A. T., Santolik, O., Kletzing, C. A., Rodger, C. J., Shiokawa, K., and Baishev, D.: Multi-instrument Observation of Nonlinear EMIC-Driven Electron Precipitation at sub-MeV Energies, Geophys. Res. Lett., 46, 7248–7257, https://doi.org/10.1029/2019GL082401, 2019. a
Holappa, L., Mursula, K., Asikainen, T., and Richardson, I. G.: Annual fractions of high-speed streams from principal component analysis of local geomagnetic activity, J. Geophys. Res.-Space, 119, 4544–4555, https://doi.org/10.1002/2014JA019958, 2014. a
Huttunen, K. E. J., Koskinen, H. E. J., and Schwenn, R.: Variability of magnetospheric storms driven by different solar wind perturbations, J. Geophys. Res.-Space, 107, 1121, https://doi.org/10.1029/2001JA900171, 2002. a, b
Huttunen, K. E. J., Schwenn, R., Bothmer, V., and Koskinen, H. E. J.: Properties and geoeffectiveness of magnetic clouds in the rising, maximum and early declining phases of solar cycle 23, Ann. Geophys., 23, 625–641, https://doi.org/10.5194/angeo-23-625-2005, 2005. a
Jaynes, A. N., Baker, D. N., Singer, H. J., Rodriguez, J. V., Loto'aniu, T. M., Ali, A. F., Elkington, S. R., Li, X., Kanekal, S. G., Fennell, J. F., Li, W., Thorne, R. M., Kletzing, C. A., Spence, H. E., and Reeves, G. D.: Source and seed populations for relativistic electrons: Their roles in radiation belt changes, J. Geophys. Res.-Space, 120, 7240–7254, https://doi.org/10.1002/2015JA021234, 2015. a
Juusola, L., Kauristie, K., Vanhamäki, H., and Aikio, A.: Comparison of auroral ionospheric and field-aligned currents derived from Swarm and ground magnetic field measurements, J. Geophys. Res.-Space, 121, 9256–9283, https://doi.org/10.1002/2016JA022961, 2016. a
Kalliokoski, M. M. H., Kilpua, E. K. J., Osmane, A., Turner, D. L., Jaynes, A. N., Turc, L., George, H., and Palmroth, M.: Outer radiation belt and inner magnetospheric response to sheath regions of coronal mass ejections: A statistical analysis, Ann. Geophys. Discuss., https://doi.org/10.5194/angeo-2019-150, in review, 2019. a, b, c
Kavanagh, A., Kosch, M., Honary, F., Senior, A., Marple, S., Woodfield, E., and McCrea, I.: The statistical dependence of auroral absorption on geomagnetic and solar wind parameters, Ann. Geophys., 22, 877–887, https://doi.org/10.5194/angeo-22-877-2004, 2004. a
Kavanagh, A. J., Lu, G., Donovan, E. F., Reeves, G. D., Honary, F., Manninen, J., and Immel, T. J.: Energetic electron precipitation during sawtooth injections, Ann. Geophys., 25, 1199–1214, https://doi.org/10.5194/angeo-25-1199-2007, 2007. a, b
Kavanagh, A. J., Honary, F., Donovan, E. F., Ulich, T., and Denton, M. H.: Key features of >30 keV electron precipitation during high speed solar wind streams: A superposed epoch analysis, J. Geophys. Res.-Space, 117, A00L09, https://doi.org/10.1029/2011JA017320, 2012. a, b, c
Kavanagh, A. J., Cobbett, N., and Kirsch, P.: Radiation Belt Slot Region Filling Events: Sustained Energetic Precipitation Into the Mesosphere, J. Geophys. Res.-Space, 123, 7999–8020, https://doi.org/10.1029/2018JA025890, 2018. a
Kellerman, A. C., Shprits, Y. Y., Makarevich, R. A., Spanswick, E., Donovan, E., and Reeves, G.: Characterization of the energy-dependent response of riometer absorption, J. Geophys. Res.-Space, 120, 615–631, https://doi.org/10.1002/2014JA020027, 2015. a
Kepko, L. and Spence, H. E.: Observations of discrete, global magnetospheric oscillations directly driven by solar wind density variations, J. Geophys. Res.-Space, 108, 1257, https://doi.org/10.1029/2002JA009676, 2003. a
Kilpua, E., Koskinen, H. E. J., and Pulkkinen, T. I.: Coronal mass ejections and their sheath regions in interplanetary space, Living Rev. Sol. Phys., 14, https://doi.org/10.1007/s41116-017-0009-6, 2017a. a, b, c
Kilpua, E. K. J., Hietala, H., Koskinen, H. E. J., Fontaine, D., and Turc, L.: Magnetic field and dynamic pressure ULF fluctuations in coronal-mass-ejection-driven sheath regions, Ann. Geophys., 31, 1559–1567, https://doi.org/10.5194/angeo-31-1559-2013, 2013. a
Kilpua, E. K. J., Hietala, H., Turner, D. L., Koskinen, H. E. J., Pulkkinen, T. I., Rodriguez, J. V., Reeves, G. D., Claudepierre, S. G., and Spence, H. E.: Unraveling the drivers of the storm time radiation belt response, Geophys. Res. Lett., 42, 3076–3084, https://doi.org/10.1002/2015GL063542, 2015. a, b, c, d
Kilpua, E. K. J., Balogh, A., von Steiger, R., and Liu, Y. D.: Geoeffective Properties of Solar Transients and Stream Interaction Regions, Space Sci. Rev., 212, 1271–1314, https://doi.org/10.1007/s11214-017-0411-3, 2017b. a, b, c, d, e, f
Kilpua, E. K. J., Fontaine, D., Moissard, C., Ala-Lahti, M., Palmerio, E., Yordanova, E., Good, S. W., Kalliokoski, M. M. H., Lumme, E., Osmane, A., Palmroth, M., and Turc, L.: Solar Wind Properties and Geospace Impact of Coronal Mass Ejection-Driven Sheath Regions: Variation and Driver Dependence, Space Weather, 17, 1257–1280, https://doi.org/10.1029/2019SW002217, 2019a. a, b
Kilpua, E. K. J., Turner, D. L., Jaynes, A. N., Hietala, H., Koskinen, H. E. J., Osmane, A., Palmroth, M., Pulkkinen, T. I., Vainio, R., Baker, D., and Claudepierre, S. G.: Outer Van Allen Radiation Belt Response to Interacting Interplanetary Coronal Mass Ejections, J. Geophys. Res.-Space, 124, 1927–1947, https://doi.org/10.1029/2018JA026238, 2019b. a, b, c
Kim, K.-C. and Shprits, Y.: Statistical Analysis of Hiss Waves in Plasmaspheric Plumes Using Van Allen Probe Observations, J. Geophys. Res.-Space, 124, 1904–1915, https://doi.org/10.1029/2018JA026458, 2019. a
King, J. H. and Papitashvili, N. E.: Solar wind spatial scales in and comparisons of hourly Wind and ACE plasma and magnetic field data, J. Geophys. Res.-Space, 110, A02104, https://doi.org/10.1029/2004JA010649, 2005. a
Klein, L. W. and Burlaga, L. F.: Interplanetary magnetic clouds at 1 AU, J. Geophys. Res., 87, 613–624, https://doi.org/10.1029/JA087iA02p00613, 1982. a
Krauss, S., Temmer, M., Veronig, A., Baur, O., and Lammer, H.: Thermospheric and geomagnetic responses to interplanetary coronal mass ejections observed by ACE and GRACE: Statistical results, J. Geophys. Res.-Space, 120, 8848–8860, https://doi.org/10.1002/2015JA021702, 2015. a
Lam, M. M., Horne, R. B., Meredith, N. P., Glauert, S. A., Moffat-Griffin, T., and Green, J. C.: Origin of energetic electron precipitation >30 keV into the atmosphere, J. Geophys. Res.-Space, 115, A00F08, https://doi.org/10.1029/2009JA014619, 2010. a
Li, H., Yuan, Z., Yu, X., Huang, S., Wang, D., Wang, Z., Qiao, Z., and Wygant, J. R.: The enhancement of cosmic radio noise absorption due to hiss-driven energetic electron precipitation during substorms, J. Geophys. Res.-Space, 120, 5393–5407, https://doi.org/10.1002/2015JA021113, 2015. a
Li, W., Thorne, R. M., Angelopoulos, V., Bortnik, J., Cully, C. M., Ni, B., Le Contel, O., Roux, A., Auster, U., and Magnes, W.: Global distribution of whistler-mode chorus waves observed on the THEMIS spacecraft, Geophys. Res. Lett., 36, L09104, https://doi.org/10.1029/2009GL037595, 2009. a
Little, C. G. and Leinbach, H.: The Riometer – A Device for the Continuous Measurement of Ionospheric Absorption, Proc. IRE, 47, 315–320, https://doi.org/10.1109/JRPROC.1959.287299, 1959. a
Longden, N., Honary, F., Kavanagh, A. J., and Manninen, J.: The driving mechanisms of particle precipitation during the moderate geomagnetic storm of 7 January 2005, Ann. Geophys., 25, 2053–2068, https://doi.org/10.5194/angeo-25-2053-2007, 2007. a
Longden, N., Denton, M. H., and Honary, F.: Particle precipitation during ICME-driven and CIR-driven geomagnetic storms, J. Geophys. Res.-Space, 113, A06205, https://doi.org/10.1029/2007JA012752, 2008. a, b, c
Lugaz, N., Farrugia, C. J., Huang, C.-L., and Spence, H. E.: Extreme geomagnetic disturbances due to shocks within CMEs, Geophys. Res. Lett., 42, 4694–4701, https://doi.org/10.1002/2015GL064530, 2015. a
Malaspina, D. M., Jaynes, A. N., Boulé, C., Bortnik, J., Thaller, S. A., Ergun, R. E., Kletzing, C. A., and Wygant, J. R.: The distribution of plasmaspheric hiss wave power with respect to plasmapause location, Geophys. Res. Lett., 43, 7878–7886, https://doi.org/10.1002/2016GL069982, 2016. a
Masías-Meza, J. J., Dasso, S., Démoulin, P., Rodriguez, L., and Janvier, M.: Superposed epoch study of ICME sub-structures near Earth and their effects on Galactic cosmic rays, Astron. Astrophys., 592, A118, https://doi.org/10.1051/0004-6361/201628571, 2016. a
Matthes, K., Funke, B., Andersson, M. E., Barnard, L., Beer, J., Charbonneau, P., Clilverd, M. A., Dudok de Wit, T., Haberreiter, M., Hendry, A., Jackman, C. H., Kretzschmar, M., Kruschke, T., Kunze, M., Langematz, U., Marsh, D. R., Maycock, A. C., Misios, S., Rodger, C. J., Scaife, A. A., Seppälä, A., Shangguan, M., Sinnhuber, M., Tourpali, K., Usoskin, I., van de Kamp, M., Verronen, P. T., and Versick, S.: Solar forcing for CMIP6 (v3.2), Geosci. Model Dev., 10, 2247–2302, https://doi.org/10.5194/gmd-10-2247-2017, 2017. a
Miyoshi, Y., Kataoka, R., Kasahara, Y., Kumamoto, A., Nagai, T., and Thomsen, M. F.: High-speed solar wind with southward interplanetary magnetic field causes relativistic electron flux enhancement of the outer radiation belt via enhanced condition of whistler waves, Geophys. Res. Lett., 40, 4520–4525, https://doi.org/10.1002/grl.50916, 2013. a
Motoba, T., Takahashi, K., Gjerloev, J., Ohtani, S., and Milling, D. K.: The role of compressional Pc5 pulsations in modulating precipitation of energetic electrons, J. Geophys. Res.-Space, 118, 7728–7739, https://doi.org/10.1002/2013JA018912, 2013. a
Newnham, D. A., Clilverd, M. A., Rodger, C. J., Hendrickx, K., Megner, L., Kavanagh, A. J., Seppälä, A., Verronen, P. T., Andersson, M. E., Marsh, D. R., Kovács, T., Feng, W., and Plane, J. M. C.: Observations and Modeling of Increased Nitric Oxide in the Antarctic Polar Middle Atmosphere Associated With Geomagnetic Storm-Driven Energetic Electron Precipitation, J. Geophys. Res.-Space, 123, 6009–6025, https://doi.org/10.1029/2018JA025507, 2018. a
Nikolaeva, N. S., Yermolaev, Y. I., and Lodkina, I. G.: Dependence of geomagnetic activity during magnetic storms on the solar wind parameters for different types of streams, Geomagn. Aeronomy, 51, 49–65, https://doi.org/10.1134/S0016793211010099, 2011. a
O'Brien, T. P. and Moldwin, M. B.: Empirical plasmapause models from magnetic indices, Geophys. Res. Lett., 30, 1152, https://doi.org/10.1029/2002GL016007, 2003. a
Osmane, A., Wilson, III, L. B., Blum, L., and Pulkkinen, T. I.: On the Connection between Microbursts and Nonlinear Electronic Structures in Planetary Radiation Belts, Astrophys. J., 816, https://doi.org/10.3847/0004-637X/816/2/51, 2016. a
Østgaard, N., Stadsnes, J., Bjordal, J., Vondrak, R. R., Cummer, S. A., Chenette, D. L., Parks, G. K., Brittnacher, M. J., and McKenzie, D. L.: Global-scale electron precipitation features seen in UV and X rays during substorms, J. Geophys. Res., 104, 10191–10204, https://doi.org/10.1029/1999JA900004, 1999. a
Perona, G. E.: Theory on the precipitation of magnetospheric electrons at the time of a sudden commencement, J. Geophys. Res., 77, 101–111, https://doi.org/10.1029/JA077i001p00101, 1972. a
Potapov, A. S.: ULF wave activity in high-speed streams of the solar wind: Impact on the magnetosphere, J. Geophys. Res.-Space, 118, 6465–6477, https://doi.org/10.1002/2013JA019119, 2013. a
Pulkkinen, A., Amm, O., Viljanen, A., and BEAR Working Group: Separation of the geomagnetic variation field on the ground into external and internal parts using the spherical elementary current system method, Earth Planet. Space, 55, 117–129, 2003. a
Pulkkinen, T. I., Partamies, N., Huttunen, K. E. J., Reeves, G. D., and Koskinen, H. E. J.: Differences in geomagnetic storms driven by magnetic clouds and ICME sheath regions, Geophys. Res. Lett., 34, L02105, https://doi.org/10.1029/2006GL027775, 2007. a
Pytte, T., McPherron, R. L., and Kokubun, S.: The ground signatures of the expansion phase during multiple onset substorms, Planet. Space Sci., 24, 1115–1132, https://doi.org/10.1016/0032-0633(76)90149-5, 1976. a
Ranta, H., Ranta, A., Collis, P. N., and Hargreaves, J. K.: Development of the auroral absorption substorm: Studies of pre-onset phase and sharp onset using an extensive riometer network, Planet. Space Sci., 29, 1287–1313, https://doi.org/10.1016/0032-0633(81)90095-7, 1981. a
Richardson, I. G.: Solar wind stream interaction regions throughout the heliosphere, Living Rev. Sol. Phys., 15, https://doi.org/10.1007/s41116-017-0011-z, 2018. a
Richmond, A. D.: Ionospheric Electrodynamics Using Magnetic Apex Coordinates, J. Geomagn. Geoelectr., 47, 191–212, https://doi.org/10.5636/jgg.47.191, 1995. a
Rodger, C. J., Clilverd, M. A., Thomson, N. R., Gamble, R. J., SeppäLä, A., Turunen, E., Meredith, N. P., Parrot, M., Sauvaud, J.-A., and Berthelier, J.-J.: Radiation belt electron precipitation into the atmosphere: Recovery from a geomagnetic storm, J. Geophys. Res.-Space, 112, A11307, https://doi.org/10.1029/2007JA012383, 2007. a
Rodger, C. J., Clilverd, M. A., SeppäLä, A., Thomson, N. R., Gamble, R. J., Parrot, M., Sauvaud, J.-A., and Ulich, T.: Radiation belt electron precipitation due to geomagnetic storms: Significance to middle atmosphere ozone chemistry, J. Geophys. Res.-Space, 115, A11320, https://doi.org/10.1029/2010JA015599, 2010. a
Rodger, C. J., Clilverd, M. A., Kavanagh, A. J., Watt, C. E. J., Verronen, P. T., and Raita, T.: Contrasting the responses of three different ground-based instruments to energetic electron precipitation, Radio Sci., 47, RS2021, https://doi.org/10.1029/2011RS004971, 2012. a
Saikin, A. A., Zhang, J.-C., Smith, C. W., Spence, H. E., Torbert, R. B., and Kletzing, C. A.: The dependence on geomagnetic conditions and solar wind dynamic pressure of the spatial distributions of EMIC waves observed by the Van Allen Probes, J. Geophys. Res.-Space, 121, 4362–4377, https://doi.org/10.1002/2016JA022523, 2016. a
Selesnick, R. S., Blake, J. B., and Mewaldt, R. A.: Atmospheric losses of radiation belt electrons, J. Geophys. Res.-Space, 108, 1468, https://doi.org/10.1029/2003JA010160, 2003. a
Seppälä, A., Clilverd, M. A., Beharrell, M. J., Rodger, C. J., Verronen, P. T., Andersson, M. E., and Newnham, D. A.: Substorm-induced energetic electron precipitation: Impact on atmospheric chemistry, Geophys. Res. Lett., 42, 8172–8176, https://doi.org/10.1002/2015GL065523, 2015. a
Shain, C. A.: Galactic Radiation at 18.3 Mc/s, Austr. J. Sci. Res. A, 4, 258, https://doi.org/10.1071/CH9510258, 1951. a
Shen, X.-C., Hudson, M. K., Jaynes, A. N., Shi, Q., Tian, A., Claudepierre, S. G., Qin, M.-R., Zong, Q.-G., and Sun, W.-J.: Statistical study of the storm time radiation belt evolution during Van Allen Probes era: CME- versus CIR-driven storms, J. Geophys. Res.-Space, 122, 8327–8339, https://doi.org/10.1002/2017JA024100, 2017. a, b
Shue, J.-H., Song, P., Russell, C. T., Steinberg, J. T., Chao, J. K., Zastenker, G., Vaisberg, O. L., Kokubun, S., Singer, H. J., Detman, T. R., and Kawano, H.: Magnetopause location under extreme solar wind conditions, J. Geophys. Res., 103, 17691–17700, https://doi.org/10.1029/98JA01103, 1998. a, b
Smith, A. J., Freeman, M. P., and Reeves, G. D.: Postmidnight VLF chorus events, a substorm signature observed at the ground near L=4, J. Geophys. Res., 101, 24641–24654, https://doi.org/10.1029/96JA02236, 1996. a
Spanswick, E., Reeves, G. D., Donovan, E., and Friedel, R. H. W.: Injection region propagation outside of geosynchronous orbit, J. Geophys. Res.-Space, 115, A11214, https://doi.org/10.1029/2009JA015066, 2010. a
Summers, D., Ni, B., Meredith, N. P., Horne, R. B., Thorne, R. M., Moldwin, M. B., and Anderson, R. R.: Electron scattering by whistler-mode ELF hiss in plasmaspheric plumes, J. Geophys. Res.-Space, 113, A04219, https://doi.org/10.1029/2007JA012678, 2008. a
Thorne, R. M., O'Brien, T. P., Shprits, Y. Y., Summers, D., and Horne, R. B.: Timescale for MeV electron microburst loss during geomagnetic storms, J. Geophys. Res.-Space, 110, A09202, https://doi.org/10.1029/2004JA010882, 2005. a
Turner, D. L., Kilpua, E. K. J., Hietala, H., Claudepierre, S. G., O'Brien, T. P., Fennell, J. F., Blake, J. B., Jaynes, A. N., Kanekal, S., Baker, D. N., Spence, H. E., Ripoll, J.-F., and Reeves, G. D.: The Response of Earth's Electron Radiation Belts to Geomagnetic Storms: Statistics From the Van Allen Probes Era Including Effects From Different Storm Drivers, J. Geophys. Res.-Space, 124, 1013–1034, https://doi.org/10.1029/2018JA026066, 2019. a
Turunen, E., Kero, A., Verronen, P. T., Miyoshi, Y., Oyama, S.-I., and Saito, S.: Mesospheric ozone destruction by high-energy electron precipitation associated with pulsating aurora, J. Geophys. Res.-Atmos., 121, 11852–11861, https://doi.org/10.1002/2016JD025015, 2016. a
Usanova, M. E., Drozdov, A., Orlova, K., Mann, I. R., Shprits, Y., Robertson, M. T., Turner, D. L., Milling, D. K., Kale, A., Baker, D. N., Thaller, S. A., Reeves, G. D., Spence, H. E., Kletzing, C., and Wygant, J.: Effect of EMIC waves on relativistic and ultrarelativistic electron populations: Ground-based and Van Allen Probes observations, Geophys. Res. Lett., 41, 1375–1381, https://doi.org/10.1002/2013GL059024, 2014. a
van de Kamp, M.: Harmonic quiet‐day curves as magnetometer baselines for ionospheric current analyses, Geosci. Instrum. Method Data Syst., 2, 289–304, 2013. a
Wang, C.-P., Thorne, R., Liu, T. Z., Hartinger, M. D., Nagai, T., Angelopoulos, V., Wygant, J. R., Breneman, A., Kletzing, C., Reeves, G. D., Claudepierre, S. G., and Spence, H. E.: A multispacecraft event study of Pc5 ultralow-frequency waves in the magnetosphere and their external drivers, J. Geophys. Res.-Space, 122, 5132–5147, https://doi.org/10.1002/2016JA023610, 2017. a
Wanliss, J. A. and Showalter, K. M.: High-resolution global storm index: Dst versus SYM-H, J. Geophys. Res.-Space, 111, A02202, https://doi.org/10.1029/2005JA011034, 2006. a
Weygand, J. M. and Wing, S.: Comparison of DMSP and SECS region‐1 and region‐2 ionospheric current boundary, J. Atmos. Sol.-Terr. Phys., 143/144, 8–13, https://doi.org/10.1016/j.jastp.2016.03.002, 2016. a
Yermolaev, Y. I., Lodkina, I. G., and Yermolaev, M. Y.: Dynamics of Large-Scale Solar-Wind Streams Obtained by the Double Superposed Epoch Analysis: 3. Deflection of the Velocity Vector, Sol. Phys., 293, https://doi.org/10.1007/s11207-018-1310-9, 2018. a
Zhang, X.-J., Li, W., Thorne, R. M., Angelopoulos, V., Bortnik, J., Kletzing, C. A., Kurth, W. S., and Hospodarsky, G. B.: Statistical distribution of EMIC wave spectra: Observations from Van Allen Probes, Geophys. Res. Lett., 43, https://doi.org/10.1002/2016GL071158, 2016. a
Zheng, Y., Lui, A. T. Y., Fok, M.-C., Anderson, B. J., Brandt, P. C., Immel, T. J., and Mitchell, D. G.: Relationship between Region 2 field-aligned current and the ring current: Model results, J. Geophys. Res.-Space, 111, A11S06, https://doi.org/10.1029/2006JA011603, 2006. a
Zurbuchen, T. H. and Richardson, I. G.: In-Situ Solar Wind and Magnetic Field Signatures of Interplanetary Coronal Mass Ejections, Space Sci. Rev., 123, 31–43, https://doi.org/10.1007/s11214-006-9010-4, 2006. a