the Creative Commons Attribution 4.0 License.
the Creative Commons Attribution 4.0 License.
 | 19 Feb 2020
Early morning peaks in the diurnal cycle of precipitation over the northern coast of West Java and possible influencing factors
Erma Yulihastin
Tri Wahyu Hadi
Nining Sari Ningsih
Muhammad Ridho Syahputra
The diurnal cycles of precipitation over the northern coast of West Java have been studied using the Tropical Rainfall Measuring Mission (TRMM) Real Time Multi-satellite Precipitation Analyses (TMPA-RT) products with records spanning from 2000 to 2016, with emphasis on the occurrences of early morning precipitation peaks. Diurnal precipitation over the study area during November to March is basically characterized by precipitation peaks that occur in the afternoon to evening time (15:00–21:00 LT), but secondary peaks in the night to morning time (01:00–07:00 LT) are also pronounced in January and February. The harmonic analysis method was then applied to data of January and February to objectively determine the diurnal phase and classify the timing of precipitation for each day into three categories, i.e. afternoon-to-evening precipitation (AEP), early morning precipitation (EMP), and late morning precipitation (LMP) with peaks that occur in the time windows of 13:00–24:00, 01:00–04:00, and 05:00–12:00 LT, respectively. In terms of frequency of occurrence, AEP, EMP, and LMP constitute 55 %, 18.9 %, and 26.1 % of total samples of precipitation events. In spite of the smallest percentage, EMP events are characterized by seaward (as well as landward) propagation, flat phase distribution, and large mean amplitudes. The propagating characteristics of EMP are more prominent, with indications of stronger connectivity between precipitation systems over land and ocean, when data are composited by taking the 99th percentile values in each grid to represent extreme precipitation events. The flat phase distribution of EMP events suggests that the timing of coastal precipitation is not necessarily locked to the phase of land–sea breezes, thus allowing precipitation to occur more randomly. Furthermore, the role of the South China Sea cold tongue (SCS-CT) and cross-equatorial northerly surge (CENS) as influencing factors for the occurrences of the EMP event have also been investigated. In agreement with previous studies, we confirmed that the SCS-CT generally prevails in January and February, and morning precipitation events over the northern coast of West Java mainly occurred when there was more enhanced sea surface temperature (SST) cooling in the South China Sea. Additionally, we found that CENS is the most differential factor with regard to the phase of coastal precipitation. In this case, CENS is positively correlated with SCS-CT and, when associated with EMP events, concurrent enhancement of CENS and SCS-CT is connected to a narrow channelling of strong surface northerly wind anomalies just offshore of Indochina and the Malay Peninsula.
- Article
(5023 KB) - Full-text XML
- BibTeX
- EndNote


Modelling the diurnal cycle of precipitation over the Maritime Continent (MC) is still one of the biggest challenges in tropical meteorology today because of significant biases in simulated rainfall (Love et al., 2011; Teo et al., 2011; Li et al., 2017). While models can capture the gross feature, they may overestimate or underestimate the diurnal cycle amplitudes in the simulation results, especially near coastal regions (Love et al., 2011; Trilaksono et al., 2011; Li et al., 2017). Simulation results are also found to have problematic phase errors compared to satellite rainfall data (Love et al., 2011), with a bias as large as 2–4 h over both land and ocean in the MC (Li et al., 2017). The bias in rainfall simulation is even higher, up to 12 h over the northern coast of West Java and varying from 3 to 15 h over the western coast of Sumatra, compared to the Tropical Rainfall Measuring Mission (TRMM) satellite dataset (as interpreted from Fig. 5 in Im and Eltahir, 2017). Such deficiencies in the models cannot be remedied by simply increasing spatial resolution (e.g. Im and Eltahir, 2017; Li et al., 2017), which indicates that models still lack key capabilities to capture fundamental mechanisms involved in the diurnal convective activities over land and ocean.
It is well known that there are contrasting temporal patterns of diurnal convective activities in the MC (e.g. Nitta and Sekine, 1994; Yang and Slingo, 2001), which result in predominantly afternoon and morning precipitation peaks respective to land and ocean (Mori et al., 2004; Qian, 2008; Qian et al., 2010; Biasutti et al., 2012; Yamanaka, 2016; Yamanaka et al., 2018). Following Houze et al. (1981), many investigators believe that this canonical pattern of diurnal convection in the MC is driven by sea–land breeze interaction with the prevailing background monsoon flows. Observations of land–sea breezes over the MC have been reported in previous studies (Hadi et al., 2000, 2002; Araki et al., 2006) and the land–sea breeze explanation for the diurnal convection seems to be consistent with the climatological study by, among others, Yang and Smith (2006) that shows relatively constant phases of the diurnal convection throughout the year, although amplitudes may vary seasonally. In addition to the sea–land breezes, mechanisms involving gravity waves have also been proposed to explain diurnal convections over land and adjacent seas outside and in the MC (Mapes et al., 2003; Love et al., 2011). Interestingly, phase-locking characteristics between zonally propagating gravity waves and mesoscale convective systems in the MC have recently been confirmed by Ruppert and Zhang (2019).
On the other hand, Kikuchi and Wang (2008) pointed out that phase propagation of diurnal precipitation is prominent along the land–sea boundaries, which characterizes the coastal regime of the MC and other regions of the world. In an earlier study, Mori et al. (2004) reported that precipitating systems may propagate seaward or landward from coastal regions in Sumatra. A more recent study by Trismidianto et al. (2016) indicates that convection over coastal regions in Sumatra can also be induced by a decaying oceanic convective system. From results of a numerical study, Li et al. (2017) show that offshore or onshore rainfall propagation may occur over the coastal region of the MC all year round. These studies imply that rainfall over coastal regions may have peaks at different times in the day depending on the initial location, the direction, and the phase speed of the propagating convective systems.
Apart from the land–sea contrast of afternoon–morning precipitation peaks, diurnal precipitation analysed from TRMM data by Im and Eltahir (2017) seems to indicate that maximum precipitation over the coastal region of West Java occurs frequently in the early morning around 01:00 LT during the wet season in the December–January–February (DJF) period. Additionally, diurnal variations of precipitating clouds analysed from boundary layer radar (BLR) data observed during DJF also indicate that there is a slight increase (decrease) in the frequency of occurrences of deep convective (stratiform) clouds between 03:00 and 06:00 LT (as in Fig. 9 of Renggono et al., 2001) at Serpong, which is situated in the coastal plain of West Java. These previous studies did not seem to pay much attention to the peculiar timing of precipitation over the coastal region but, based on results of numerical simulation, Koseki et al. (2012) mentioned that the South China Sea cold tongue (SCS-CT) phenomenon might affect the morning precipitation over the northern coast of Java by shifting the offshore convection system to move closer to the coastal area. In a case study, maximum rainfall at 04:00 LT observed during 16–25 January 2018 over northern West Java was due to a cross-equatorial northerly surge (CENS) activity that coincided with the SCS-CT event (Mori et al., 2018). Thus, early morning precipitation peaks seem to have a strong relationship with propagating convective systems over the coastal region under the influence of certain background synoptic conditions. Li et al. (2017) suggested that background winds were the most important factor for the offshore and onshore propagation of precipitation from the coastal region, but there are other possible mechanisms as proposed by Mori et al. (2004). Hence, phenomena related to early morning precipitation peaks and possible influencing factors like the occurrences of CENS and SCS-CT need to be more thoroughly studied to improve our understanding of the diurnal convection in the MC.
In the present study, we are particularly interested in analysing the climatology of early morning precipitation peaks over the northern coast of West Java, not only because documentation regarding this phenomenon is still limited, but also because extreme precipitations occurring in the early morning time are potentially linked to severe flooding in the Jakarta area (Wu et al., 2007, 2013; Trilaksono et al., 2011, 2012; Sulistyowati et al., 2014; Nuryanto et al., 2019). Our basic approach is to analyse the prevalence of early morning precipitation peaks over the area of interest by classifying diurnal precipitation into several dominant patterns with regards to the phase or time of occurrences. We also analyse statistical correlations between the early morning precipitation and predominant background conditions, especially those related to CENS and SCS-CT, and attempt to interpret the results in conjunction with propagating characteristics of convective systems over the coastal region.
In the next section of this paper, we describe detailed methods to identify the occurrences of early morning precipitation peaks and their possible relationship with CENS and SCS-CT events, while the results are discussed in Sect. 3. The last section presents the summary of our important results and findings.
In order to investigate diurnal cycles of precipitation over the northern coast of West Java, we used the Tropical Rainfall Measuring Mission (TRMM) Real-Time Multi-satellite Precipitation Analyses (TMPA-RT) product of the 3B41RT dataset, the so-called TMPA-RT dataset with a spatial resolution of 0.25∘ × 0.25∘ at an hourly time interval. The TMPA-RT datasets of version 6 (2000–2010) and version 7 (2011–2016) (Huffman et al., 2007; Huffman, 2012; Yong et al., 2015) contain precipitation estimates calibrated by the TRMM Combined Instrument and TRMM Microwave products (Harris et al., 2007; Liu et al., 2008; Yong et al., 2015). These data are archived, being updated in near (pseudo) real time with a latency of 6 to 10 h, and are free for download from NASA's website at https://pmm.nasa.gov/data-access/downloads (last access: April 2017). In this case, we have obtained a 16-year data record for the November through March (NDJFM) periods of November 2000 to March 2016. Other data involved in our analyses are daily wind data with a spatial resolution of 2.5∘ × 2.5∘ derived from the National Center for Environmental Prediction/National Center for Atmospheric Research (NCEP/NCAR) reanalysis (Kalnay et al., 1996) and optimal interpolated sea surface temperature (OISST) using the advanced very high-resolution radiometer (AVHRR) dataset (Reynolds et al., 2007; Banzon et al., 2016) that has a spatial resolution of 0.25∘ × 0.25∘ at a daily time interval.
It should be noted that the TMPA-RT dataset was intended to improve applications in flood prediction, with a downside of producing more false alarms in peak flow (Harris et al., 2007). However, as has been demonstrated in many previous works (e.g. Mori et al., 2004; Kikuchi and Wang, 2008), it should still be possible to extract consistent patterns of the diurnal cycle in precipitation from the satellite data by averaging over a relatively long period of time. Moreover, Liu et al. (2008) have used the TMPA-RT dataset to analyse propagating rainfall episodes in the Bay of Bengal in May to September periods during 2002 to 2004.
In this study, we first analysed the composite diurnal patterns from the time series of gridded hourly precipitation averaged over the coastal area defined as the red-line bordered polygon in Fig. 1 for the months of November through March. Additionally, we also analysed the diurnal composite of longitudinally averaged precipitation over the area defined by the blue-dashed rectangle in Fig. 1. Results of these analyses are then used to draw the charts shown in Fig. 2 and will be discussed in Sect. 3.
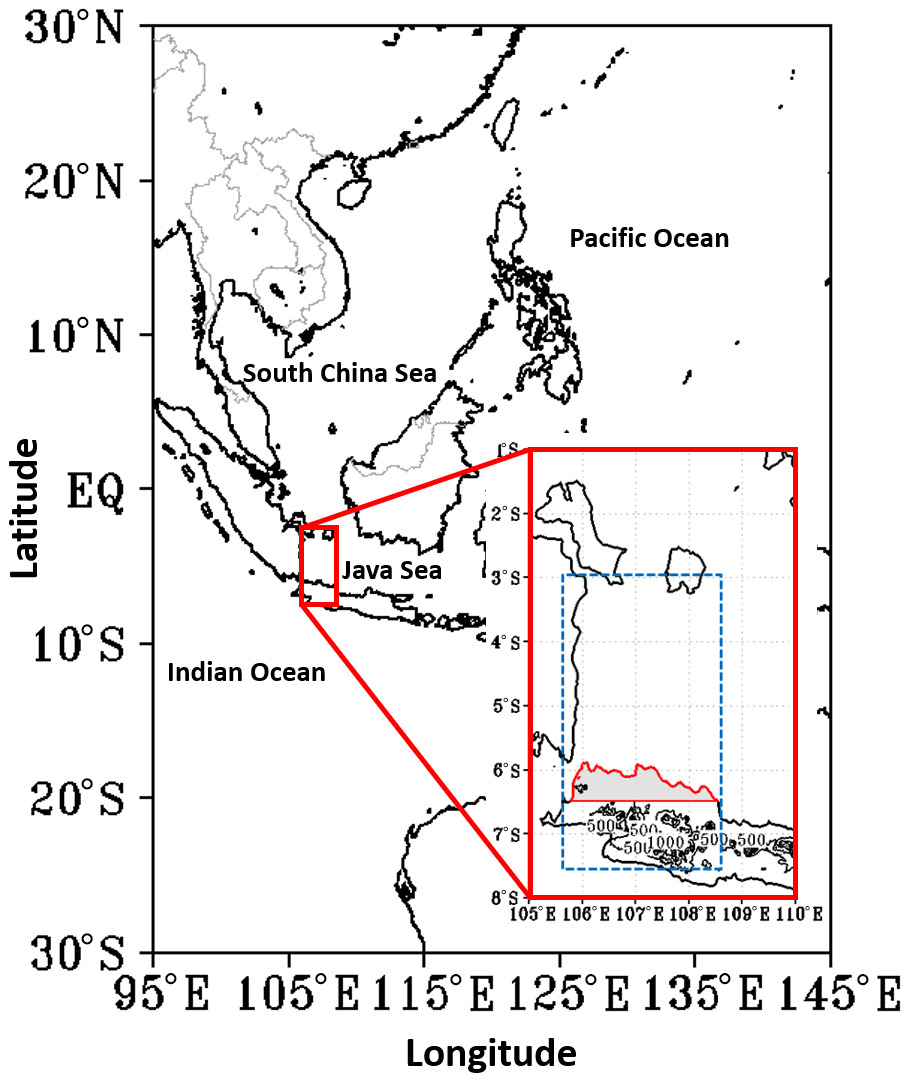
Figure 1A map showing the Maritime Continent and its surrounding area. The main area of interest in this study is depicted as the inset, with coastlines and topographic contours. The red-line bordered polygon (with land masks over the northern coastal plain of West Java) defines the area for spatial averaging of gridded precipitation data. The blue-dashed rectangle defines the area for longitudinally (105.5–108.5∘ E) averaged precipitation in Hovmöller analysis of Fig. 2.
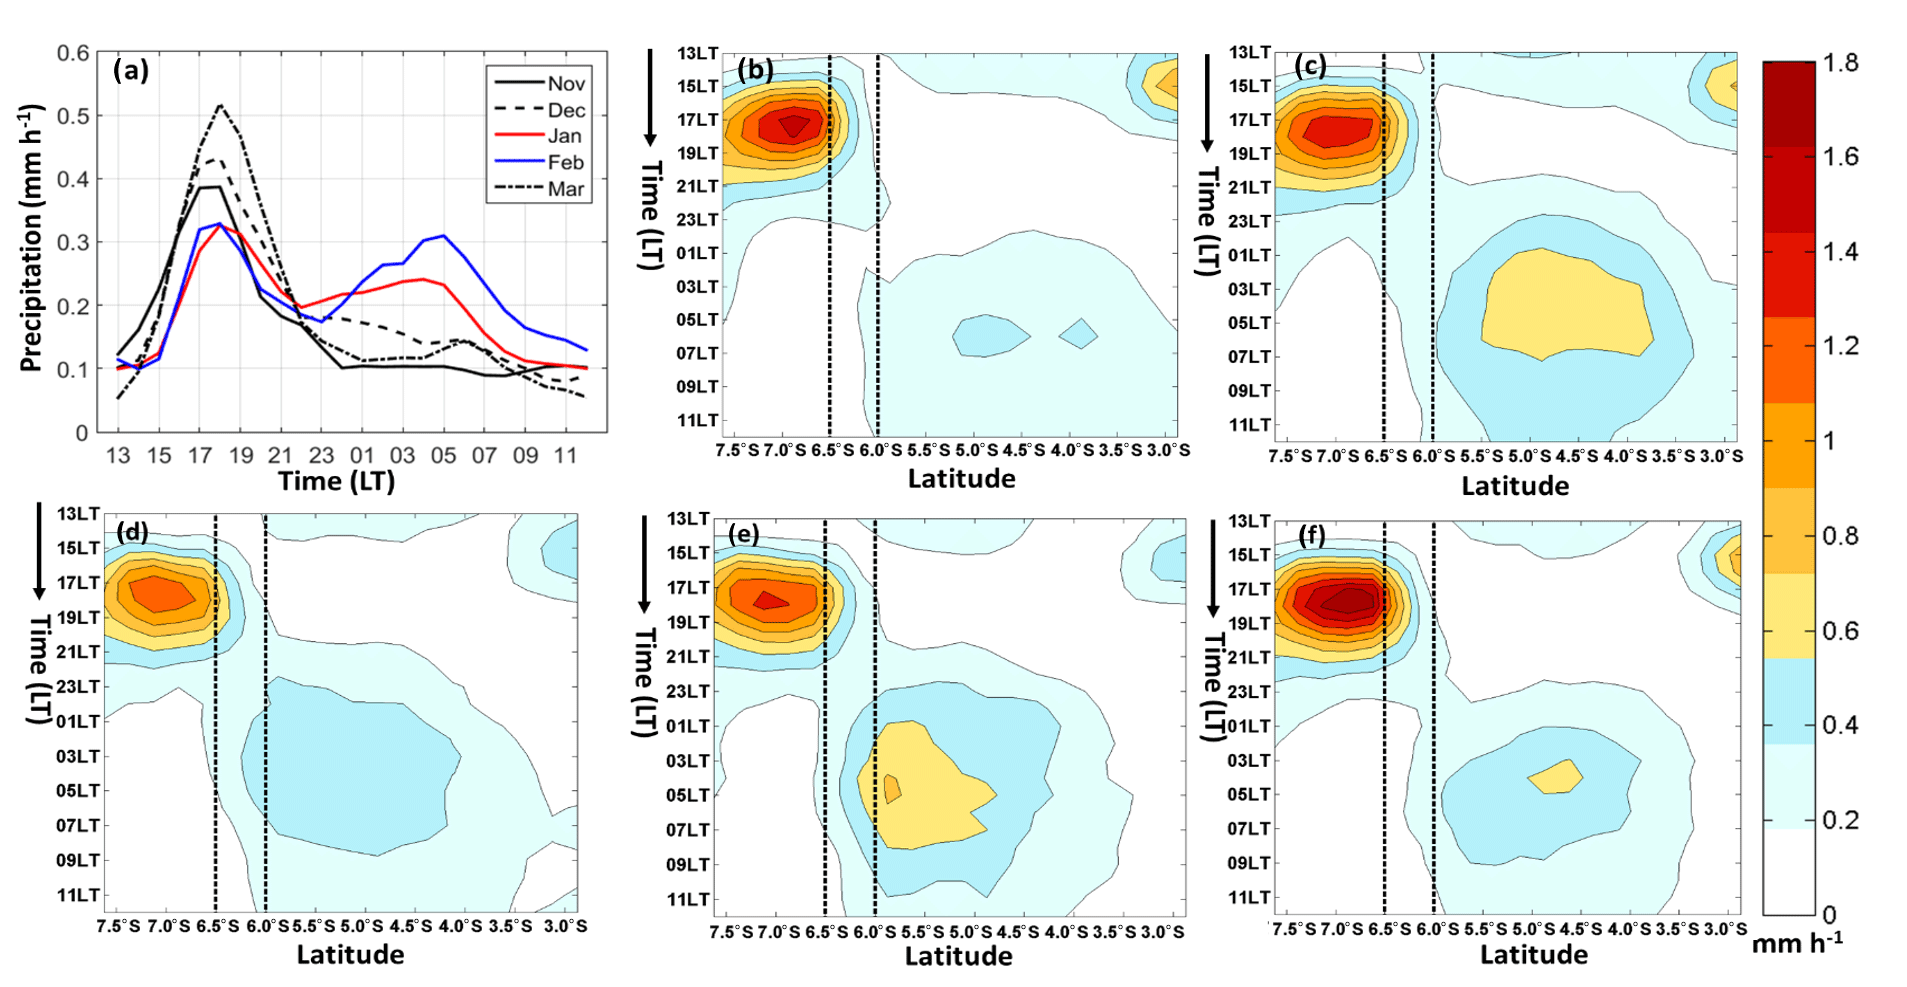
Figure 2(a) Climatology of area-averaged (see Fig. 1) diurnal precipitation over the northern coast of West Java, depicted as line plots of 24 h composite time series in different colours for the months of November (solid black), December (dashed black), January (solid red), February (solid blue), and March (dashed-dotted black) analysed from the TMPA-RT dataset of the 2000–2016 period. Other panels show the corresponding time–latitude cross sections (Hovmöller diagrams) of the diurnal composites for the months of (b) November, (c) December, (d) January, (e) February, and (f) March. Dashed vertical black lines in panels (b)–(f) denote the latitudes of the northern coastal area of West Java. Averaged precipitation rates in mm h−1 are shown as shaded contours.
In order to classify the phase or timing of precipitation, we picked samples of 24 h data (area-averaged over the red-line bordered polygon in Fig. 1). We then decomposed each sample into its harmonic constituents (similar method to that of Nitta and Sekine, 1994) by fitting the data (after subtracting by the daily mean) using a sinusoidal function
where yk is the precipitation anomaly contributed by the kth harmonic component, Ck is amplitude (in mm h−1), t is time in hours, T is the data period (in this case, 24 h), and θk (in radians) is the phase lag. It should be noted that, for each sample, the 24 h cycle starts from 13:00 and ends at 12:00 LT on the following day by assumption that precipitation is generally minimum during those hours. By obtaining the phase angle of the first harmonic constituent θ1, the timing of diurnal precipitation can be defined by an integer t=n that maximizes y1 in Eq. (1) and satisfies
Note that precipitation data are given as discrete time series at an hourly time interval, but θ1 is computed as a real number. The classification of phase or timing of precipitation is made in two steps. In the first step, the timing of precipitation is classified into
- i.
afternoon-to-evening precipitation (AEP) that occurs between 13:00 and 24:00 LT, or , and
- ii.
night time-to-morning precipitation (NMP) that occurs between 01:00 and 12:00 LT on the following day, or .
Then, in the second step, samples belonging to NMP are further classified into
- i.
early morning precipitation (EMP) that occurs between 01:00 and 04:00 LT (on the following day), or , and
- ii.
late morning precipitation (LMP) that occurs between 05:00 and 12:00 LT, or .
The first classification is performed in order to check whether early morning precipitation events are distinguishable from other samples, whereas the second classification is to quantify the prevalence of early morning precipitation relative to all samples in the NMP category.
Furthermore, to investigate factors that influence early morning (01:00–04:00 LT) precipitation on the northern coast of West Java, we carried out analyses of meridional wind and SST fields attributive to CENS and SCS-CT phenomena. In this case, we followed Hattori et al. (2011) and Koseki et al. (2012) to calculate indices for CENS and SCS-CT, respectively. Details of the calculations can be briefly described as follows.
The CENS index is calculated from daily mean surface (925 hPa) level meridional wind data spatially averaged over the area of (0–5∘ S, 105–115∘ E) as depicted in Fig. 8. Considering that the lifetime of a cold surge event is around 5–14 d with an average duration of approximately 7 consecutive days (Zhang et al., 1997), the resulting daily time series of wind data are then smoothed by a 5 d moving average. The smoothed spatially averaged time series data of the meridional wind thus define the daily CENS index, and a threshold of −4.5 m−1 is used to determine the occurrence of CENS.
A similar method applies for obtaining the SCS-CT index, but with the SST data averaged over the area of (2–10∘ N, 105–112∘ E) as shown in Fig. 9. In this case, a day with a SCS-CT event is defined when the index is lower than the threshold temperature of 26.4∘ (see Koseki et al., 2012, for more detailed procedures and explanations).
The CENS and SCS-CT indices are then used to calculate the relative frequency of occurrences of the coincidence between CENS and/or SCS-CT events and the three phases of precipitation peaks determined from previously mentioned harmonic analysis.
As we determined the phase of precipitation peaks based only on the first harmonic constituent that has the largest amplitude, we have one uniquely classified sample for each day. The samples of dates collected in these analyses were then used to make various composite plots.
3.1 Climatology of early morning precipitation peaks
The diurnal composites of area-averaged precipitation over the northern coast of West Java (red-line bordered polygon in Fig. 1), for the months of November to March during 2000 to 2016, are depicted in Fig. 2a. It can be seen that the dominant pattern is characterized by precipitation peaks occurring in the afternoon to evening time (15:00–21:00 LT). However, diurnal precipitation patterns in the months of January and February exhibit significant secondary precipitation peaks in the early morning to morning time (01:00–07:00 LT). The Hovmöller diagrams in Fig. 2b–f show the time–latitude variations of longitudinally averaged rainfall over the blue-dashed rectangle in Fig. 1. It should be clear that the coastal region (marked by vertical black-dashed lines) is affected by precipitation systems of both inland and oceanic origins. Figure 2d and e also clearly indicate that the oceanic precipitation system penetrates further inland during January and February, which appear as secondary peaks occurring between 01:00 and 07:00 LT as shown in Fig. 2a. In addition to two stationary patterns of precipitation over land and sea, Fig. 2c–f also show weak signals of land-to-sea propagation of precipitation over the coastal region during the night-to-morning transition between 23:00 and 03:00 LT on the following day.
The timing of precipitation peaks over the coastal region has been further analysed from the results of harmonic analysis (described in the previous section). Herein, we focus on the data of January and February that show strong signals of morning precipitation peaks (see Fig. 2a). Fig. 3a and Fig. 3b show the first harmonic (diurnal) constituent of each sample of 24 h rainfall time series, which were constructed from hourly data averaged over the coastal region defined in Fig. 1. In this case, the total number of samples that have been analysed is 373, which is not equivalent to the total number of days in all January–February months during the 16-year (2001 to 2016) period because time series with a diurnal cycle amplitude less than 0.2 mm h−1 are excluded to ensure selection of significant rainfall events (see e.g. El Kenawy et al., 2015, for thresholds of moderate rainfall in TMPA data).
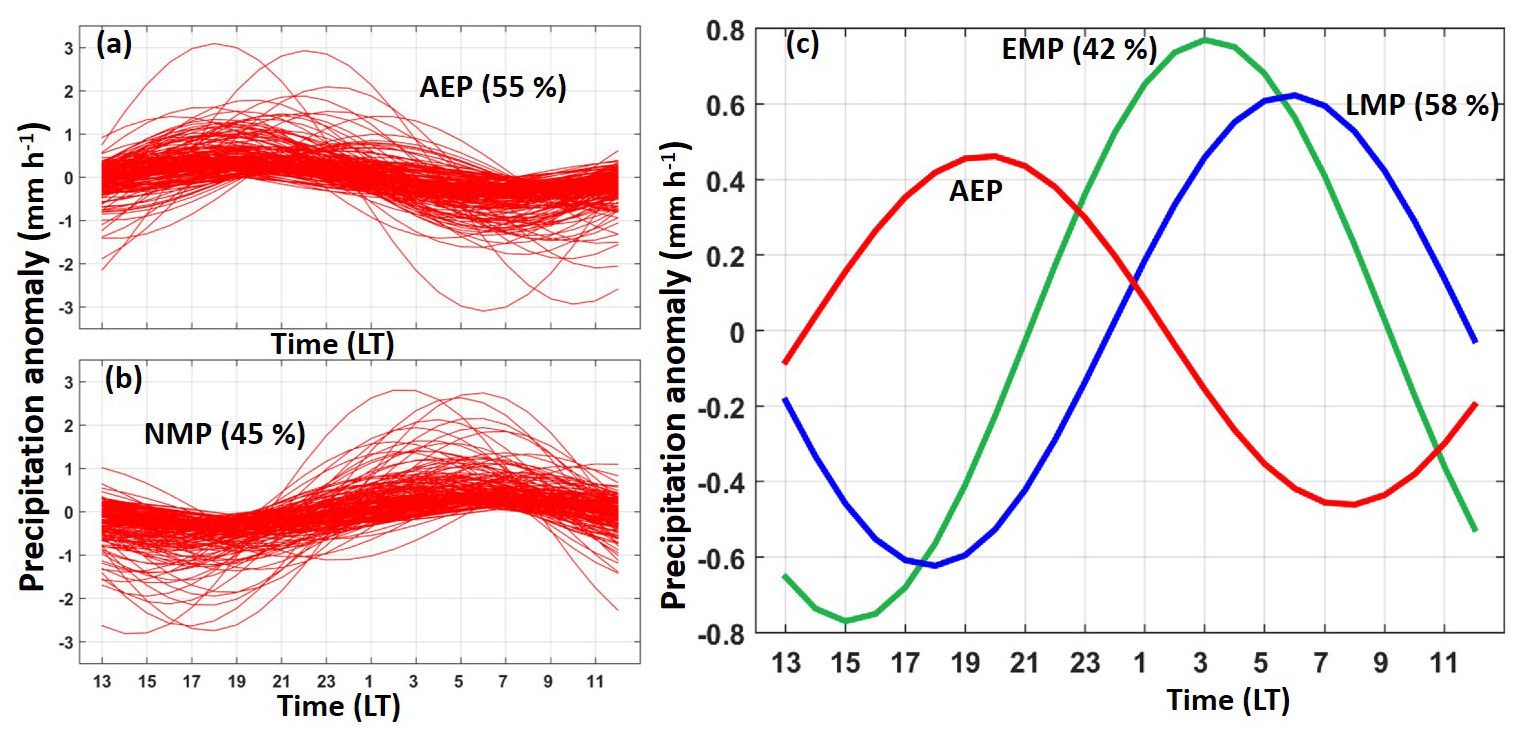
Figure 3The first harmonic components analysed from diurnal precipitation data that are grouped into (a) afternoon-to-evening precipitation (AEP) between 13:00 and 24:00 LT and (b) night time-to-morning precipitation (NMP) between 01:00 and 12:00 LT based on the phase angles (see text for explanation); (c) composite sinusoidal curves of AEP (red line) with those of NMP split into early morning precipitation (EMP) between 01:00 and 04:00 LT and late morning precipitation (LMP) between 05:00 and 12:00 LT. Percentage indicates frequency of occurrence relative to total samples for AEP and NMP, but those of EMP and LMP are relative to NMP samples.
Figure 3a shows the results for data that are categorized as AEP with maximum values between 13:00 and 24:00 LT, while Fig. 3b shows data of the NMP category with maximum values between 01:00 and 12:00 LT. Figure 3a and b clearly demonstrate that the application of the harmonic analysis method was successful in classifying the timing of diurnal precipitation. It is found that AEP is a dominant feature of the diurnal precipitation, which contributes 55 % of the diurnal rainfall patterns over the studied area. However, NMP also has a high frequency of occurrence, contributing 45 % of the total samples in January and February throughout the 2001 to 2016 period.
In Fig. 3c, three composites of the first harmonic signals are depicted. The first composite (red curve) represents the mean sinusoidal signal of AEP, while that of NMP has been further split into EMP that occurs between 01:00 and 04:00 LT (green curve) and LMP whose time of occurrence is between 05:00 and 12:00 LT. The frequencies of occurrence of EMP and LMP are 42 % and 58 %, respectively, relative to total NMP samples, or 18.9 % and 26.1 % relative to all samples. It is of interest to note that, in spite of the smallest percentage, EMP has the largest mean amplitude.
Figure 4 shows more detailed analysis of the phase distribution and the mean amplitude for all of the three 24 h cycle precipitation patterns, based on the results of harmonic analysis. It can be seen that phases of AEP exhibit a nearly normal distribution centred around 19:00 LT with two maxima of mean amplitudes around 18:00 and 22:00 LT. On the other hand, LMP shows a distribution that decreases with time, resembling a gamma-like distribution with a maximum mean amplitude around 06:00 LT. These characteristics of the distribution of frequency of occurrence of the two types of precipitation are indicative of the concentration times of convective activities, which are around 19:00 over land and 06:00 LT over sea. These results are in agreement with many previous investigations (e.g. Qian, 2008) and seem to signify the canonical pattern of land–sea contrast in the phase of precipitation, which are believed to be mainly controlled by land–sea breezes and their interactions with the monsoonal flows (e.g. Houze et al., 1981). However, it is quite interesting that EMP events have not only a flat phase distribution, which indicates more random events, but also high mean amplitudes with peaks around 04:00 LT. The statistical significance of these amplitudes is indicated by the sampling errors plotted as vertical bars in Fig. 4. The random occurrence of early morning precipitation might be closely related to propagating systems, as indicated from Fig. 2b–f, since their phases are not necessarily locked to the timing of sea–land breezes.
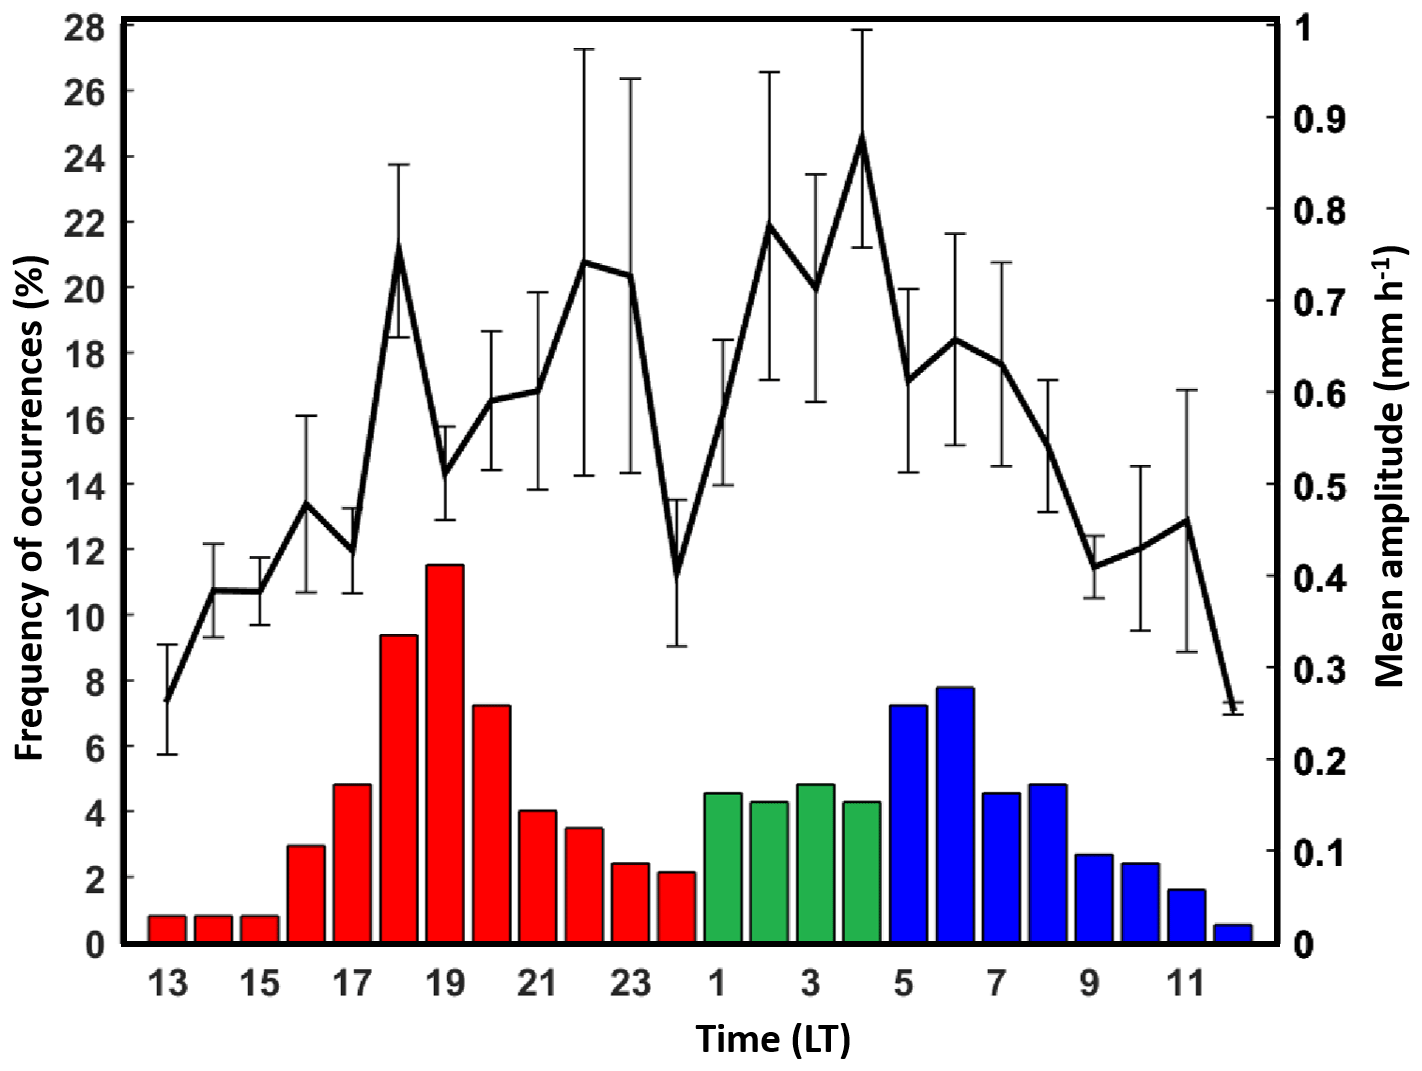
Figure 4Diurnal distribution of the mean amplitude of the first harmonic components (solid black line) and frequency of occurrence of the peak precipitation time (coloured bar chart) differentiated into three groups (same as in Fig. 3): AEP (red), EMP (green), and LMP (blue). The sampling errors () are plotted as vertical bars.
3.2 Relationships with propagating convective systems and extreme precipitation events
In order to investigate the relationship between early morning precipitation and the propagating characteristics of the precipitation system over the coastal region, we constructed Hovmöller diagrams similar to those of Fig. 2b–f but with data classified according to the previously defined three types of precipitation peaks, i.e. AEP, EMP, and LMP, and show the results in Fig. 5. Propagation of precipitation connecting two relatively stationary systems over land and sea can be distinctly seen from Fig. 5a and b. The propagating precipitation can be associated with rainfall events that occur during the late night (Fig. 5a) and early morning (Fig. 5b) time over the coastal region. It should be noted that in Fig. 5a the direction is mainly one way from land to sea, while in Fig. 5b there is also a discernible landward pattern of propagation. On the other hand, Fig. 5c illustrates more detached precipitation systems over land and sea. In this case, late morning precipitation over the coastal region can be seen as an extension of the oceanic precipitation system.
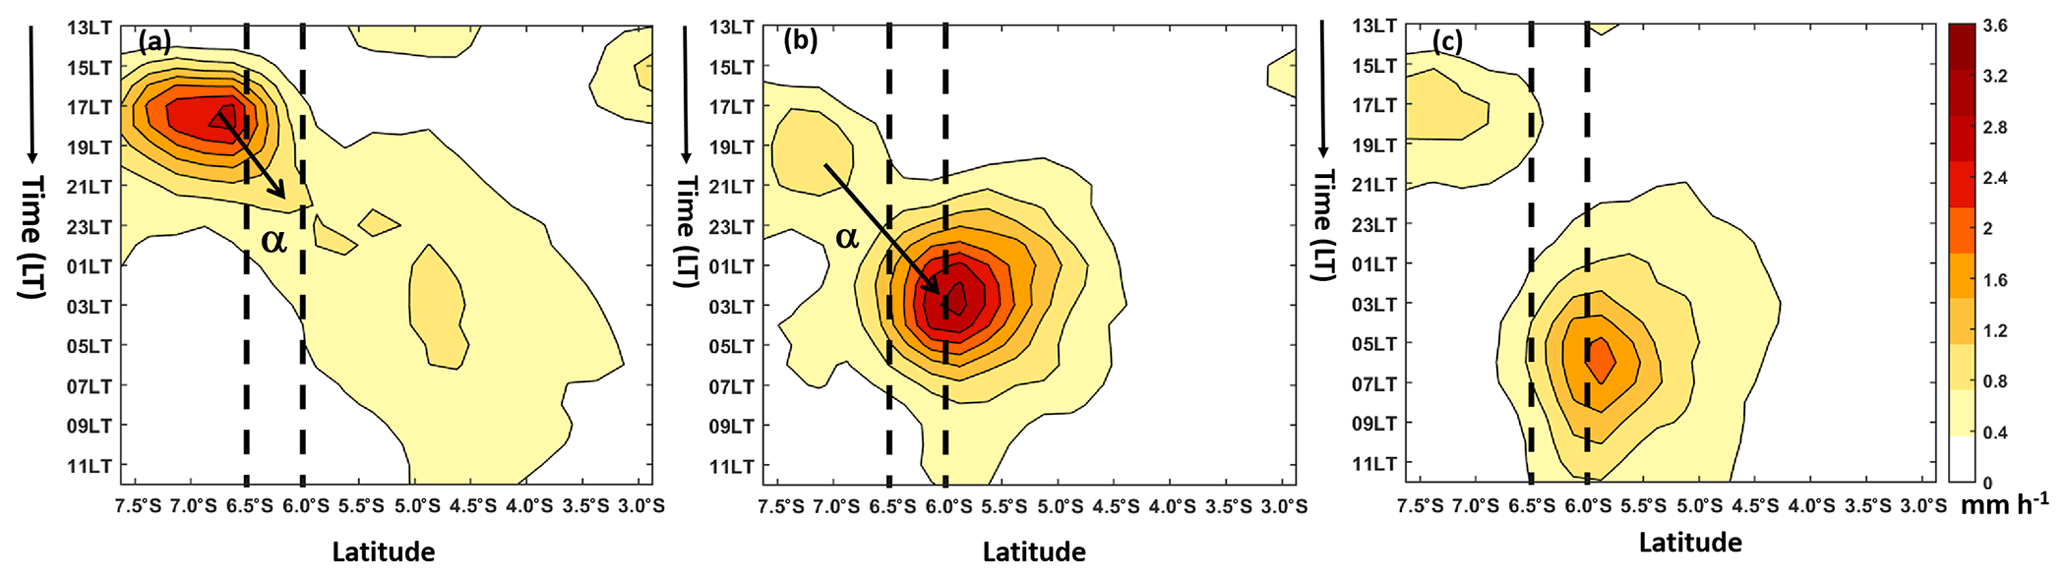
Figure 5Hovmöller diagrams of composite diurnal precipitation, similar to Fig. 2 except that data are classified by the phases or the timing of peak precipitation (as in Fig. 3) (a) AEP, (b) EMP, and (c) LMP. The black-dashed line indicates the boundary of the coastal area. The black solid arrows represent the direction of propagation (following Mori et al., 2004), with seaward propagation symbolized by α and landward propagation indicated by β.
We have discussed earlier in Sect. 1 that EMP may be linked to extreme precipitation events over the northern coast of Java. We performed other analyses using Hovmöller diagrams, similar to those in Fig. 5, but with averaged precipitations of the 99th percentile (P99) to represent extreme values in each data grid. The results, which are depicted in Fig. 6, strongly suggest that extreme rainfall events over the coastal region mainly occur between 01:00 and 04:00 LT and are characterized by the existence of propagating systems from both land and ocean (Fig. 6b). On the other hand, extreme coastal precipitation events that occurred during late night (Fig. 6a) and late morning (Fig. 6c) seem to originate only from either land-based or oceanic convection. Hence, there are distinct characteristics of propagating systems associated with extreme AEP, EMP, and LMP events over the coastal region. Furthermore, while oceanic convection seems to be major determinant for the occurrences of morning coastal precipitation, linkage to land-based precipitation may also be important for the case of EMP.
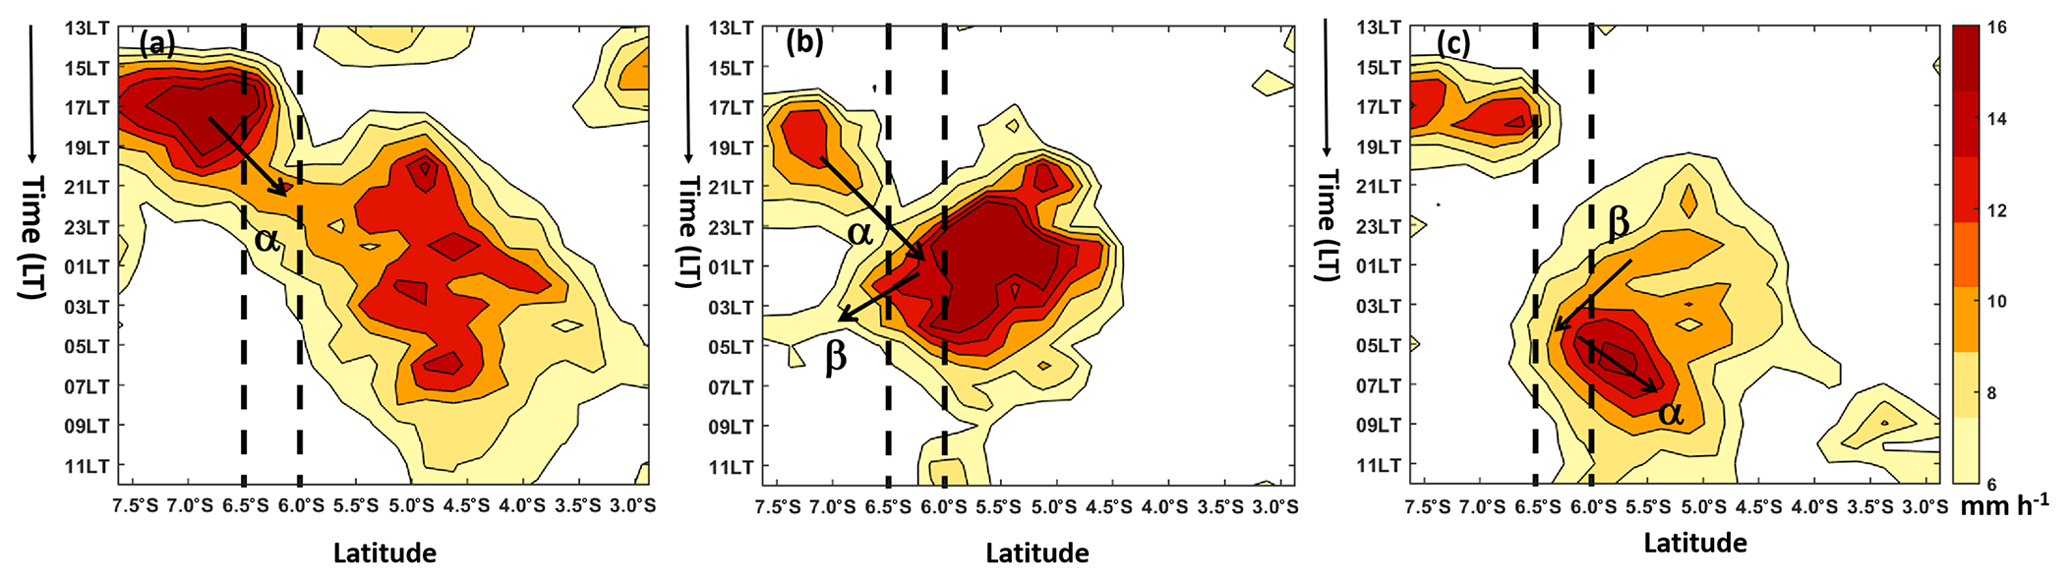
Figure 6Hovmöller diagrams, same as Fig. 5, except for the 99th percentile (P99) values of the gridded hourly precipitation.
3.3 Relationships with CENS and SCS-CT
As discussed in the previous section, we have objectively identified EMP events over the northern coast of West Java from satellite data using harmonic analysis. We have also found that EMP is strongly associated with propagating precipitation systems that, in some cases, show connection between land-based and oceanic convections. While we have insufficient data to analyse the propagating precipitation systems in more detail, synoptic conditions favourable for their occurrence may be investigated from global reanalysis data. We also mentioned earlier that such favourable conditions may develop under the influence of CENS, or SCS-CT, or the combination of both.
We analysed the frequency of occurrence of CENS and SCS-CT events corresponding to each classification of diurnal precipitation patterns of AEP, EMP, and LMP. Figure 7a shows the frequencies of occurrence of CENS, SCS-CT, and combined events, which are calculated relative to the number of samples in each diurnal precipitation, namely, 205 for AEP, 50 for EMP, and 118 for LMP. It should be noted that the frequencies do not sum up to 100 % because some samples are considered unclassified if they are not associated with either CENS or SCS-CT, and there are also an overlapping number of samples between CENS and SCS-CT events. Bearing in mind that we focus this analysis on data of January and February, it can be seen from Fig. 7 that SCS-CT generally prevails, with a frequency of occurrence above 50 % in all classified events. However, SCS-CT exhibits stronger association with morning precipitation events, with a frequency of occurrence above 70 % in both the EMP and LMP categories. This seems to indicate the possible influence of SCS-CT that may induce landward shifting of the precipitation system over the Java Sea (Koseki et al., 2012).
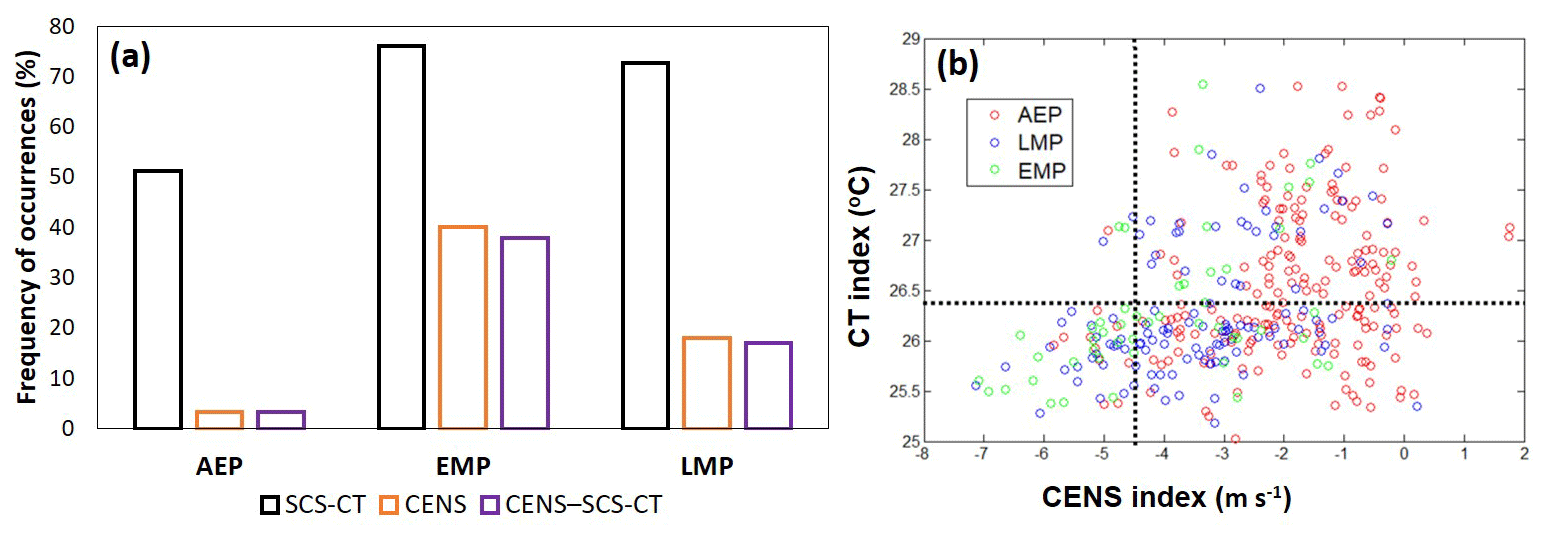
Figure 7(a) Frequency of occurrence of SCS-CT (black), CENS (orange), and CENS-SCS-CT (purple) corresponding to the three diurnal phases of peak precipitation AEP, EMP, and LMP; (b) scatter plot between SCS-CT and CENS indices for AEP, LMP, and EMP as indicated by red, blue, and green circles, respectively. Threshold values for SCS-CT (26.4 ∘C) and CENS (−45 m s−1) indices are indicated by black dotted lines.
On the other hand, the frequency of occurrence of CENS is the highest for samples belonging to EMP and almost negligible for the AEP category. It should be noted that the number of CENS events are almost the same for both EMP and LMP categories and, although we uniquely classify the timing of diurnal precipitation using harmonic analysis, some of the events may be interrelated due to subsequent processes from the previous day or on the following day. As is evidenced in Fig. 7a and depicted more clearly in Fig. 7b, most CENS events are in coincidence with SCS-CT, and their magnitudes are positively correlated.
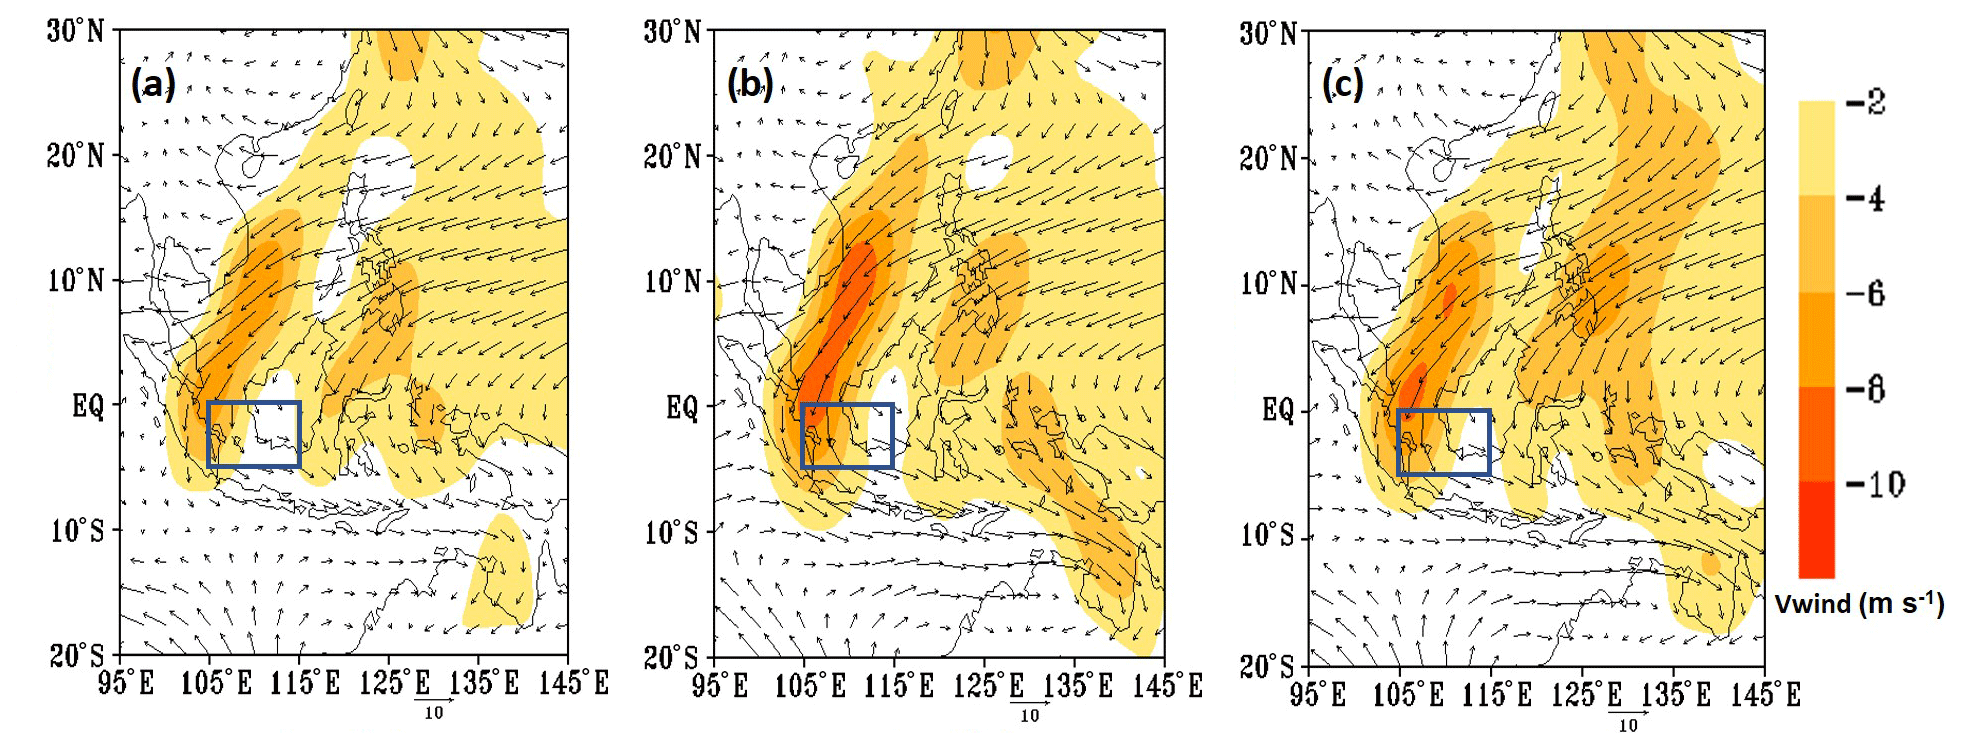
Figure 8Spatial distribution of mean (composite) 850 hPa horizontal wind vectors and magnitude of meridional wind (shaded) corresponding to the three diurnal phases of peak precipitation (a) AEP, (b) EMP, and (c) LMP. The dark-blue solid rectangle represents the CENS index area (following Hattori et al., 2011).
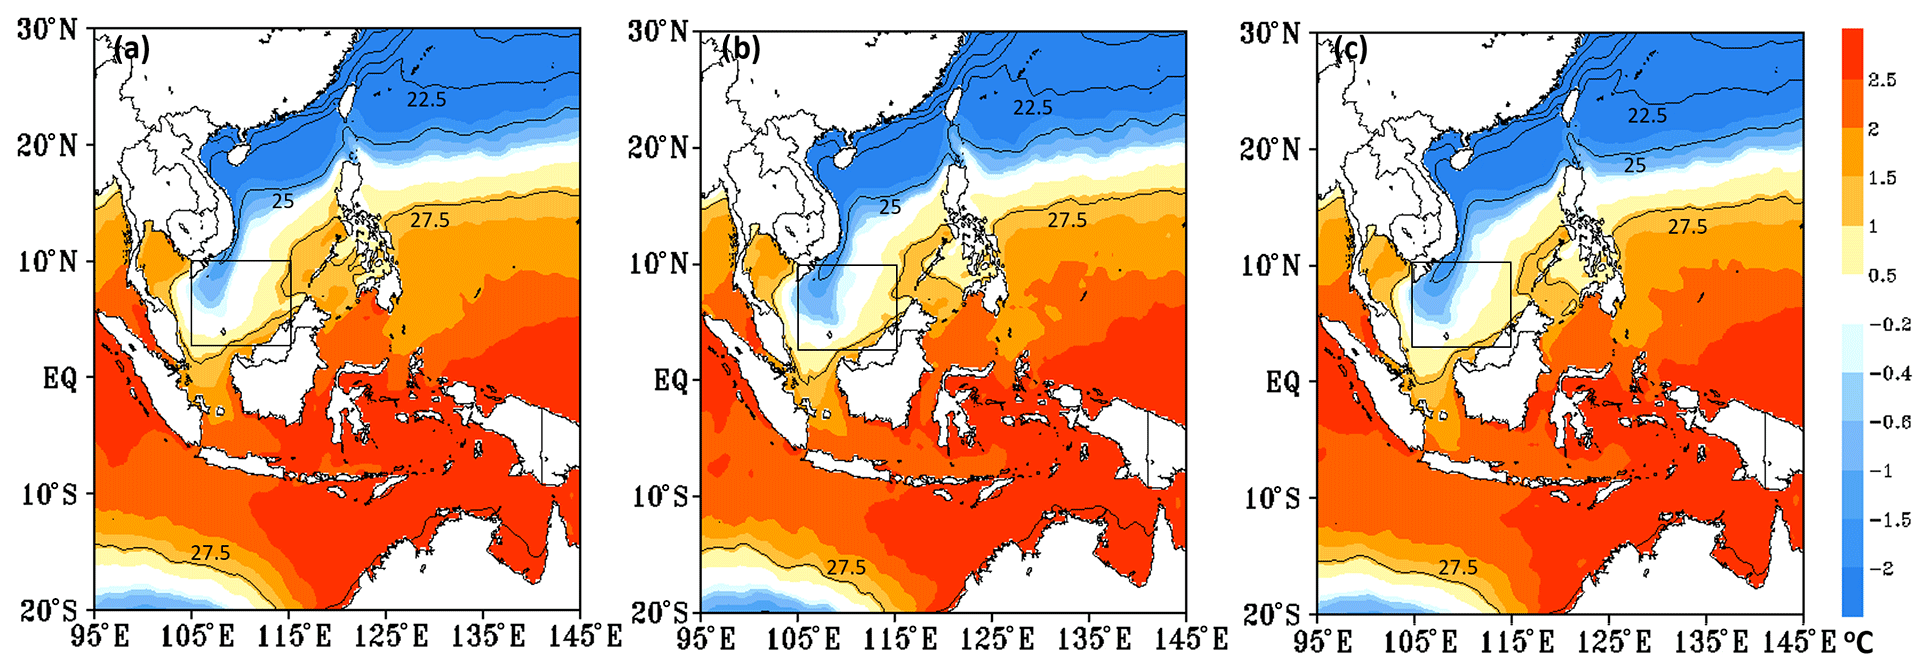
Figure 9Same as Fig. 8 but for SST (solid line contour) and SST anomaly relative to the SCS-CT threshold of 26.4 ∘C (shaded). The dark-blue solid rectangle represents the SCS-CT index area (following Koseki et al., 2012).
The composite maps of 850 hPa meridional wind fields (also wind vectors) and SST, corresponding to SCS-CT and CENS that are classified according to the phase of precipitation, are shown in Figs. 8 and 9, respectively. In Fig. 9b and c, contours of the negative SST anomalies (after being subtracted by the threshold value of 26.4 ∘C) protrude relatively more closely towards the Equator, which indicates the strengthening of the SCS-CT when associated with morning precipitations over the northern coast of West Java. Although differences in the SST fields for EMP and LMP events are not quite discernible, the composite maps of wind fields in Fig. 8 show significantly different patterns. The enhancement of CENS associated with EMP events (Fig. 8b) is connected to an elongated channelling of strong northerly wind anomalies offshore from the peninsula of Indochina, Malaysia, and down to the Karimata Strait; the northerly winds are even observed to cross Java. On the other hand, LMP events (Fig. 8c) are characterized by an enhancement of the northerly winds at a larger spatial scale and stronger connection with extratropical regions but weaker magnitudes over the Java Sea compared to that of the EMP case. The enhancement of SST anomalies that are associated with combined EMP and CENS plus SCS-CT, in comparison to EMP and SCS-CT only, events can be more clearly seen in Fig. 10.
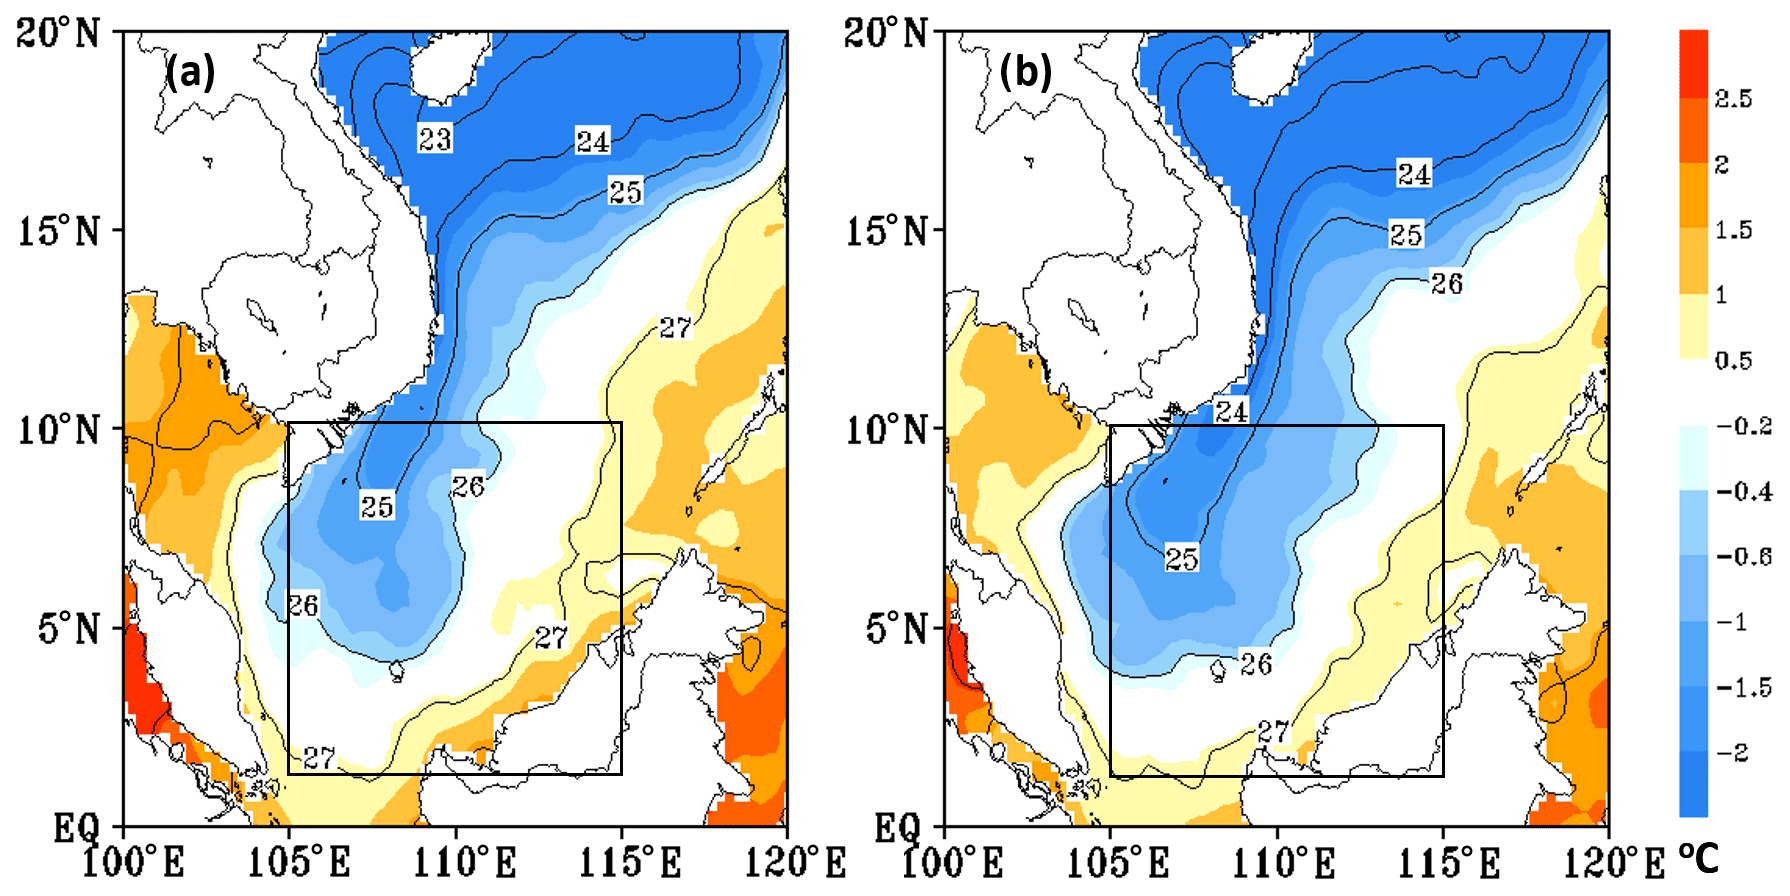
Figure 10Same as Fig. 9 but with a smaller domain and for a composite of EMP samples: (a) SCS-CT without CENS, (b) SCS-CT with CENS.
So far, our results indicate and confirm previous works (Wu et al., 2007; Hattori et al., 2011; Mori et al., 2018) that CENS is an important factor for the occurrence of EMP events over the northern coast of West Java, and cooler SST in the South China Sea seems to provide a favourable background condition. In addition, we found that the enhancement of northerly winds during the EMP events may have more localized origin over the South China Sea. The coincidence of SCS-CT and CENS events brings forward the aspect of mesoscale sea–air interaction with all its possible feedbacks, which is quite interesting because the cold surge that reaches the tropics is traditionally viewed as the effects of midlatitude weather during boreal winter (e.g. Chang et al., 2005), but more works are needed to make further analysis.
In the present work, we have studied the diurnal cycles of precipitation over the northern coast of West Java, with emphasis on the occurrences of early morning precipitation peaks, mainly using the TMPA-RT dataset spanning from 2000 to 2016. The diurnal composites of precipitation averaged over the study area for the months of November to March are dominantly characterized by precipitation peaks that occur in the afternoon to evening time (15:00–21:00 LT). However, diurnal precipitation patterns in January and February show secondary precipitation peaks in the night to morning time (01:00–07:00 LT). Results of Hovmöller analysis revealed that, beside the canonical pattern of afternoon (morning) convections over land (sea), there are weak signals of land-to-ocean propagation during the night-to-morning transition time. This study was further motivated by this propagating characteristic of precipitation over coastal regions in the MC that have been suggested by previous studies (Mori et al., 2004; Kikuchi and Wang, 2008; Li et al., 2017).
We then applied the harmonic analysis method to objectively determine the phase of precipitation peaks over the northern coast of West Java, focusing on data of January and February, whereby the timing of precipitation for each day has been classified into three categories: (1) afternoon-to-evening precipitation (AEP) that occurs between 13:00 and 24:00 LT, (2) early morning precipitation (EMP) that occurs between 01:00 and 04:00 LT, and (3) late morning precipitation (LMP) that occurs between 05:00 and 12:00 LT. The EMP contributes 18.9 % of the total samples analysed, which is a minority compared to that of the LMP (26.1 %) and AEP (55 %). However, we found that the EMP events are characterized by (1) seaward as well as landward propagation with indication of stronger connectivity between land-based and oceanic precipitation systems, (2) flat phase distribution, and (3) high mean amplitudes peaking around 04:00 LT. These propagating characteristics of EMP are more prominent when data are composited by taking the 99th percentile (P99), which signifies the importance of EMP in association with extreme precipitation events. The flat phase distribution of EMP events suggests that the timing of coastal precipitation is not necessarily locked to the phase of land–sea breezes, thus allowing precipitation to occur more randomly. This implies that, even for as short as 24 h lead time, probabilistic forecast may be necessary to assess the hazard of heavy precipitation in this region.
Following the lead of previous studies, we investigated the role of SCS-CT and CENS as influencing factors for the occurrences of the EMP event. By calculating the frequencies of occurrence of SCS-CT and CENS that correspond to the three timings of the coastal precipitation, we find that SCS-CT generally prevails in January and February, but morning precipitation events over the northern coast of West Java mainly occurred in coincidence with enhanced SST cooling in the South China Sea, which is in agreement with the numerical modelling results of Koseki et al. (2012). We also found that CENS is the most important factor that influences the occurrence of EMP and its association with extreme precipitation events over the northern coast of West Java, which is consistent with results from previous studies (Wu et al., 2007; Hattori et al., 2011; Mori et al., 2018). Most of the CENS events identified in this study occurred in coincidence with SCS-CT and both indices exhibit positive correlation when associated with EMP. In this case, the enhancement of CENS and SCS-CT is connected to an elongated channelling of strong northerly wind anomalies just offshore of Indochina, Malay Peninsula, and even observed to cross Java.
In the present study, we are aware of the issues concerning the TMPA-RT dataset in representing diurnal precipitation in the MC, but we have presented results that are consistent with previous studies and produced some new documentations about the propagating precipitation systems over the coastal region. Similar studies or an extension to this study will draw more benefit from better satellite rainfall products. We have not yet investigated the mechanisms responsible for the propagation of the coastal precipitation, but direct sea–land breeze effects do not seem to give satisfactory explanation. Moreover, it can be roughly estimated from Figs. 5a and 6a that the speed of the offshore-propagating precipitation systems is around 7 m s−1. Ruppert and Zhang (2019) pointed out that coupling between a slow gravity wave mode, with a phase speed of about 7 m s−1, and offshore-propagating convections in the MC has not been well understood. Alternatively, the role of a cold pool (e.g. Teo et al., 2011; Trismidianto et al., 2016) may serve as a concrete and testable hypothesis to be the manifestation of the so-called self-replicating mechanism proposed by Mori et al. (2004). We additionally found that the CENS associated with EMP may have a more localized origin and seems to involve mesoscale air–sea interactions over the South China Sea, which is also of interest to address in our future study.
The datasets of NCEP/NCAR, OISST AVHRR, and TMPA-RT generated during and/or analysed in the current study are publicly available in the direct links https://www.esrl.noaa.gov/psd/data/gridded/data.ncep.reanalysis.pressure.html (Kalnay et al., 1996), https://www.ncei.noaa.gov/thredds/catalog/OisstBase/NetCDF/AVHRR/catalog.html (Reynolds et al., 2007; Banzon et al., 2016), and https://disc.gsfc.nasa.gov/datasets/TRMM_3B41RT_7/summary (https://doi.org/10.5067/TRMM/TMPA/3H-E-IR/7, Huffman et al., 2007; Huffman, 2012), respectively.
Author EY drafted the initial manuscript and conducted the main data processing, including the composite and statistical analyses. Author TWH revised the initial manuscript with substantial corrections in the story line and improved discussions and the overall content of the manuscript. Author NSN performed further revision to the manuscript with detailed compositions and provided additional analysis related to oceanographic aspects. Author MRS conducted harmonic analysis and contributed in the production of related figures. All the authors were involved in discussions during the review process and read and approved the final manuscript.
The authors declare that they have no conflict of interest.
The co-authors were partially supported by ITB-P3MI Research Grants 2017–2019. The authors would also like to express their appreciation to Shigeo Yoden of Kyoto University and other research team members under the JSPS and DG-RSTHE Joint Research Program for FY 2018–20 for their useful discussions and suggestions. The authors are very grateful to Marc Salzman, topical editor of Annales Geophysicae, and two anonymous reviewers for their constructive comments and suggestions, which substantially improved the clarity of this work.
This research has been supported by the Indonesia Endowment Fund for Education (LPDP) (grant no. 20151021024633).
This paper was edited by Marc Salzmann and reviewed by two anonymous referees.
Araki, R., Yamanaka, M. D., Murata, F., Hashiguchi, H., Oku, Y., Sribimawati, T., Kudsy, M., and Renggono, F.: Seasonal and interannual variations of diurnal cycles of wind and cloud activity observed at Serpong, West Java, Indonesia, J. Meteorol. Soc. Jpn., 84, 171–194, 2006.
Banzon, V., Smith, T. M., Chin, T. M., Liu, C., and Hankins, W.: A long-term record of blended satellite and in situ sea-surface temperature for climate monitoring, modeling and environmental studies, Earth Syst. Sci. Data, 8, 165–176, https://doi.org/10.5194/essd-8-165-2016, 2016 (data are available at: https://www.ncei.noaa.gov/thredds/catalog/OisstBase/NetCDF/AVHRR/catalog.html, last access: 11 February 2020).
Biasutti, M., Yuter, S. E., Burleyson, C. D., and Sobel, A. H.: Very high-resolution rainfall patterns measured by TRMM precipitation radar seasonal and diurnal cycles, Clim. Dynam., 39, 239–258, 2012.
Chang, C. P., Harr, P. A., and Chen, H.-J.: Synoptic disturbances over the equatorial South China Sea and western Maritime Continent during boreal winter, Mon. Weather Rev., 133, 489–503, 2005.
El Kenawy, A. M., Lopez-Moreno, J. I., McCabe, M. F., and Vincente-Serrano, S. M.: Evaluation of the TMPA-3B42 precipitation product using a high density rain gauge network over complex terrain in northeastern Iberia, Global Planet. Change, 133, 188–200, 2015.
Hadi, T. W., Tsuda, T., Hashiguchi, H., and Fukao, S.: Tropical sea-breeze circulation with L-band, J. Meteorol. Soc. Jpn., 78, 123–140, 2000.
Hadi, T. W., Horinouchi, T., Tsuda, T., Hashiguchi, H., and Fukao, S.: Sea-breeze circulation over Jakarta, Indonesia A climatology based on boundary layer radar observation, Mon. Weather Rev., 130, 2153–2166, 2002.
Harris, A., Rahman, S., Hossain, F., Yarborough, L., Bagtzoglou, A. C., and Easson, G.: Satellite-based flood modelling using TRMM-based rainfall products, Sensors, 7, 3416–3427, 2007.
Hattori, M., Mori, S., and Matsumoto, J.: The cross-equatorial northerly surge over the Maritime Continent and relationship to precipitation patterns, J. Meteorol. Soc. Jpn., 89, 27–47, 2011.
Houze, R. A., Geotis, S. G., Marks, F. D., and West, A. K.: Winter monsoon convection in the vicinity of North Borneo. Part I structure and time variation of the clouds and precipitation, Mon. Weather Rev., 109, 1595–1614, 1981.
Huffman, G.: TRMM (TMPA-RT) Near Real-Time IR precipitation estimate L3 1-hour 0.25 degree × 0.25 degree V7, Greenbelt, MD, Goddard Earth Sciences Data and Information Services Center (GES DISC), https://doi.org/10.5067/TRMM/TMPA/3H-E-IR/7, 2012.
Huffman, G. J., Adler, R. F., Curtis, S., Bolvin, D. T., Gu, G., Nelkin, E. J., Bowman, K. P., Hong, Y., Stocker, E. F., and Wolf, D. B.: The TRMM Multi-Satellite Precipitation Analysis (TMPA): Quasi-global, multiyear, combined sensor precipitation estimates at fine scales, J. Hydrometeorol., 8, 38–55, https://doi.org/10.1175/JHM560.1, 2007 (data available at: https://disc.gsfc.nasa.gov/datasets/TRMM_3B41RT_7/summary, last access: 11 February 2020).
Im, E.-S. and Eltahir, E. A. B.: Simulation of the diurnal variation of rainfall over the Western Maritime Continent using a regional climate model, Clim. Dynam., 51, 73–88, https://doi.org/10.1007/s00382-017-3907-3, 2017.
Kalnay, E., Kanamitsu, M., Kistler, R., Collins, W., Deaven, D., Gandin, L., Iredell, M., Saha, S., White, G., Woollen, J., Zhu, Y., Chelliah, M., Ebisuzaki, W., Higgins, W., Janowiak, J., Mo, K. C., Ropelewski, C., Wang, J., Leetmaa, A., Reynolds, R., Jenne, R., and Joseph, D.: The NCEP/NCAR 40-year reanalysis project, B. Am. Meteorol. Soc., 77, 437–470, https://doi.org/10.1175/1520-0477(1996)077<0437:TNYRP>2.0.CO;2, 1996 (data available at: https://www.esrl.noaa.gov/psd/data/gridded/data.ncep.reanalysis.pressure.html, last access: 11 February 2020).
Kikuchi, K. and Wang, B.: Diurnal precipitation regimes in the global tropics, J. Climate, 21, 2680–2696, 2008.
Koseki, S., Koh, T.-Y., and Teo, C.-K.: Effects of the cold tongue in the South China Sea on the monsoon, diurnal cycle and rainfall in the Maritime Continent, Q. J. Roy. Meteor. Soc., 139, 1566–1582, https://doi.org/10.1002/qj.2052, 2012.
Li, Y., Jourdain, N. C., Taschetto, A. S., Gupta, A. S., Argüeso, D., Masson, S., and Cai, W.: Resolution dependence of the simulated precipitation and diurnal cycle over the Maritime Continent, Clim. Dynam., 48, 4009–4028, https://doi.org/10.1007/s00382-016-3317-y, 2017.
Liu, C., Moncrieff, M. W., and Tuttle, J. D.: A note propagating rainfall episodes over the Bay of Bengal, Q. J. Roy. Meteor. Soc., 134, 787–792, 2008.
Love, B. S., Matthews, A. J., and Lister, G. M. S.: The diurnal cycle of precipitation over Maritime Continent in a high-resolution atmospheric model, Q. J. Roy. Meteor. Soc., 137, 934–947, 2011.
Mapes, B. E., Warner, T. T., and Xu, M.: Diurnal patterns of rainfall in northwestern South America. Part III diurnal gravity waves and nocturnal convection offshore, Mon. Weather Rev., 131, 830–844, 2003.
Mori, S., Hamada, J.-I., Tauhid, Y. I., and Yamanaka, M. D.: Diurnal land-sea rainfall peak migration over Sumatera Island, Indonesia Maritime Continent, observed by TRMM satellite and intensive rawinsonde soundings, Mon. Weather Rev., 132, 2021–2039, 2004.
Mori, S., Hamada, J.-I., Hattori, M., Wu, P.-M., Katsumata, M., Endo, N., Ichiyanagi, K., Hashiguchi, H., Arbain, A. A., Sulistyowati, R., Sopia, L., Syamsudin, F., Manik, T., and Yamanaka, M. D.: Meridional march of diurnal rainfall over Jakarta, Indonesia, observed with a C-band Doppler radar an overview of the HARIMAU2010 campaign, Progress in Earth and Planetary Science, 5, 1–23, 2018.
Nitta, T. and Sekine, S.: Diurnal variation of convective activity over the tropical Western Pacific, J. Meteorol. Soc. Jpn., 72, 627–641, 1994.
Nuryanto, D. E., Pawitan, H., Hidayat, R., and Aldrian, E.: Characteristics of two Mesoscale Convective Systems (MCSs) over the greater Jakarta case of heavy rainfall period 15–18 January 2013, Geosci. Lett., 6, 1–15, 2019.
Qian, J. H.: Why precipitation is mostly concentrated over islands in the Maritime Continent, J. Atmos. Sci., 65, 1428–1441, 2008.
Qian, J. H., Robertson, A. W., and Moron, V.: Interactions among ENSO, the monsoon, and diurnal cycle in rainfall variability over Java, Indonesia, J. Atmos Sci., 67, 3509–3524, 2010.
Renggono, F., Hashiguchi, H., Fukao, S., Yamanaka, M. D., Ogino, S.-Y., Okamoto, N., Murata, F., Sitorus, B. P., Kudsy, M., Kartasasmita, M., and Ibrahim, G.: Precipitating clouds observed by 1.3-GHz boundary layer radars in equatorial Indonesia, Ann. Geophys., 19, 889–897, https://doi.org/10.5194/angeo-19-889-2001, 2001.
Reynolds, R. W., Smith, T. M., Liu, C., Chelton, D. B., Casey, K. S., and Schlax, M. G.: Daily high-resolution-blended analyses for sea surface temperature, J. Climate, 20, 5473–5496, https://doi.org/10.1175/JCLI-D-14-00293.1, 2007.
Ruppert, J. H. and Zhang, F.: Diurnal forcing and phase locking of gravity waves in the Maritime Continent, J. Atmos. Sci., 76, 2815–2835, 2019.
Sulistyowati, R., Hapsari, R. I., Syamsudin, F., Mori, S., Oishi, S. T., and Yamanaka, M. D.: Rainfall-driven diurnal variations of water level in the Ciliwung River, West Java, Indonesia, SOLA, 10, 141–144, 2014.
Teo, C.-K., Koh, T.-Y., Lo, J. C.-F., and Bhatt, B. C.: Principal component analysis of observed and modeled diurnal rainfall in the Maritime Continent, Int. J. Climatol., 24, 4662–4675, 2011.
Trilaksono, N. J., Otsuka, S., Yoden, S., Saito, K., and Hayashi, S.: Dependence of model simulated heavy rainfall on the horizontal resolution during the Jakarta flood event in January–February 2007, SOLA, 7, 193–196, 2011.
Trilaksono, N. J., Otsuka, S., and Yoden, S.: A Time-lagged ensemble simulation on the modulation of precipitation over West Java in January–February 2007, Mon. Weather Rev., 140, 601–616, 2012.
Trismidianto, Hadi, T. W., Ishida, S., Moteki, Q., Manda, A., and Iizuka, S.: Development processes of oceanic convective systems inducing the heavy rain over the Western Coast of Sumatra on 28 October 2007, SOLA, 12, 6–11, 2016.
Wu, P., Hara, M., Fudeyasu, H., Yamanaka, M. D., Matsumoto, J., Syamsudin, F., Sulistyowati, R., and Djajadiharja, Y. S.: The impact of trans-equatorial monsoon flow on the formation of repeated torrential rains over Java Island, SOLA, 3, 93–96, 2007.
Wu, P., Arbain, A. A., Mori, S., Hamada, J.-I., and Hattori, M.: The effects of an active phase of the Madden-Julian Oscillation on the extreme precipitation event over western Java Island in January 2013, SOLA, 9, 79–83, 2013.
Yamanaka, M. D.: Physical climatology of Indonesian Maritime Continent An outline to comprehend observational studies, Atmos. Res., 178–179, 231–259, 2016.
Yamanaka, M. D., Ogino, S.-Y., Wu, P.-M., Hamada, J.-I., Mori, S., Matsumoto, J., and Syamsudin, F.: Maritime Continent coastlines controlling earth's climate, Progress in Earth and Planetary Science, 5, 1–28, 2018.
Yang, G.-Y. and Slingo, J.: The diurnal cycle in the tropics, Mon. Weather Rev., 129, 784–801, 2001.
Yang, S. and Smith, E. A.: Mechanism for diurnal variability of global tropical rainfall observed from TRMM, J. Climate, 19, 5190–5226, 2006.
Yong, B., Liu, D., Gourley, J. J., Tian, Y., Huffman, G. J., Ren, L., and Hong, Y.: Global view of real-time TRMM multisatellite precipitation analysis, B. Am. Meteorol. Soc., 96, 283–296, 2015.
Zhang, Y., Sperber, K. R., and Boyle, J. S.: Climatology and interannual variation of the East Asian winter monsoon Results from the 1979–95 NCEP/NCAR reanalysis, Mon. Weather Rev., 125, 2605–2619, 1997.