the Creative Commons Attribution 4.0 License.
the Creative Commons Attribution 4.0 License.
 | 05 Feb 2020
Equatorial plasma bubbles developing around sunrise observed by an all-sky imager and global navigation satellite system network during storm time
Kun Wu
Jiyao Xu
Xinan Yue
Chao Xiong
Wenbin Wang
Wei Yuan
Chi Wang
Yajun Zhu
Ji Luo
A large number of studies have shown that equatorial plasma bubbles (EPBs) occur mainly after sunset, and they usually drift eastward. However, in this paper, an unusual EPB event was simultaneously observed by an all-sky imager and the global navigation satellite system (GNSS) network in southern China, during the recovery phase of a geomagnetic storm that happened on 6–8 November 2015. Observations from both techniques show that the EPBs appeared near dawn. Interestingly, the observational results show that the EPBs continued to develop after sunrise, and they disappeared about 1 h after sunrise. The development stage of EPBs lasted for at least about 3 h. To our knowledge, this is the first time that the evolution of EPBs developing around sunrise was observed by an all-sky imager and the GNSS network. Our observation showed that the EPBs drifted westward, which was different from the usual eastward drifts of post-sunset EPBs. The simulation from the Thermosphere–Ionosphere–Electrodynamics General Circulation Model (TIE-GCM) suggest that the westward drift of EPBs should be related to the enhanced westward winds at storm time. Besides this, bifurcation and merging processes of EPBs were observed by the all-sky imager in the event. Associated with the development of EPBs, an increase in the peak height of the ionospheric F region was also observed near sunrise, and we suggest the enhanced upward vertical plasma drift during the geomagnetic storm plays a major role in triggering the EPBs near sunrise.
- Article
(15070 KB) - Full-text XML
- BibTeX
- EndNote


After sunset, plasma density depletions, also called equatorial plasma bubbles (EPBs), sometime occur in the equatorial- and low-latitude ionosphere. A large number of studies have shown that EPBs generally start to develop shortly after sunset during geomagnetic quiet periods (e.g., Weber et al., 1980; Kelley et al., 1986; Xiong et al., 2010; Wu et al., 2018). It is generally believed that the Rayleigh–Taylor instability (RTI) is a plausible mechanism to trigger the EPBs (Kelley, 2009; Makela and Otsuka, 2012). The growth rate of RTI is influenced by a number of different factors, such as the zonal electric field, neutral wind, vertical gradient of plasma density at the bottom side of the F region, or ion-neutral collision frequency, as well as the strength of magnetic fields (Ott, 1978; Abdu, 2001; Burke et al, 2004). The pre-reversal enhancement (PRE) of the eastward electric field around sunset is a main reason for the development of EPBs (e.g., Fejer et al., 1999; Abdu, 2001; Kelley, 2009; Huang, 2018). Owning to the intensified eastward electric field, near the magnetic equator the ionosphere is rapidly elevated to higher altitudes via E×B drifts, which is favorable for the growth of RTI at the bottom side of the ionosphere.
The EPBs are thought to extend along magnetic field lines, and they can reach as high as magnetic latitudes of about ±20∘ (Kelley, 2009; Lühr et al., 2014). Xiong et al. (2016, 2018) suggest that EPBs have a typical zonal size of about 50 km, by using Swarm in situ electron density measurements as well as the ground-based airglow imager. Although the characteristics of EPBs have been widely studied, special events, especially those occurring during geomagnetic storms, are still one of the interesting issues to be fully addressed. Some of the results showed that geomagnetic storms can affect the development of EPBs (e.g., Abdu et al., 2003; Tulasi et al., 2008; Carter et al., 2016), and in some extreme cases, the EPBs can extend to middle latitudes during intense geomagnetic storms (e.g., Sahai et al., 2009; Patra et al., 2016; Katamzi-Joseph et al., 2017; Aa et al., 2018). Moreover, during storm time, EPBs near sunrise were occasionally observed by some instruments such as radar and satellite. Fukao et al. (2003) used observations from the Equatorial Atmosphere Radar to report EPBs near sunrise over the Indonesian region during a geomagnetic storm and suggested that the EPBs were likely associated with the geomagnetic storm. Huang et al. (2013) reported the observations of long-lasting daytime EPBs with the Communications/Navigation Outage Forecasting System (C/NOFS) satellite during a geomagnetic storm in which the EPBs were persistent from the post-midnight sector through the afternoon sector. Zhou et al. (2016) used observations from multiple low Earth-orbiting satellites, like the Swarm constellation, the Gravity Recovery and Climate Experiment (GRACE) satellite, and the C/NOFS satellite, to detect the EPBs around sunrise during the St. Patrick's Day storm. They suggested that the geomagnetic storm induced changes in ionospheric dynamics should be the reason for triggering the EPBs. But until now, there has been no research on the occurrence characters and evolution of EPBs around sunrise using optical remote sensing, which can provide different aspects of the EPBs near sunrise.
It is well known that the EPBs usually drift eastward as reported by many studies (e.g., Pimenta et al., 2001; Martinis et al., 2003; Park et al., 2007; Taylor et al., 2013; Wu et al., 2017). However, during storm periods westward-drifting EPBs have been also observed (Abdu et al., 2003; Basu et al., 2010; Santos et al., 2016). Abdu et al. (2003) reported some cases of EPBs that showed eastward drifts after sunset which later reversed to westward drifts. Basu et al. (2010) reported that the westward-drifting EPBs reached maximum velocities of about 80–120 m s−1. Santos et al. (2016) also showed some EPBs of zonal drifts reversal (eastward to westward) during a geomagnetic storm, and they suggested the reversal was caused by a vertical Hall electric field which was induced by a zonal prompt penetration electric field (PPEF) in the presence of enhanced conductivity in the E region during night.
From 6-year observations of airglow images located in southern China, we found only one case of EPBs starting to appear near sunrise during the storm recovery phase on 8 November 2015. The EPBs appeared before sunrise, kept developing, and vanished about 1 h after sunrise. Unlike the quiet-time eastward drifting EPBs, the EPBs drifted westward. In the rest, we provide a detailed analysis of this event. In Sect. 2, we give a general description of the instruments. Observational results are showed in Sect. 3. In Sect. 4, we provide comparisons with previous studies as well as discussions. Finally, the summary is given in Sect. 5.
2.1 All-sky imager
The airglow data used in this study are obtained from an all-sky imager, which was deployed at Qujing, China (geographic coordinates: 25∘ N, 104∘ E; geomagnetic coordinates: 15.1∘ N, 176∘ E). Its location is indicated by the red star in Fig. 1, and the blue circle represents the projected regions with a radius of ∼900 km (about 140∘ field of view – FOV) of the all-sky imager at an altitude of 250 km. The all-sky imager consists of a charge-coupled device (CCD) detector (1024×1024 pixel), an interference filter (630.0 nm), and a fish-eye lens (FOV of 180∘). The integration time of the all-sky imager is 3 min.
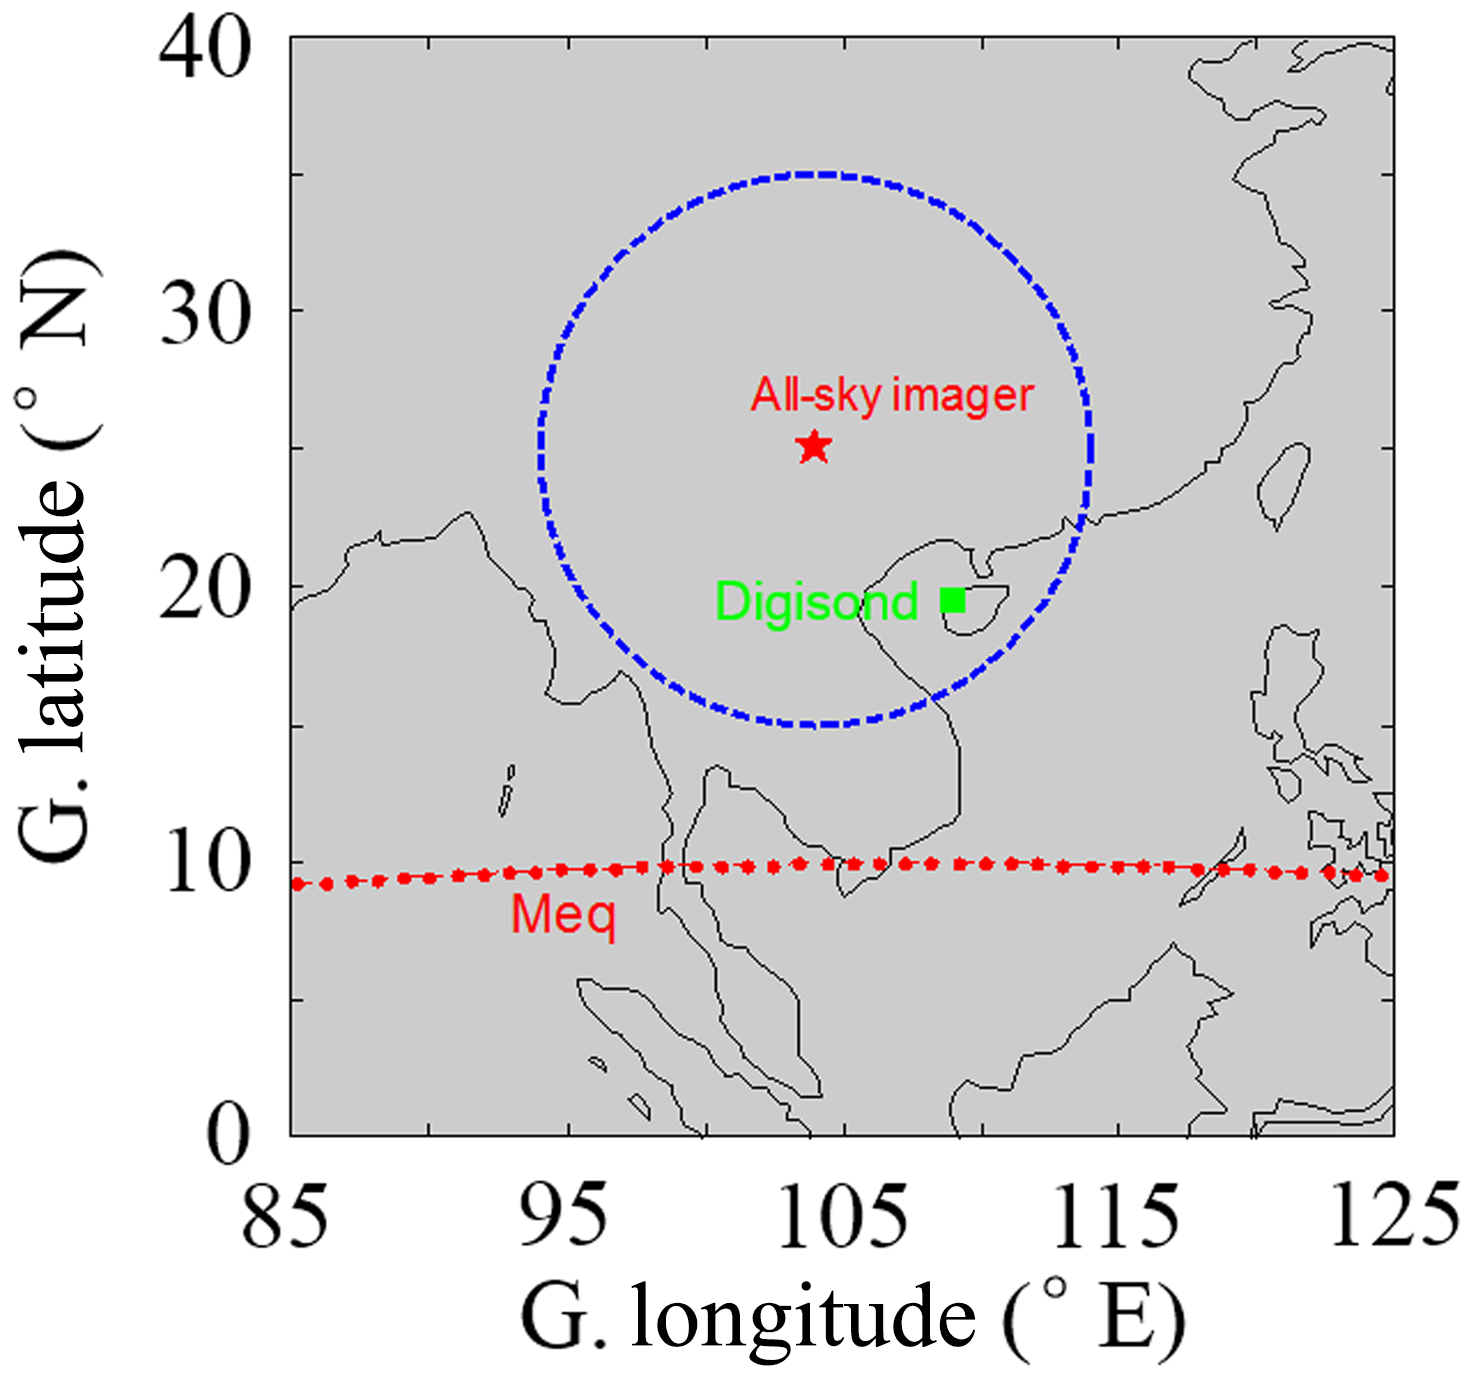
Figure 1The location of observation instruments. The red star denotes the geographic location of the all-sky imager at Qujing (25∘ N, 104∘ E). The blue circle denotes the field of view of the all-sky imager at an altitude of 250 km. The green dot denotes the geographic location of the digisonde at Fuke (19.5∘ N, 109.1∘ E). The red dotted line represents the magnetic equator (Meq).
2.2 The network of the global navigation satellite system (GNSS)
The global navigation satellite system (GNSS) data used in this study are derived from the Crustal Movement Observation Network of China (CMONOC), which consists of ∼260 ground GNSS receivers covering the mainland of China. The information of these GNSS receivers has been given in previous publications (e.g., Aa et al., 2015; Yang et al., 2016; Zheng et al., 2016). The residuals of the total electron content (TEC) were processed using a method similar to that described by Ding et al. (2014). Specifically, for each arc, the relative phase TEC was filtered using a band-pass filter. The minimum and maximum period of the band-pass filter was 2 and 12 min respectively. We then calculated the TEC residual of each arc for each pierce point, for which the height of each ionospheric pierce point was about 300 km. Therefore, the TEC residual could indicate the occurrence of plasma bubbles. An elevation cutoff angle of 30∘ is used to reduce the multi-paths effects. Besides this, to better present the structure of EPBs, the rate of TEC change index (ROTI) was also calculated. The ROTI is the standard deviation of the TEC gradient, which is rate of TEC change (ROT). Based on (TEC(t+Δt) − TEC(t)) ∕Δt, we can get the ROT. In the study, we used Δt=30 s to calculate the ROT and used 10 ROT to get 5 min ROTIs. A similar calculation of ROT and ROTI has already been reported and discussed in many previous studies (e.g., Pi et al., 1997; Otsuka et al., 2006; Buhari et al., 2014) and will not be described here.
2.3 Digisonde
The digisonde ionograms are obtained from a digisonde located at Fuke, a low-latitude station in southern China (geographic coordinates: 19.5∘ N, 109.1∘ E; geomagnetic coordinates: 9.5∘ N, 178.4∘ W), and it is marked with a green dot in Fig. 1. The virtual heights of the F layer were manually scaled by using the SAO Explorer software.
Figure 2 shows the 3 h Kp index, the interplanetary magnetic field (IMF) Bz, auroral electrojet indexes (AE, AU, and AL), the symmetric disturbance field in H (SYM-H), and virtual height (h′F) at Fuke on 6–8 November 2015. To make the comparison easier with other observations, we converted the universal time to the local time (LT) at Qujing. A geomagnetic storm occurred during those days. In Fig. 2b, IMF Bz turned southward at ∼11:40 LT on 7 November 2015, and it reached to about −11 nT at ∼16:00 LT. During the storm main phase, the SYM-H had a rapid reduction from −40 to −100 nT. Meanwhile, the Kp index reached a value of 6; the AE and AL also reached ∼1500 and nT, respectively. After 04:00 LT on 8 November 2015, IMF Bz began to turn to north. In the storm recovery phase, the value of SYM-H was back to −40 nT.

Figure 2(a) Kp indexes, (b) the interplanetary magnetic field (IMF) Bz, (c) SYM-H, and (d) AE, AU, and AL during 6–8 November 2015. (e) The variations of h′F were obtained from the digisonde at Fuke on 6–8 November 2015.
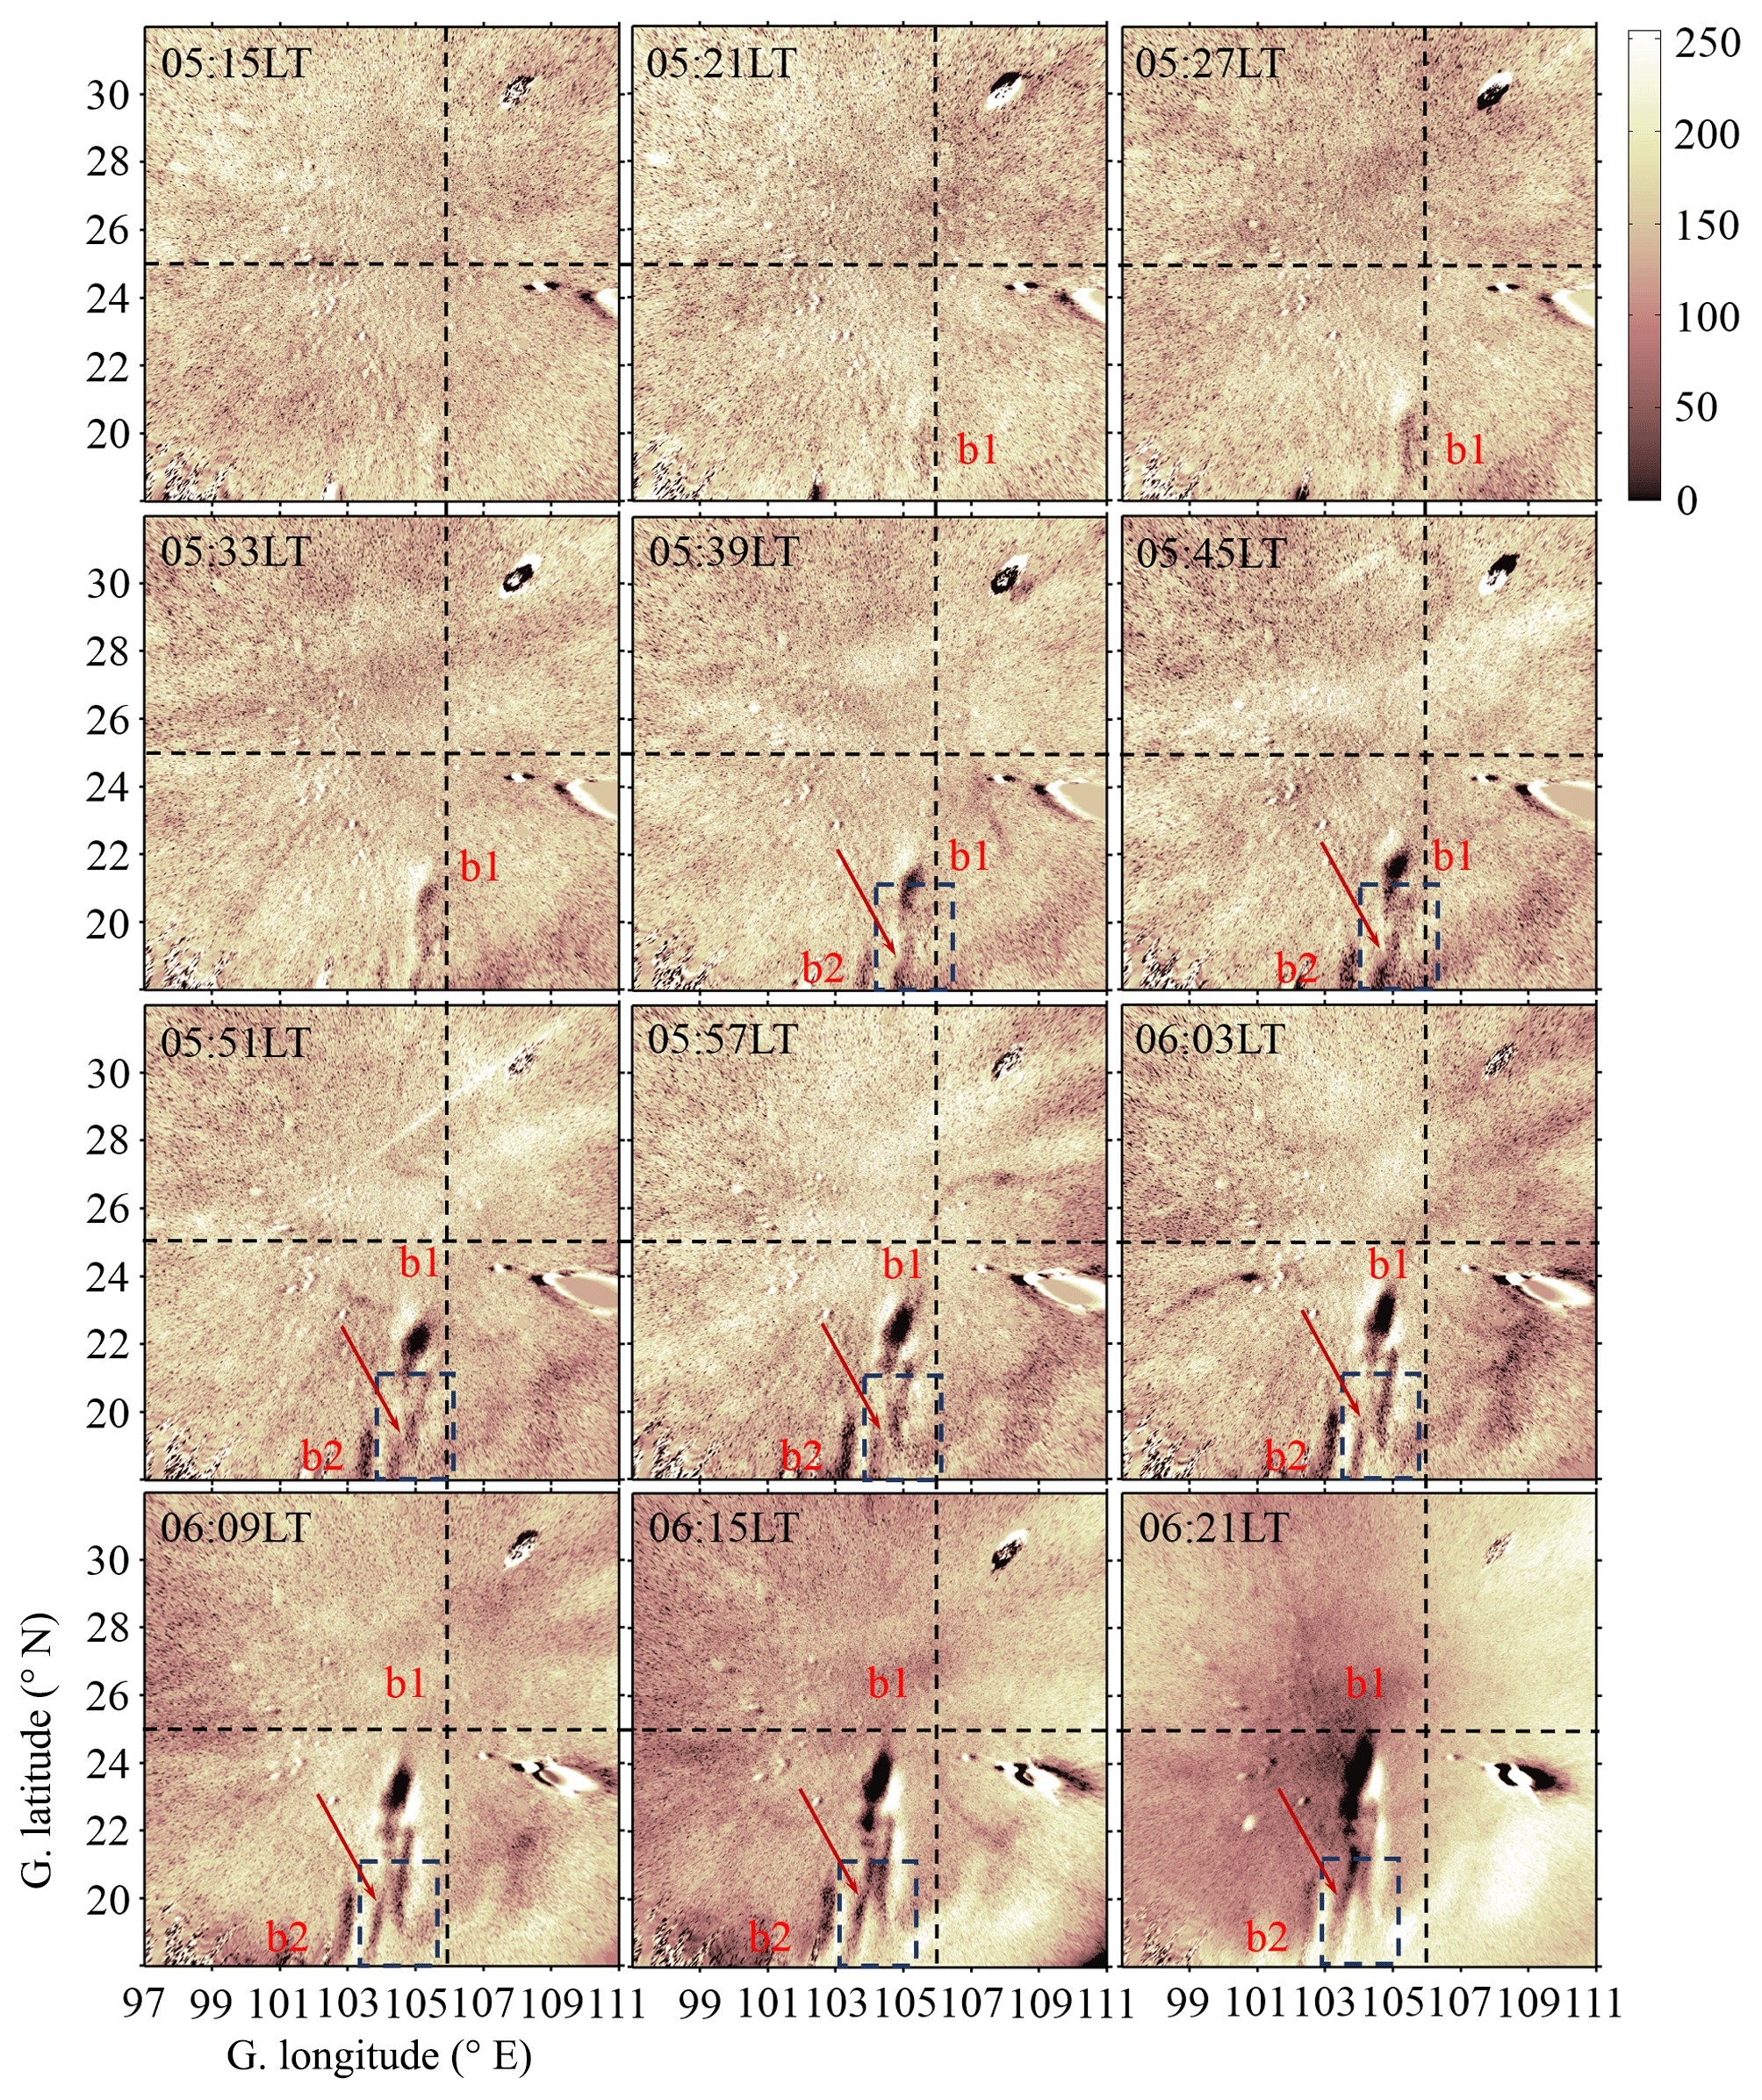
Figure 3Images of equatorial plasma bubbles from the Qujing site between 05:15 and 06:21 LT on 8 November 2015. The observed images were mapped into geographical coordinates by assuming that the airglow emission layer was at an altitude of ∼250 km. The black vertical line is a reference line of 106∘ E, and the horizontal line is a reference line of 25∘ N.
Figure 3 shows the time sequence of airglow images observed by the all-sky imager at Qujing from 05:15 to 06:21 LT on 8 November 2015. The time difference between the successive images is 6 min. For each image, we removed the effects of compression and curving of the all-sky imager lens by an unwarping process (Garcia et al., 1997). All images have been mapped into a geographic range from 97 to 111∘ E in longitude and from 18 to 32∘ N in latitude. The height of the airglow layer is assumed to be at 250 km. The top of each image is to the north, and the right is to the east. Two EPBs, marked as “b1” and “b2”, were observed by the all-sky imager during this period. They occurred during the geomagnetic storm recovery phase.
Around 05:21 LT, EPB b1 appeared in the FOV of the all-sky imager. EPB b1 was still developing, as it extended northward and reached close to 25∘ N around 06:21 LT. At 05:39 LT, the other EPB, b2, started to appear in the FOV of the airglow imager. EPB b2 was also developing and expanded to about 20∘ N at 06:21 LT. The two observed EPBs possibly continued to develop after 06:21 LT, as no hints of stopping can be seen in the last airglow image. However, there was no further image data after 06:21 LT because the all-sky imager had to be shut down after sunrise. We want to point out that the sunrise time at Qujing was around 06:15 LT at an altitude of 250 km on that day. The far north part of b1 reached about 24.5∘ N at 06:15 LT. After 6 min, the far north of b1 extended to about 25∘ N (as marked by the black horizontal line). In other words, the observational result from the all-sky imager suggested that the EPBs kept developing after sunrise.
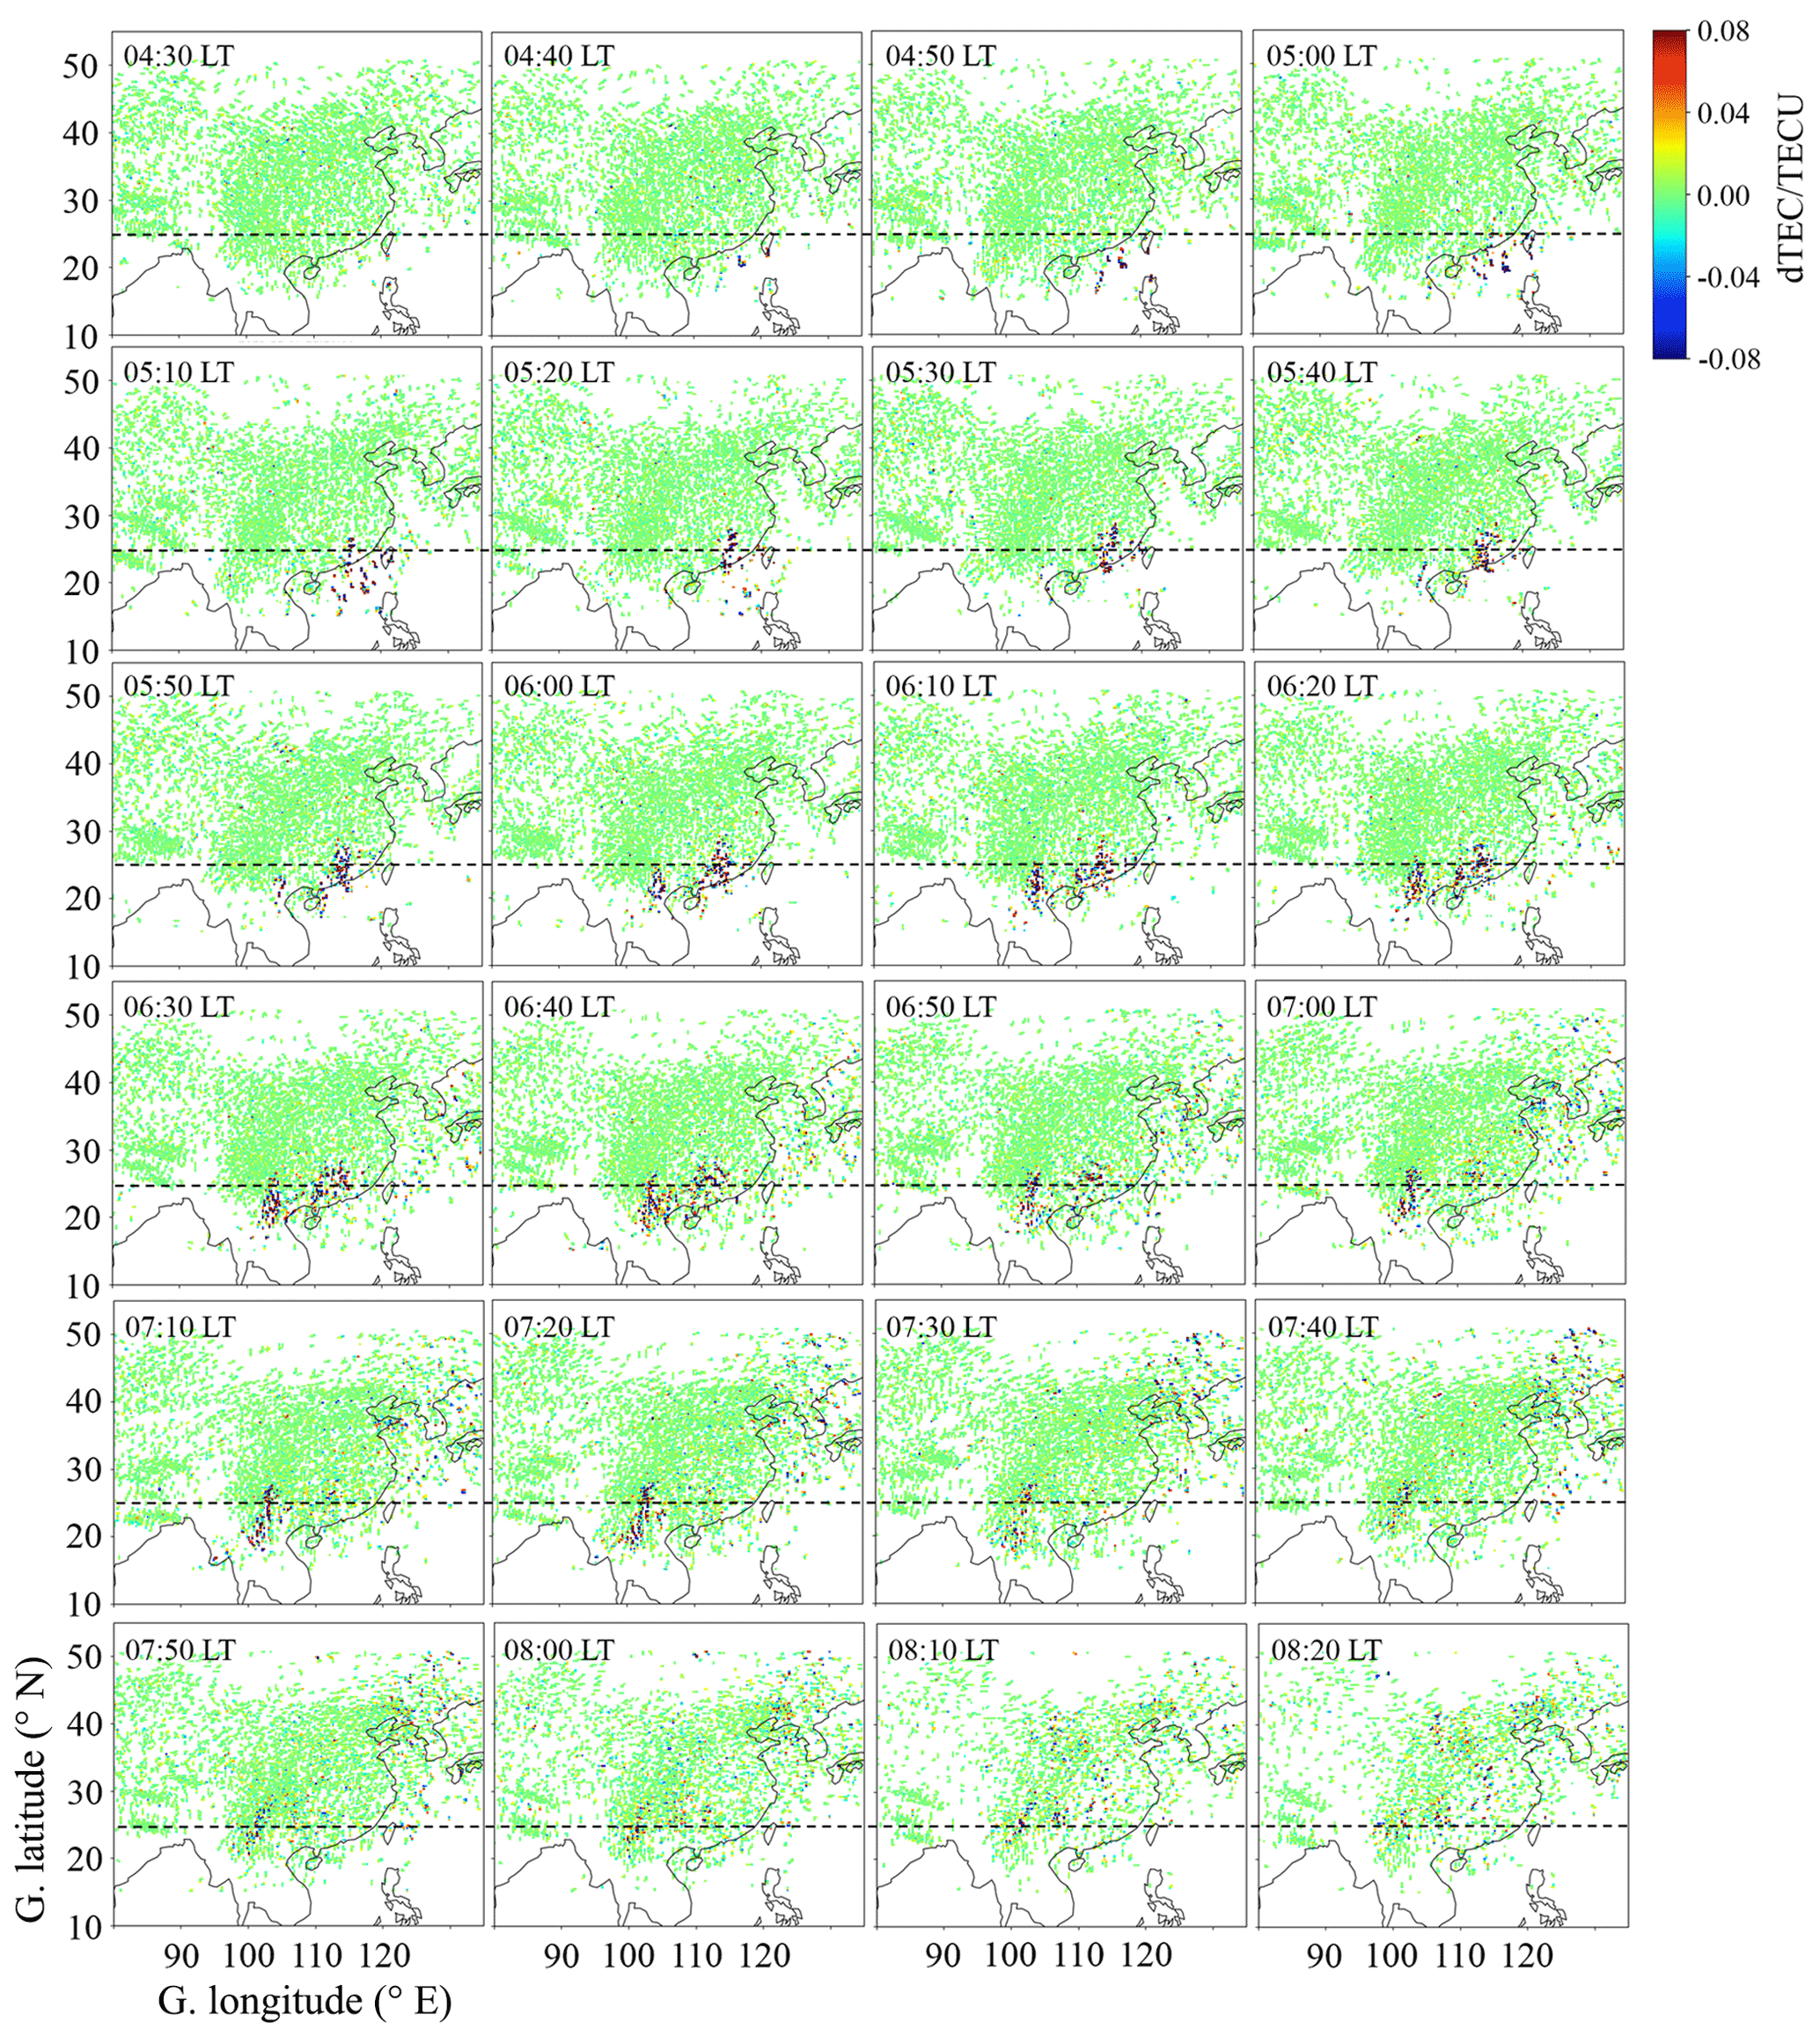
Figure 4Total electron content residuals over China and adjacent areas with 10 min interval during 04:30–08:20 LT on 8 November 2015. The black horizontal line is a reference line of 25∘ N. The dTEC/TECU represents TEC perturbation.
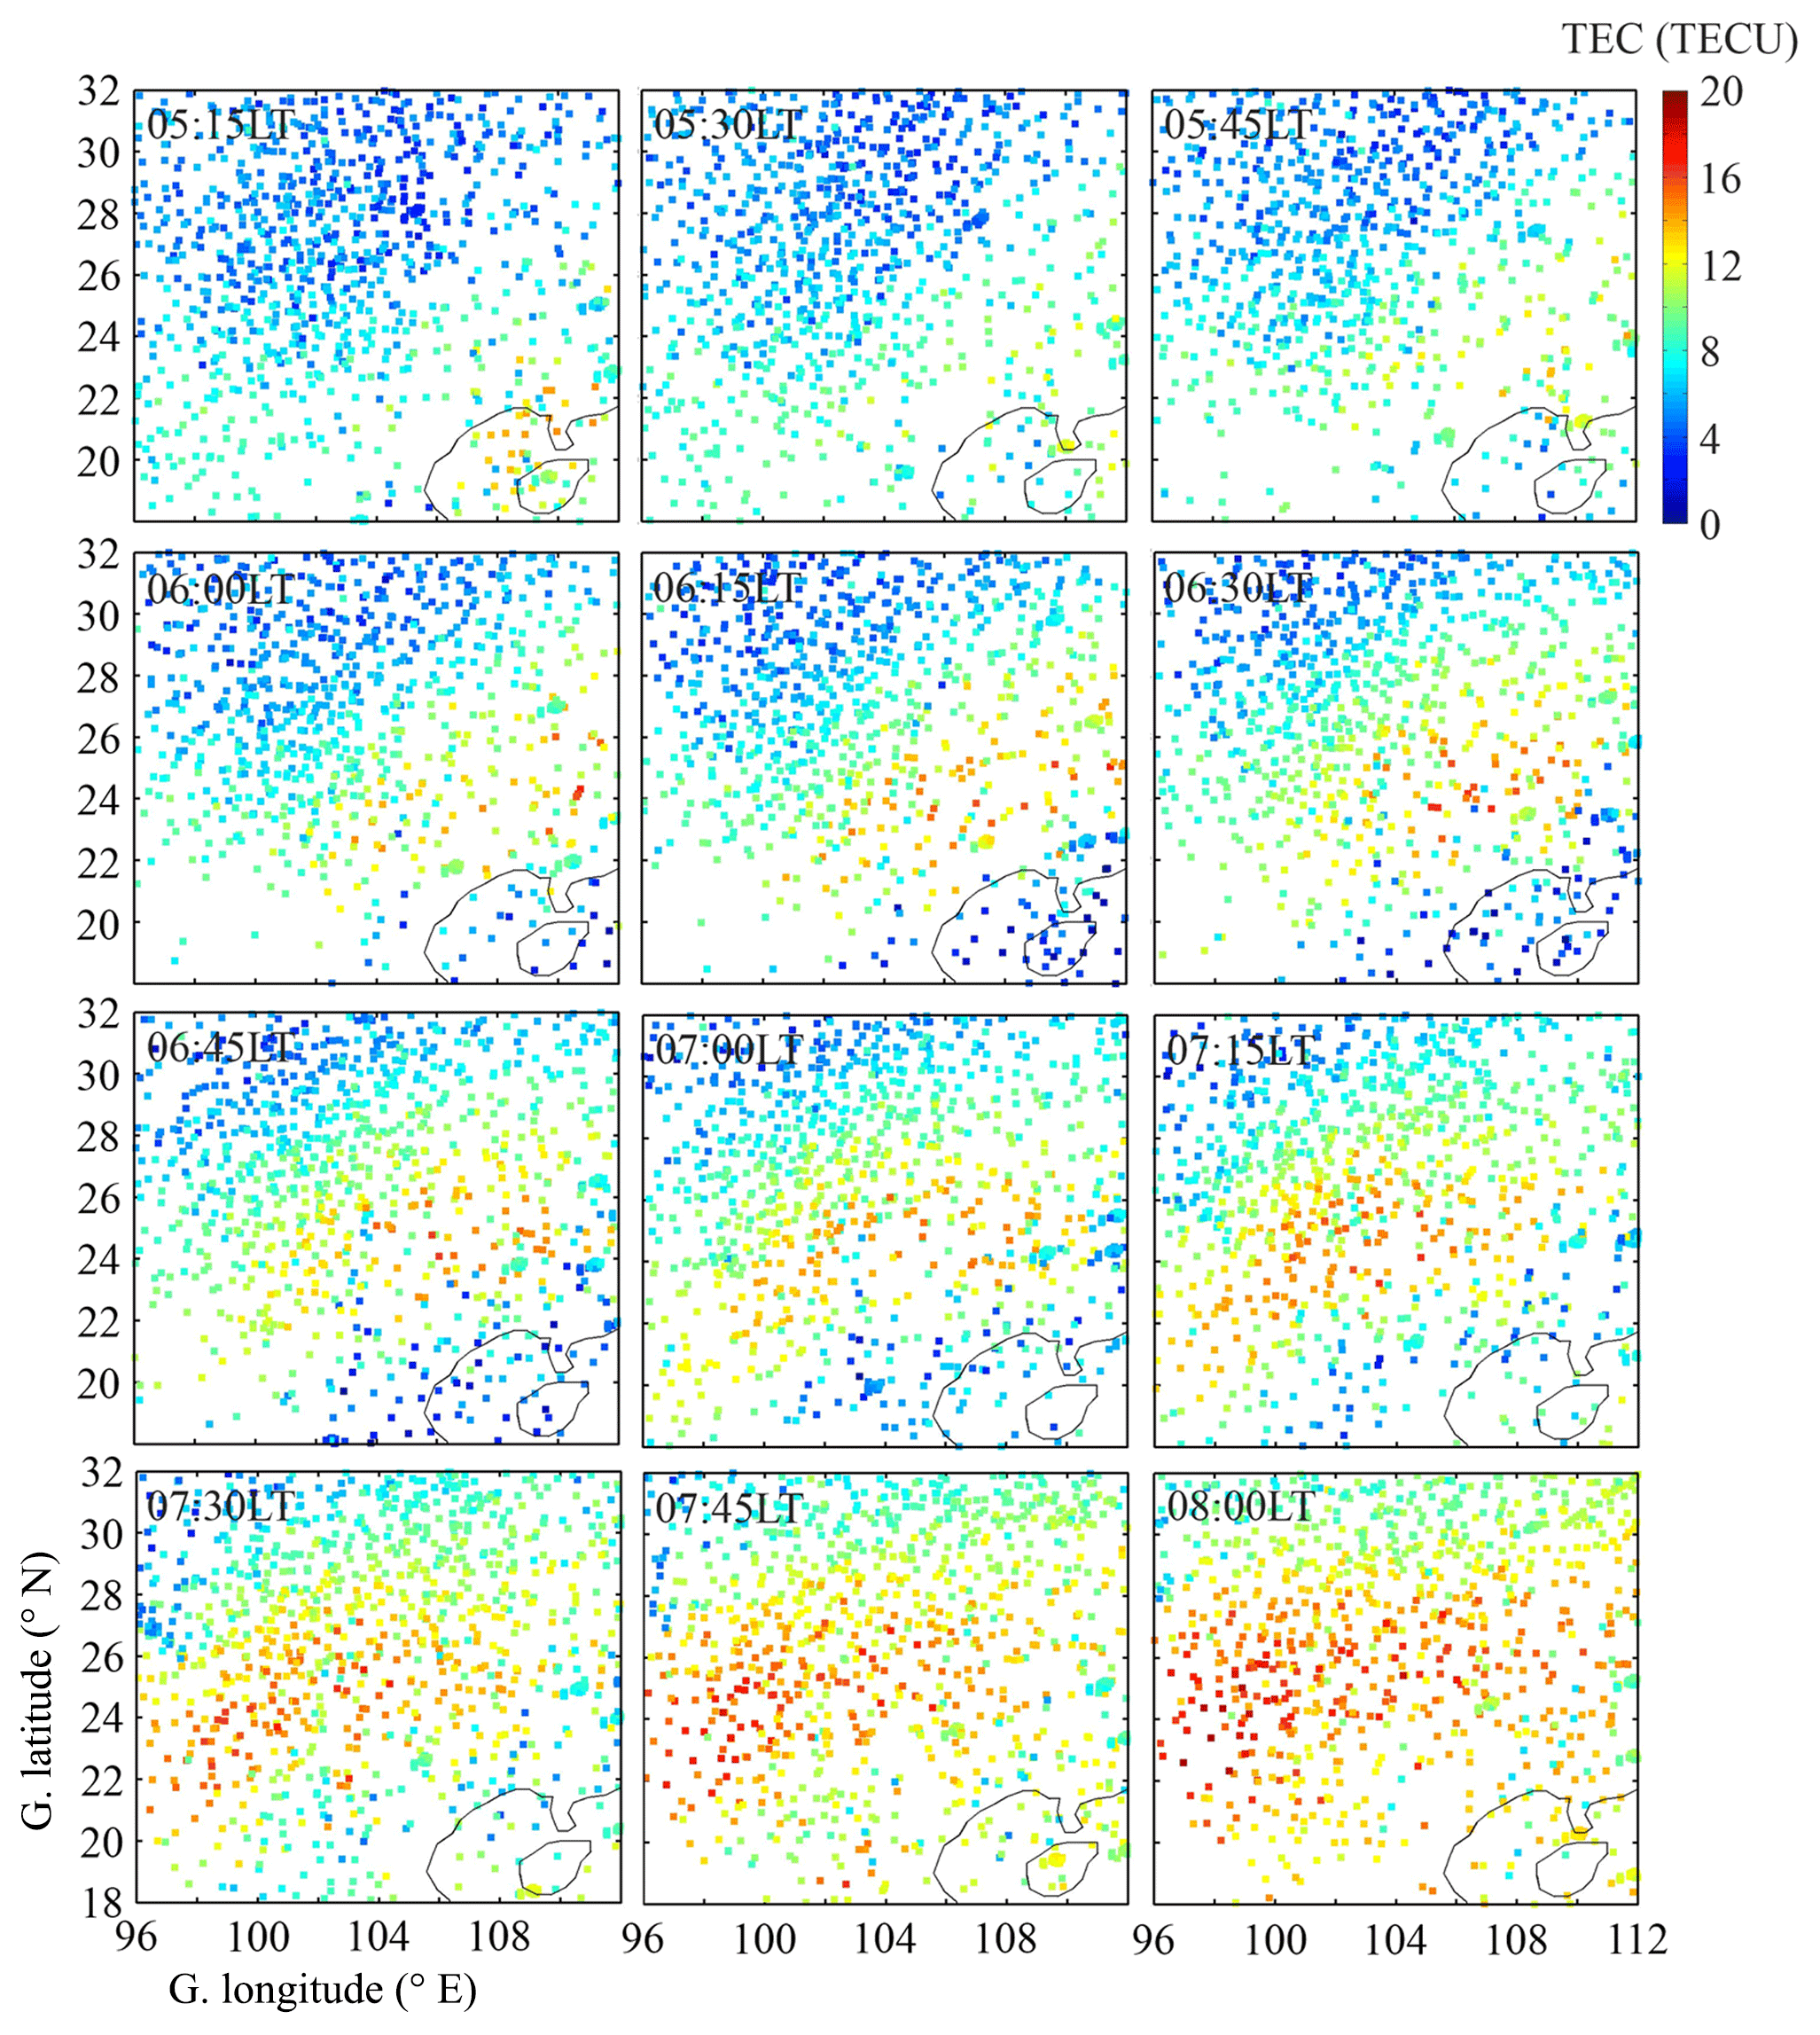
Figure 5Two-dimensional map of absolute TEC at 05:15–08:00 LT on 8 November 2015.
Some interesting features can also be seen from Fig. 3. EPB b1 appeared at ∼105∘ E, and b2 appeared at ∼104∘ E at 05:39 LT. Based on the black vertical line at 106∘ E, we can clearly see that the two EPBs drifted from east to west. Besides this, bifurcation and merging processes of EPB b1 were also observed. After 05:45 LT, a bifurcation process occurred in b1. The lower latitude portion of b1 moved further westward. An obvious cleft occurred at ∼19∘ N of b1 near 06:03 LT. More interesting is the fact that a merging process occurred in the two bifurcation portions of b1 during its later development period. After ∼06:03 LT, the upper portion of b1 began to connect to the lower portion of b1, and they merged or combined together into one EPB after 06:15 LT. The bifurcation and merging processes are more obvious in the red rectangles of Fig. 3, which is indicated by the red arrow in each image.
Figure 4 shows a series of TEC residuals over 10–50∘ N and 80–130∘ E during 04:30–08:20 LT on 8 November 2015. The adjacent imaging is in 10 min intervals. At about 04:40 LT, some TEC depletions, which occurred to the south and west of the location of the all-sky imager, appeared at ∼115∘ E (∼24∘ N) and began to develop. About 05:30 LT, some additional EPBs appeared at ∼105∘ E (∼20∘ N), and they were also developing. EPBs in the two regions kept developing until they disappeared. Owning to the FOV of the all-sky imager, the EPBs outside the ∼115∘ E region were not observed.
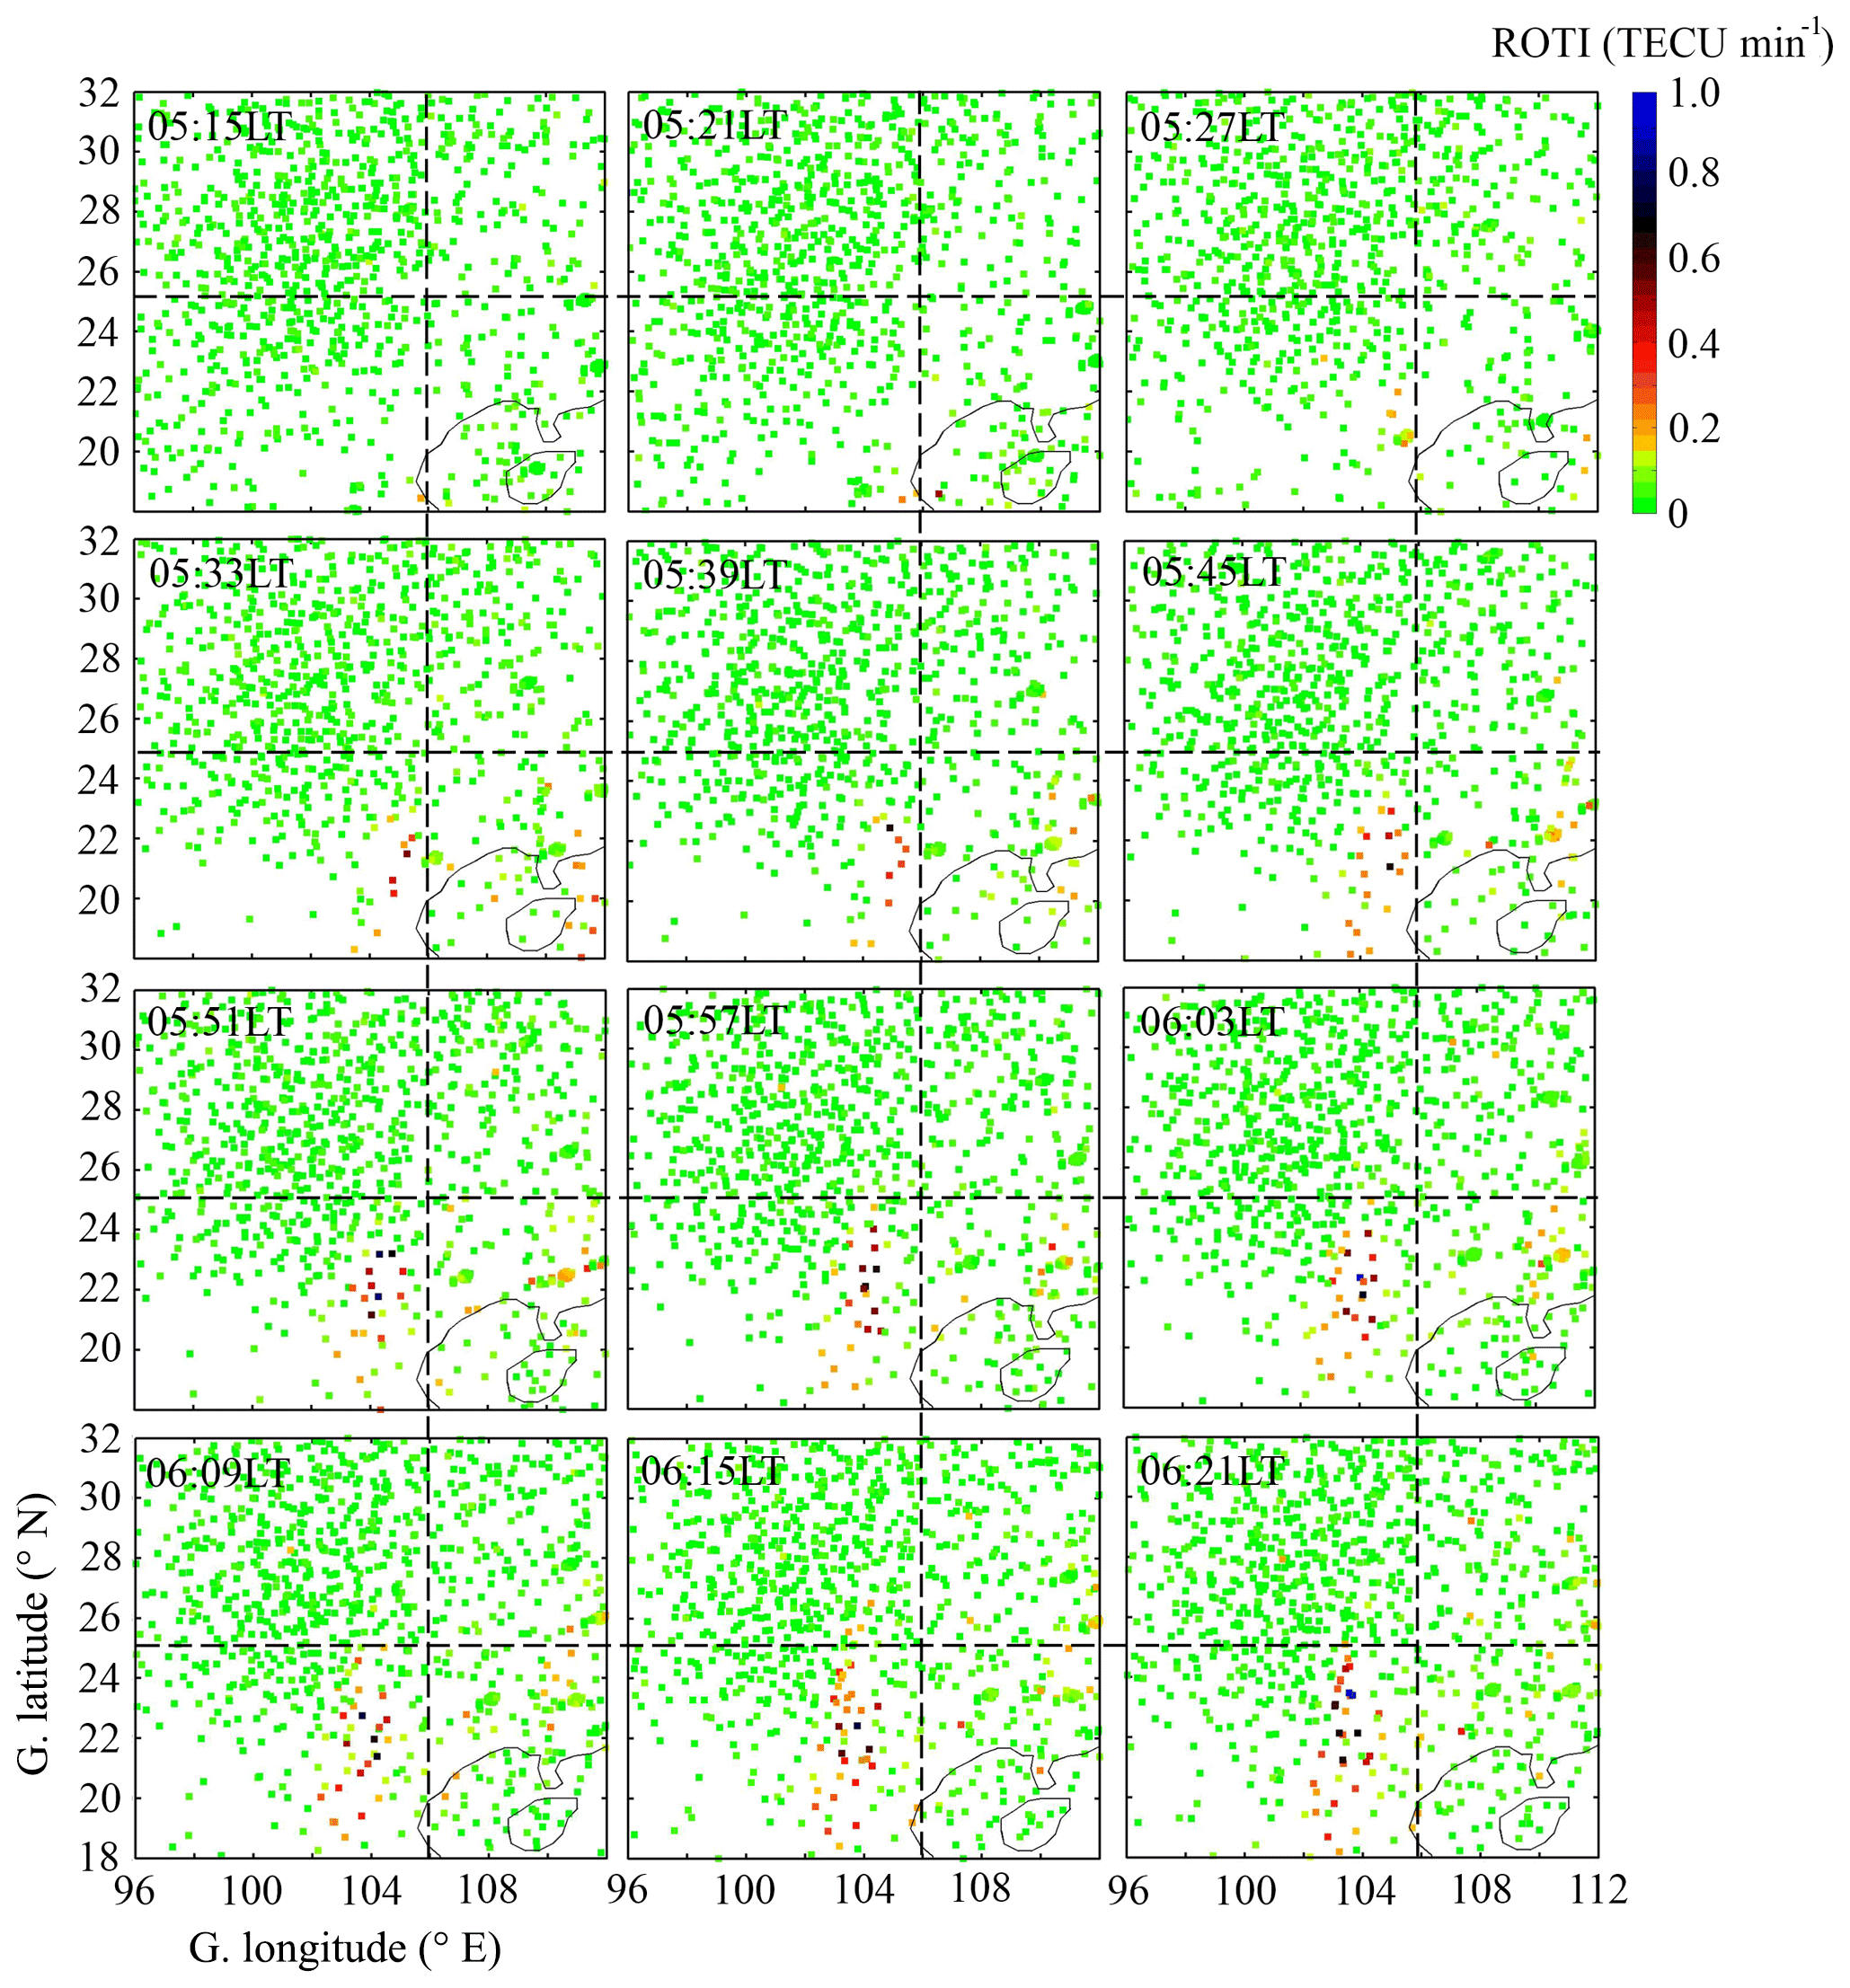
Figure 6Two-dimensional map of the rate of TEC index (ROTI) corresponding to each image of Fig. 3. The black horizontal line is a reference line of 25∘ N. The black vertical line is a reference line of 106∘ E.
In order to provide a much more detailed comparison between the all-sky imager and TEC measurements, we give the local-time variation of the absolute TEC after 05:15 LT (Fig. 5), which corresponds to the geographical area of airglow imaging. In Fig. 5, the TEC depletions at ∼105∘ E appeared near 05:30 LT, which correspond to EPB b1 and b2 observed by the all-sky imager. And after ∼07:45 LT, those TEC depletions disappeared. For a better representation, we showed ROTI variations which correspond to the geographical area and time of each airglow imaging of Fig. 3. In Fig. 6, the ROTI enhancement at ∼105∘ E also corresponds to EPB b1 and b2 observed by the all-sky imager near 05:30 LT. The ROTI enhancement moves away from 106∘ E with time (the black vertical line represents the 106∘ E in Fig. 6), which is consistent with the movement of EPBs observed by the airglow imager. Meanwhile, the northernmost part of the ROTI enhancement expanded to ∼25∘ N at 06:21 LT (the black horizontal line represents the 25∘ N in Fig. 6), which also agreed well with the observations of the all-sky imager. Interestingly, in Fig. 4, TEC residuals show that the northernmost EPBs at ∼105∘ E extended beyond 25∘ N after 06:20 LT. We can see that the northernmost of them reached about 28∘ N at 07:10 LT. In other words, TEC variations show that those depletions were still in existence after 06:21 LT, and they kept developing after sunrise but vanished near ∼08:00 LT. These observational results shown that the lifetime of those EPBs exceeds 3 h.
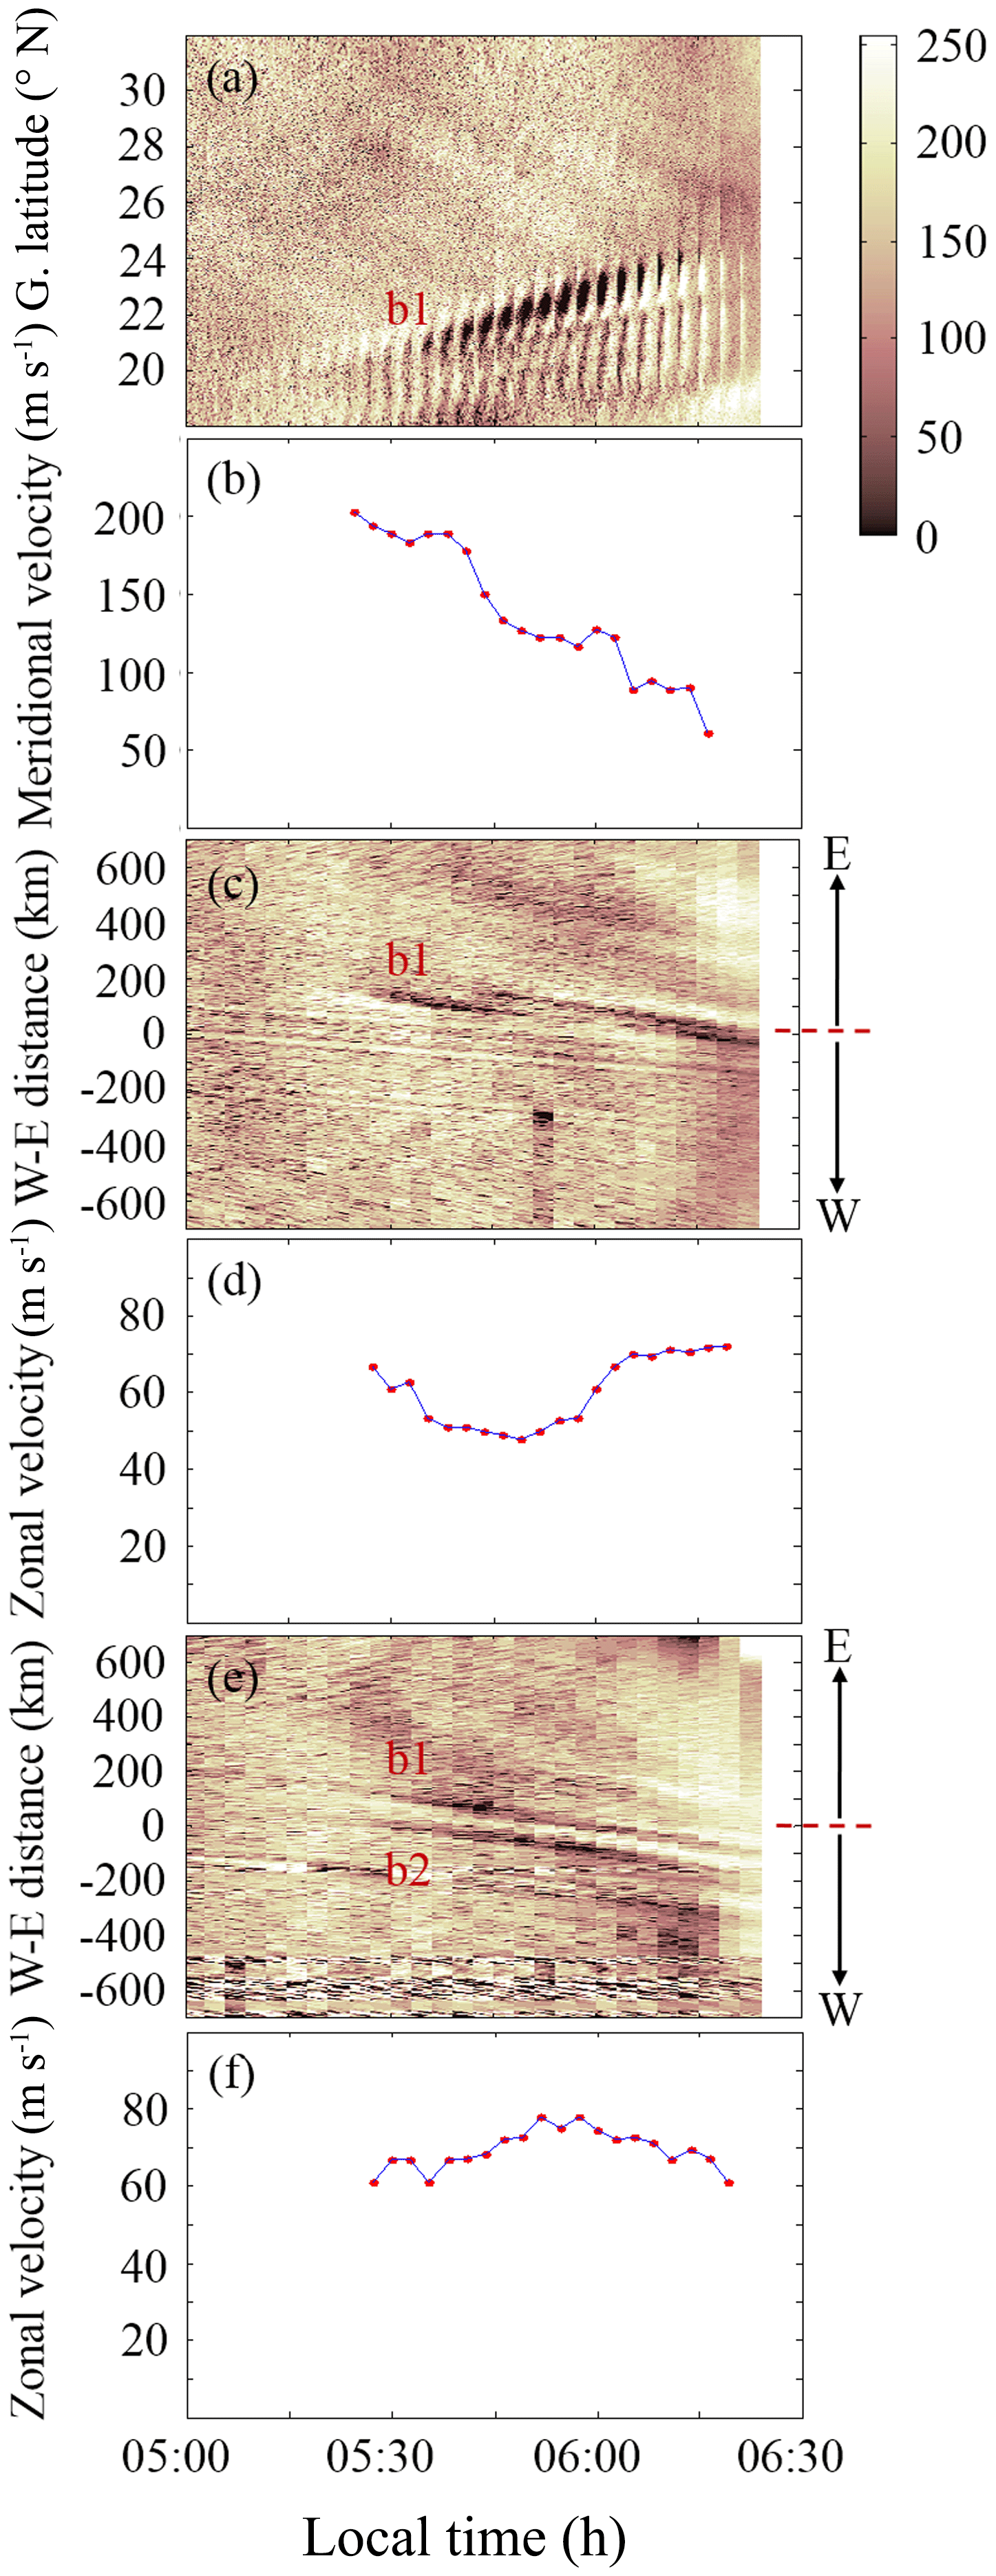
Figure 7(a) N–S cross sections (between 104 and 105∘ E) of the airglow images on 8 November 2015. (c) W–E cross sections (between 21.5 and 22∘ N) of the airglow images. (e) W–E cross sections (between 18.5 and 19∘ N) of the airglow images. (b) The variations of the meridian velocities of b1 with local time. Panels (d) and (f) show the variations of the zonal velocities of b1 at the geographical latitudes of ∼22 and ∼19∘ N, respectively.
In this study we showed an special event of EPBs which was simultaneously observed by the all-sky imager and the ground GNSS network in southern China. One interesting feature is that the EPBs started to appear near sunrise. Afterward, they kept developing until they totally vanished. During their lifetime, the EPBs moved from east to west. Those EPBs occurred in the recovery phase of the geomagnetic storm, which indicates that the prompt penetration electric fields (PPEF) and disturbance dynamo, as well as disturbed neutral wind circulation, may play an import role in triggering the EPBs.
The drift velocities of EPBs were shown in Fig. 7. We used the cross sections (keogram) (Fig. 7a, c, and e) of the airglow images to separately calculate the meridian velocities (Fig. 7b) of b1 and zonal velocities of b1 at the geographical latitudes of ∼22∘ N (Fig. 7d) and ∼19∘ N (Fig. 7f). Figure 7a illustrates the N–S cross sections (between 104 and 105∘ E) of the airglow images shown in Fig. 3. Figure 7c illustrates the W–E cross sections (between 21.5 and 22∘ N) of the airglow images, and Fig. 7e illustrates the W–E cross sections (between 18.5 and 19∘ N).
We separately calculated poleward and zonal velocities of b1 based on the position of which it changed over time in Fig. 7a, c, and e. The initial poleward and zonal velocities of b1 were about 200 and 60 m s−1, respectively. The horizontal drift of an EPB is also an important issue, which is often related to the background zonal plasma drift (Fejer et al., 2005; Eccles, 1998). The westward motion of the F region should be caused by the ionospheric dynamo process in the early morning (Kil et al., 2000; Sheehan and Valladares, 2004). The drift direction of the background zonal plasma drift has a reversal (eastward to westward) near dawn (Fejer et al., 2005). Huang and Roddy (2015) also found that the drift velocity of EPBs was eastward at night and reverses to westward near dawn by using data from C/NOFS, and they showed enhanced geomagnetic activities caused a westward EPB drift in the nighttime through a disturbance dynamo process. In our case, all EPBs emerged after 05:00 LT. The background plasma should drift westward during the early morning hours. So, it could partly explain why the observed EPBs drifted westward. In addition, the disturbed westward neutral winds can also contribute to the westward drifting of EPBs. Xiong et al. (2015) found that the disturbance winds were mainly westward at low latitudes, most prominent during early morning hours. Abdu et al. (2003) found that the westward drift of an EPB was most likely caused by westward zonal winds during a geomagnetic storm. Makela et al. (2006) found that the eastern wall of EPBs can become unstable due to the westward and equatorward neutral winds associated with wind surges. When the wind blows westward, and thus the wind-induced Pedersen current flows downward, gradient drift instability can occur at the eastern wall of an EPB, where the plasma density gradient is eastward. So, secondary instabilities are more likely to occur at eastern wall of EPBs. In Fig. 3, a sub-branch of dark bands first occurred at the eastern wall of b1, which is indicated by secondary instabilities developed at the eastern edge, most likely due to the westward disturbance winds.
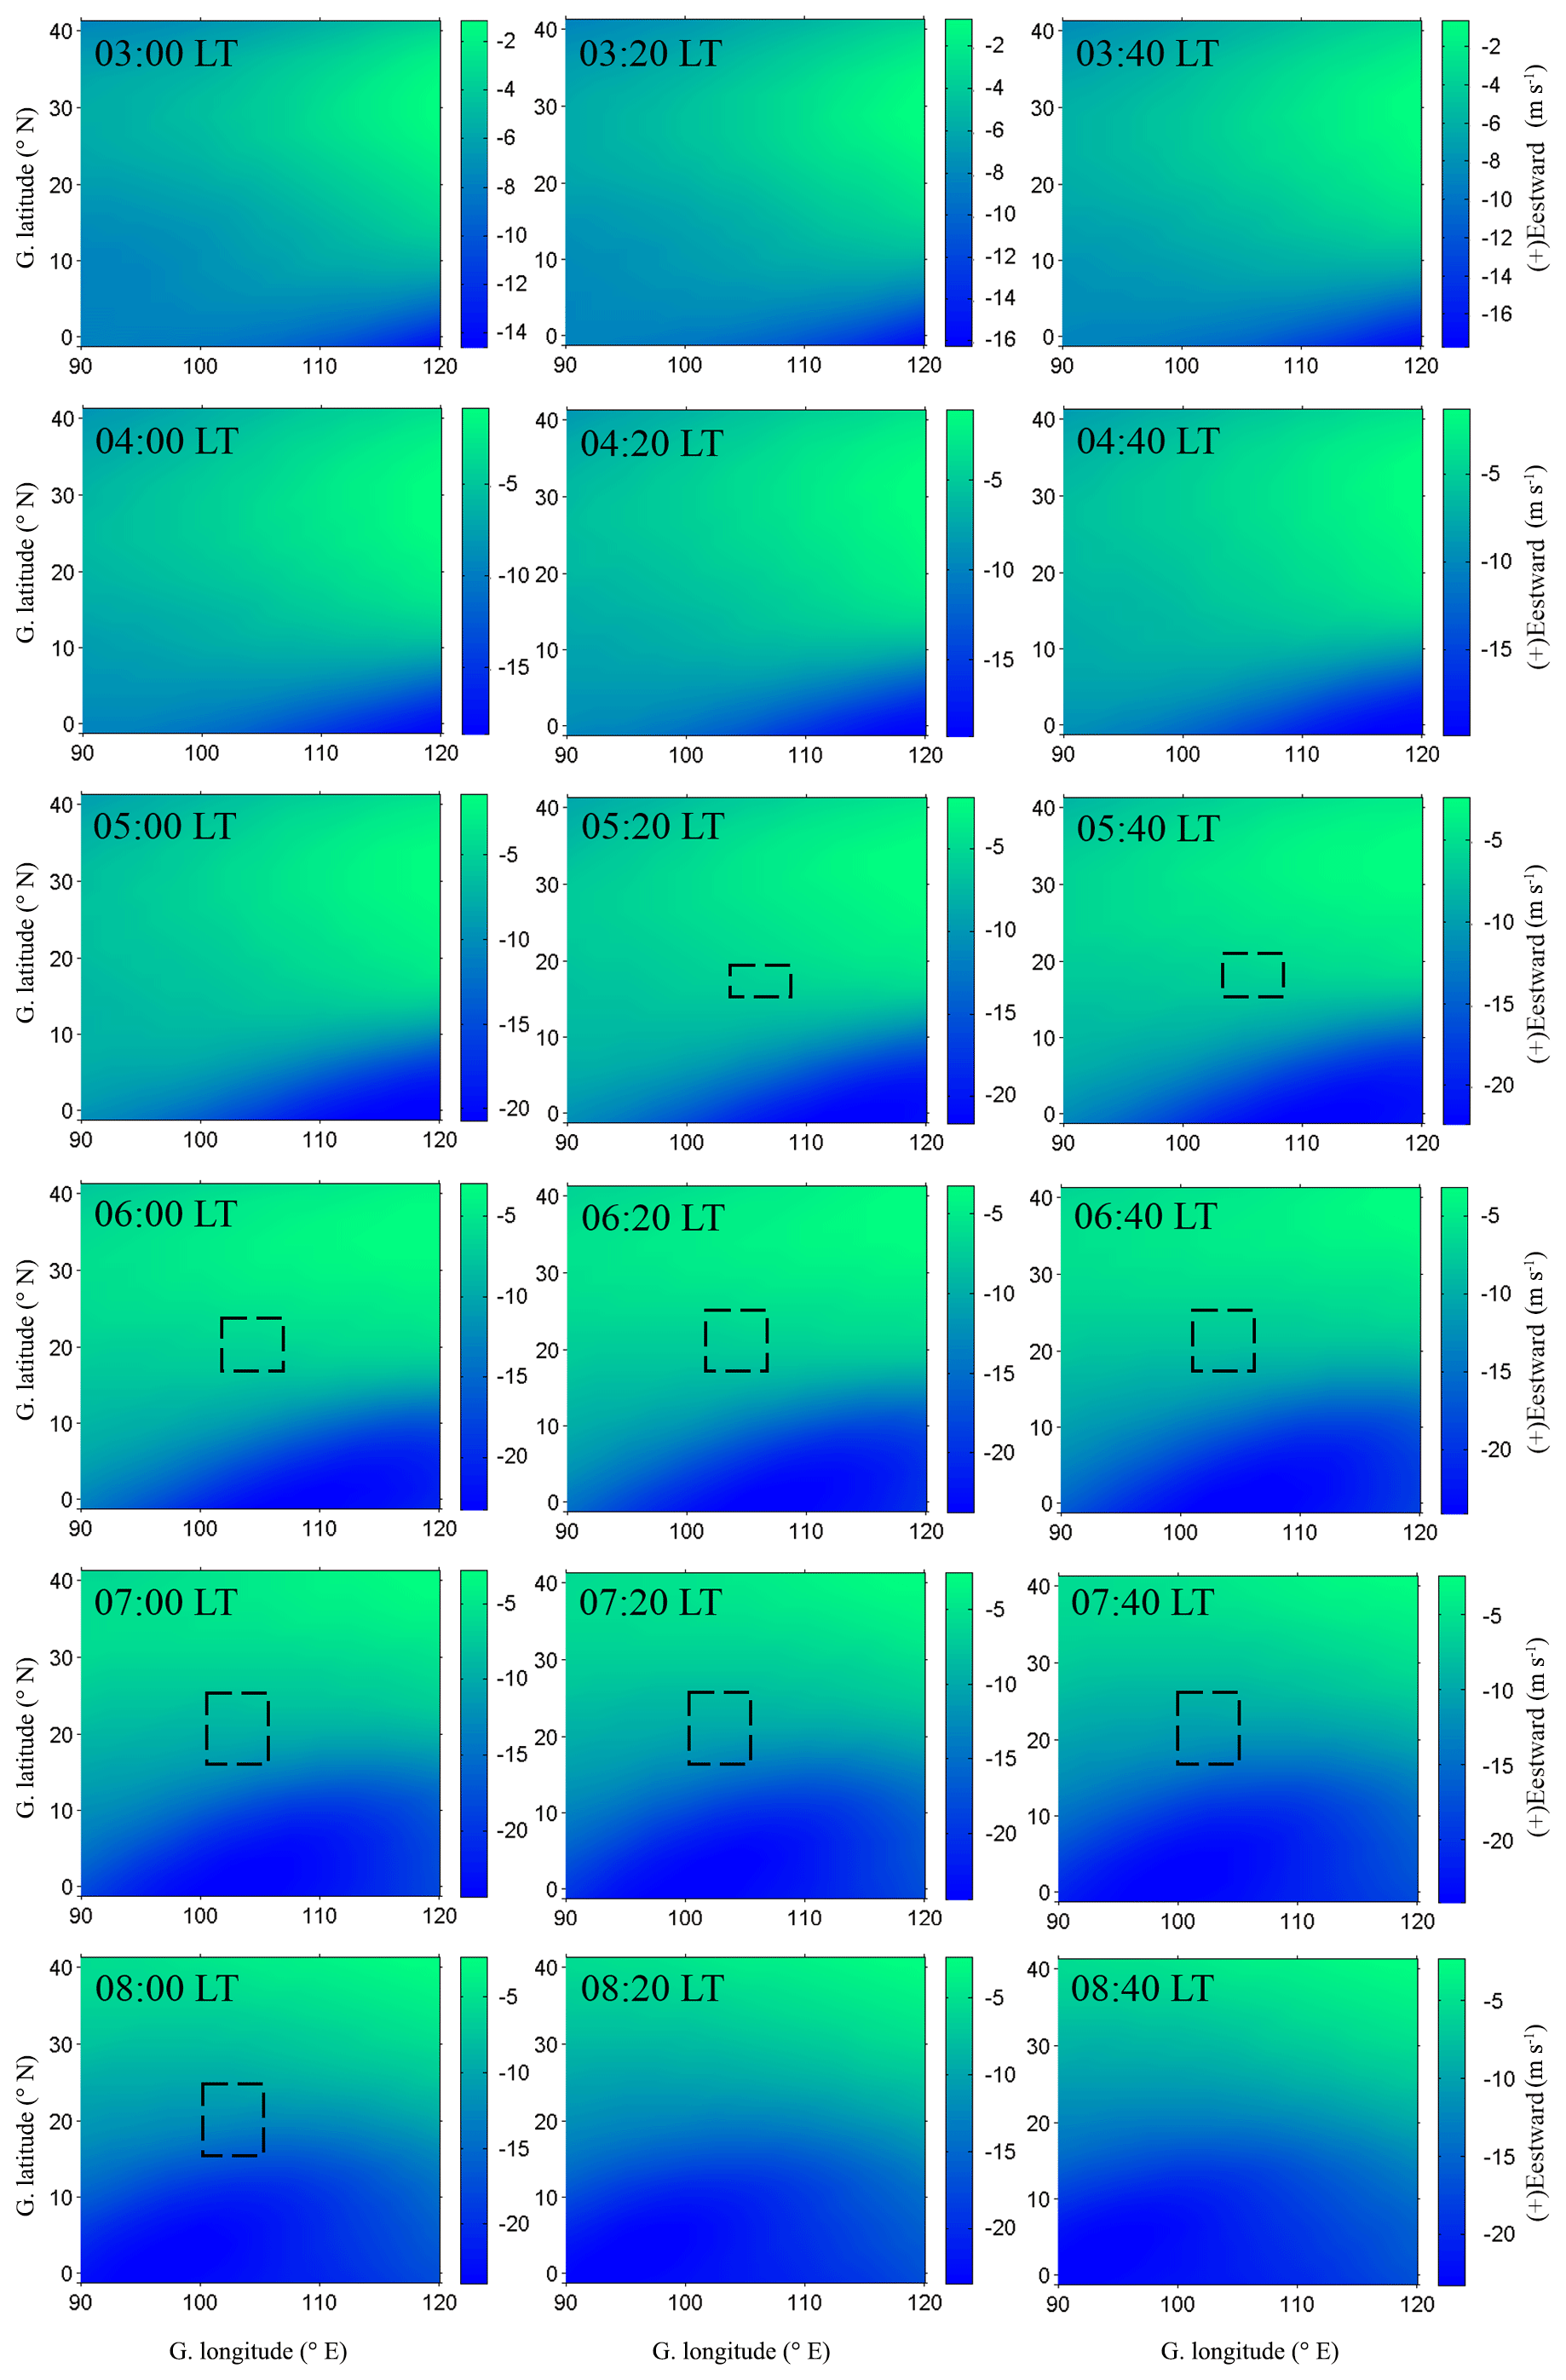
Figure 8Contours of nighttime zonal winds at 250 km in a range from 0 to 40∘ N in latitude and from 90 to 120∘ E in longitude during 8 November 2015. The dashed rectangles represent the location of EPBs.
In Fig. 8, we used the Thermosphere–Ionosphere–Electrodynamics General Circulation Model (TIE-GCM) to simulate the horizontal winds on 8 November 2015 under magnetically active conditions, and the latitude-versus-longitude distribution of zonal wind velocities are shown at different times. The winds at 250 km are shown, and the spatial coverage has been confined to 0–40∘ N latitude and 90–120∘ E longitude. The dashed rectangles represent the location of b1 and b2 at different times. In Fig. 8, we can see that the horizontal winds at low latitudes are mainly westward, which is consistent with the motion of EPBs in this case. As already discussed above, the westward drift of those EPBs is possibly caused by the westward disturbance winds. Besides this, the zonal winds computed from TIE-GCM shown in Fig. 8 are smaller than the zonal drifts of EPBs shown in Fig. 7. This is because zonal drift value of EPBs was controlled by the background zonal winds and ionospheric electric field (Haerendel et al., 1992; Eccles, 1998). The value differences between the simulation and zonal drifts of EPBs should be influenced by the ionospheric electric field. Besides this, the difference between the model simulated background zonal winds and the derived zonal drifts of EPBs from airglow images is possibly due to the fact that the model simulation mainly reflects a general trend of the wind but not the exact wind velocity in reality.
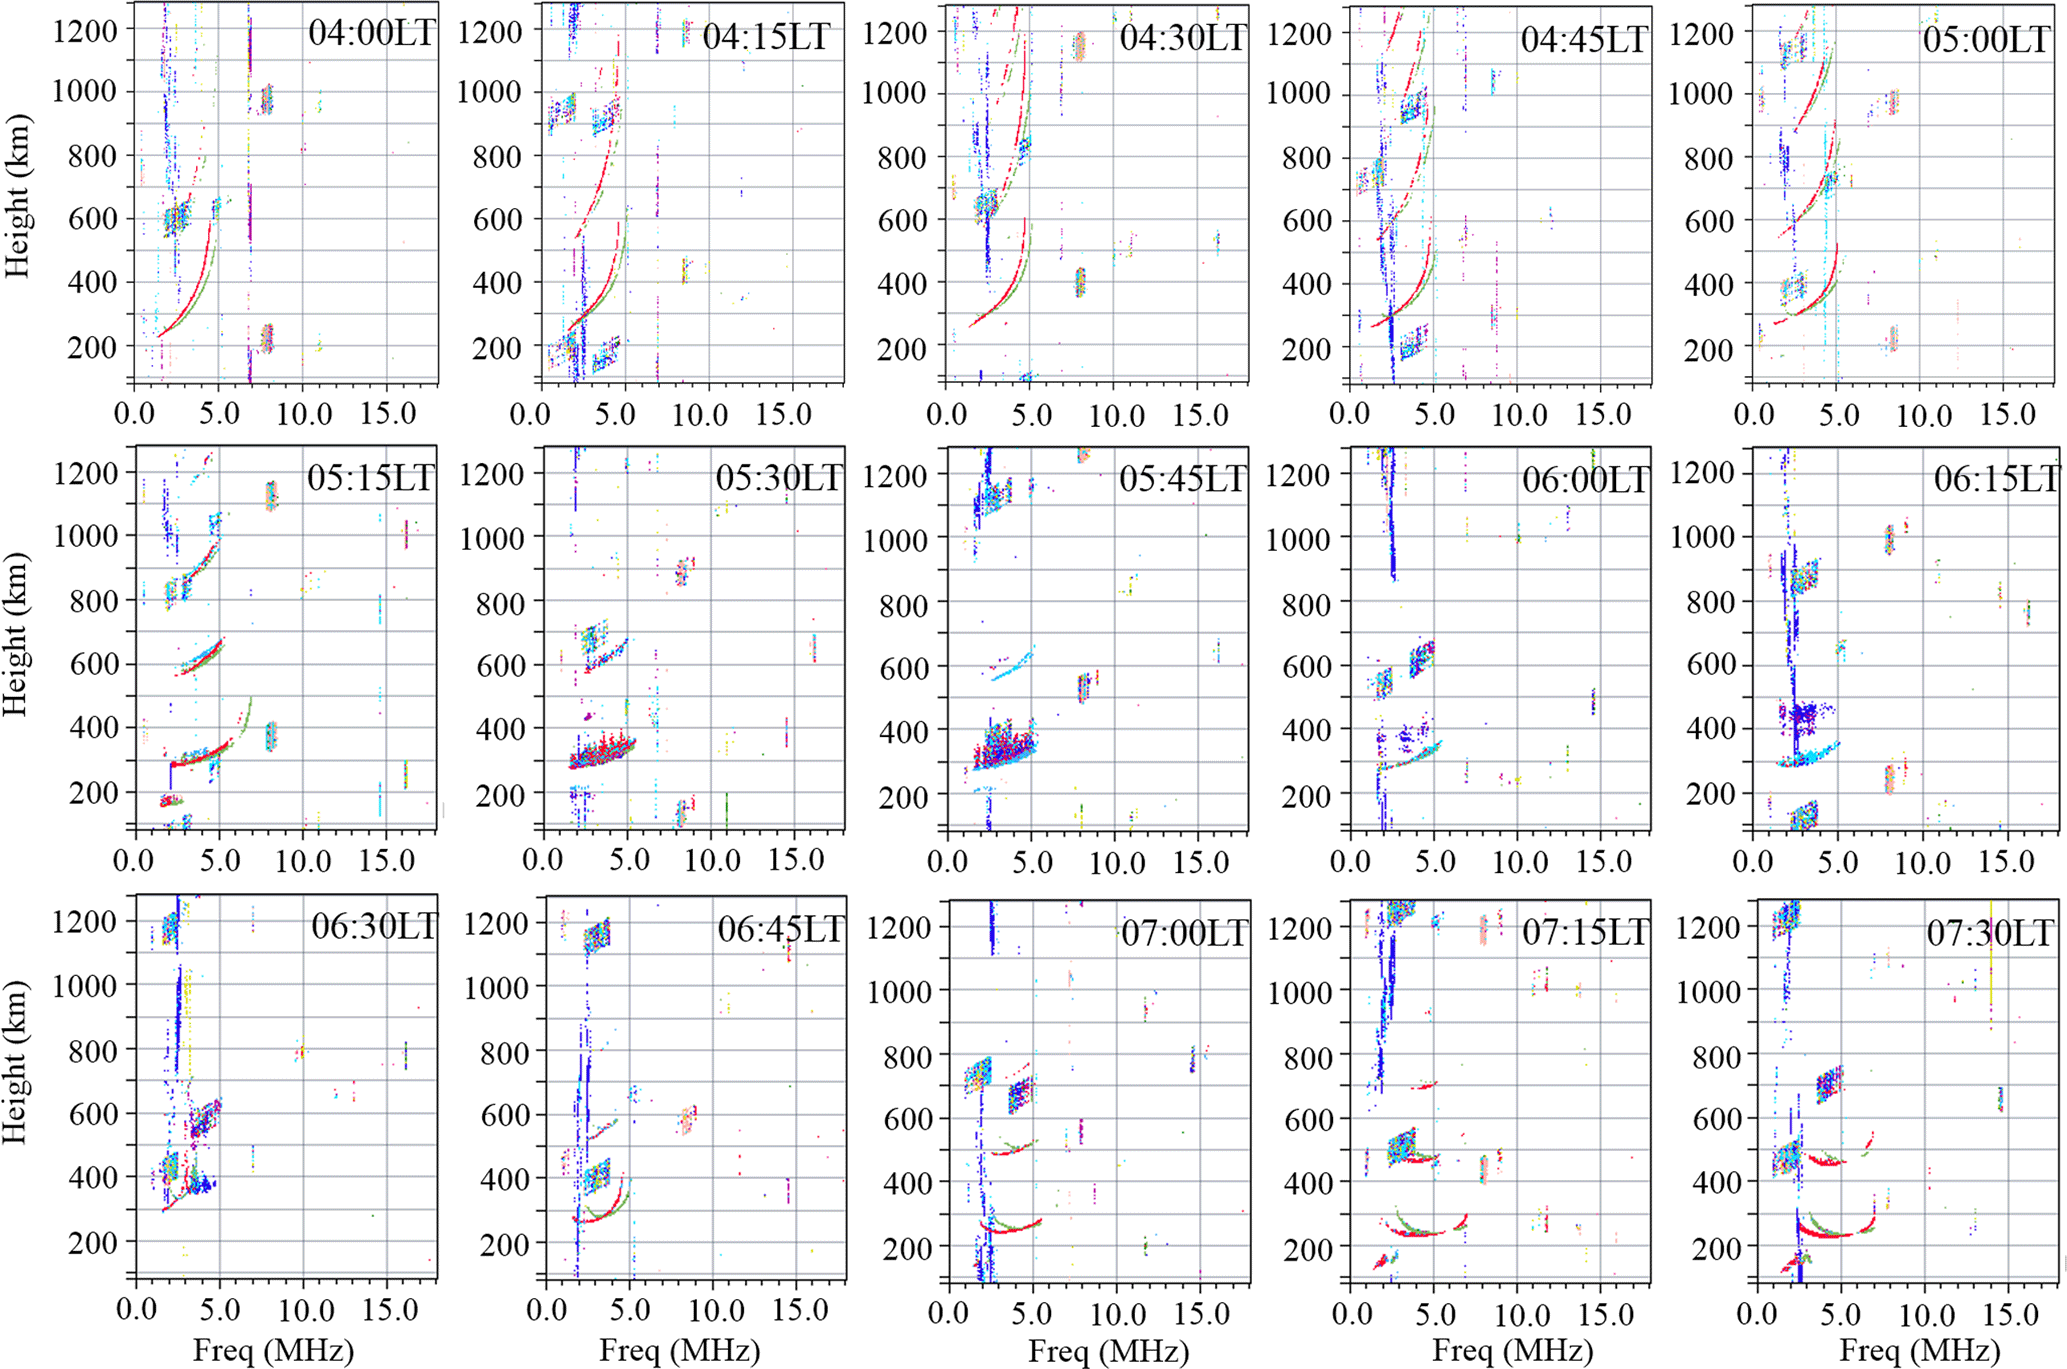
Figure 9The ionograms observed by the digisonde at Fuke between 04:00 and 07:30 LT on 8 November 2015.
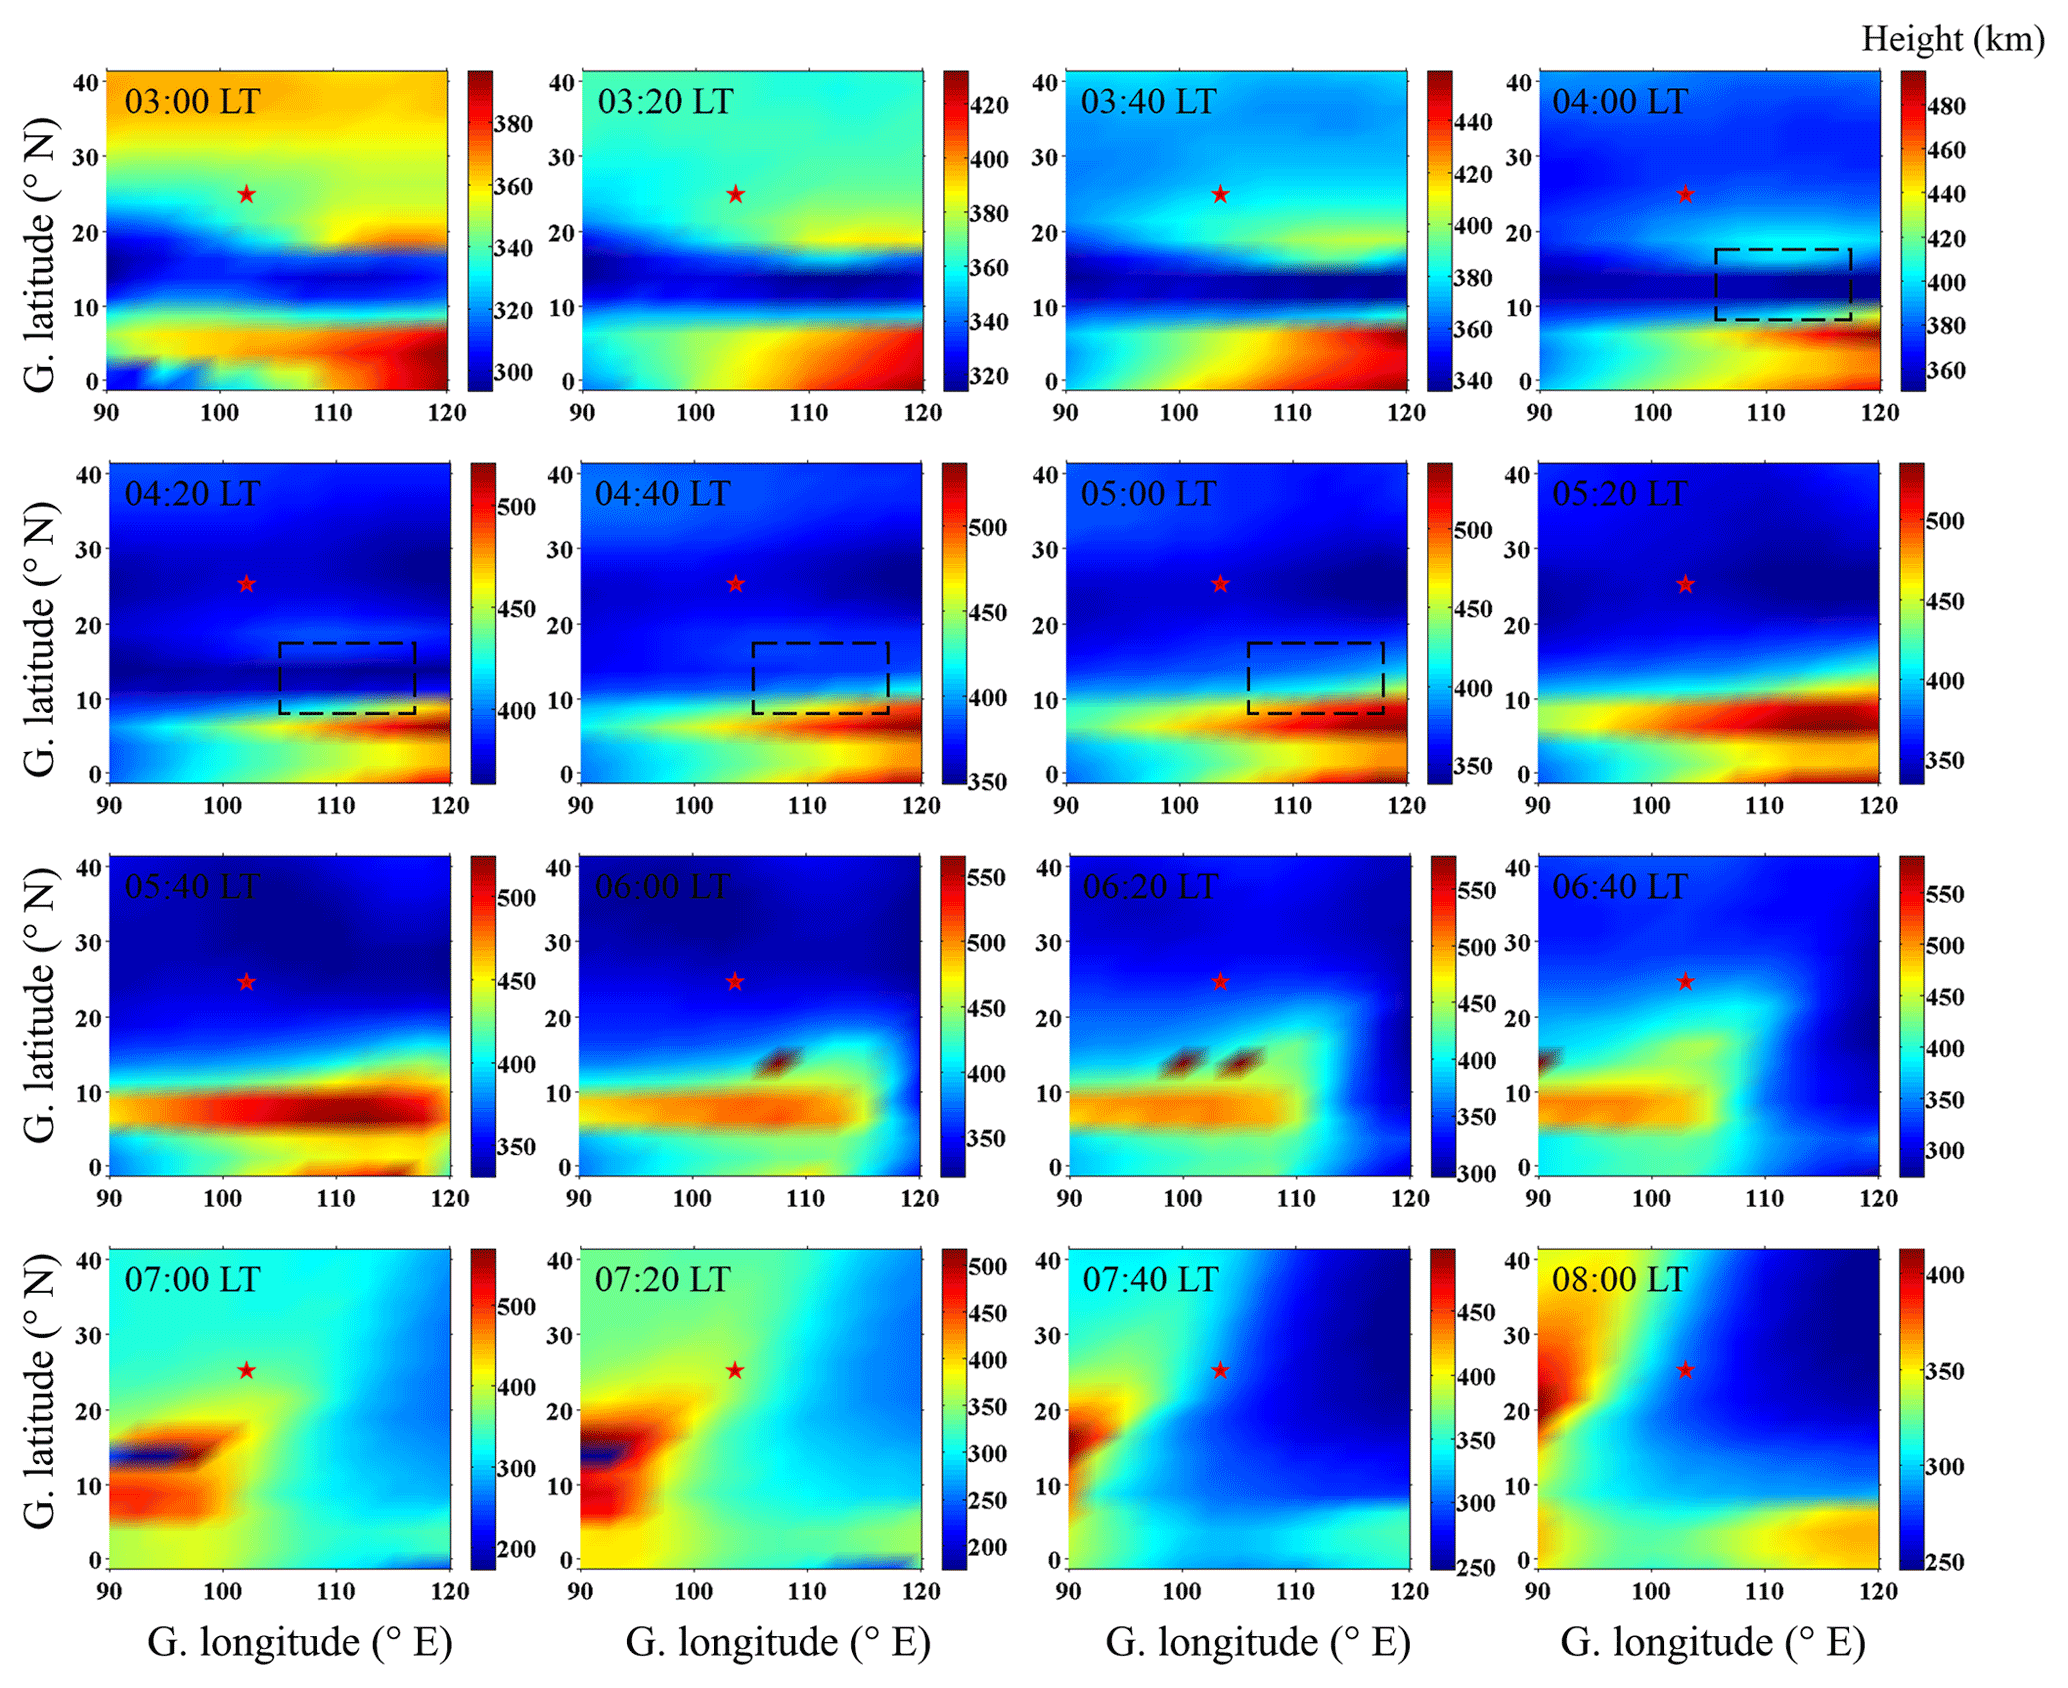
Figure 10The ionosphere F-layer peak height (hmF2) in a range from 0 to 40∘ N in latitude and from 90 to 120∘ E in longitude during 8 November 2015. The red star represents the location of the all-sky imager. The dashed rectangles represent the region of southeastern Qujing.
As reported, most of the EPBs start to occur at pre-midnight hours. There were a very limited number of studies that used data from radar or satellite to report the occurrence of an EPB close to sunrise hours (e.g., Fukao et al., 2003; Huang et al., 2013; Zhou et al., 2016). However, until now, there has been no observation result of EPBs around sunrise using optical remote sensing. In fact, it is very difficult to observe an EPB near sunrise by an all-sky imager. Often, EPBs start to develop shortly after sunset and vanish before sunrise. Even though some EPBs occur around sunrise in their initial stage, they disappear when they drift eastward into the daytime. And almost no report shows that the EPBs still kept developing after sunrise. In our case, the developing EPB was first observed at about 05:30 LT (near dawn) by both the all-sky imager and the GNSS network. The local-time variation of absolute TEC showed that EPBs existed after sunrise and they disappeared after 07:45 LT. Our observational results show that they kept developing after sunrise, and they vanished about 1 h after sunrise. Those EPBs should have occurred near sunrise, which is different from post-sunset EPBs. Their development stages lasted for at least about 3 h.
In the rest, we try to explain why the EPBs occurred near sunrise. During storm time, disturbance winds can affect the low-latitude ionospheric electrodynamics as well as the zonal drift of an EPB. The ionospheric disturbance dynamo electric field (DDEF) caused by a storm will drive the plasma drift to move upward during nighttime (Blanc and Richmond, 1980). Meanwhile, a number of studies found that the high-latitude electric fields can penetrate into the middle- and low-latitude ionosphere as PPEF when IMF Bz turns southward or northward (Kelley et al., 1979; Scherliess and Fejer, 1997; Cherniak and Zakharenkova, 2016; Carter et al., 2016; Patra et al., 2016; Katamzi-Joseph et al, 2017). For the storm event, after IMF Bz turned southward at ∼12:00 LT on 7 November 2015, there was a long duration and high AE during storm time. A DDEF should be present at the recovery phase of storm time. And it reversed the ambient electric field from westward to eastward near sunrise, which enhanced the height of the bottom side of the ionosphere F region. Meanwhile, the northward turning of IMF Bz at ∼04:00 LT on 8 November 2015 caused an overshielding electric field, which produced an eastward PPEF into the low–middle-latitude ionosphere. The eastward electric field also moved the F-region ionosphere to higher altitudes via vertical E×B drifts. In Fig. 2e, the increased height of bottom side of the ionosphere F region can be seen at Fuke. In low-latitude regions, one of the necessary conditions for the generation of EPBs is that the F layer should be uplifted to a higher altitude, where the RTI becomes unstable and forms EPBs. The F-layer height is largely determined by the eastward field via the vertical E×B drift (Dabas et al., 2003).
In this study, EPBs were initially observed by the all-sky imager at about 05:15 LT. We think that only a portion of the EPBs were observed in our study, as an EPB usually extends along the whole magnetic flux tube. It also means that the EPBs should possibly occur before 05:15 LT at equatorial latitudes. But due to the lack of observations at the Equator, we cannot provide direct evidence about their generation. However, as shown in our Fig. 9, we also found that spread F began to appear in the ionograms from the digisonde at Fuke after 05:15 LT, which indicates that those EPBs occurred in the region of southeastern Qujing (note that Fuke is to the southeast of Qujing). The bottom side of the ionospheric F region at Fuke was rapidly elevated from ∼250 to ∼290 km near sunrise on 8 November 2015. The rapidly elevated height of the ionosphere can cause a stronger RTI at the bottom of the ionosphere F region, which is beneficial to the formation of an EPB. The initial occurring time of EPBs in this case should be during this time. Unfortunately, we do not have more observations from the southeast of Fuke. We used TIE-GCM to simulate the height of hmF2 at lower latitudes on 8 November 2015. Figure 10 shows the hmF2 as a function of longitude and latitude at different times. The model results plotted are in a geographic range from 0 to 40∘ N in latitude and from 90 to 120∘ E in longitude. In Fig. 10, we can see that hmF2 southeast of (the dashed rectangles) Qujing was rapidly elevated to higher altitudes near sunrise. In other words, when the IMF Bz turned northward at about 04:00 LT, the ionosphere in some regions southeast of Qujing could be rapidly elevated to higher altitudes at this time. Those EPBs occurred in the same time period as highlighted by the green rectangular area in Fig. 2. Previous studies have reported that the occurrence of the dawn enhancement in the equatorial ionospheric vertical plasma drift (Zhang et al., 2015, 2016). They found that the enhancement of the ionospheric vertical plasma drift occurs around dawn. They suggested that the vertical plasma drifts can be enhanced near sunrise in a way similar to the PRE near sunset. Fejer et al. (2008) found that the nighttime disturbance dynamo drifts are upward, and they have the largest values near sunrise. In our case, the model simulations and observations both show an increase of the height of the ionosphere around sunrise. The enhancement of low-latitude ionospheric vertical plasma drift caused by DDEF and PPEF associated with the geomagnetic storm should play a vital role in triggering those EPBs. Our results also provide evidence of the enhancement of low-latitude ionospheric vertical plasma drift around sunrise, which should be the main reason of the EPB generation near dawn.
In addition, some interesting features of EPBs are also shown in Fig. 3 in that the EPBs also showed bifurcation and merging processes. The merging phenomenon of EPBs has been studied by some researchers (Huang et al., 2012; Huba et al., 2015; Narayanan et al., 2016; Wu et al., 2017). However, there has been no study to report that bifurcation occurred first and merging occurred later in the evolution of an EPB. In Fig. 7f, at a latitude of 19∘ N, the zonal velocity of b1 was about 60–70 m s−1 between 05:20 and 06:15 LT. However, at the latitude of 22∘ N (Fig. 7d), the zonal velocity of b1 was decreased from about 70 m s−1 to about 50 m s−1 between 05:20 and 05:45 LT. After 05:45 LT, its velocity began to increase from ∼50 to ∼70 m s−1 from 05:45 to 06:00 LT. Then, it kept a velocity of ∼70 m s−1. Owning to the fact that the zonal velocity at higher latitudes was smaller than that at low latitudes before 05:45 LT, b1 had a bifurcation process of EPBs during this period. After 05:45 LT, the zonal velocity at higher latitudes was bigger than that at lower latitudes, and b1 exhibited a merging process of EPBs after 06:03 LT. The above results indicate that the bifurcation and merging processes of EPBs should be caused by the different drift velocities of the background plasma at different latitudes.
In this paper, a special EPB event was observed by an all-sky imager and the GNSS network in southern China. The evolution processes and characteristics of those EPBs were studied in detail. Our main findings are summarized below.
-
The observed EPBs on 8 November 2015 emerged before sunrise and kept developing. They dissipated at about 1 h after sunrise (∼ after 08:00 LT), and the development stage lasted for at least about 3 h. The evolution of EPBs developing around sunrise was observed for the first time by an all-sky imager and the GNSS network.
-
They occurred in the recovery phase of a geomagnetic storm. The enhancement of background ionospheric vertical plasma drift was also observed near sunrise. The rapid uplift of the ionospheric caused by the geomagnetic storm should be the main reason for triggering the EPBs.
-
During the development, the EPBs drifted westward rather than eastward. The TIE-GCM simulation suggested that the westward drift of an EPB is related to the westward disturbance winds.
-
The EPB also exhibited bifurcation and merging processes during its development.
The airglow and digisonde data used in this work are available at https://data.meridianproject.ac.cn/instrumentfiletype-option, last access: 1 February 2020. The airglow data used in this study also can be obtained by contacting the corresponding author. The GNSS data used in this work are from the Crustal Movement Observation Network of China (CMONOC; http://neiscn.org/chinsoftdmds/ltwsjcp/index.jhtml, last access: 1 February 2020). The IMF, AE, AL, AU, KP, and SYM/H data are obtained from CDAWeb (https://cdaweb.gsfc.nasa.gov/cgi-bin/eval1.cgi, last access: 1 February 2020), and the WDC for geomagnetism can be obtained from Kyoto University (http://wdc.kugi.kyoto-u.ac.jp/wdc/Sec3.html, last access: 1 February 2020).
KW and JX conceived the study, processed airglow data, analyzed the data, discussed the results, and led the writing of the paper. XY provided the GNSS data and assisted in discussing the results. CX assisted in discussing the results of the study and reviewing the paper. WW provided the TIE-GCM simulations and reviewed the paper. WY, CW, YZ, and JL assisted in reviewing the paper.
The authors declare that they have no conflict of interest.
We acknowledge the use of data from the Chinese Meridian Project. This work was supported by the Open Research Project of Large Research Infrastructures of CAS, the “Study on the interaction between low/mid-latitude atmosphere and ionosphere based on the Chinese Meridian Project”, the Chinese Meridian Project, and the National Natural Science Foundation of China. We acknowledge the use of GNSS data from the Crustal Movement Observation Network of China (CMONOC; http://neiscn.org/chinsoftdmds/ltwsjcp/index.jhtml, last access: 1 February 2020), and the data could be obtained upon request. We thank Haitao Liu from Macau University of Science and Technology for processing the GNSS data. The development of the TEC process program is supported by the Science and Technology Development Fund, Macau SAR, China (file nos. 001/2016/AFJ and 0001/2019/A1). The National Center for Atmospheric Research is sponsored by the National Science Foundation.
This research has been supported by the National Natural Science Foundation of China (grant nos. 41831073 and 41674152).
This paper was edited by Keisuke Hosokawa and reviewed by two anonymous referees.
Aa, E., Huang, W., Yu, S., Liu, S., Shi, L., Gong, J., Chen, Y., and Shen, H.: A regional ionospheric tec mapping technique over china and adjacent areas on the basis of data assimilation, J. Geophys. Res., 120, 5049–5061, https://doi.org/10.1002/2015JA021140, 2015.
Aa, E., Huang, W., Liu, S., Ridley, A., Zou, S., Shi, L., Chen, Y., Shen, H., Yuan, T., Li, J., and Wang, T.: Midlatitude plasma bubbles over China and adjacent areas during a magnetic storm on 8 September 2017, Adv. Space Res., 16, 321–331, https://doi.org/10.1002/2017SW001776, 2018.
Abdu, M. A.: Outstanding problems in the equatorial ionosphere–thermosphere electrodynamics relevant to spread f, J. Atmos. Sol.-Terr. Phys., 63, 869–884, https://doi.org/10.1016/S1364-6826(00)00201-7, 2001.
Abdu, M. A.: Magnetospheric disturbance induced equatorial plasma bubble development and dynamics: A case study in Brazilian sector, J. Geophys. Res., 108, 1449, https://doi.org/10.1029/2002ja009721, 2003.
Basu, S., Basu, S., MacKenzie, E., Bridgwood, C., Valladares, C. E., Groves, K. M., and Carrano, C.: Specification of the occurrence of equatorial ionospheric scintillations during the main phase of large magnetic storms within solar cycle, Radio Sci., 45, RS5009, https://doi.org/10.1029/2009RS004343, 2010.
Blanc, M. and Richmond, A. D.: The ionospheric disturbance dynamo, J. Geophys. Res., 85, 1669–1686, https://doi.org/10.1029/JA085iA04p01669, 1980.
Buhari, S. M., Abdullah, M., Hasbi, A. M., Otsuka, Y., Yokoyama, T., and Nishioka, M.: Continuous generation and two – imensional structure of equatorial plasma bubbles observed by high – density gps receivers in southeast asia, J. Geophys. Res., 119, 10569–10580, https://doi.org/10.1002/2014JA020433, 2014.
Burke, W. J., Gentile, L. C., Huang, C. Y., Valladares, C. E., and Su, S. Y.: Longitudinal variability of equatorial plasma bubbles observed by dmsp and rocsat-1, J. Geophys. Res., 109, A12301, https://doi.org/10.1029/2004JA010583, 2004.
Carter, B. A., Yizengaw, E., Pradipta, R., Retterer, J. M., Groves, K., Valladares, C., Caton, R., Bridgwood, C., Norman, R., and Zhang, K.: Global equatorial plasma bubble occurrence during the 2015 St. Patrick's day storm, J. Geophys. Res., 121, 894–905, https://doi.org/10.1002/2015JA022194, 2016.
Cherniak, I. and Zakharenkova, I.: First observations of super plasma bubbles in Europe, Geophys. Res. Lett., 43, 11137–11145, https://doi.org/10.1002/2016GL071421, 2016.
Dabas, R. S., Singh, L., Lakshmi, D. R., Subramanyam, P., Chopra, P., and Garg, S. C.: Evolution and dynamics of equatorial plasma bubbles: relationships to exb drift, postsunset total electron content enhancements and equatorial electrojet strength, Radio Sci., 38, 1075, https://doi.org/10.1029/2001RS002586, 2003.
Ding, F., Wan, W., Mao, T., Wang, M., Ning, B., Zhao, B., and Xiong, B.: Ionospheric response to the shock and acoustic waves excited by the launch of the Shenzhou 10 spacecraft, Geophys. Res. Lett., 41, 3351–3358, https://doi.org/10.1002/2014GL060107, 2004.
Eccles, V. J.: A simple model of low-latitude electric fields, J. Geophys. Res., 103, 26699–26708, https://doi.org/10.1029/98JA02657, 1998.
Fejer, B. G., Scherliess, L., and Paula, E. R. D.: Effects of the vertical plasma drift velocity on the generation and evolution of equatorial spread-f, J. Geophys. Res., 104, 859–869, https://doi.org/10.1029/1999JA900271, 1999.
Fejer, B. G., Souza, J. R., Santos, A. S., and Pereira, A. E. C.: Climatology of F, region zonal plasma drifts over Jicamarca, J. Geophys. Res., 110, A12310, https://doi.org/10.1029/2005JA011324, 2005.
Fejer, B. G., Jensen, J. W., and Su, S.-Y.: Seasonal and longitudinal dependence of equatorial disturbance vertical plasma drifts, Geophys. Res. Lett., 35, L20106, https://doi.org/10.1029/2008gl035584, 2008.
Fukao, S., Ozawa, Y., Yamamoto, M., and Tsunoda, R. T.: Altitude extended equatorial spread F observed near sunrise terminator over Indonesia, Geophys. Res, Lett., 30, 2137, https://doi.org/10.1029/2003GL018383, 2003.
Garcia, F. J., Taylor, M. J., and Kelley, M. C.: Two-dimensional spectral analysis of mesospheric airglow image data, Appl. Opt., 36, 7374, https://doi.org/10.1364/AO.36.007374, 1997.
Haerendel, G., Eccles, J. V., and Çakir, S.: Theory for modeling the equatorial evening ionosphere and the origin of the shear in the horizontal plasma flow, J. Geophys. Res., 97, 1209–1223, https://doi.org/10.1029/91JA02226, 1992.
Huang, C.-S., Retterer, J. M., de La Beaujardiere, O., Roddy, P. A., Hunton, D. E., Ballenthin, J. O., and Pfaff, R. F.: Observations and simulations of formation of broad plasma depletions through merging process, J. Geophys. Res., 117, A02314, https://doi.org/10.1029/2011JA017084, 2012.
Huang, C. S.: Effects of the postsunset vertical plasma drift on the generation of equatorial spread f, Prog. Earth Planet. Sc., 5, 2263–2275, https://doi.org/10.1186/s40645-017-0155-4, 2018.
Huang, C. S. and Roddy, P. A.: Effects of solar and geomagnetic activities on the zonal drift of equatorial plasma bubbles, J. Geophys. Res., 121, 628–637, https://doi.org/10.1002/2015JA021900, 2015.
Huang, C. S., Beaujardiere, O. D. L., Roddy, P. A., Hunton, D. E., Ballenthin, J. O., and Hairston, M. R.: Long-lasting daytime equatorial plasma bubbles observed by the c/nofs satellite, J. Geophys. Res., 118, 2398–2408, https://doi.org/10.1002/jgra.50252, 2013.
Huba, J. D., Wu, T.-W., and Makela, J. J.: Electrostatic reconnection in the ionosphere, Geophys. Res. Lett., 42, 1626–1631, https://https://doi.org/10.1002/2015GL063187, 2015.
Katamzi-Joseph, Z. T., Habarulema, J. B., and Hernández-Pajares, M.: Midlatitude postsunset plasma bubbles observed over Europe during intense storms in April 2000 and 2001, Adv. Space Res., 15, 1177–1190, https://doi.org/10.1002/2017SW001674, 2017.
Kelley, M. C.: The Earth's Ionosphere: Plasma Physics and Electrodynamics, San Diego, CA, Academic, 248 pp., 2009.
Kelley, M. C., Fejer, B. G., and Gonzales, C. A.: An explanation for anomalous equatorial ionospheric electric fields associated with a northward turning of the interplanetary magneticfield, Geophys. Res. Lett., 6, 301–304, https://doi.org/10.1029/GL006i004p00301, 1979.
Kelley, M. C., Labelle, J., Kudeki, E., Fejer, B. G., Basu, S., Baker, K. D., Hanuise, C., Argo, P., Woodman, R. F., Swartz, W. E., Farley, D., and Meriwether, J.: The Condor Equatorial Spread F Campaign: Overview and results of the large-scale measurements, J. Geophys. Res., 91, 5487–5503, https://doi.org/10.1029/JA091iA05p05487,1986.
Kil, H., Kintner, P. M., De Paula, E. R., and Kantor, I. J.: Global positioning system measurements of the ionospheric zonal apparent velocity at cachoeira paulista in brazil, J. Geophys. Res., 105, 5317–5327, https://doi.org/10.1029/1999JA000244, 2000.
Lühr H., Xiong, C., Park, J., and Rauberg, J.: Systematic study of intermediate scale structures of equatorial plasma irregularities in the ionosphere based on CHAMP observations, Front Phys., 2, 15, https://doi.org/10.3389/fphy.2014.00015, 2014.
Makela, J. J. and Otsuka, Y.: Overview of Nighttime Ionospheric Instabilities at Low-and Mid-Latitudes: Coupling Aspects Resulting in Structuring at the Mesoscale, Space Sci. Rev., 168, 419–440, https://doi.org/10.1007/s11214-011-9816-6, 2012.
Makela, J. J., Kelley, M. C., and Nicolls, M. J.: Optical observations of the development of secondary instabilities on the eastern wall of an equatorial plasma bubble, J. Geophys. Res., 111, A09311, https://doi.org/10.1029/2006JA011646, 2006.
Martinis, C., Eccles, J. V., Baumgardner, J., Manzano, J., and Mendillo, M.: Latitude dependence of zonal plasma drifts obtained from dual – site airglow observations, J. Geophys. Res., 108, 1129, https://doi.org/10.1029/2002JA009462, 2003.
Narayanan, V. L., Gurubaran, S., and Shiokawa, K.: Direct observational evidence for the merging of equatorial plasma bubbles, J. Geophys. Res.-Space, 121, 7923–7931, https://doi.org/10.1002/2016JA022861, 2016.
Otsuka, Y., Aramaki, T., Ogawa, T., and Saito, A.: A statistical study of ionospheric irregularities observed with a GPS network in Japan, in: Recurrent Magnetic Storms: Corotating Solar Wind Streams, Geophys. Monogr. Ser., Vol. 167, edited by: Tsurutani, B., Mcpherron, R., Lu, G., Sobral, A. H., and Gopalswamy, N., AGU, Washington, DC, 23 pp., 2006.
Ott, E.: Theory of Rayleigh-Taylor bubbles in the equatorial ionosphere, J. Geophys. Res., 83, 2066, https://doi.org/10.1029/JA083ia05p02066, 1978.
Park, S. H., England, S. L., Immel, T. J., Frey, H. U., and Mende, S. B.: A method for determining the drift velocity of plasma depletions in the equatorial ionosphere using far – ultraviolet spacecraft observations, J. Geophys. Res., 112, A11314, https://doi.org/10.1029/2007JA012327, 2007.
Patra, A. K., Chaitanya, P. P., Dashora, N., Sivakandan, M., and Taori, A.: Highly localized unique electrodynamics and plasma irregularities linked with the 17 March 2015 severe magnetic storm observed using multitechnique common – volume observations from gadanki, india, J. Geophys. Res., 121, 11518–11527, https://doi.org/10.1002/2016JA023384, 2016.
Pi, X., Mannucci, A. J., Lindqwister, U. J., and Ho, C. M.: Monitoring of global ionospheric irregularities using the worldwide GPS network, Geophys. Res. Lett., 24, 2283–2286, https://doi.org/10.1029/97GL02273, 1997.
Pimenta, A. A., Fagundes, P. R., Bittencourt, J. A., Sahai, Y., Gobbi, D., Medeiros, A. F., Taylor, M. J., and Takahashi, H.: Ionospheric plasma bubble zonal drift: a methodology using oi 630 nm all-sky imaging systems, Adv. Space Res., 27, 1219–1224, https://doi.org/10.1016/s0273-1177(01)00201-0, 2001.
Sahai, Y., Becker-Guedes, F., Fagundes, P. R., de Jesus, R., de Abreu, A. J., Otsuka, Y., Shiokawa, k., Igarashi, K., Yumoto, K., Huang, C. S., Lan, H. T., Saito, A., Guarnieri, F. L., Pillat, V. G., and Bittencourt, J. A.: Effects observed in the ionospheric F region in the east Asian sector during the intense geomagnetic disturbances in the early part of November 2004, J. Geophys. Res., 114, A00A18, https://doi.org/10.1029/2008JA013053, 2009.
Santos, A. M., Abdu, M. A., Souza, J. R., Sobral, J. H. A., Batista, I. S., and Denardini, C. M.: Storm time equatorial plasma bubble zonal drift reversal due to disturbance Hall electric field over the Brazilian region, J. Geophys. Res., 121, 5594–5612, https://doi.org/10.1002/2015JA022179, 2016.
Scherliess, L. and Fejer, B. G.: Storm time dependence of equatorial disturbance dynamo zonal electric fields, J. Geophys. Res., 102, 24037–24046, https://doi.org/10.1029/97ja02165, 1997.
Sheehan, R. E. and Valladares, C. E.: Equatorial ionospheric zonal drift model and vertical drift statistics from UHF scintillation measurements in South America, Ann. Geophys., 22, 3177–3193, https://doi.org/10.5194/angeo-22-3177-2004, 2004.
Taylor, M. J., Eccles, J. V., Labelle, J., and Sobral, J. H. A.: High resolution oi (630 nm) image measurements of f – region depletion drifts during the guará campaign, Geophys. Res. Lett., 24, 1699–1702, 2013.
Tulasi, R. S., Rama, R. P. V. S., Prasad, D. S. V. V. D., Niranjan, K., Gopi, K. S., and Sridharan, R.: Local time dependent response of postsunset esf during geomagnetic storms, J. Geophys. Res., 113, A07310, https://doi.org/10.1029/2007JA012922, 2008.
Weber, E., Buchau, J., and Moore, J.: Airborne studies of equatorial F layer ionospheric irregularities, J. Geophys. Res., 85, 4631–4641, https://doi.org/10.1029/JA085iA09p04631, 1980.
Wu, K., Xu, J., Wang, W., Sun, L., Liu, X., and Yuan, W.: Interesting equatorial plasma bubbles observed by all-sky imagers in the equatorial region of China, J. Geophys. Res., 122, 10596–10611, https://doi.org/10.1002/2017JA024561, 2017.
Wu, K., Xu, J., Xiong, C., and Yuan, W.: Edge plasma enhancements of equatorial plasma depletions observed by all-sky imager and the C/NOFS satellite, J. Geophys. Res., 123, 8835–8849, https://doi.org/10.1029/2018JA025809, 2018.
Xiong, C., Park, J., Lühr, H., Stolle, C., and Ma, S. Y.: Comparing plasma bubble occurrence rates at CHAMP and GRACE altitudes during high and low solar activity, Ann. Geophys., 28, 1647–1658, https://doi.org/10.5194/angeo-28-1647-2010, 2010.
Xiong, C., Lühr, H., and Fejer, B. G.: Global features of the disturbance winds during storm time deduced from CHAMP observations, J. Geophys. Res., 120, 5137–5150, https://doi.org/10.1002/2015JA021302, 2015.
Xiong, C., Stolle, C., Lühr, H., Park, J., Fejer, B. G., and Kervalishvili, G. N.: Scale analysis of the equatorial plasma irregularities derived from Swarm constellation, Earth Planet. Space., 68, 1–21, https://doi.org/10.1186/s40623-016-0502-5, 2016.
Xiong, C., Xu, J., Wu, K., and Yuan, W.: Longitudinal thin structure of equatorial plasma depletions coincidently observed by swarm constellation and all-sky imager, J. Geophys. Res., 123, 1593–1602, https://doi.org/10.1002/2017JA025091, 2018.
Yang, Z., Song, S., Jiao, W., Chen, G., and Xue, J.: Ionospheric tomography based on gnss observations of the cmonoc: performance in the topside ionosphere, GPS Solutions., 21, 363–375, https://doi.org/10.1007/s10291-016-0526-0, 2016.
Zhang, R., Liu, L., Chen, Y., and Le, H.: The dawn enhancement of the equatorial ionospheric vertical plasma drift, J. Geophys. Res., 120, 10688–10697, https://doi.org/10.1002/2015JA021972, 2015.
Zhang, R., Liu, L., Le, H., and Chen, Y.: Evidence and effects of the sunrise enhancement of the equatorial vertical plasma drift in the F region ionosphere, J. Geophys. Res., 121, 4826–4834, https://doi.org/10.1002/2016JA022491, 2016.
Zheng, J., Zhao, B., Xiong, B., and Wan, W.: Spatial and temporal analysis of the total electron content over china during 2011–2014, Adv. Space Res., 57, 2470–2478, https://doi.org/10.1016/j.asr.2016.03.037, 2016.
Zhou, Y. L., Lühr, Hermann, Xiong, C., and Pfaff, R. F.: Ionospheric storm effects and equatorial plasma irregularities during the 17–18 March 2015 event, J. Geophys. Res., 121, 9146–9163, https://doi.org/10.1002/2016JA023122, 2016.