the Creative Commons Attribution 4.0 License.
the Creative Commons Attribution 4.0 License.
 | 15 Dec 2020
Estimating the maximum of the smoothed highest 3-hourly aa index in 3 d by the preceding minimum for the solar cycle
Predicting the maximum intensity of geomagnetic activity for an upcoming solar cycle is important in space weather service and for planning future space missions. This study analyzed the highest and lowest 3-hourly aa index (aaH∕aaL) in a 3 d interval, smoothed by 363 d to analyze their variation with the 11-year solar cycle. It is found that the maximum of aaH () is well correlated with the preceding minimum of either aaH (, r=0.85) or aaL (, r=0.89) for the solar cycle. Based on these relationships, the intensity of for solar cycle 25 is estimated to be (nT), about 29 % stronger than that of solar cycle 24. This value is equivalent to the ap index of (nT) if employing the high correlation between ap and aa (r=0.93). The maximum of aaL () is also well correlated with the preceding (r=0.80). The maximum amplitude of the sunspot cycle (Rm) is much better correlated with high geomagnetic activity (, r=0.79) than with low geomagnetic activity (, r=0.37). The rise time from to is weakly anti-correlated to the following (). Similar correlations are also found for the 13-month smoothed monthly mean aa index. These results are expected to be useful in understanding the geomagnetic activity intensity of solar cycle 25.
- Article
(2082 KB) - Full-text XML
- BibTeX
- EndNote


Studying and predicting geomagnetic activity are important in both geophysics and space weather. Severe geomagnetic activity may cause intense geomagnetic storms (Gonzalez et al., 1989, 1994; Chen et al., 2019), leading to disruptions in communication and deviations of orbital motions of satellites (Yoshida and Yamagishi, 2010; Petrovay, 2020). Now that the old solar cycle 24 is over, satellite and spacecraft-related departments want to know the maximum intensity of both solar and geomagnetic activity in the new solar cycle 25 for planning future space missions.
Among various indices to quantitatively describe geomagnetic activity, the aa index (Mayaud, 1972), derived from the 3-hourly K index at two near-antipodal midlatitude stations in England and Australia, is the longest time series (since 1868) and has been widely used to analyze the long-term trend of global geomagnetic activity (Russell and Mulligan, 1995; Marat et al., 2017; Du, 2011b; El-Borie et al., 2019) and its correlation with both climate change (Cliver et al., 1998; Dobrica et al., 2009; Gavrilyeva et al., 2017) and solar activity (Echer et al., 2004; Prestes et al., 2006; Lukianova et al., 2009; Du, 2011a, c; Du and Wang, 2012a; Singh and et al., 2019). The minimum aa index (aamin), at or near the minimum of the solar cycle, has been widely used to predict the maximum amplitude of the sunspot cycle (Rm), the so-called Ohl's precursor method (Brown and Williams, 1969; Ohl and Ohl, 1979; Du et al., 2009). But it is seldom used to directly predict the maximum aa index (aamax) of an ensuing solar cycle.
The planetary geomagnetic index Ap (available since 1932, Bartels, 1963), derived from the average of the measurements at 13 observatories around the globe, is a daily measure of the response of geomagnetic field to variations in the interplanetary magnetic field (IMF) and the solar wind (Li, 1997; McPherron, 1999; Tsurutani et al., 2006). It is the main global magnetic index forecasted by government agencies (McPherron, 1999). Most works on forecasting the geomagnetic activity have been over short intervals, on the order of hours or days (McPherron, 1999; Abunina et al., 2013). In the earlier years, Kane (1988) pointed out that it is impossible to forecast long-term geomagnetic activity through analyzing the daily, monthly, and annual Ap and aa indices. Gordon (2015) demonstrated that long-term geomagnetic activity can only be predicted to within a limited threshold of accuracy due to the irregular trends and cycles in the annual data and nonlinear variability in the monthly series, through analyzing the aa index.
In this study, we analyze the relationship between the maximum aa index and its preceding minimum for the 11-year solar cycle. The data and parameters used in this study are described in Sect. 2. We find out the highest and lowest 3-hourly aa index (aaH∕aaL) in each 3 d interval, smoothed by 363 d (121 points) to analyze their variation with the solar cycle. In Sect. 3, it is found that the maximum of aaH () is well correlated with the preceding minimum of either aaH () or aaL () for the solar cycle (Sect. 3.1), which can be used to estimate the intensity of for solar cycle 25. The maximum of aaL () is also found to be well correlated with the preceding (Sect. 3.2). The rise time from to is only weakly anti-correlated to the following (Sect. 3.3). Using the relationship between ap and aa, the maximum intensity of the ap index for solar cycle 25 is estimated (Sect. 3.4). Similar correlations are analyzed using the 13-month smoothed (with half weight at the two ends) monthly mean aa index (Sect. 4). Some conclusions are discussed and summarized in Sect. 5.
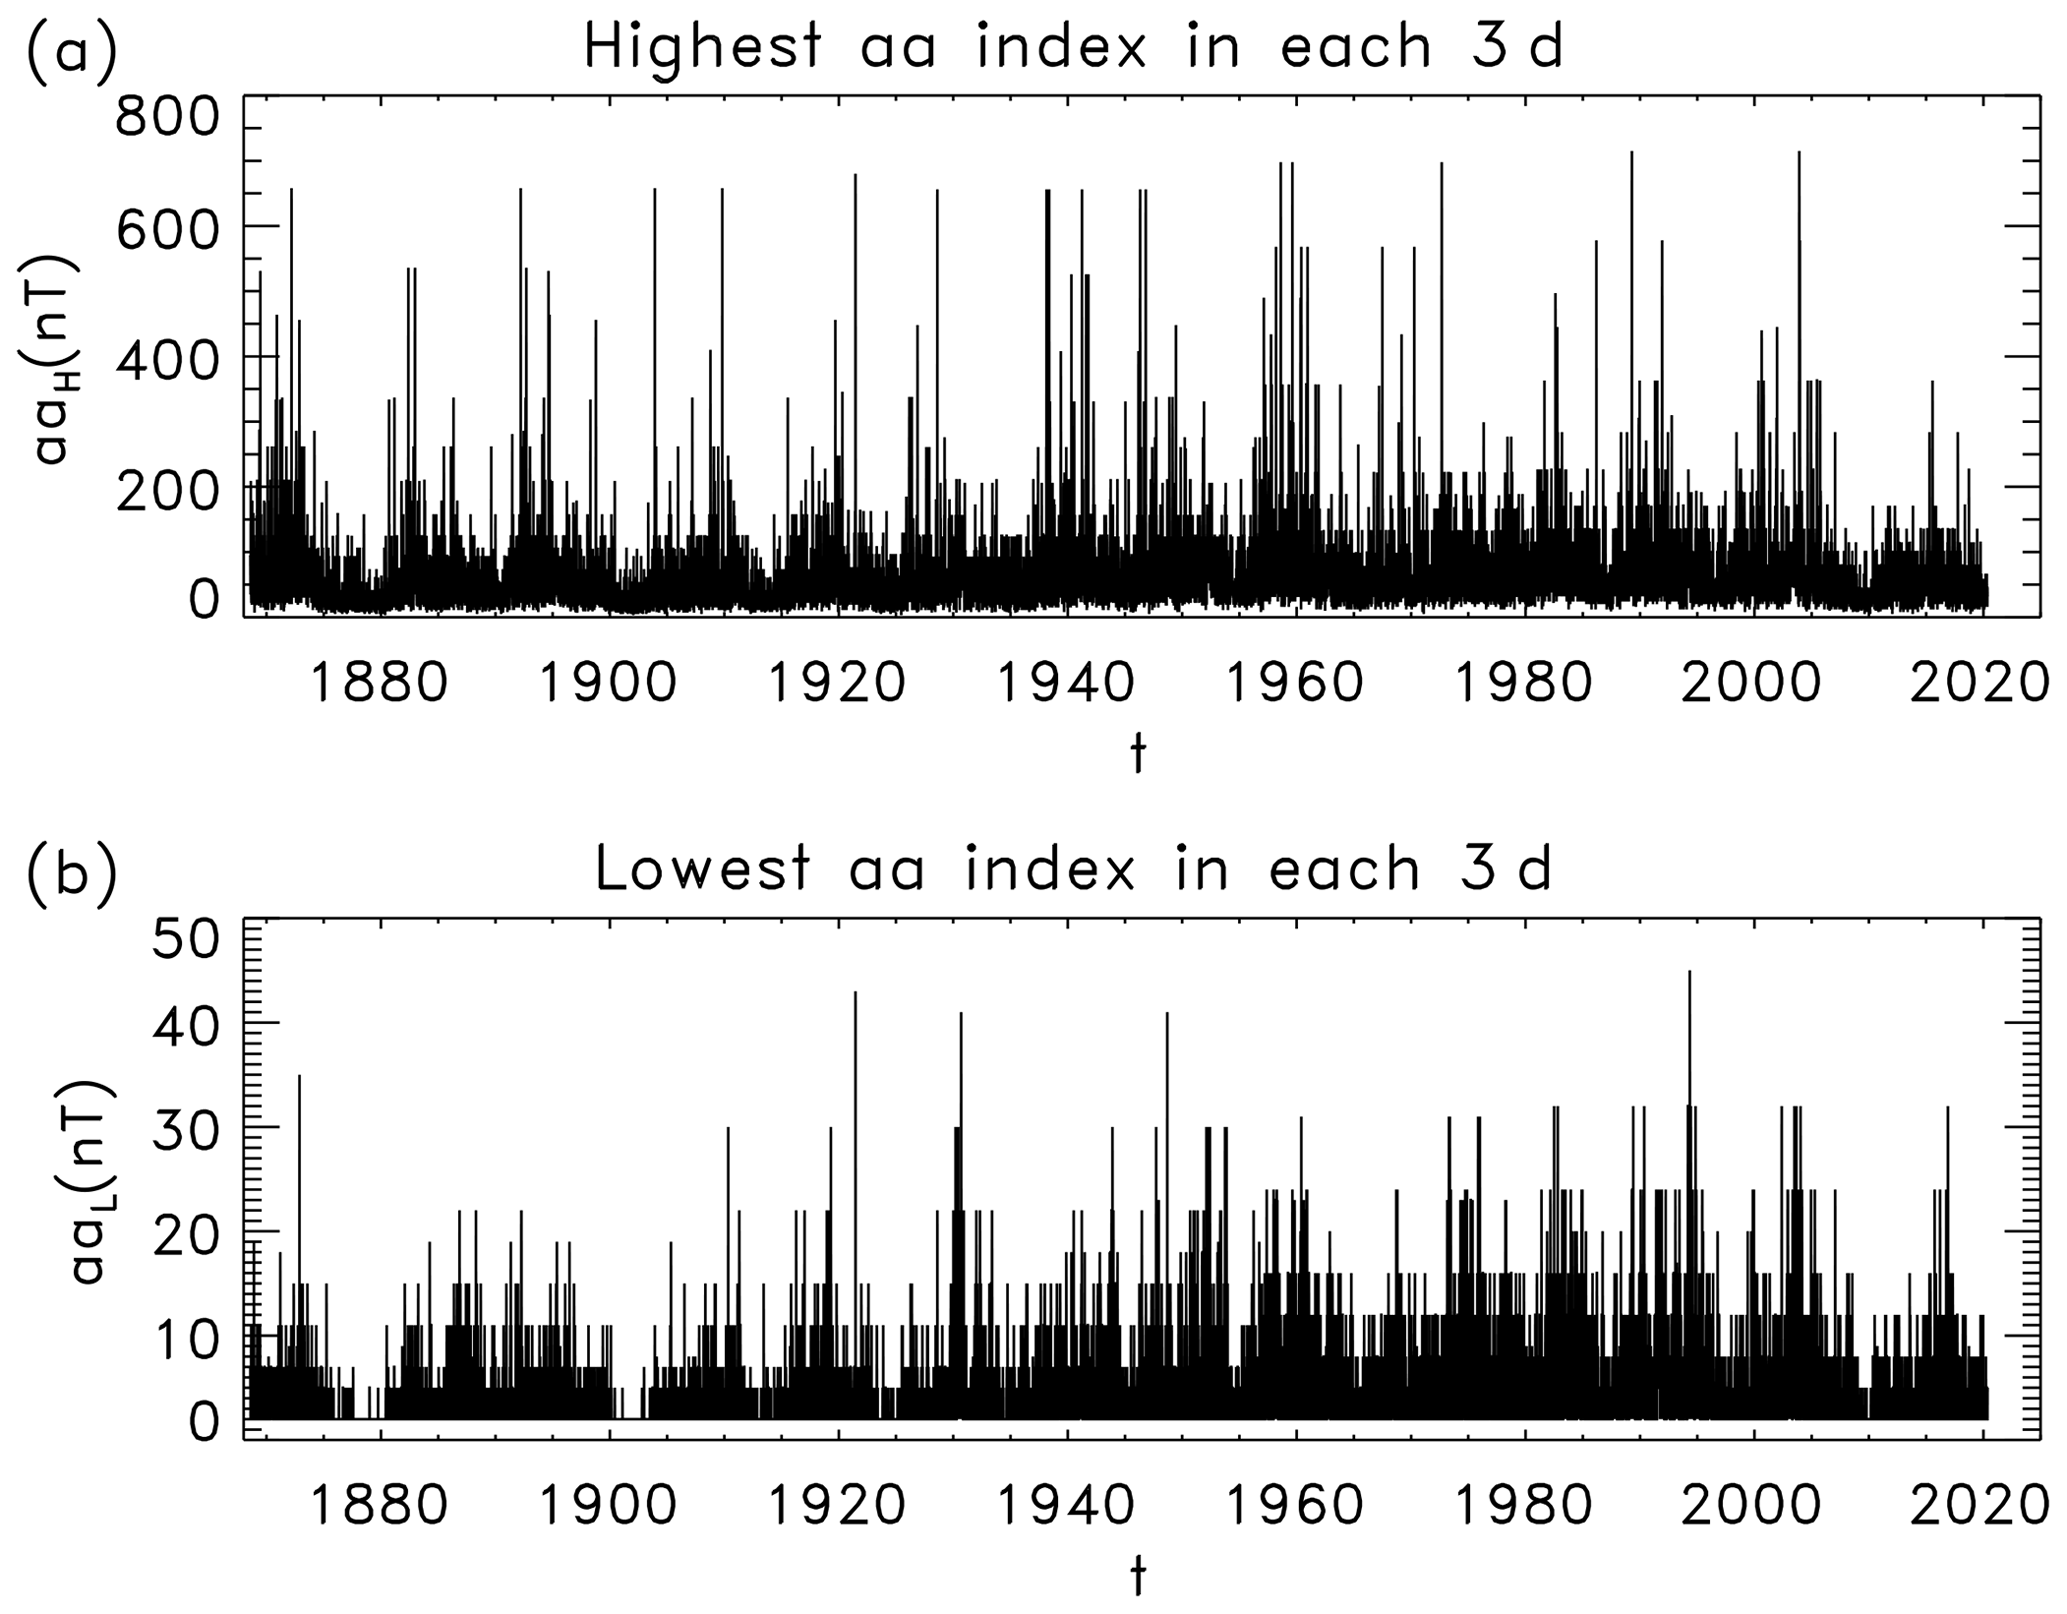
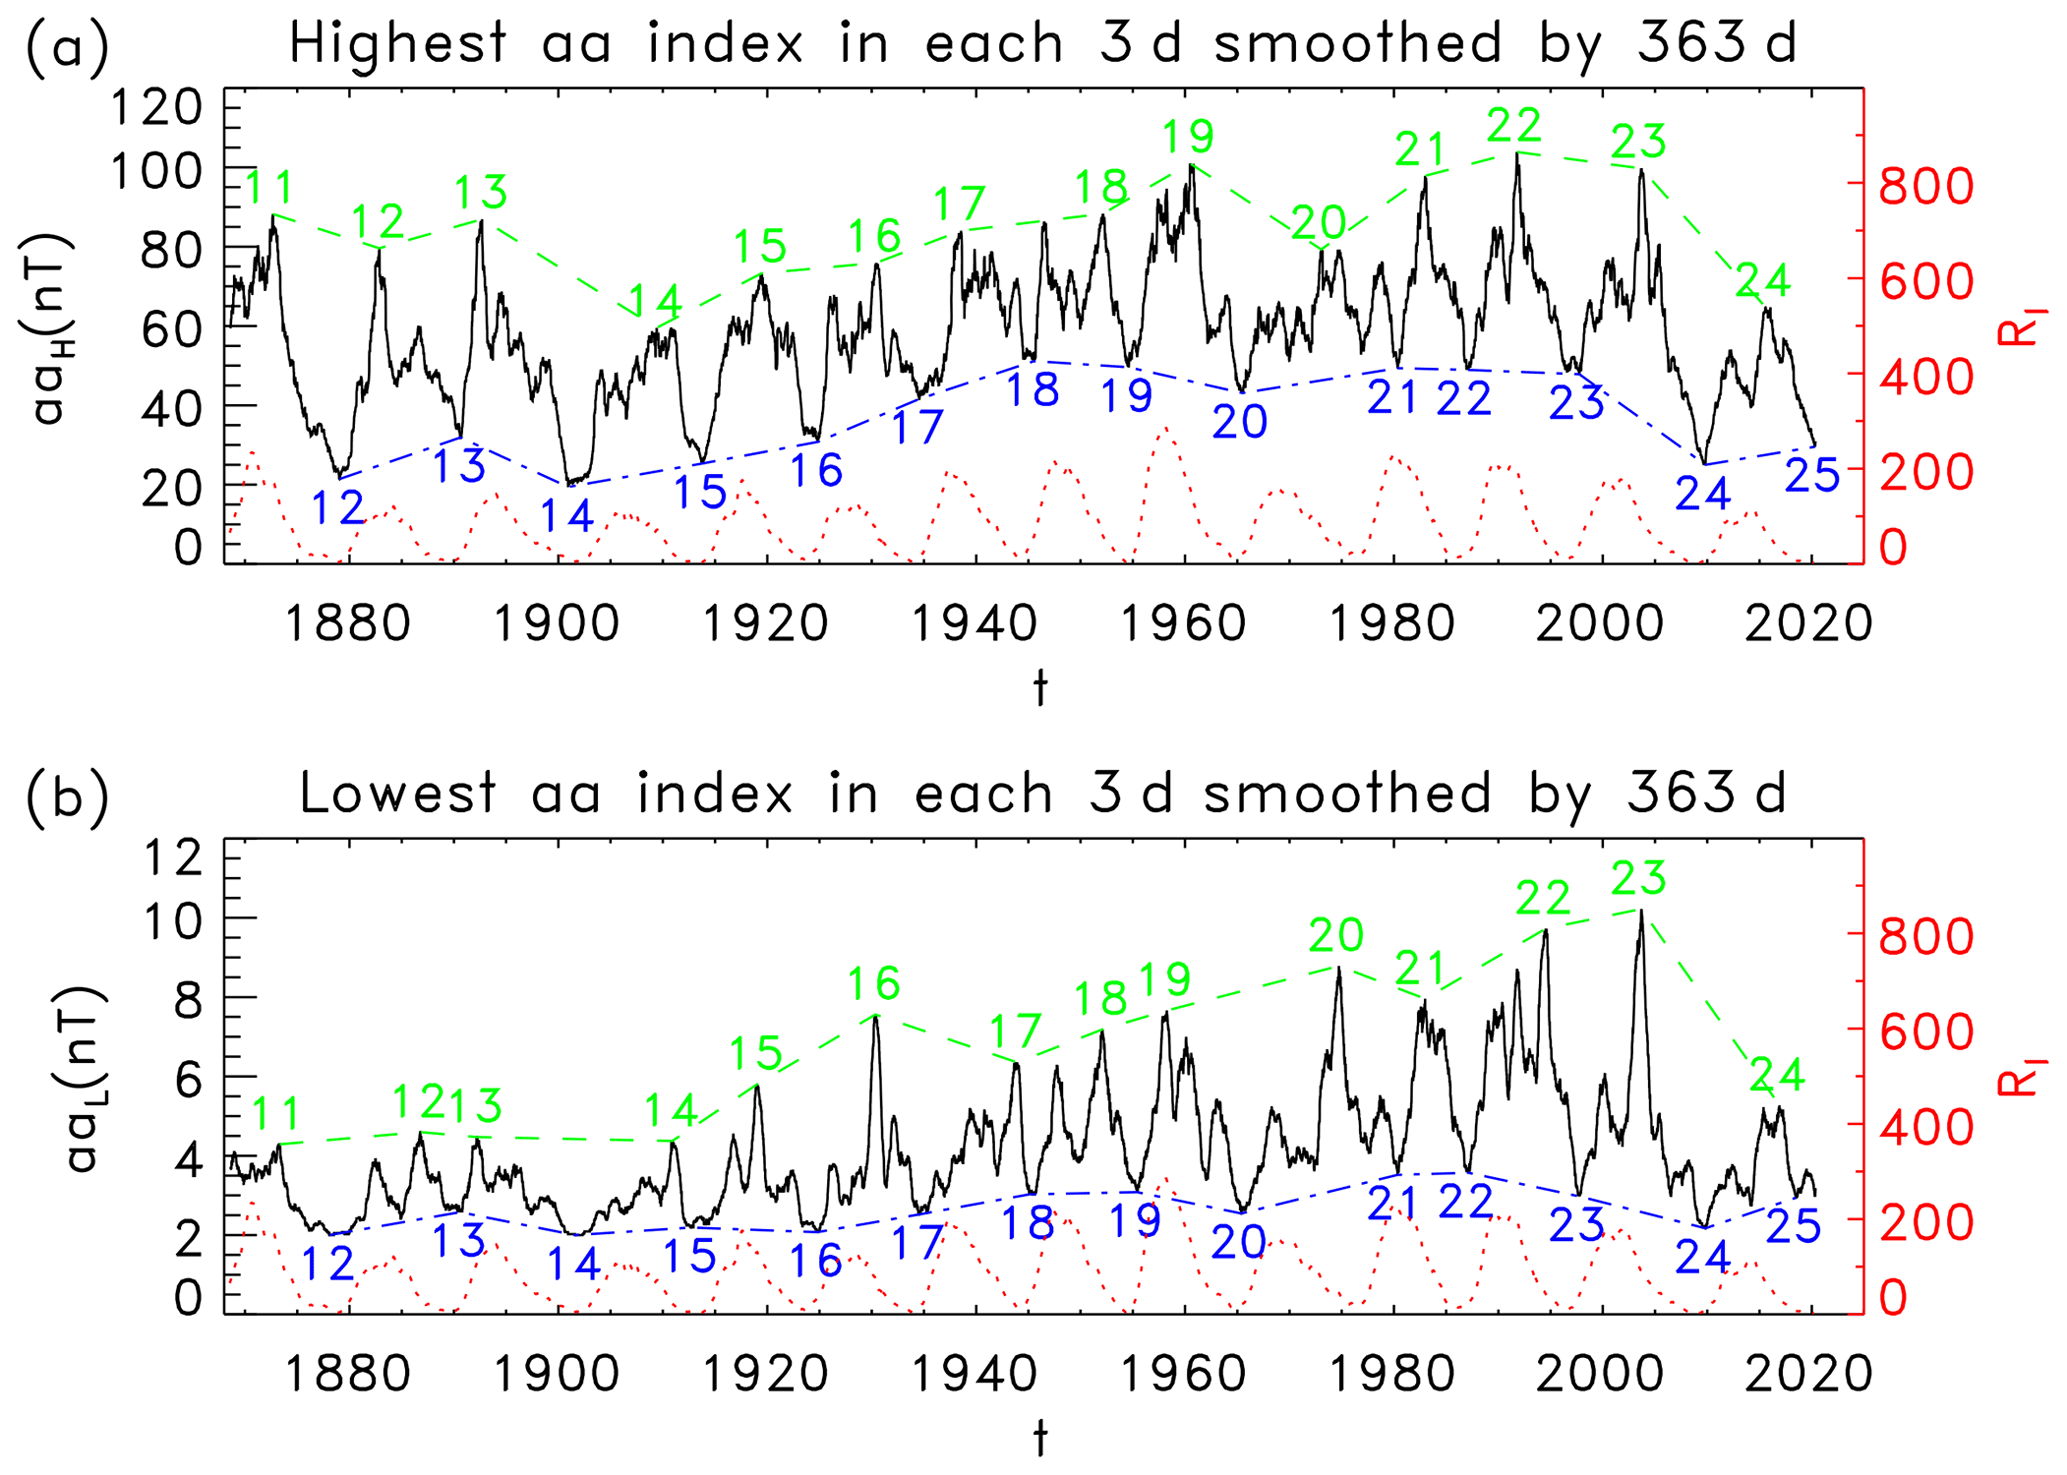
Figure 2(a) The highest (aaH) and (b) lowest (aaL) 3-hourly aa index in each 3 d (black solid), smoothed by 121 points (363 d). The numbers in the figure represent the 11-year solar cycles. The upper dashed and lower dashed–dotted lines indicate the maxima and minima, respectively, of the solar cycle. The dotted red line shows the 13-month smoothed monthly mean sunspot number (RI) for comparison.
We use the 3-hourly aa index (in units of nT) since 1 January 1868 (updated to 10 October 2020) from the International Service of Geomagnetic Indices (ISGI; http://isgi.unistra.fr/, last access: 10 October 2020). We find out the highest and lowest aa index (aaH∕aaL) from 24 values of the 3-hourly aa index in each 3 d interval, as shown in Fig. 1. The values of aaH are in the range [5, 715] nT, and those of aaL are in the range [2, 45] nT.
It is seen in the figure that both aaH and aaL vary dramatically: the average absolute differences of the adjacent values are 36.7 and 2.5 nT, respectively. It is hard to see the variation in aaH or aaL with the solar cycle. In particular, most (63 %) values of aaL are the minimum (2 nT). In order to analyze the long-term trend of aa with the solar cycle conventionally represented by the 13-month smoothed monthly mean sunspot number, both aaH and aaL are smoothed by w=121 points (363 d) using the following running smoothing technique:
for x=aaH and aaL (N0=18600). There are data points left after removing the (w−1) incomplete smoothing points at the two ends of the series, as shown in Fig. 2 (solid). The smoothed monthly mean (w=13 months with half weight at the two ends) international sunspot number series (RI; Clette et al., 2016),
of the second version (http://www.sidc.be/silso/datafiles, last access: 10 October 2020) is used for comparison (dotted), where R represents the (non-smoothed) monthly value (Petrovay, 2020). The smoothing width is selected to be w=121 points (363 d) as it is close to that (1 year = 12 months) used in the smoothing of RI.
Table 1The minimum () and maximum () of the 363 d smoothed highest 3-hourly aa index (aaH) in each 3 d, the rise time from to (Tr), the minimum () and maximum () of 363 d smoothed lowest 3-hourly aa index (aaL) in each 3 d, and the maximum (Rm) of 13-month smoothed monthly mean RI for solar cycles 11–25.

In panel a of the figure, the dashed (dashed–dotted) line indicates the maximum (minimum) of aaH, (). In panel b, the dashed (dashed–dotted) line indicates the maximum (minimum) of aaL, (). The value of () is the maximum of aaH (aaL) during the time period between two adjacent solar cycle minima (Rmin) determined by the smoothed monthly mean RI. The value of () is the minimum of aaH (aaL) during the time period between two adjacent maxima, (). These parameters are displayed in Table 1, in which Tr is the rise time from to and Rm the maximum of RI for the 11-year solar cycle. The last row denotes the averages of the parameters.
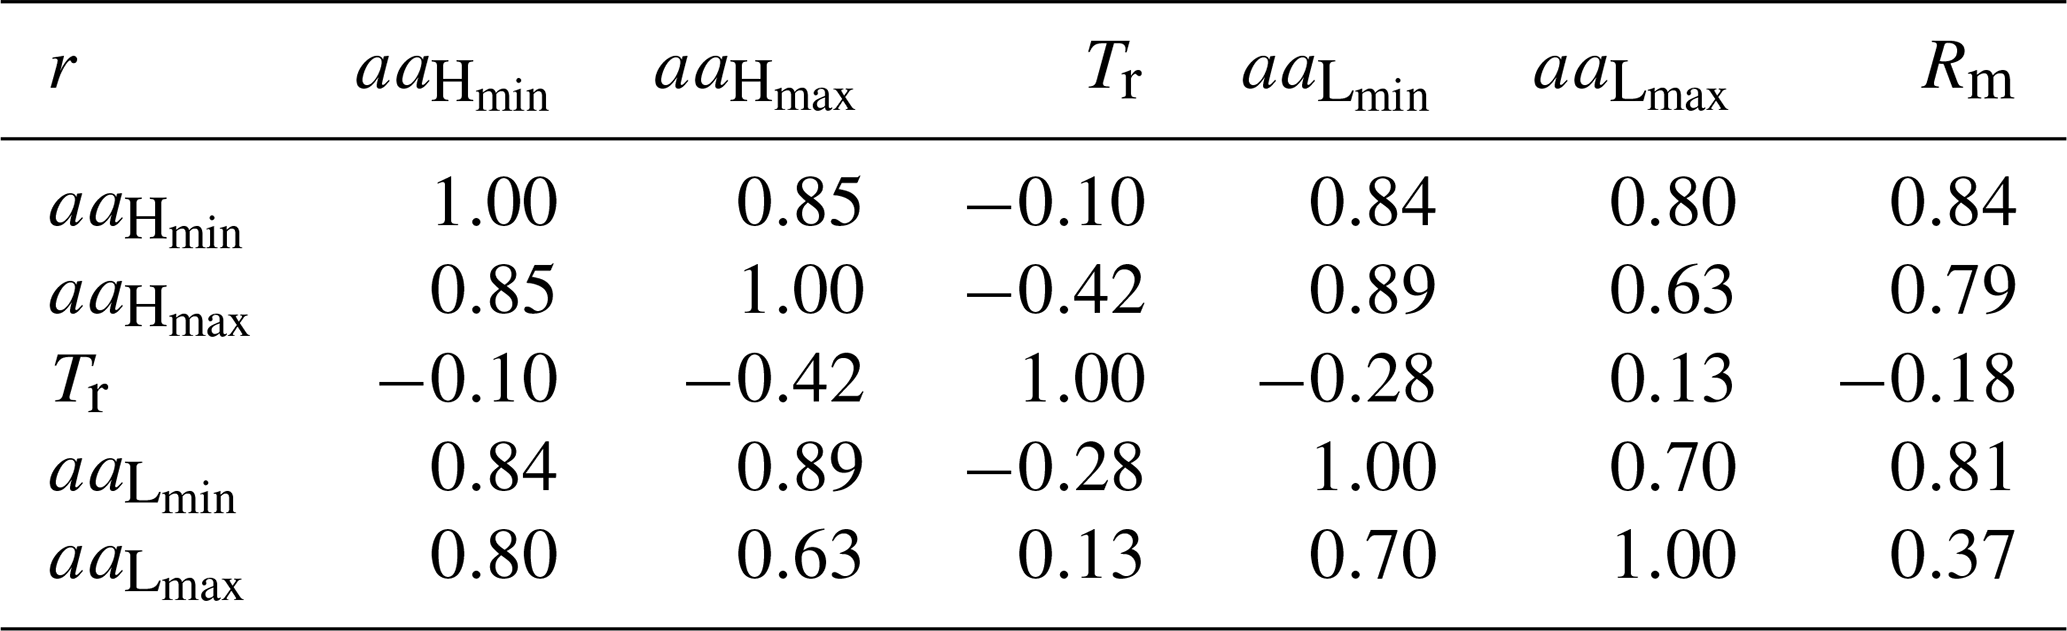
The correlation coefficients between the parameters in Table 1 are listed in Table 2 for comparison. It is seen in Table 2 that Rm is well correlated with (r=0.84), (r=0.79), and (r=0.81) and positively correlated with (r=0.37). This implies that the stronger the solar activity (RI), the higher the geomagnetic activity (aa). But the maximum amplitude of sunspot cycle (Rm) is much better correlated with high geomagnetic activity (, r=0.79) than with low geomagnetic activity (, r=0.37), implying that low geomagnetic activity depends less on the solar activity than the high one does. The correlation between Rm and (), r=0.84 (0.81), is related to Ohl's precursor method (Ohl and Ohl, 1979) for predicting Rm. Some other correlations are analyzed to estimate (Sect. 3.1), (Sect. 3.2), and Tr (Sect. 3.3).
Table 2Correlation coefficients between the parameters in Table 1.
3.1 Relationship between and its preceding
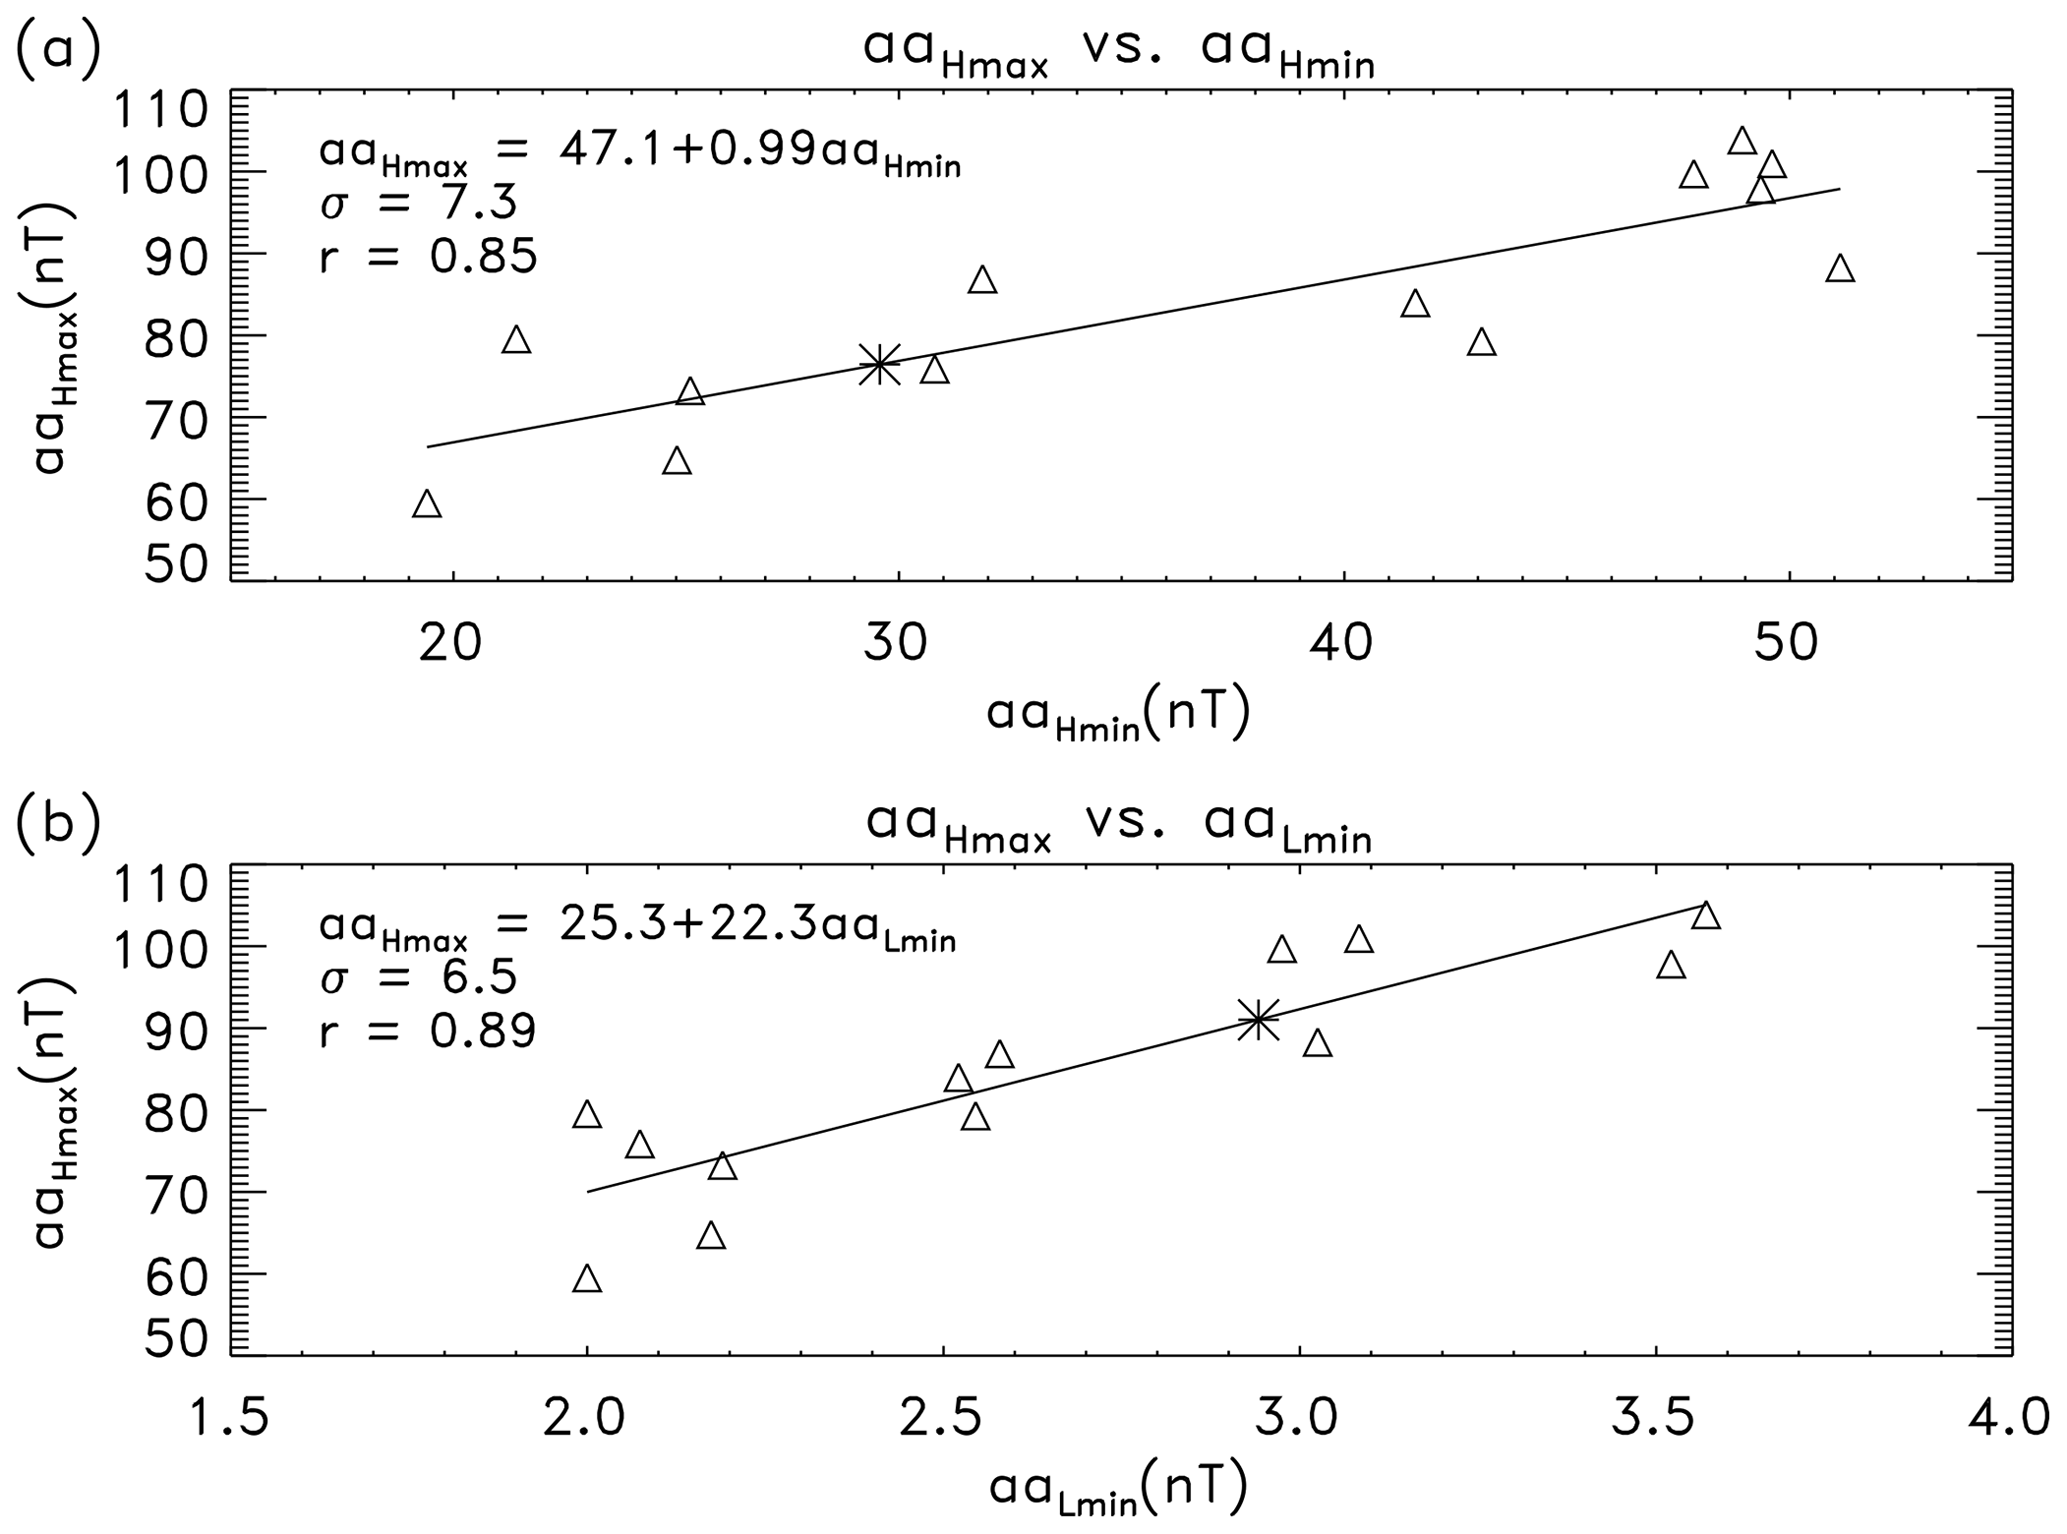
One can see in Table 2 that is well correlated with its preceding (r=0.85) and (r=0.89), as shown in Fig. 3 for the scatter plots of against (a) and (b). The solid lines represent the linear fits of to and with the least-squares fit regression equations given by
where ± indicates the 1σ deviation of the fitting coefficient, and σ is the standard deviation of the regression.
Based on the above relationships, the minimum aa index (around the solar minimum) can be used as an indicator to estimate the following maximum. One can estimate for solar cycle 25 by substituting the values of (29.57 nT) and (2.94 nT) into the above equations,
(labeled by asterisks in Fig. 3a and b). Since these values are derived by the fitting equations (Eq. 3) with similar correlation coefficients (0.85 and 0.89), we take their average,
as an estimate of . It implies that the 363 d smoothed highest 3-hourly aa index in a 3 d interval during the maximum period of solar cycle 25 is estimated to be close to the average (84.46 nT) over the past cycles (Table 1) but higher than that (64.81 nT) of solar cycle 24 by about 29.2 %.
It should be pointed out that the above estimate may be an upper limit of as the values of and may not be finally determined (refer to Discussion in Sect. 5). Although we are not quite sure if the current aaH (aaL), 30.69 (3.13) in April 2020, would decrease to a smaller value than that (29.57 (2.94)) used in the current work, there would not be significant variations in , aaLmiin, and the above estimate because solar cycle 25 (in terms of the smoothed monthly mean RI) already started (December 2019) a few months ago.
3.2 Relationship between and the preceding
One can also see in Table 2 that is well correlated with the preceding (r=0.80) or (r=0.70). Figure 4a shows the scatter plot of against . The linear fitting equation of to (solid) is
Substituting (nT) into this equation, one can estimate the 363 d smoothed lowest 3-hourly aa index in a 3 d interval during the maximum period of solar cycle 25, (nT). This value is slightly lower than the average (6.73 nT) over the past cycles but higher than that (5.27 nT) of solar cycle 24 by 12.0 %.
3.3 Relationship between the rise time and the following maximum
Now, we analyze if the rise time of the aa geomagnetic index for the solar cycle is correlated with the following maximum so that it can be used to estimate the rise time, as is often the case in the solar (sunspot) cycle (Waldmeier, 1939).
Figure 4b shows the scatter plot of the rise time (Tr) from to for the solar cycle against its following maximum (). The solid line indicates the linear fit of Tr to by
The anti-correlation coefficient between Tr and , (at a confidence level of about 84 %), is so weak that it can hardly be used to estimate the rise time (Tr). If the rise time is computed from the minimum (Rmin) of the sunspot cycle to , the correlation is even weaker, .
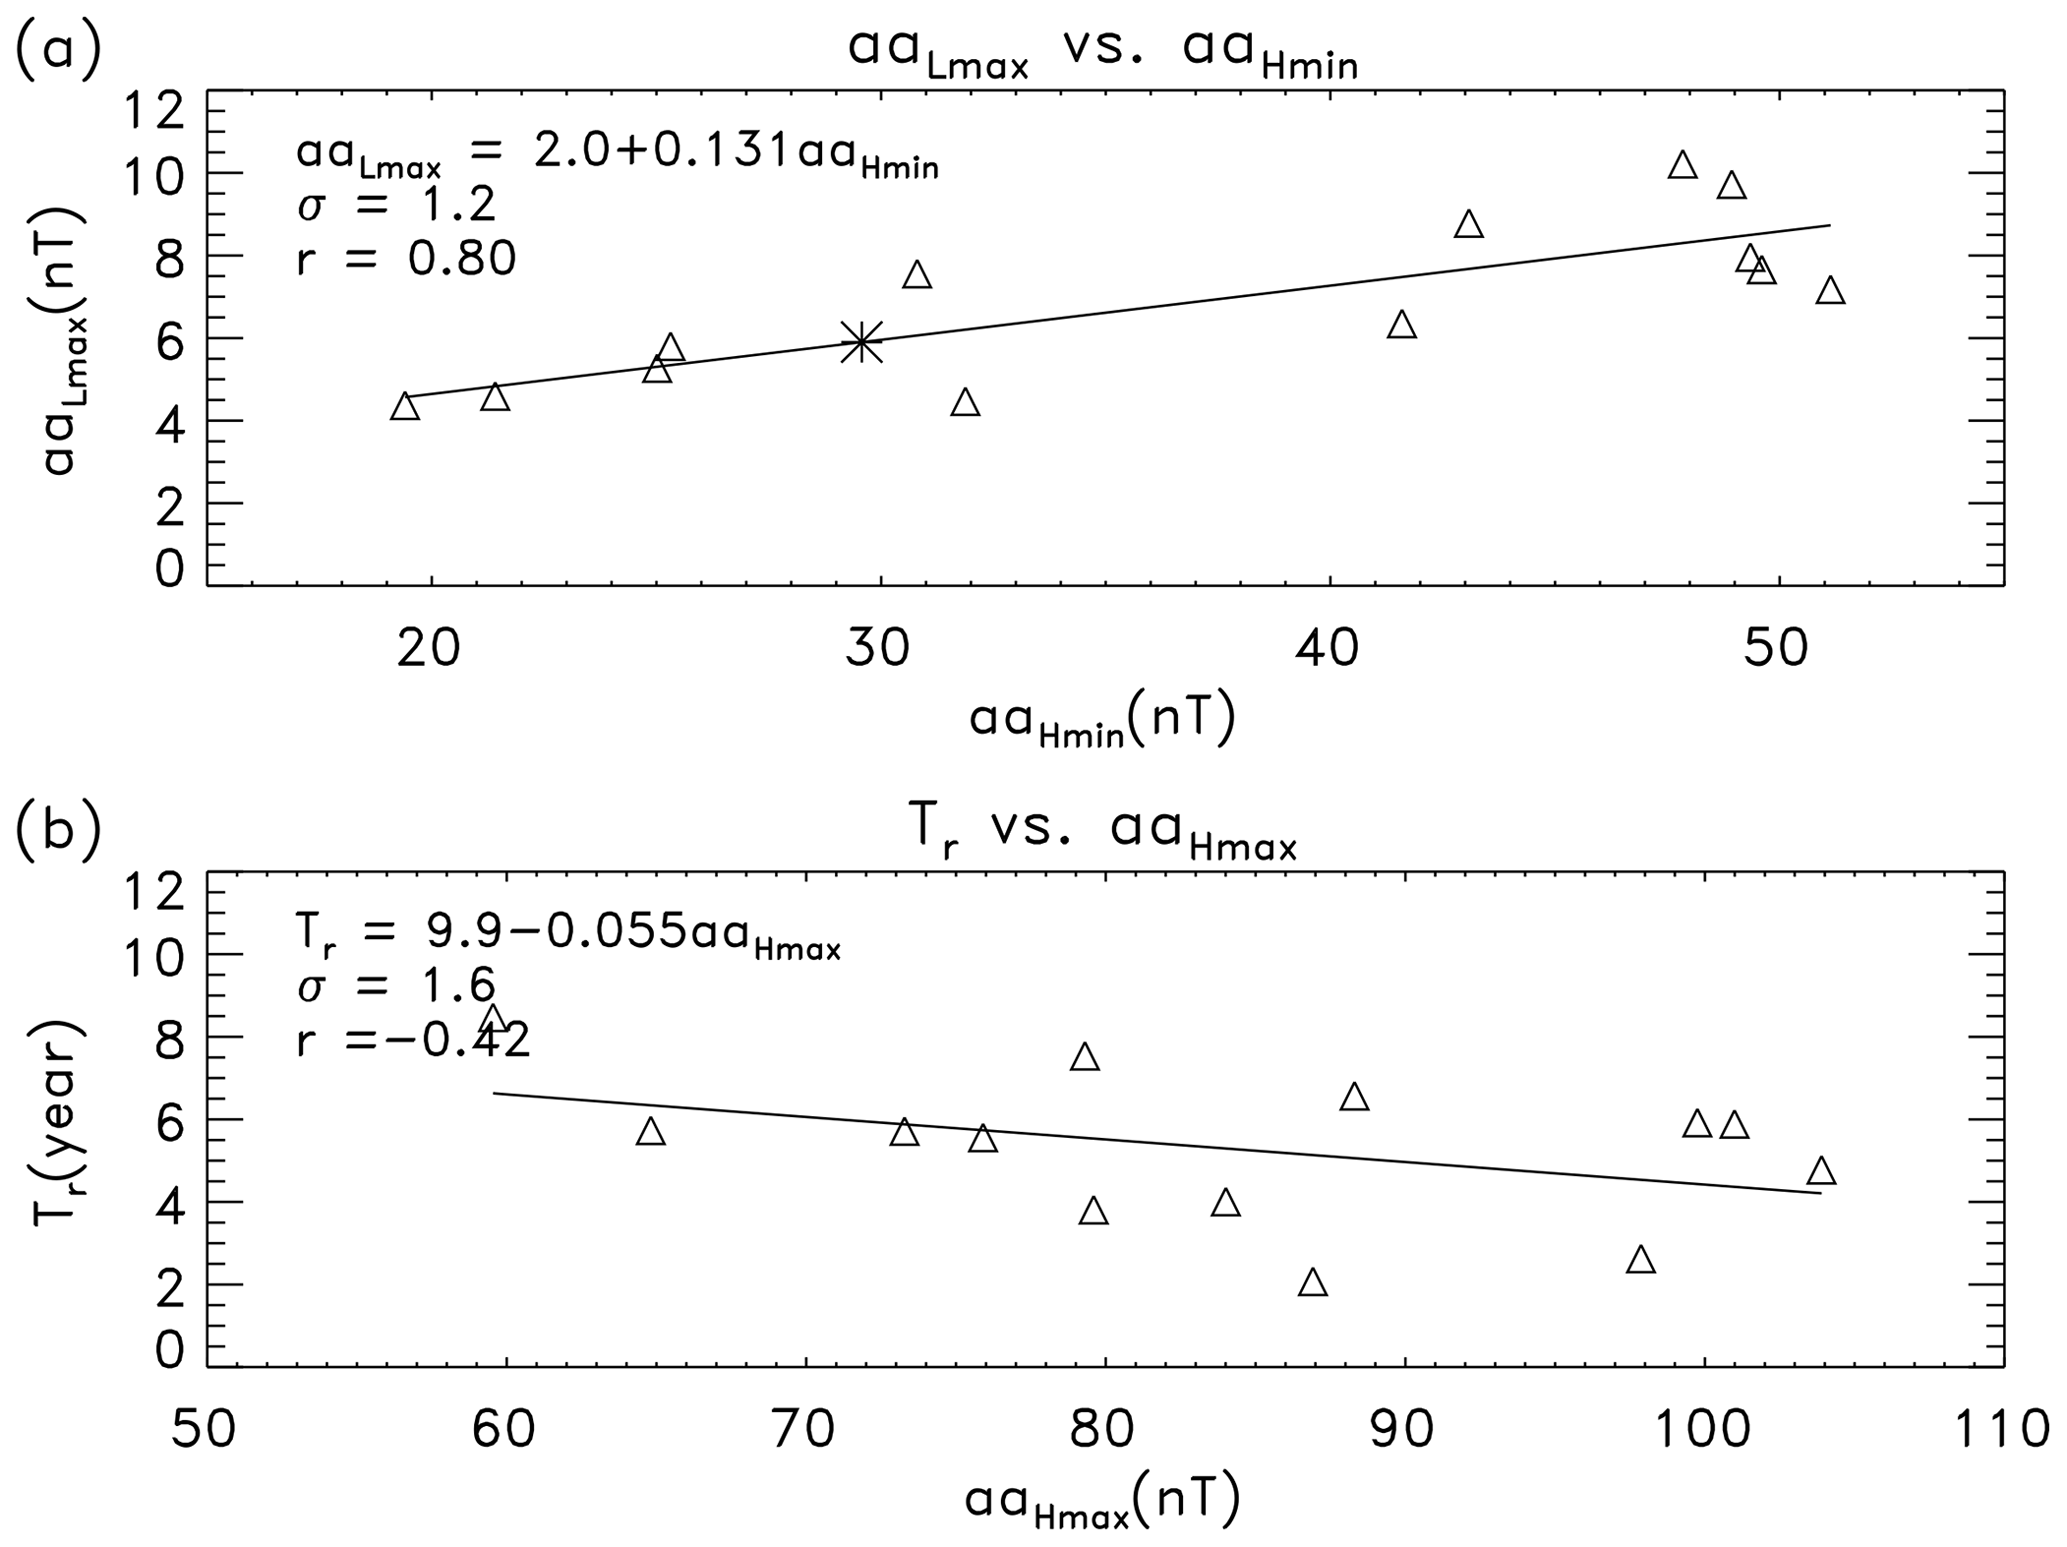
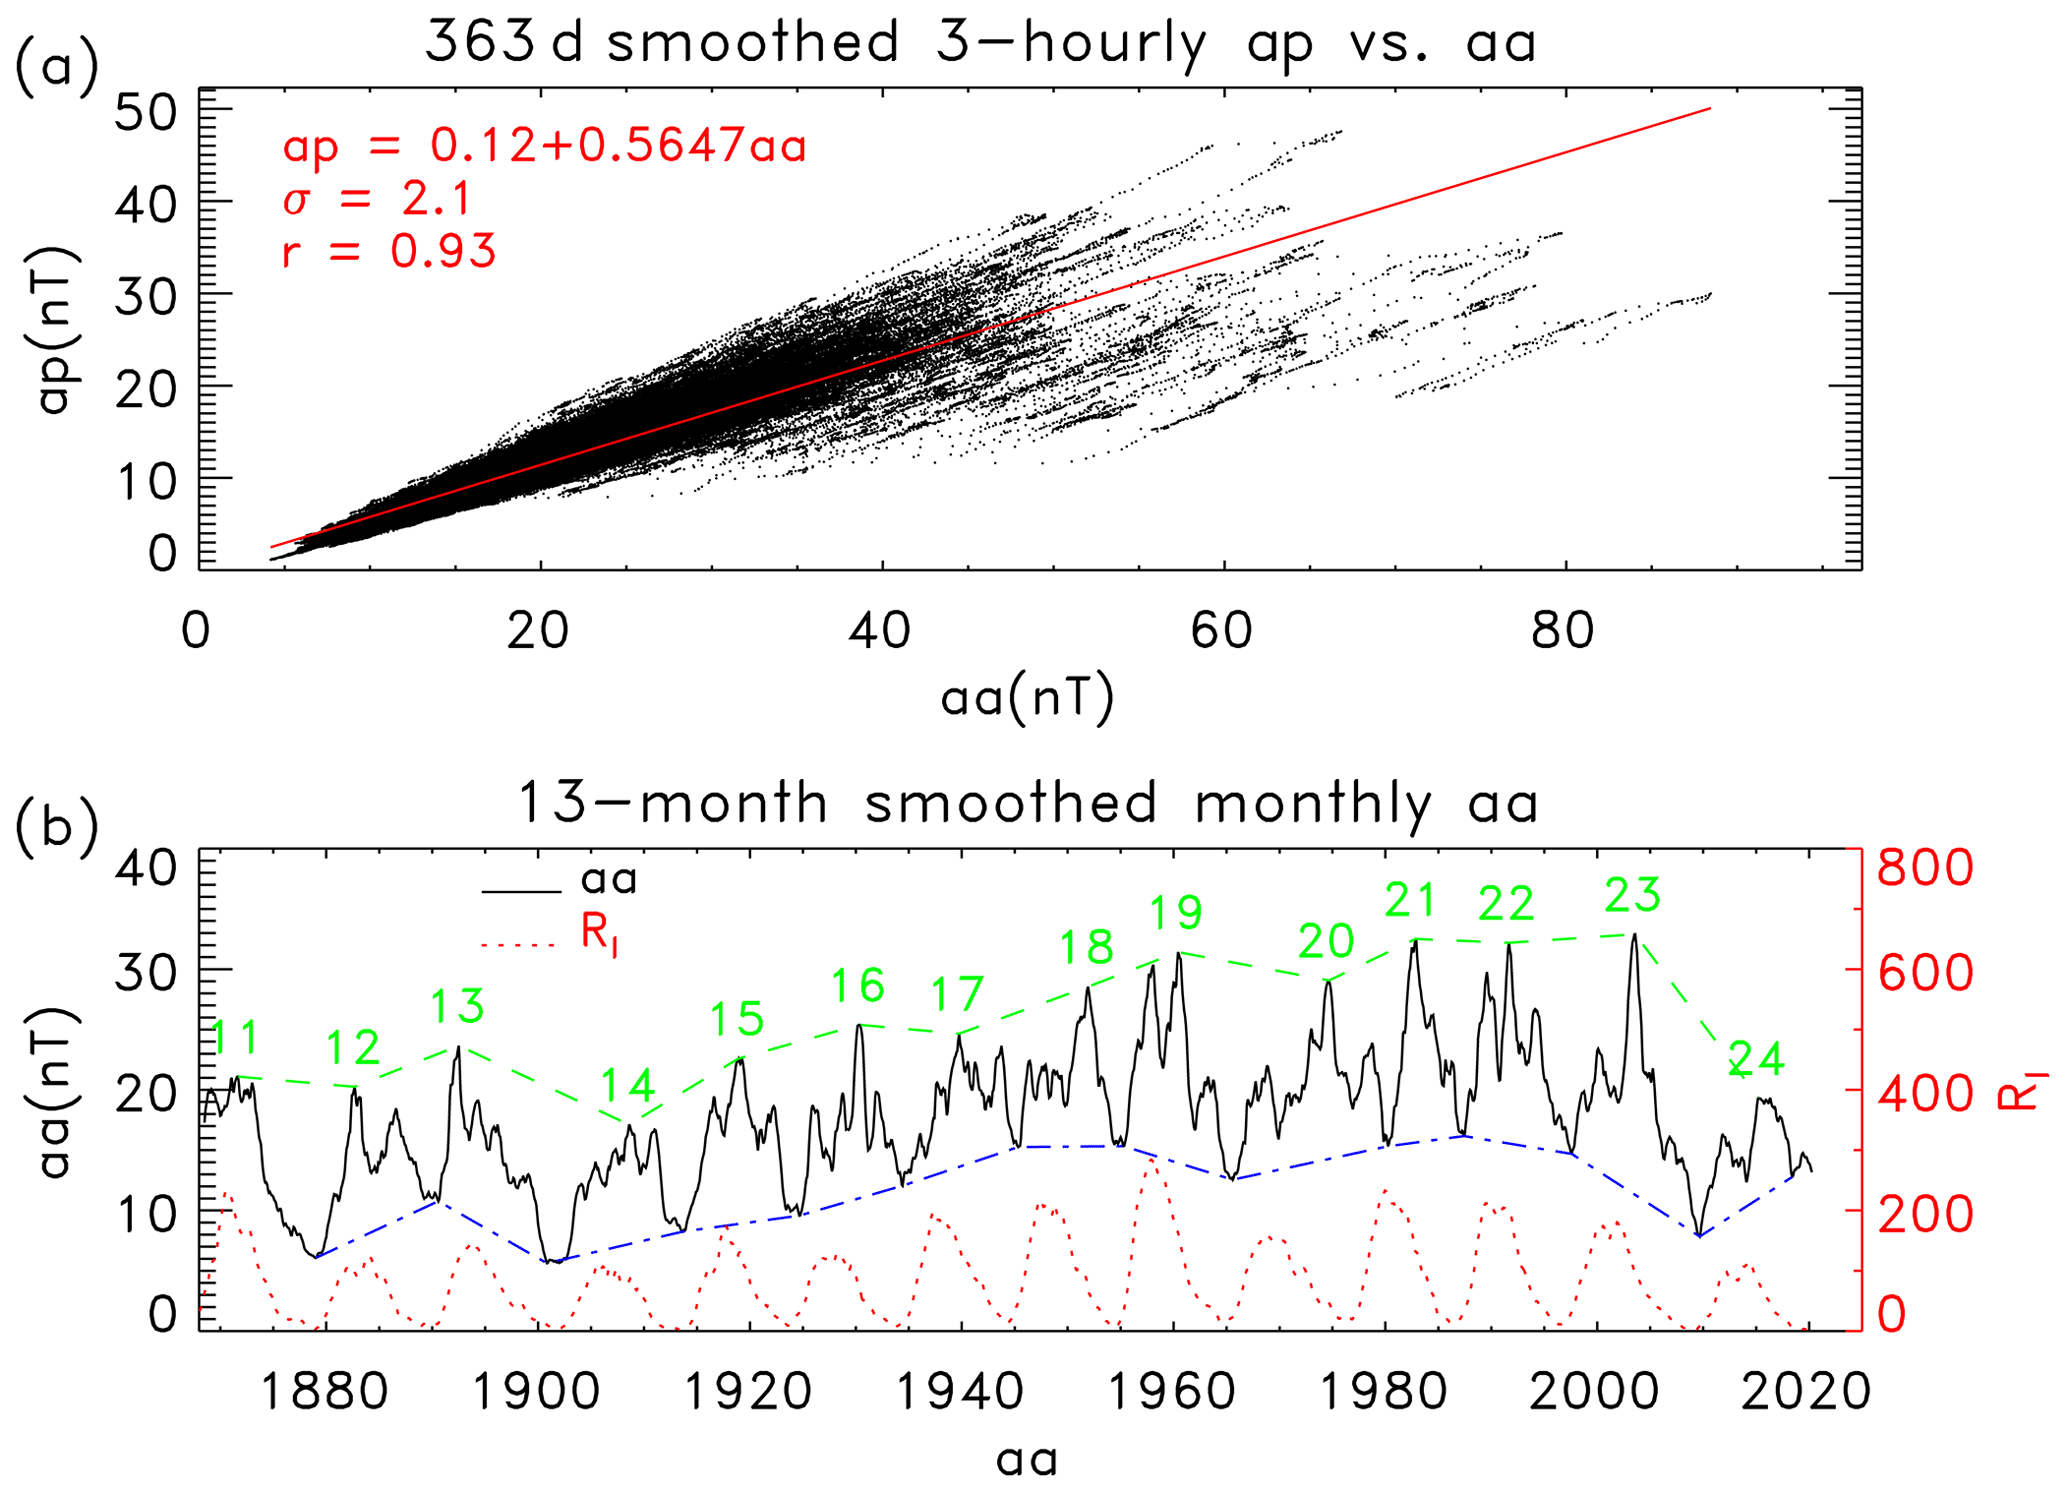
Figure 5(a) Scatter plot of the 363 d smoothed 3-hourly ap against aa (dots) and the linear fit (solid). (b) The 13-month smoothed monthly mean aa (solid) and RI (dotted). The numbers in the figure indicate the solar cycles. The upper dashed and lower dashed–dotted lines indicate the maximum (aamax) and minimum (aamin) of aa, respectively, for the solar cycle.
3.4 Relationship between ap and aa
Another important index often used to evaluate geomagnetic activity is the ap index (https://www.gfz-potsdam.de/en/kp-index, last access: 30 April 2018). Similar correlations as those for the aa index can also be obtained. But the ap index is available only from 1932 to April 2018. In this section, we employ the relationship between ap and aa to estimate the maximum intensity of the ap index for solar cycle 25 from the previous result. Figure 5a shows the scatter plot of the 363 d smoothed 3-hourly ap against aa (dots). The solid line represents the linear fit of ap to aa by
It is obvious that ap is highly correlated with aa, r=0.93, as they are based on the same observations.
According to this equation, the estimated (nT) in Sect. 3.1 is equivalent to (nT), in which ±3.9 is derived from the uncertainty (±6.9) of , ±2.1 is the standard deviation of the regression, and .
Table 3Parameters of the 13-month smoothed monthly mean aa for the solar cycle.
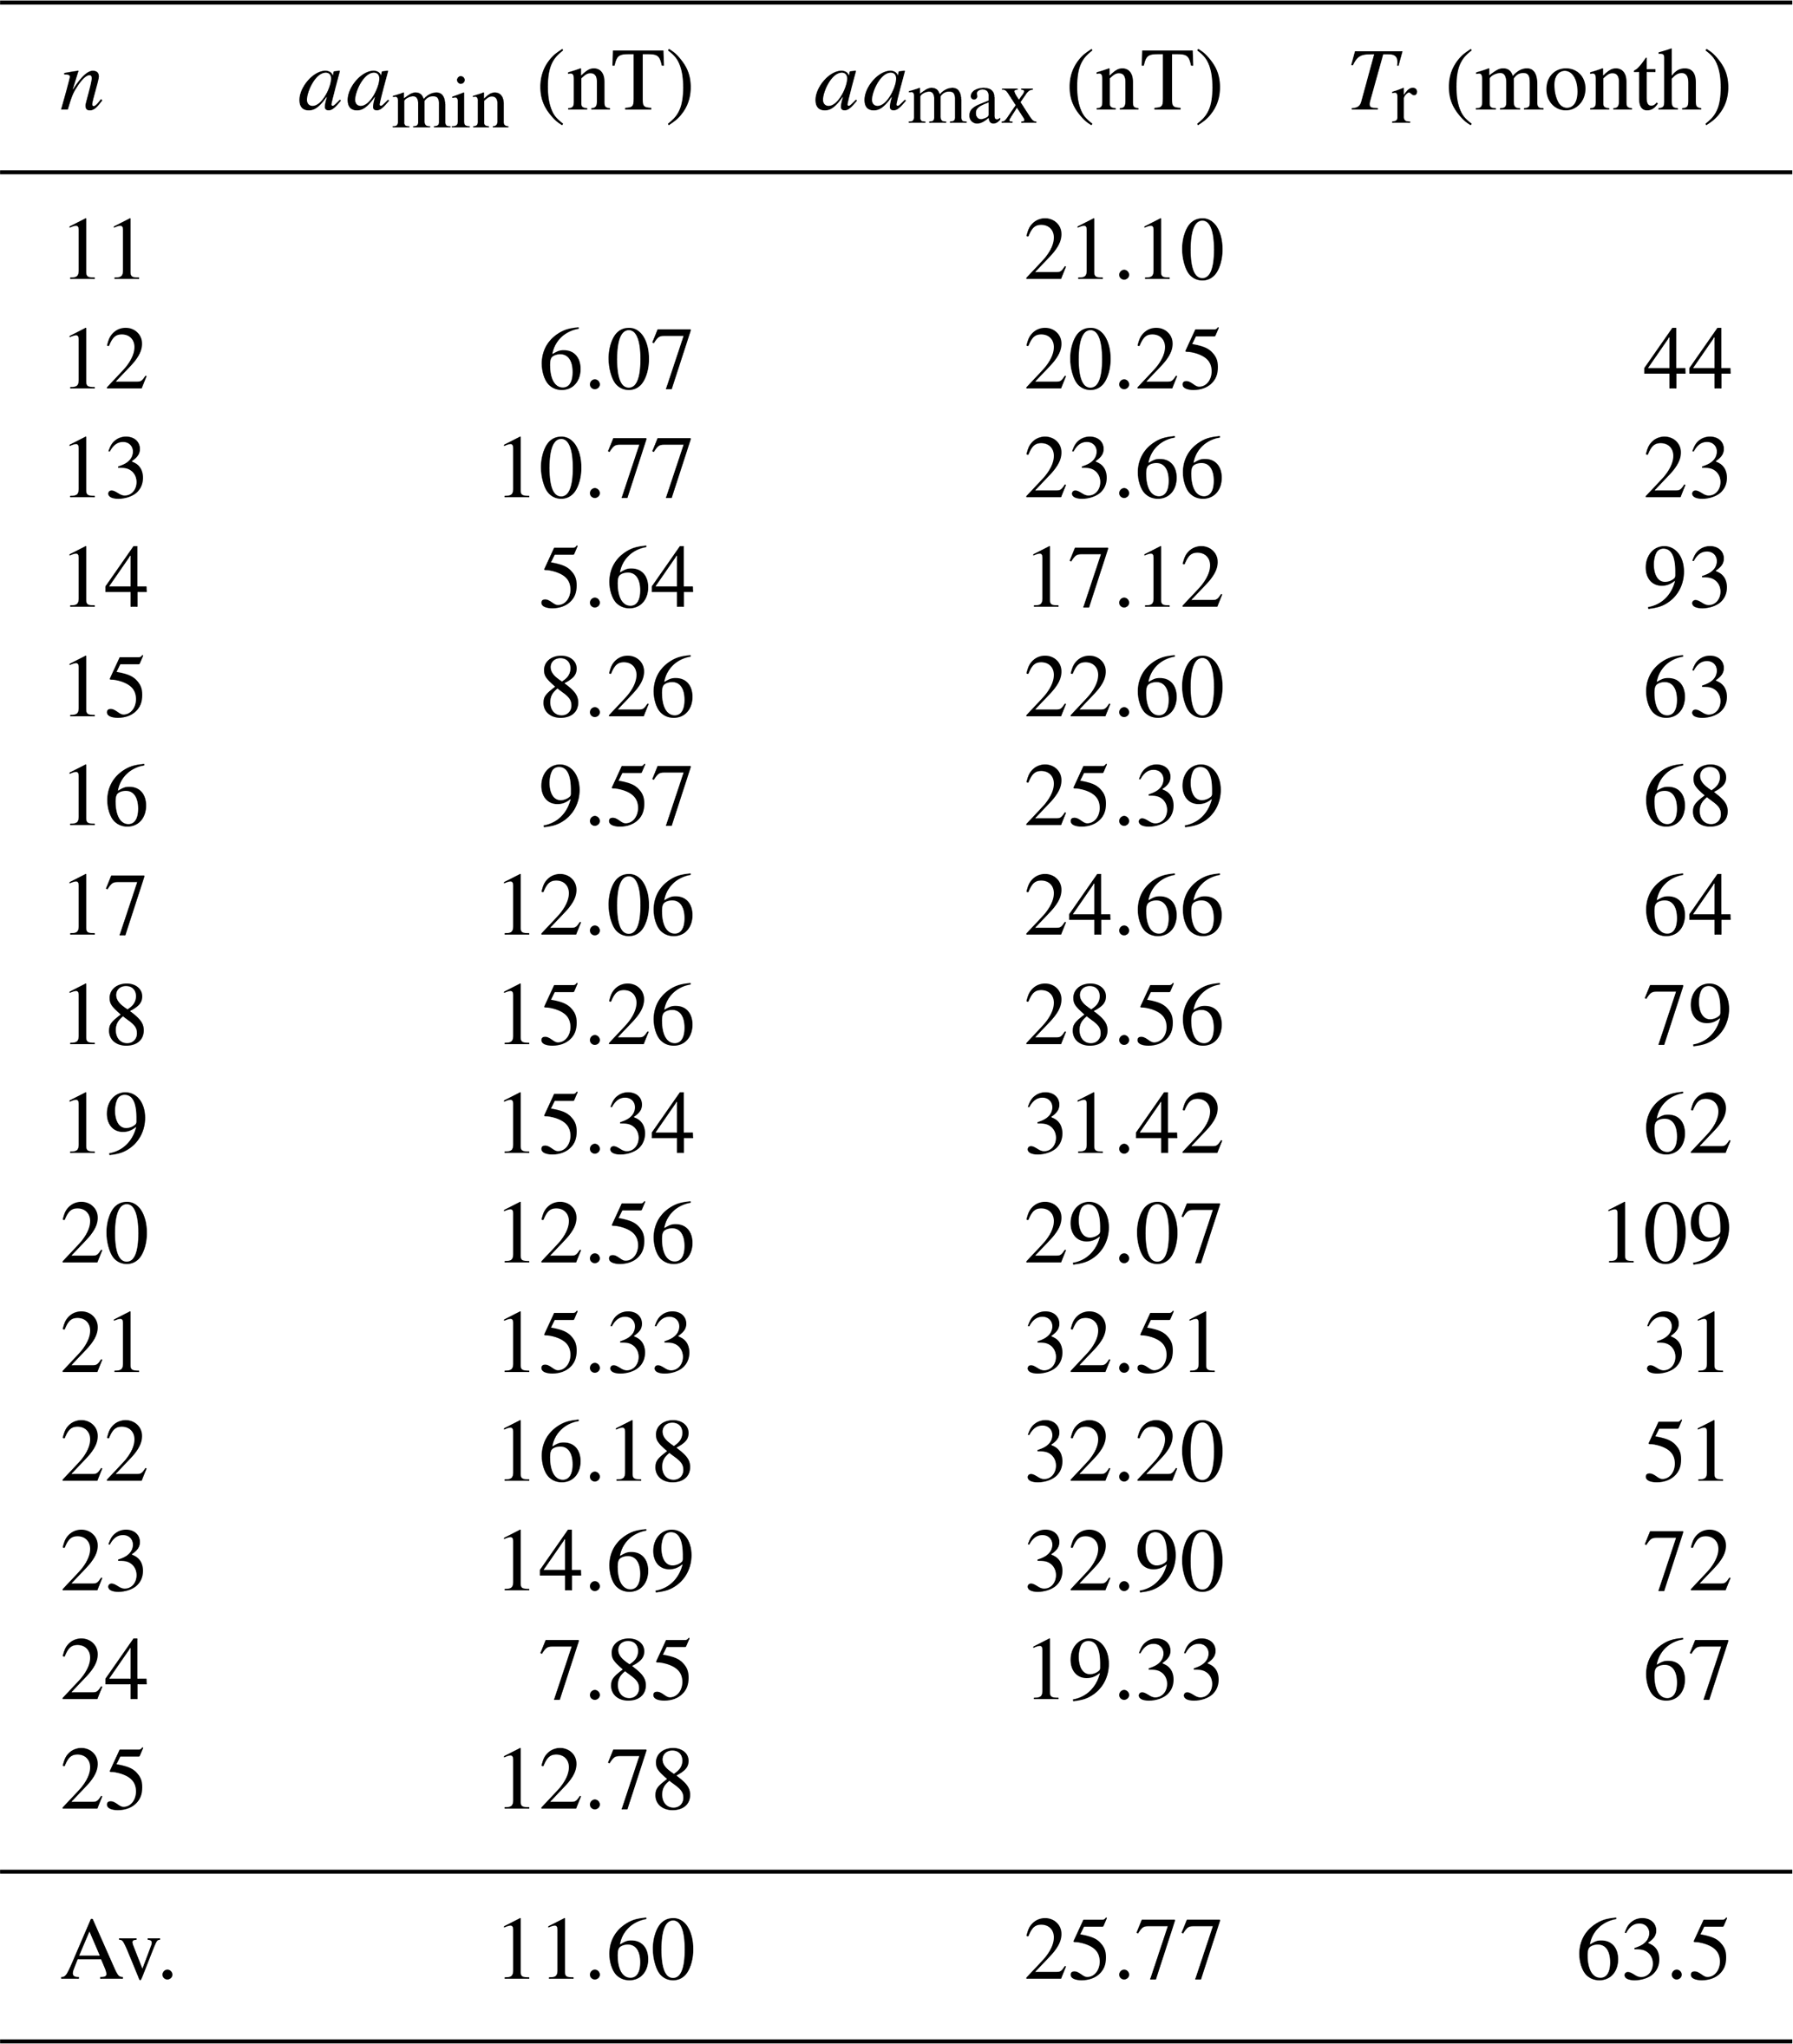
Finally, in this section, we simply analyze the previous correlations using the 13-month smoothed monthly mean aa index, as shown in Fig. 5b. The upper dashed and lower dashed–dotted lines indicate the maximum (aamax) and minimum (aamin) of the aa index, respectively, for the solar cycle. The value of aamax is the maximum of aa during the time period between two adjacent solar cycle minima (Rmin) determined by the smoothed monthly mean RI (dotted). The value of aamin is the minimum of aa during the time period between two adjacent maxima, aamax. The parameters are listed in Table 3, in which Tr is the rise time from aamin to aamax.
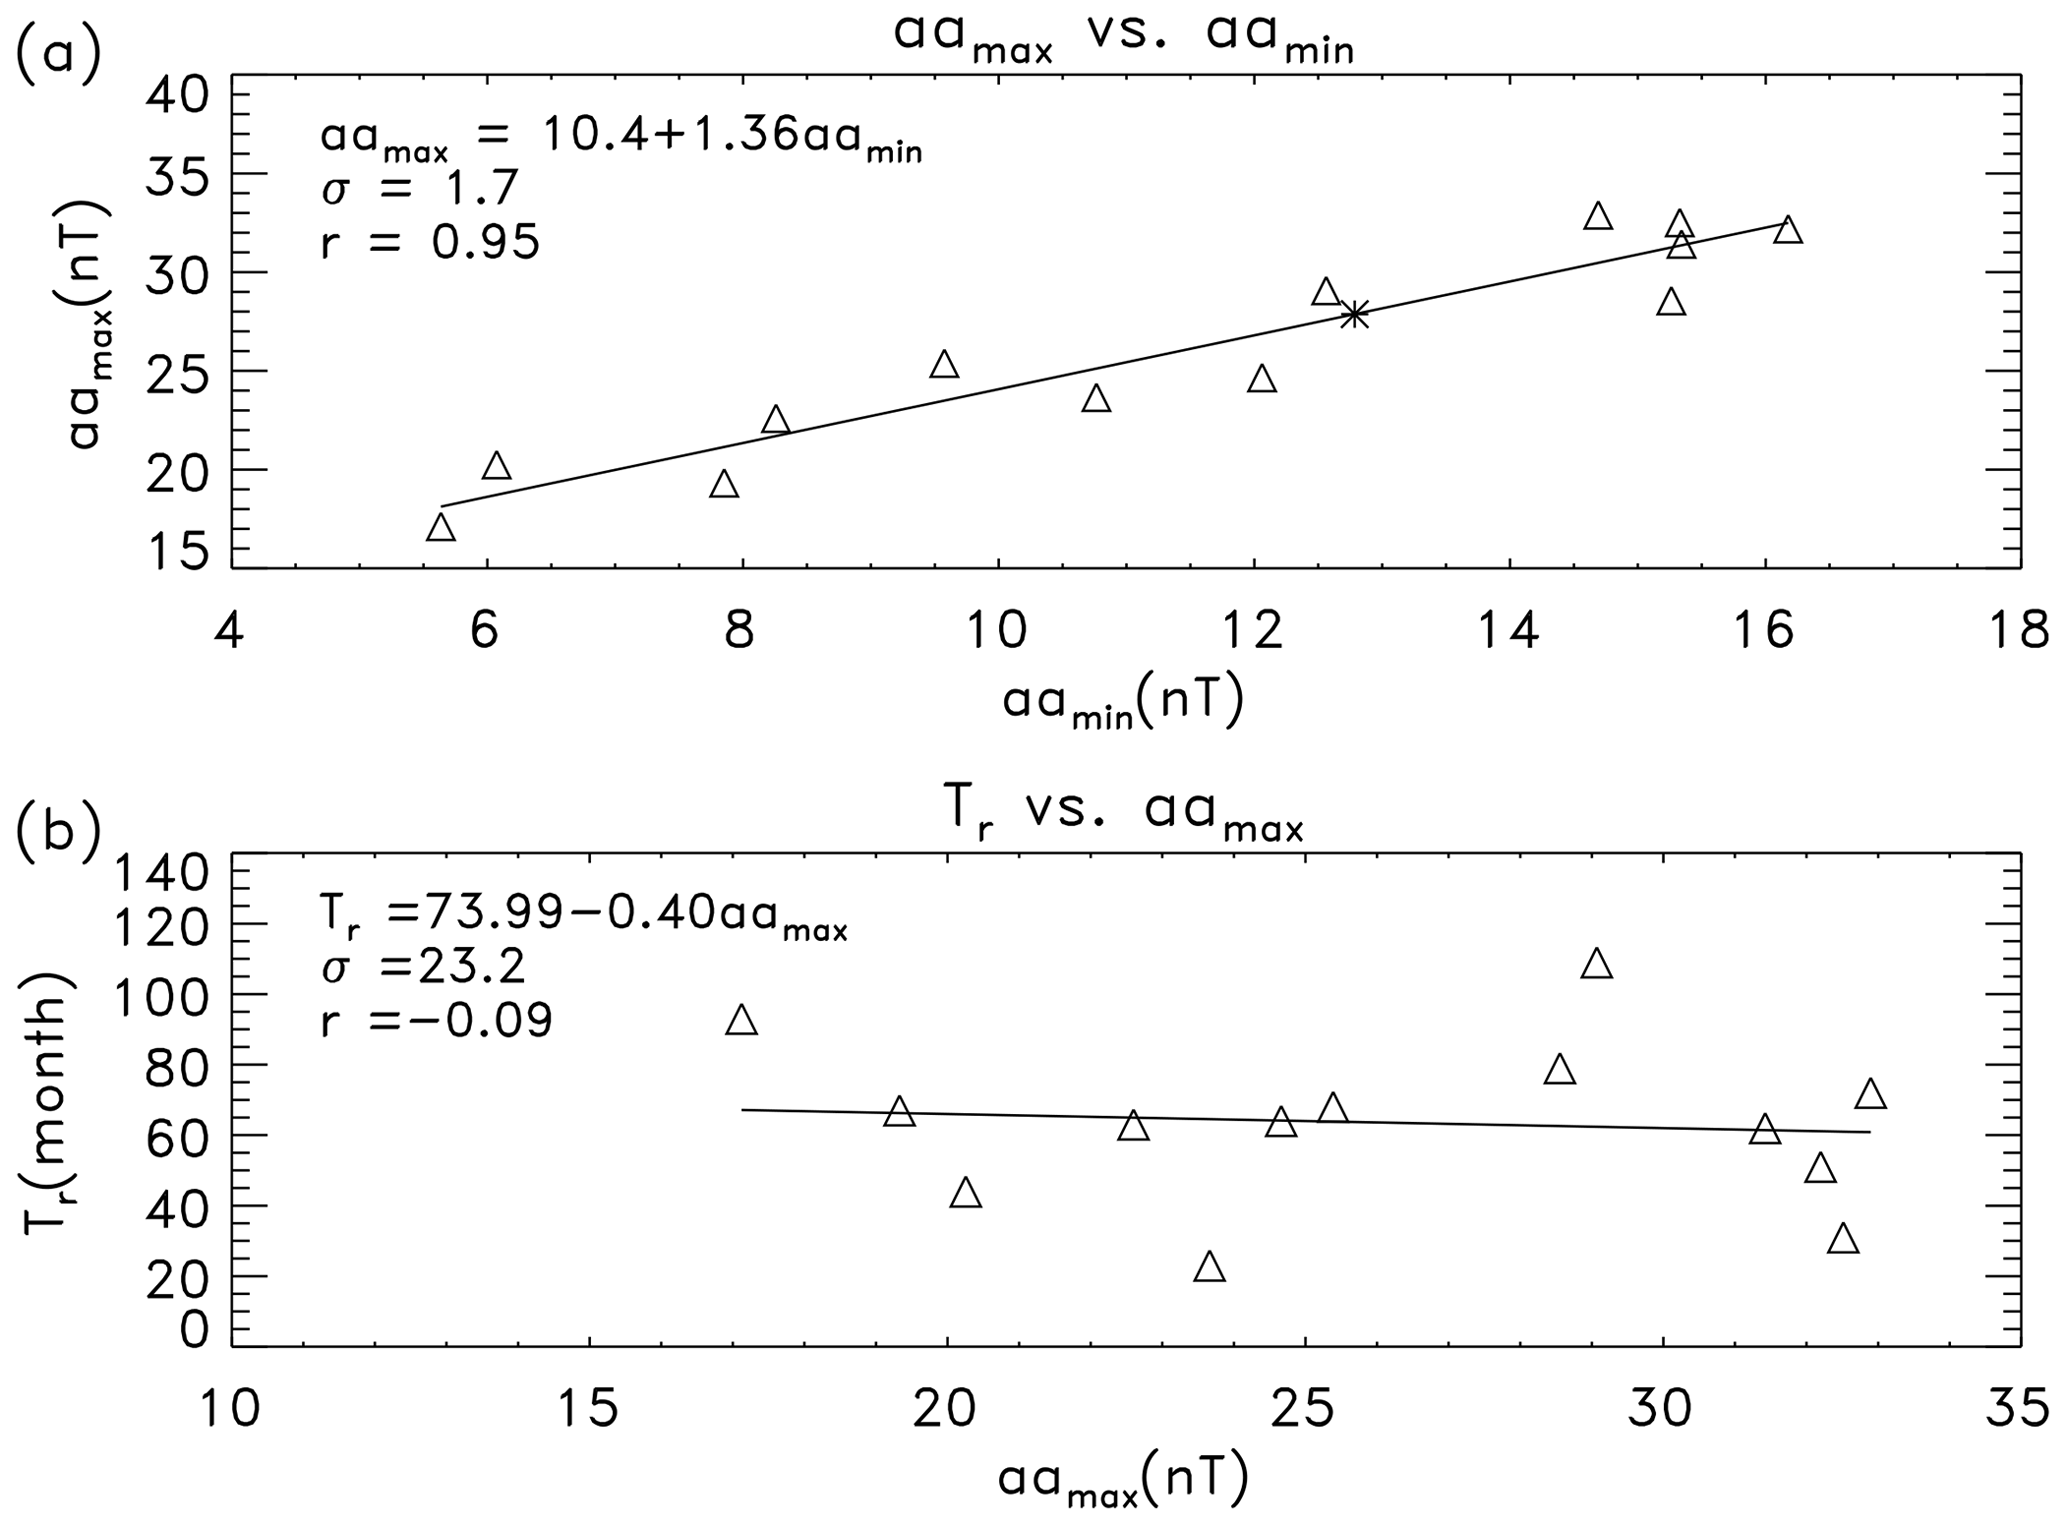
Figure 6a shows the scatter plot of aamax against aamin (triangles). The solid line indicates the linear fit of aamax to aamin by
The correlation coefficient between aamax and aamin is r=0.95 (at a confidence level greater than 99 %), slightly higher than that (r=0.85 (0.89)) for the correlation between and () in Fig. 3 using the 363 d smoothed highest (lowest) 3-hourly aa index in a 3 d interval.
Substituting aamin(25)=12.78 into this equation, one can estimate (asterisk in Fig. 6a), about 44 % higher than that (19.33) of solar cycle 24. This estimate is similar to the case in Sect. 3.1 that the estimate (91.0) of from in Eq. (5) is about 40 % higher than that (64.81 nT) of solar cycle 24 using the minimum of the 363 d smoothed lowest 3-hourly aa index in a 3 d interval.
Figure 6b shows the scatter plot of the rise time (Tr) from aamin to aamax against the maximum (aamax). The data points are very scattered, and Tr is nearly uncorrelated to the following aamax, . Therefore, this correlation is unable to be used to estimate the rise time of aamax.
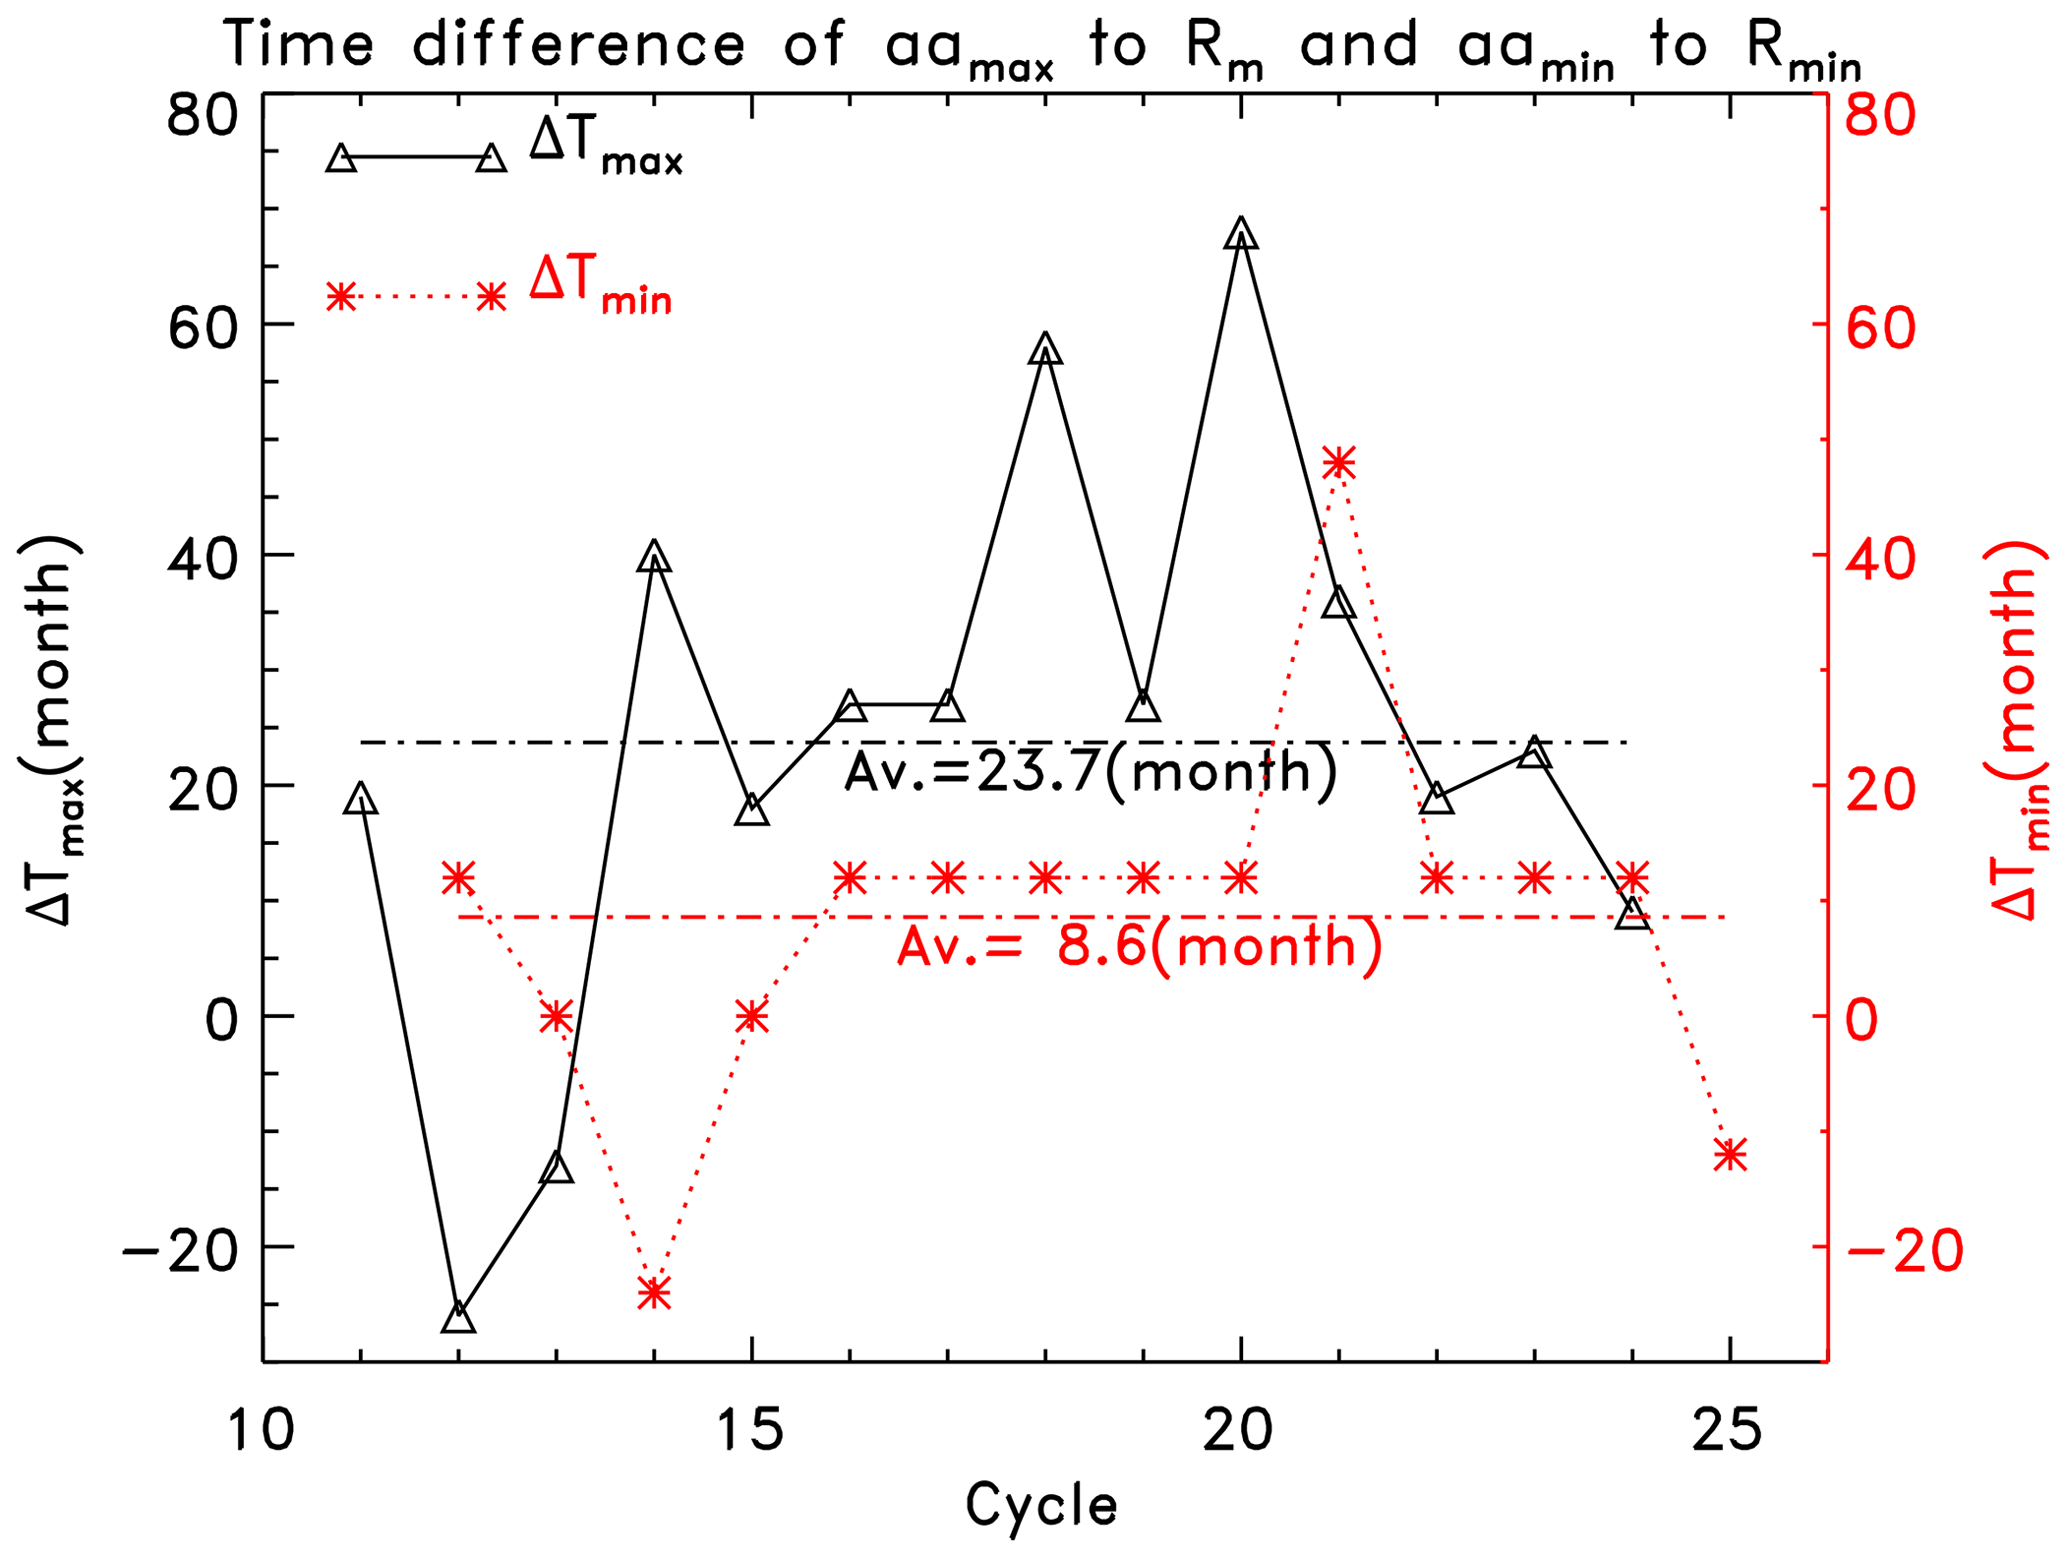
It is well known that the aa index is positively correlated with solar activity (as represented by RI), since the latter is the main source of the former (Legrand and Simon, 1981; Feynman, 1982; Echer et al., 2004). In general, the stronger the solar activity, the higher the (aa) geomagnetic activity. However the relationship between aa and RI is not a simple linear one (Borello-Filisetti et al., 1992; Mussino et al., 1994; Kishcha et al., 1999; Lockwood et al., 1999; Echer et al., 2004; Tsurutani et al., 2006; Du, 2011a, c, 2020). The aa index tends to lag behind RI about 2–3 years around a solar cycle maximum (Wang et al., 2000; Echer et al., 2004) and (only) about 1 year around a solar cycle minimum (Legrand and Simon, 1981; Wang and Sheeley, 2009; Du, 2011b), as indicated in Fig. 7 for the time difference (ΔTmax) of the 13-month smoothed monthly mean aamax to Rm (a) and that (ΔTmin) of aamin to Rmin (b). The intensity of geomagnetic activity can only be roughly evaluated from that of solar (sunspot) activity, as the linear correlation coefficient between the smoothed monthly mean aa and RI is only 0.61 (Du, 2011c) or even lower (0.43) if using the non-smoothed series (Du, 2011b). In addition, future solar activity is also unknown at the current time, and so it can not be directly used to estimate future geomagnetic activity.
There are many methods that can be used to predict the maximum amplitude of the sunspot cycle (Rm), such as (i) statistical methods, employing the relationship between the inter-cycle parameters (Thompson, 1988; Hathaway et al., 1994) or the early rising rate (Thompson, 1988; Cameron and Schüssler, 2008; Du and Wang, 2012b); (ii) functional methods, using mathematical functions of a few parameters (Hathaway et al., 1994; Du, 2011d) for extrapolating the following monthly values; (iii) geomagnetic precursor methods (Brown and Williams, 1969; Ohl and Ohl, 1979; Du et al., 2009), using the geomagnetic activity near the solar minimum; and (iv) solar precursor methods (Schatten et al., 1978; Pesnell and Schatten, 2018), using the previous cycle's polar field.
In contrast, there are fewer methods found to predict the maximum amplitude of the geomagnetic activity index for the 11-year solar cycle. Geomagnetic activity forecast has been over the order of hours or days (McPherron, 1999; Abunina et al., 2013). The annual or monthly prediction of geomagnetic activity is within a limited accuracy (over 20 %) due to irregular variation in the time series (McPherron, 1999; Gordon, 2015). In the earlier years, Kane (1988) even pointed out that it is impossible to forecast long-term geomagnetic activity through analyzing the time series of the Ap and aa index (refer also to Gordon, 2015). Geomagnetic activity near the solar minimum or at the decreasing phase of the solar cycle has been widely used to predict the maximum amplitude of the sunspot cycle but was seldom used to predict the maximum amplitude of the geomagnetic activity itself.
In the current work, we analyzed the highest (aaH) and lowest (aaL) 3-hourly aa index in each 3 d interval, smoothed by 363 d (121 points) to analyze their variation with the solar cycle represented by the 13-month smoothed monthly mean RI. It is found that the maximum of aaH () is well correlated with the preceding minimum of either aaH (, r=0.85) or aaL (, r=0.89) for the 11-year solar cycle. So, these relationships can be used to estimate the maximum intensity of geomagnetic activity for the solar cycle by employing the time series itself, (nT). It implies that the maximum intensity of geomagnetic activity for solar cycle 25 would be similar to the average over the past cycles but higher than that of solar cycle 24 by about 29.2 %. Certainly, this estimate may be an upper limit, as and may be finally determined a few months after the solar minimum (Fig. 7).
Similar results can also be obtained if using the ap index. However, the ap index is available only up to April 2018. So, we employed the relationship between ap and aa to estimate the maximum ap index for solar cycle 25: (nT). For the 13-month smoothed monthly mean aa index, the maximum aa index (aamax) of the solar cycle is also well correlated to the preceding minimum (aamin), with a correlation coefficient of r=0.95.
The well-known “Waldmeier effect” (Waldmeier, 1939), describing that the rise time of a solar cycle is well anti-correlated with the following maximum amplitude, has been widely used to estimate the rise or peak time of a solar cycle if the amplitude has been predicted. However, such a correlation is very weak for the geomagnetic activity index. The rise time (Tr) from to for the solar cycle is found to be only weakly anti-correlated to the following maximum (), . This weak correlation may be related to the fact that the geomagnetic activity maximum (minimum) is not aligned to the solar (sunspot) activity maximum (minimum) in time (Fig. 7). In most cases, aamax (aamin) lags behind Rm (Rmin). But in some other cases, aamax (aamin) precedes Rm (Rmin). The weak correlation between the rise time and the following maximum of geomagnetic activity for the solar cycle can hardly be used to estimate the former.
According to the analysis above, the following conclusions may be summarized.
-
The 363 d smoothed highest (aaH) and lowest (aaL) 3-hourly aa index in a 3 d interval are analyzed, finding that the maximum of aaH () is well correlated with the preceding minimum of either aaH (, r=0.85) or aaL (, r=0.89) for the 11-year solar cycle. As a result, the maximum aa index for the current solar cycle 25 is estimated to be (nT), about 29 % higher than that of solar cycle 24. This value is equivalent to the ap index of (nT) if using the relationship between ap and aa (Eq. 10).
-
The maximum () of aaL is also found to be well correlated with the preceding , r=0.80. Based on this correlation, is estimated to be 5.9±1.2 (nT), about 12 % higher than that of solar cycle 24.
-
The maximum amplitude of the sunspot cycle (Rm) is much better correlated with high geomagnetic activity (, r=0.79) than with low geomagnetic activity (, r=0.37).
-
The rise time (Tr) from to is found to be weakly anti-correlated to the following maximum () for the solar cycle, at the 84 % confidence level.
-
For the 13-month smoothed monthly mean aa index, the maximum aa index (aamax) of the solar cycle is well correlated with the preceding minimum (aamin, r=0.95). The rise time from aamin to aamax is nearly uncorrelated to the following maximum ().
The 3-hourly aa and ap indices can be freely downloaded from http://isgi.unistra.fr/ (last access: 10 October 2020) and https://www.gfz-potsdam.de/en/kp-index (last access: 30 April 2018), respectively. The 13-month-smoothed sunspot number series can be freely downloaded from http://www.sidc.be/silso/datafiles (last access: 10 October 2020).
The author declares that there is no conflict of interest.
We are grateful to the two anonymous reviewers for valuable suggestions which improved this paper.
This research has been supported by the National Science Foundation of China (NSFC) (grant nos. 1973058 and 11603040).
This paper was edited by Elias Roussos and reviewed by two anonymous referees.
Abunina, M., Papaioannou, A., Gerontidou, M., Paschalis, P., Abunin, A., Gaidash, S., Tsepakina, I., Malimbayev, A., Belov, A., Mavromichalaki, H., Kryakunova, O., and Velinov, P.: Forecasting Geomagnetic Conditions in near-Earth space, J. Phys.-Conf. Ser., 409, 012197, https://doi.org/10.1088/1742-6596/409/1/012197, 2013. a, b
Bartels, J.: Discussion of time variations of geomagnetic activity indices Kp and Ap 1932–1961, Ann. Geophys., 19, 1–20, 1963. a
Borello-Filisetti, O., Mussino, V., Parisi, M., and Storini, M.: Long-term variations in the geomagnetic activity level. I. A connection with solar activity, Ann. Geophys., 10, 668–675, 1992. a
Brown, G. M. and Williams, W. R.: Some properties of the day-to-day variability of Sq(H), Planet. Space Sci., 17, 455, https://doi.org/10.1016/0032-0633(69)90076-2, 1969. a, b
Cameron, R. and Schüssler, M.: A robust correlation between growth rate and amplitude of solar cycles: consequences for prediction methods, Astrophys. J., 685, 1291–1296, https://doi.org/10.1086/591079, 2008. a
Chen, S., Chai, L., Xu, K., Wei, Y., Rong, Z., and Wan, W.: Estimation of the Occurrence Probability of Extreme Geomagnetic Storms by Applying Extreme Value Theory to Aa Index, J. Geophys. Res.-Space, 124, 9943–9952, https://doi.org/10.1029/2019JA026947, 2019. a
Clette, F., Cliver, E., Lefèvre, L., Svalgaard, L., Vaquero, J., and Leibacher, J.: Preface to topical issue: recalibration of the sunspot number, Sol. Phys., 291, 2479–2486, https://doi.org/10.1007/s11207-016-1017-8, 2016. a
Cliver, E. W., Boriakoff, V., and Feynman, J.: Solar variability and climate change: Geomagnetic aa index and global surface temperature, Geophys. Res. Lett., 25, 1035–1038, https://doi.org/10.1029/98GL00499, 1998. a
Dobrica, V., Demetrescu, C., Boroneant, C., and Maris, G.: Solar and geomagnetic activity effects on climate at regional and global scales: Case study-Romania, J. Atmos. Sol.-Terr. Phys., 71, 1727–1735, https://doi.org/10.1016/j.jastp.2008.03.022, 2009. a
Du, Z. L.: The correlation between solar and geomagnetic activity – Part 1: Two-term decomposition of geomagnetic activity, Ann. Geophys., 29, 1331–1340, https://doi.org/10.5194/angeo-29-1331-2011, 2011a. a, b
Du, Z. L.: The correlation between solar and geomagnetic activity – Part 2: Long-term trends, Ann. Geophys., 29, 1341–1348, https://doi.org/10.5194/angeo-29-1341-2011, 2011b. a, b, c
Du, Z. L.: The correlation between solar and geomagnetic activity – Part 3: An integral response model, Ann. Geophys., 29, 1005–1018, https://doi.org/10.5194/angeo-29-1005-2011, 2011c. a, b, c
Du, Z. L.: The Shape of Solar Cycle Described by a Modified Gaussian Function, Sol. Phys., 273, 231–253, https://doi.org/10.1007/s11207-011-9849-8, 2011d. a
Du, Z. L.: The solar cycle: predicting the peak of solar cycle 25, Astrophys. Space Sci., 365, 104, https://doi.org/10.1007/s10509-020-03818-1, 2020. a
Du, Z. L. and Wang, H. N.: The relationships of solar flares with both sunspot and geomagnetic activity, Res. Astron. Astrophys., 12, 400–410, https://doi.org/10.1088/1674-4527/12/4/004, 2012a. a
Du, Z. L. and Wang, H. N.: Predicting the solar maximum with the rising rate, Sci. China, 55, 365–370, https://doi.org/10.1007/s11433-011-4612-6, 2012b. a
Du, Z. L., Li, R., and Wang, H. N.: The Predictive Power of Ohl's Precursor Method, Astron. J., 138, 1998–2001, https://doi.org/10.1088/0004-6256/138/6/1998, 2009. a, b
Echer, E., Gonzalez, W. D., Gonzalez, A. L. C., Prestes, A., Vieira, L. E. A., Dal Lago., A., Guarnieri, F. L., and Schuch, N. J.: Long-term correlation between solar and geomagnetic activity, J. Atmos. Sol.-Terr. Phys., 66, 1019–1025, https://doi.org/10.1016/j.jastp.2004.03.011, 2004. a, b, c, d
El-Borie, M. A., El-Taher, A. M., Thabet, A. A., and Bishara, A. A.: The impact of asymmetrical distribution of solar activity on geomagnetic indices throughout five solar activity cycles, Adv. Spa. Res., 64, 278–286, https://doi.org/10.1016/j.asr.2019.03.040, 2019. a
Feynman, J.: Geomagnetic and solar wind cycles, 1900–1975, J. Geophys. Res., 87, 6153–6162, https://doi.org/10.1029/JA087iA08p06153, 1982. a
Gavrilyeva, G. A., Ammosov, P. P., Ammosova, A. M., Koltovskoi, I. I., and Sivtseva, V. I.: Geomagnetic activity signature in seasonal variations of mesopause temperature over Yakutia, Proceedings of the SPIE, 10466, 1046670, https://doi.org/10.1117/12.2288710, 2017. a
Gonzalez, W. D., Joselyn, J. A., Kamide, Y., Kroehl, H. W., Rostoker, G., Tsurutani, B. T., and Vasyliunas, V. M.: What is a geomagnetic storm?, J. Geophys. Res., 99, 5771–5792, 1994. a
Gonzalez, W. D., Tsurutani, B. T., Gonzalez, A. L. C., Smith, E. J., Tang, F., and Akasofu, S.-I.: Solar wind-magnetosphere coupling during intense magnetic storms (1978–1979), J. Geophys. Res., 94, 8835–8851, https://doi.org/10.1029/JA094iA07p08835, 1989. a
Gordon, R.: Forecasting geomagnetic activity at monthly and annual horizons: Time series models, J. Atmos. Sol.-Terr. Phys., 133, 111–120, https://doi.org/10.1016/j.jastp.2015.08.010, 2015. a, b, c
Hathaway, D. H., Wilson, R. M., and Reichmann, E. J.: The shape of the sunspot cycle, Sol. Phys., 151, 177–190, https://doi.org/10.1007/BF00654090, 1994. a, b
Kane, R. P.: Forecasting geomagnetic activity, PAGEOPH, 126, 85–101, https://doi.org/10.1007/BF00876916, 1988. a, b
Kishcha, P. V., Dmitrieva, I. V., and Obridko, V. N.: Long-term variations of the solar – geomagnetic correlation, total solar irradiance, and northern hemispheric temperature (1868–1997), J. Atmos. Sol.-Terr. Phys., 61, 799–808, https://doi.org/10.1016/S1364-6826(99)00035-8, 1999. a
Legrand, J. P. and Simon, P. A.: Ten cycles of solar and geomagnetic activity, Sol. Phys., 70, 173–195, https://doi.org/10.1007/BF00154399, 1981. a, b
Li, Y.: Predictions of the features for sunspot cycle 23, Sol. Phys., 170, 437–445, https://doi.org/10.1023/A:1004963215247, 1997. a
Lockwood, M., Stamper, R., and Wild, M. N.: A doubling of the Sun's coronal magnetic field during the past 100 years, Nature, 399, 437–439, https://doi.org/10.1038/20867, 1999. a
Lukianova, R., Alekseev, G., and Mursula, K.: Effects of station relocation in the aa index, J. Geophys. Res., 114, A02105, https://doi.org/10.1029/2008JA013824, 2009. a
Marat, D., Galina, D., Viktor, D., and Anna, D.: Dependence of the F2-layer critical frequency median at midlatitudes on geomagnetic activity, Sol.-Terr. Phys., 3, 67–73, https://doi.org/10.12737/stp-34201707, 2017. a
Mayaud, P.: The aa indices: A 100-year series characterizing the magnetic activity, J. Geophys. Res., 77, 6870–6874, https://doi.org/10.1029/JA077i034p06870, 1972. a
McPherron, R. L.: Predicting the Ap index from past behavior and solar wind velocity, Phys. Chem. Earth Pt. C, 24, 45–56, https://doi.org/10.1016/S1464-1917(98)00006-3, 1999. a, b, c, d, e
Mussino, V., Borello, F. O., Storini, M., and Nevanlinna, H.: Long-term variations in the geomagnetic activity level Part II: Ascending phases of sunspot cycles, Ann. Geophys., 12, 1071–1075, 1994. a
Ohl, A. I. and Ohl, G. I.: A new method of very long-term prediction of solar activity, Sol.-Terr. Predict. Proc., 2, 258–263, 1979. a, b, c
Pesnell, W. D. and Schatten, K. H.: An early prediction of the amplitude of Solar Cycle 25, Sol. Phys., 293, 112, https://doi.org/10.1007/s11207-018-1330-5, 2018. a
Petrovay, K.: Solar cycle prediction, Liv. Rev. Sol. Phys., 17, 2, 96 pp., https://doi.org/10.1007/s41116-020-0022-z, 2020. a, b
Prestes, A., Rigozo, N. R., Echer, E., and Vieira, L. E. A.: Spectral analysis of sunspot number and geomagnetic indices (1868–2001), J. Atmos. Sol.-Terr. Phys., 68, 182–190, https://doi.org/10.1016/j.jastp.2005.10.010, 2006. a
Russell, C. T. and Mulligan, T.: The 22-year variation of geomagnetic activity: Implications for the polar magnetic field of the Sun, Geophys. Res. Lett., 22, 3287–3288, https://doi.org/10.1029/95GL03086, 1995. a
Schatten, K. H., Scherrer, P. H., Svalgaard, L., and Wilcox, J. M.: Using dynamo theory to predict the sunspot number during solar cycle 21, Geophys. Res. Lett., 5, 411–414, https://doi.org/10.1029/GL005i005p00411, 1978. a
Singh, P. R., Tiwari, C. M., Saxena, A. K., and Agrawal, S. L.: Quasi-biennial periodicities and heliospheric modulation of geomagnetic activity during solar cycles 22, Phys. Scr., 94, 105005, https://doi.org/10.1088/1402-4896/ab10b6, 2019. a
Thompson, R. J.: The rise of solar cycle number 22, Sol. Phys., 117, 279–289, https://doi.org/10.1007/BF00147249, 1988. a, b
Tsurutani, B. T., Gonzalez, W. D., Gonzalez, A. L. C., Guarnieri, F. L., Gopalswamy, N., Grande, M., Kamide, Y., Kasahara, Y., Lu, G., Mann, I., McPherron, R., Soraas, F., and Vasyliunas, V.: Corotating solar wind streams and recurrent geomagnetic activity: A review, J. Geophys. Res., 111, A07S01, https://doi.org/10.1029/2005JA011273, 2006. a, b
Waldmeier, M.: Über die Struktur der Sonnenflecken, Astron. Mitt. Zrich, 14, 439–450, 1939. a, b
Wang, Y. M., Lean, J., and Sheeley, N. R.: The long-term variation of the Sun's open magnetic flux, Geophys. Res. Lett., 27, 505–508, https://doi.org/10.1029/1999GL010744, 2000. a
Wang, Y. M. and Sheeley, N. R.: Understanding the Geomagnetic Precursor of the Solar Cycle, Astrophys. J., 694, L11–L15, https://doi.org/10.1088/0004-637X/694/1/L11, 2009. a
Yoshida, A. and Yamagishi, H.: Predicting amplitude of solar cycle 24 based on a new precursor method, Ann. Geophys., 28, 417–425, https://doi.org/10.5194/angeo-28-417-2010, 2010. a