the Creative Commons Attribution 4.0 License.
the Creative Commons Attribution 4.0 License.
 | 29 Jan 2020
Magnetospheric Multiscale observations of energetic oxygen ions at the duskside magnetopause during intense substorms
Chen Zeng
Suping Duan
Chi Wang
Stephen Fuselier
James Burch
Roy Torbert
Barbara Giles
Christopher Russell
Energetic oxygen ions (1–40 keV) observed by the Magnetospheric Multiscale (MMS) satellites at the duskside magnetopause boundary layer during phase 1 are investigated. There are 57 duskside magnetopause crossing events identified during intense substorms (AE>500 nT). These 57 events of energetic O+ at the duskside magnetopause include 26 events during the expansion phase and 31 events during the recovery phase of intense substorms. It is found that the O+ density in the duskside magnetopause boundary layer during the recovery phase (0.081 cm−3) is larger than that during the expansion phase (0.069 cm−3). The 26 events of energetic O+ ions at the duskside magnetopause during intense substorm expansion phase are all under the southward interplanetary magnetic field (IMF). There are only seven events under northward IMF, and they all occurred during the intense substorm recovery phase. The density of energetic O+ at the duskside magnetopause ranges from 0.007 to 0.599 cm−3. The maximum density of O+ occurred during the intense substorm recovery phase and under southward IMF. When the IMF is southward, the O+ density shows an exponential increase with the IMF Bz absolute value. Meanwhile, the density ratio shows an exponential growth with the IMF By. These results agree with previous studies in the near-Earth magnetosphere during intense substorm. It is suggested that O+ abundance in the duskside magnetopause boundary layer has a close relation to O+ variations in the near-Earth magnetosphere during intense substorms.
- Article
(5056 KB) - Full-text XML
-
Supplement
(131 KB) - BibTeX
- EndNote


Single charged oxygen ions (O+) in the magnetosphere are exclusively from the ionosphere. They are an important element in the mass and energy transport in the magnetospheric dynamic process, especially during the expansion phase and recovery phase of intense substorms (e.g., Daglis et al., 1991; Daglis and Axford, 1996; Duan et al., 2017; Fok et al., 2006; Ohtani et al., 2011; Ono et al., 2009; Nosé et al., 2000; Yau and André, 1997; Yau et al., 2012; Kronberg et al., 2014). Processes in the magnetotail due to substorm can result in auroral electrojet activity. This activity is generally caused by field-aligned current increase and is reflected by the Auroral Electrojet (AE) index (Tang and Wang, 2018). Previous studies have found that the density and energy density of O+ significantly increase with the AE index in the near-Earth magnetosphere during the intense substorm (e.g., Lennartsson and Shelley, 1986; Daglis et al., 1991, 1994; Duan et al., 2017). Lennartsson and Shelley (1986) proposed that oxygen ions with energies less than 17 keV e−1 could provide 50 % of the density in the plasma sheet during disturbed geomagnetic activity. They found the increase in the O+ energy density was strongest around local midnight, where O+ became the most abundant ion at AE∼1000 nT. In the near-Earth plasma sheet (NEPS), the O+ energy density explosively increases with the AE index in the range of larger than 500 nT during the intense substorm expansion phase (Daglis et al., 1994). Previous studies reported that the O+ from the nightside auroral region could rapidly feed in the near-Earth magnetosphere during the substorm expansion phase (e.g., Daglis and Axford, 1996; Duan et al., 2017; Yu and Ridley, 2013). Otherwise, the solar wind dynamic pressure also influences the oxygen content of ion outflow from the ionosphere. Using the Thermal Ion Dynamics Experiment (TIDE) on the Polar satellite, Elliott et al. (2001) found both the O+ density and parallel flux increased with the solar wind dynamic pressure.
The O+ outflowing from the ionosphere with low energy of eV is accelerated to about 500 eV at the high-altitude polar region (e.g., Yau and André, 1997). Then they are convected tailward into the lobe and the plasma sheet boundary layer. After O+ enter the NEPS of the magnetotail, they can be energized up to tens of keV during intense substorm dipolarizations (e.g., Birn et al., 1997; Duan et al., 2017; Fok et al., 2006; Nosé et al., 2000; Ono et al., 2009; Yau et al., 2012). The inductive electric field associated with substorm dipolarization is very significant for accelerating particles in the NEPS (e.g., Dai et al., 2014, 2015; Duan et al., 2011, 2016; Lui et al., 1999). Duan et al. (2017) reported that the O+ from the lobe or the plasma sheet boundary layer were efficiently accelerated by the kinetic Alfven eigenmode with a significant unipolar electric field and rapidly feed in the NEPS during intense substorm dipolarizations. These energetic O+ in the NEPS can be injected into the inner magnetosphere and drift westward into the duskside outer magnetosphere (e.g., Ganushkina et al., 2005).
Oxygen ion decay from the ring current can leak into the dayside magnetopause boundary layer (e.g., Li et al., 1993; Ebihara et al., 2011). Li et al. (1993) reported that the ring current O+ with tens of keV energy interacted with the Pc 5 waves and then would be lost to the dayside magnetopause. The solar wind dynamic pressure enhancement plays a key role in the ring current particle loss into the outer magnetosphere. This pressure enhancement pushing the magnetopause to move inward leads to a reduction of the scale length of the magnetic field magnitude gradient along the magnetopause. The magnetic gradient drift speed across the magnetopause will increase. So, the ring current oxygen ions along the magnetic gradient drift path can easily enter the outer magnetosphere (Kim et al., 2005). Ebihara et al. (2011) proposed that the field line curvature scattering was more effective on the loss of energetic oxygen ions with its large gyro radius. The energetic oxygen ions with pitch angles of ∼90∘ are more prone to leak into the dayside magnetopause.
The distribution of energetic oxygen ion density at the dayside magnetopause is asymmetric, and it has a close relationship with the interplanetary magnetic field (IMF) (e.g., Bouhram et al., 2005; Phan et al., 2004; Luo et al., 2017). Bouhram et al. (2005) pointed out that the O+ density in the duskside (on average 0.053 cm−3) magnetopause is higher than that in the dawnside (on average 0.014 cm−3). They found O+ was the dominant contributor to the mass density (30 %) in the duskside magnetopause in comparison to 3 % in the dawnside and 4 % near noon. The dawn–dusk asymmetries of the energetic O+ ( keV) distribution in three different regions (dayside magnetopause, near-Earth nightside plasma sheet, and tail plasma sheet) are also observed by Luo et al. (2017). They found that the energetic O+ distributions were mainly influenced by the dawn–dusk IMF directions and the enhancement of ion intensity strongly related to the location of the magnetopause reconnection.
There is ample evidence that magnetospheric ions could participate in the magnetopause reconnection and directly escape along the reconnected open field lines (e.g., Sonnerup et al., 1981; Fuselier et al., 1991, 2016a; Slapak et al., 2012, 2015; Wang et al., 2014; Liu et al., 2015). The energetic O+ with energies larger than 3 keV in the reconnection jets at the duskside mid-latitude magnetopause under steady southward IMF were reported by Phan et al. (2004). Zong et al. (2001) observed O+ energy dispersion due to time-of-flight (TOF) effects at the duskside magnetopause under a southward IMF, and it was assumed that O+ was escaping from the ring current along the reconnected field lines during steady reconnection. However, Fuselier et al. (1989) reported that O+ from the high-latitude ionosphere were not associated with any substorm cycle. O+ from the high-latitude ionosphere could form the O+ rich boundary layer in the low-latitude magnetopause. When O+ enter the reconnection jets, the reconnection rate is likely reduced by the mass loading, but is not suppressed at the magnetopause (Fuselier et al., 2019).
At present, variations of O+ abundance () in the duskside magnetopause boundary layer during intense substorms (AE>500 nT) with AE index and solar wind conditions (e.g., IMF By, IMF Bz, and solar wind dynamic pressure) are still not clear. Previous studies of O+ abundance variations during substorms are mainly focused on the magnetotail or the near-Earth region (e.g., Duan et al., 2017; Nosé et al., 2000; Ohtani et al., 2011). The Magnetospheric Multiscale (MMS) mission gives us an opportunity to focus on the O+ in the duskside magnetopause region. In this study, we investigate statistical features of energetic O+ at the duskside magnetopause and their relations to AE index and solar wind conditions (e.g., IMF By, IMF Bz, and solar wind dynamic pressure) during the intense substorms (AE>500 nT).
This study used data from the Magnetospheric Multiscale (MMS) mission. This mission comprises four identical satellites that were launched on 13 March 2015 into an elliptical 28-inclination orbit with perigee around 1.2 RE and apogee around 12 RE (Burch et al., 2016; Fuselier et al., 2016b). The electric field E is from the electric double probe (EDP) (Ergun et al., 2016; Lindqvist et al., 2016), and magnetic field B is from the Fluxgate Magnetometer (FGM) (Russell et al., 2016). The plasma data are from the Fast Plasma Investigation (FPI) and the Hot Plasma Composition Analyzer (HPCA). The FPI provides plasma (electrons and ions) distribution functions at 32 energies from 10 eV to 30 keV, and it has a high time resolution of 0.03 s for electrons and 0.15 s for ions in the burst mode and 4.5 s in the fast mode (Pollock et al., 2016). The FPI does not discriminate between different ion species, while the HPCA provides ion composition (H+, , He+, and O+) measurements in the energy range from 1 eV q−1 to 40 keV q−1 (Young et al., 2016). Although the HPCA instrument employs the radio frequency (RF) unit to artificially reduce the proton fluxes in some areas where the proton fluxes are intense, there still exists a low level of background that affects the O+ fluxes in the magnetosheath. The majority of the O+ fluxes in the magnetosphere side of the magnetopause are at energies from 1 to 40 keV, and that band below 1 keV visible in the magnetosheath side are observations outside the RF operating range and contamination from high proton fluxes. Due to this contamination, the O+ at energies from 1 to 40 keV in the magnetopause boundary layer are considered in our study. The O+ density was recalculated from the HPCA distribution functions at this energy range by using the Space Physics Environment Data Analysis System (SPEDAS) software package. More details about SPEDAS can be found in Angelopoulos et al. (2019). The solar wind parameters and AE index are available from the OMNI data in CDAweb (http://cdaweb.gsfc.nasa.gov/, last access: 25 January 2020). The data from the MMS4 satellite are adopted in our investigation since the data difference from the other three spacecraft is negligible. This is due to spacecraft separation and scales of particle motion.
3.1 Detailed event on 3 October 2015
Figure 1 presents the three components of the IMF in Geocentric Solar Magnetospheric (GSM) coordinates, solar wind dynamic pressure, as well as Amplitude Upper (AU), Amplitude Lower (AL), and AE indexes during the time of interest from 14:30 to 16:30 UT on 3 October 2015. During this interval, the IMF Bx component is negative all the time (Fig. 1a). Its maximum value is about −1 nT at ∼ 15:16 UT. The IMF By component is almost negative except at ∼ 14:32 and ∼ 16:23 UT. The negative IMF Bz component is also observed during this interval, as shown in Fig. 1c. The minimum value of the IMF Bz component is about −7.1 nT at ∼ 14:30 UT. The solar wind dynamic pressure is only at the beginning of the time interval about 2 nPa. Then, it increases sharply at 15:00 UT and reaches its maximum value about 4.4 nPa at ∼ 15:12 UT. These solar wind conditions led to an intense substorm (AE>500 nT), as Fig. 1g shows. The AE index is defined as . Generally, the substorm onset time is characterized by the AL index starting to significantly decrease and the AE index significantly increasing. The interval of the AL index decreasing from onset to its minimum is defined as the substorm expansion phase. The interval of the AL index increasing from the minimum to the quiet time level is regarded as the substorm recovery phase. From Fig. 1e to g, the substorm onset time is about 14:45 UT, marked by the AL index starting to sharply decrease and the AE index increasing. After the AE index significantly increases and the AL index decreases (Fig. 1f), the AL and AE indexes reach their minimum and maximum values of about −750 and 1000 nT at ∼ 15:20 UT, respectively. This interval from ∼ 14:45 to ∼ 15:20 UT is regarded as the intense substorm expansion phase. Then, the intense substorm enters the recovery phase as the AL index gradually increases and the AE index decreases after ∼ 15:20 UT. The two blue dashed lines indicate the time interval of the magnetopause boundary layer crossing. According to the above description, we can identify that this magnetopause boundary layer crossing occurred during the recovery phase of an intense substorm. The identification of the magnetopause boundary layer will be described later.
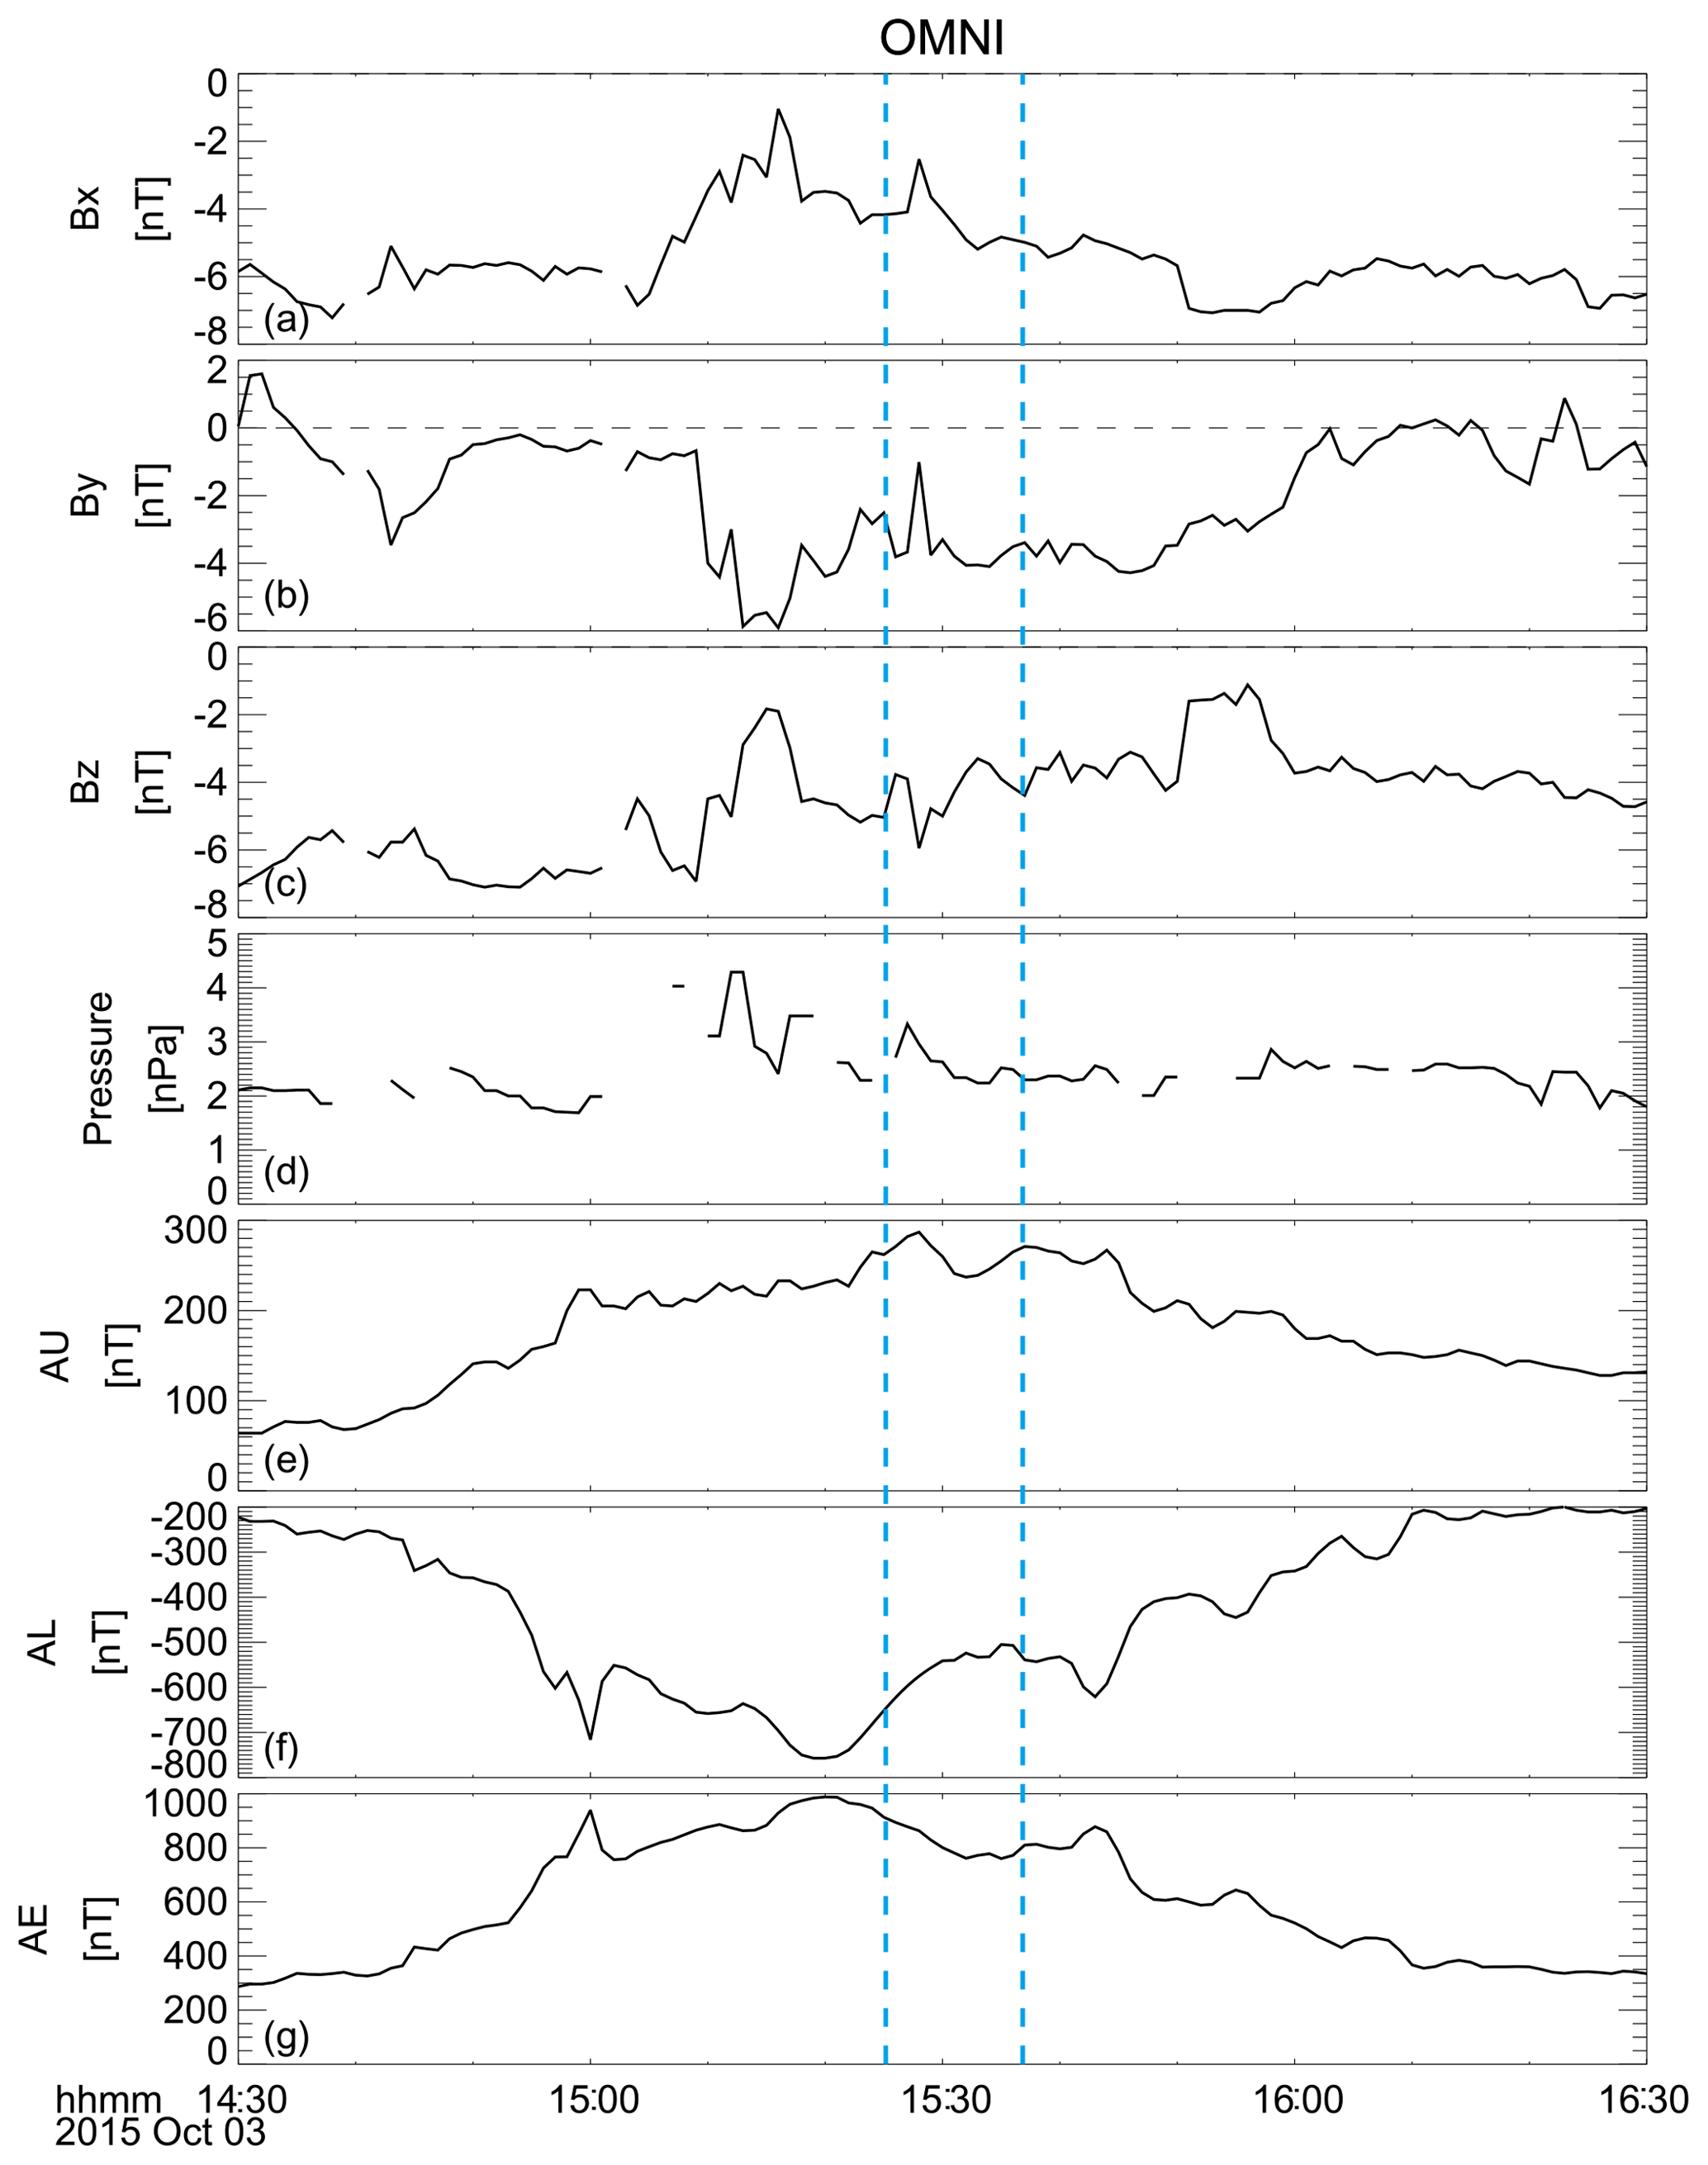
Figure 1The three components of the IMF Bx, By, and Bz in the Geocentric Solar Magnetospheric coordinates, solar wind dynamic pressure, as well as AU, AL, and AE indexes from CDAweb OMNI data. The two blue dashed lines indicate the interval of the magnetopause boundary layer crossing.
Figure 2 shows the overview of the magnetopause inbound crossing from 15:00 to 16:00 UT on 3 October 2015. During the magnetopause crossing, the MMS4 satellite was located at about (6.0, 8.8, −5.1) RE in GSM as shown at the bottom of Fig. 2. From top to bottom, panels (a) and (b) show the magnetic and electric fields in GSM from FGM and EDP, respectively. Ion and electron temperatures, plasma density, and ion velocity in GSM from FPI L2 data products are shown in Fig. 2c–e. Figure 2f shows the H+ and O+ densities, followed by the electron and ion omnidirectional differential energy fluxes from FPI (Fig. 2g–h). The last four panels present the differential fluxes of four individual ion species, H+, O+, He+, and measured by HPCA, respectively. The HPCA flux in panels (i)–(l) has artificial striping every four energy bins due to the way HPCA determines the count rate over four energy channels in survey mode. It is noted that the differential fluxes (Fig. 2i–l) and differential energy fluxes (Fig. 2g–h) have different units. To better identify the flux variations at specific energies, we choose the ion and electron fluxes from FPI in the energy flux unit. The plasma moments (e.g., ion parallel and perpendicular temperatures, ion and electron densities, and ion velocity) from FPI shown in Fig. 2c–e are all from MMS L2 data products. They are default moments calculated over the full FPI energy range from 10 eV to 30 keV. Note that in the magnetosheath, O+ measurements suffer from fake counts at energies below 1 keV, which results from a high proton flux contamination, as the red box in Fig. 2j shows. So, the spurious counts should be excluded in the plasma moments calculation. The O+ density shown in Fig. 2f is recalculated from HPCA distribution functions at energies from 1 to 40 keV. Due to H+ measurements from HPCA being accurate and the H+ mean energy in the magnetosheath being typically 0.3 keV, we adopted the default H+ density from HPCA L2 data products which computed over the full HPCA energy range from 1 eV to 40 keV, as the red line shows in Fig. 2f.
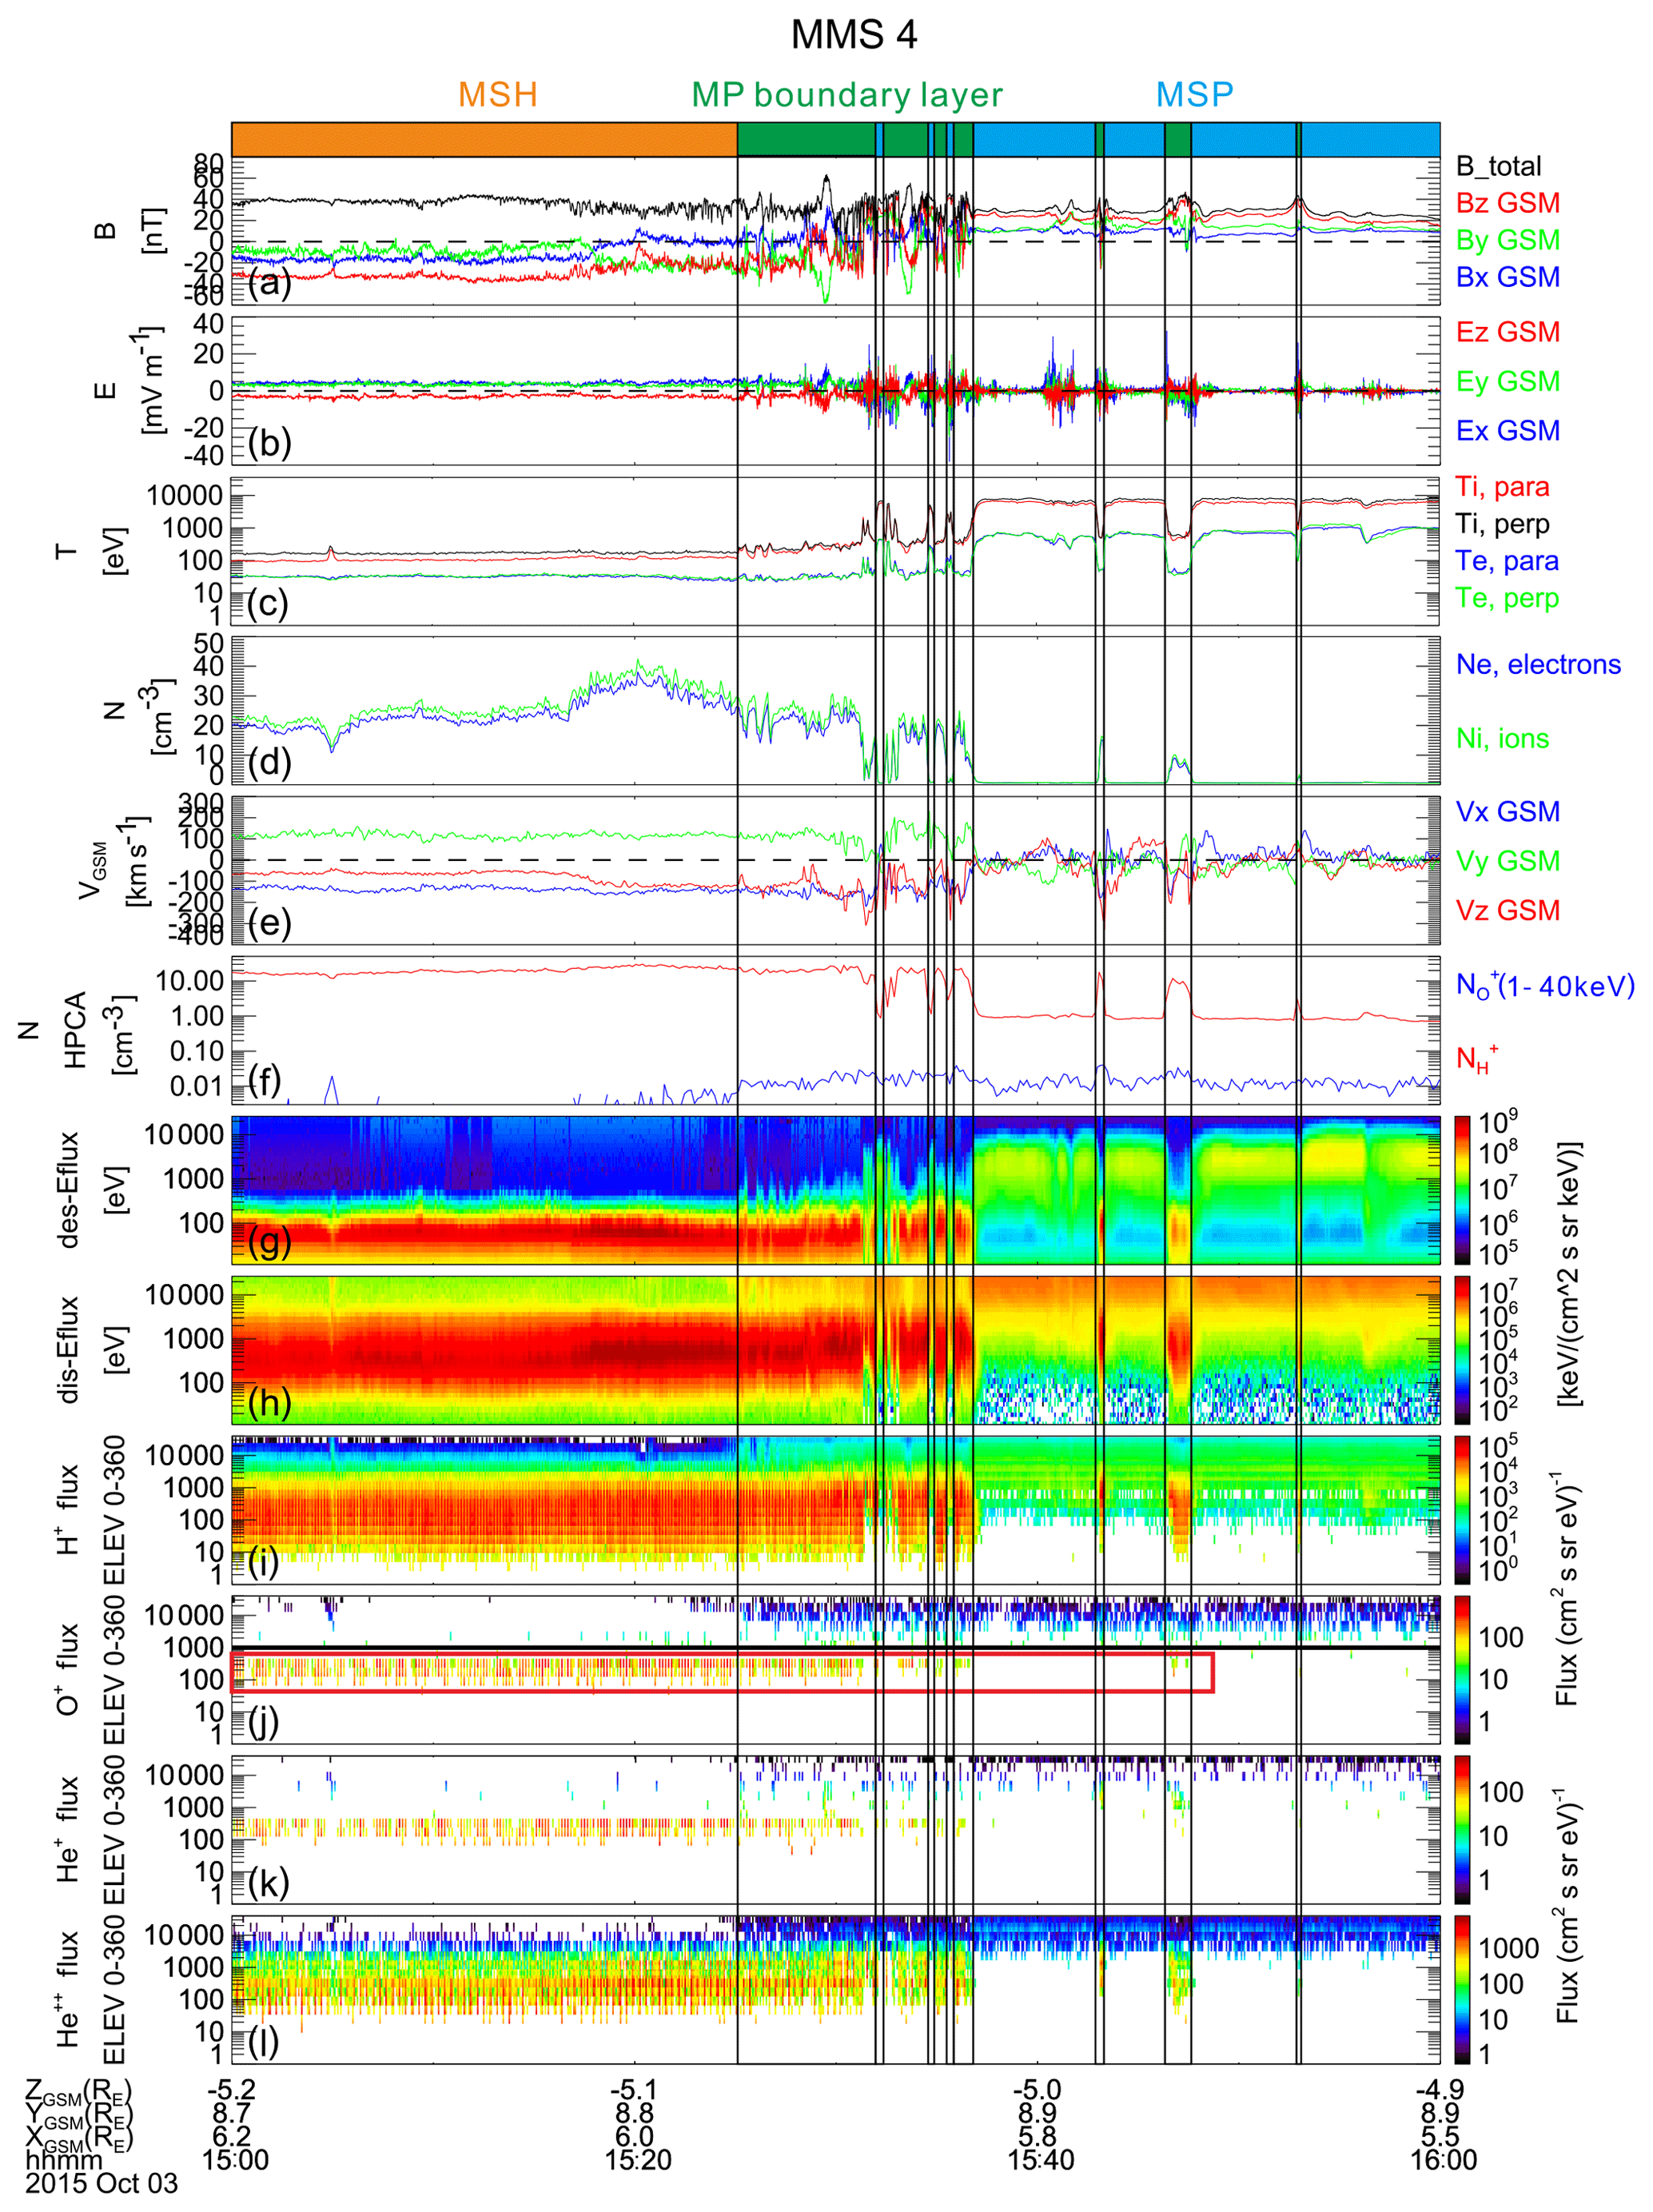
Figure 2The energetic O+ is observed at the magnetopause during an intense substorm on 3 October 2015 by MMS4. From top to bottom are (a) the magnetic field three components, Bx (blue line), By (green line), and Bz (red line), and the total magnitude Bt (black line), (b) the electric field three components, Ex (blue), Ey (green), and Ez (red), (c) ion parallel (red) and perpendicular (black) temperatures, as well as electron parallel (blue) and perpendicular (green) temperatures, (d) the density of ion (green) and electron (blue), (e) three components of the ion velocity, (f) the H+ (over the full HPCA energy range from 1 eV to 40 keV) and O+ (at energies from 1 to 40 keV) densities, (g–h) electron and ion omnidirectional differential energy fluxes (keV (cm2 s sr keV)−1), and (i) to (l) present differential particle fluxes (cm2 s sr eV)−1 of H+, O+, He+, and , respectively. The Geocentric Solar Magnetospheric coordinate system is adopted. The thick bars at the top of the panel present different regions encountered on this magnetopause crossing event. The orange and blue bars represent the magnetosheath and the magnetosphere, respectively. The green bar represents the magnetopause boundary layer. The black horizontal line in (j) is at 1 keV and the O+ contamination from high H+ fluxes is indicated by the red box. The FPI data in (c)–(e) and (g)–(h) are from FPI L2 data products and in the fast mode.
The different regions encountered by MMS4 during the interval of 15:00 to 16:00 UT are marked by the colored bar at the top of Fig. 2, with the magnetosheath shown in orange, the outer magnetosphere shown in blue, and the magnetopause boundary layer shown in green. From 15:00:00 to 15:25:10 UT, MMS4 was located in the magnetosheath. This region is characterized by the southward magnetic field, low ion and electron temperatures (a few hundred eV for ions and tens of eV for electrons, Fig. 2c) with relatively high densities (on the order of ∼20 cm−3, Fig. 2d), and a stable ion flow speed of about 100 km s−1. There are also very high fluxes at energies centered around 100 eV (nominal magnetosheath energy) for electrons (Fig. 2g) and at energies centered around 1 keV for ions (Fig. 2h; also see H+ fluxes in Fig. 2i and fluxes in Fig. 2l) in the magnetosheath, while the O+ and He+ fluxes above 1 keV nearly disappear in the magnetosheath (Fig. 2j and k). From Fig. 2j, the majority of the O+ fluxes at energies below 1 keV visible in the magnetosheath are the result of contamination from the high proton fluxes, as the red box indicated.
The primary magnetopause crossing from the magnetosheath into the magnetosphere lasts about 12 min, from about 15:25:10 to 15:36:50 UT. Partial encounters of the magnetopause by MMS4 occurred around 15:43:15, 15:47:10, 15:53:00 UT, etc. The magnetopause boundary layer is identified by the plasma moments and the electromagnetic field. The plasma density and temperature at the magnetopause are between the corresponding values of the magnetosphere and the magnetosheath, as shown in Fig. 2d and c. The magnetopause boundary layer can also be identified by the significant increases in electron fluxes at energies about several hundred eV and ion fluxes at energies around ∼10 keV, as shown in Fig. 2g and h, respectively. During this time of interest, the Bz component rotated from southward to northward and back again several times before finally becoming northward when MMS4 entered the magnetosphere. The energetic O+ density (1–40 keV) is around 0.018 cm−3 within the magnetopause boundary layer as shown in Fig. 2f. The corresponding H+ and O+ fluxes at specific energies and their densities (shown in Fig. 2f) were averaged in this region.
After 15:36:50 UT, MMS4 entered the magnetosphere, which is identified by the observations of the northward magnetic field (Fig. 2a), much lower plasma densities (on the order of ∼1 cm−3) with respect to the densities in the magnetosheath (Fig. 2d), higher plasma temperatures (Fig. 2c, several keV for ions and a few hundred eV for electrons), and a small bulk ion flow speed. Higher fluxes at energies around several keV for electrons (Fig. 2g) and at energies centered around ∼10 keV for ions (Fig. 2h) also indicate that the MMS4 was in the magnetosphere. Finally, the presence of O+ and He+ at energies about ∼10 keV is also used as a marker to verify that MMS4 was in the magnetosphere (Fig. 2j and k).
3.2 Statistical 57 events of energetic O+ at the duskside magnetopause during intense substorms
Based on the in situ measurements of the dayside magnetopause crossings by MMS satellites in phase 1, we identified the duskside magnetopause crossing event (complete magnetopause crossing from the magnetosheath to the magnetosphere, vice versa) from the summary plot in https://lasp.colorado.edu/mms/sdc/public/plots/#/quicklook (last access: 25 January 2020). Then we plotted the more detailed overview figure of these events to identify the magnetopause boundary layer, as Fig. 2 shows. Only events with an AE index larger than 500 nT during the magnetopause boundary layer crossings interval were selected. There are 57 events of the duskside magnetopause boundary layer crossing during intense substorms satisfied with the above criterion. In our statistical study, the mean values of the H+ and O+ fluxes at specific energies and their densities are calculated in the magnetopause boundary layer. Correspondingly, the solar wind dynamic pressure, IMF By, IMF Bz, and AE index from the OMNI data system were averaged during the magnetopause boundary layer crossing time interval, as the two blue dashed lines show in Fig. 1. The phase of the substorm is determined from the variations of AU, AL, and AE indexes, as mentioned before. For better follow-on studies, we add more detail information about 57 energetic O+ events to the Supplement. From the Supplement, we can easily draw the conclusion that the O+ density in the duskside magnetopause during the recovery phase (0.081 cm−3) of intense substorms is larger than that during the expansion phase (0.069 cm−3).
Figure 3 displays the locations of 57 energetic O+ events at the duskside magnetopause (−5.7 RE) during intense substorms projected into the XYGSM plane. The blue curve line represents the nominal magnetopause, which is obtained by the magnetopause model of Shue et al. (1998) when the IMF Bz is about −3.21 nT and solar wind dynamic pressure (Psw) is ∼2.87 nPa (averaged for the 57 events). The diamond and circle represent the event at the duskside magnetopause during the intense substorm expansion phase and recovery phase, respectively. The O+ density and the density ratio are shown by the colored diamonds and circles at the corresponding magnetopause locations in Fig. 3a and b, respectively. Among the 57 events of energetic O+ at the duskside magnetopause during intense substorms, there are 26 events that occurred during the expansion phase of intense substorms and 31 events that occurred during the recovery phase. The maximum density of energetic O+ is found during the intense substorm recovery phase, as presented in Fig. 3a.
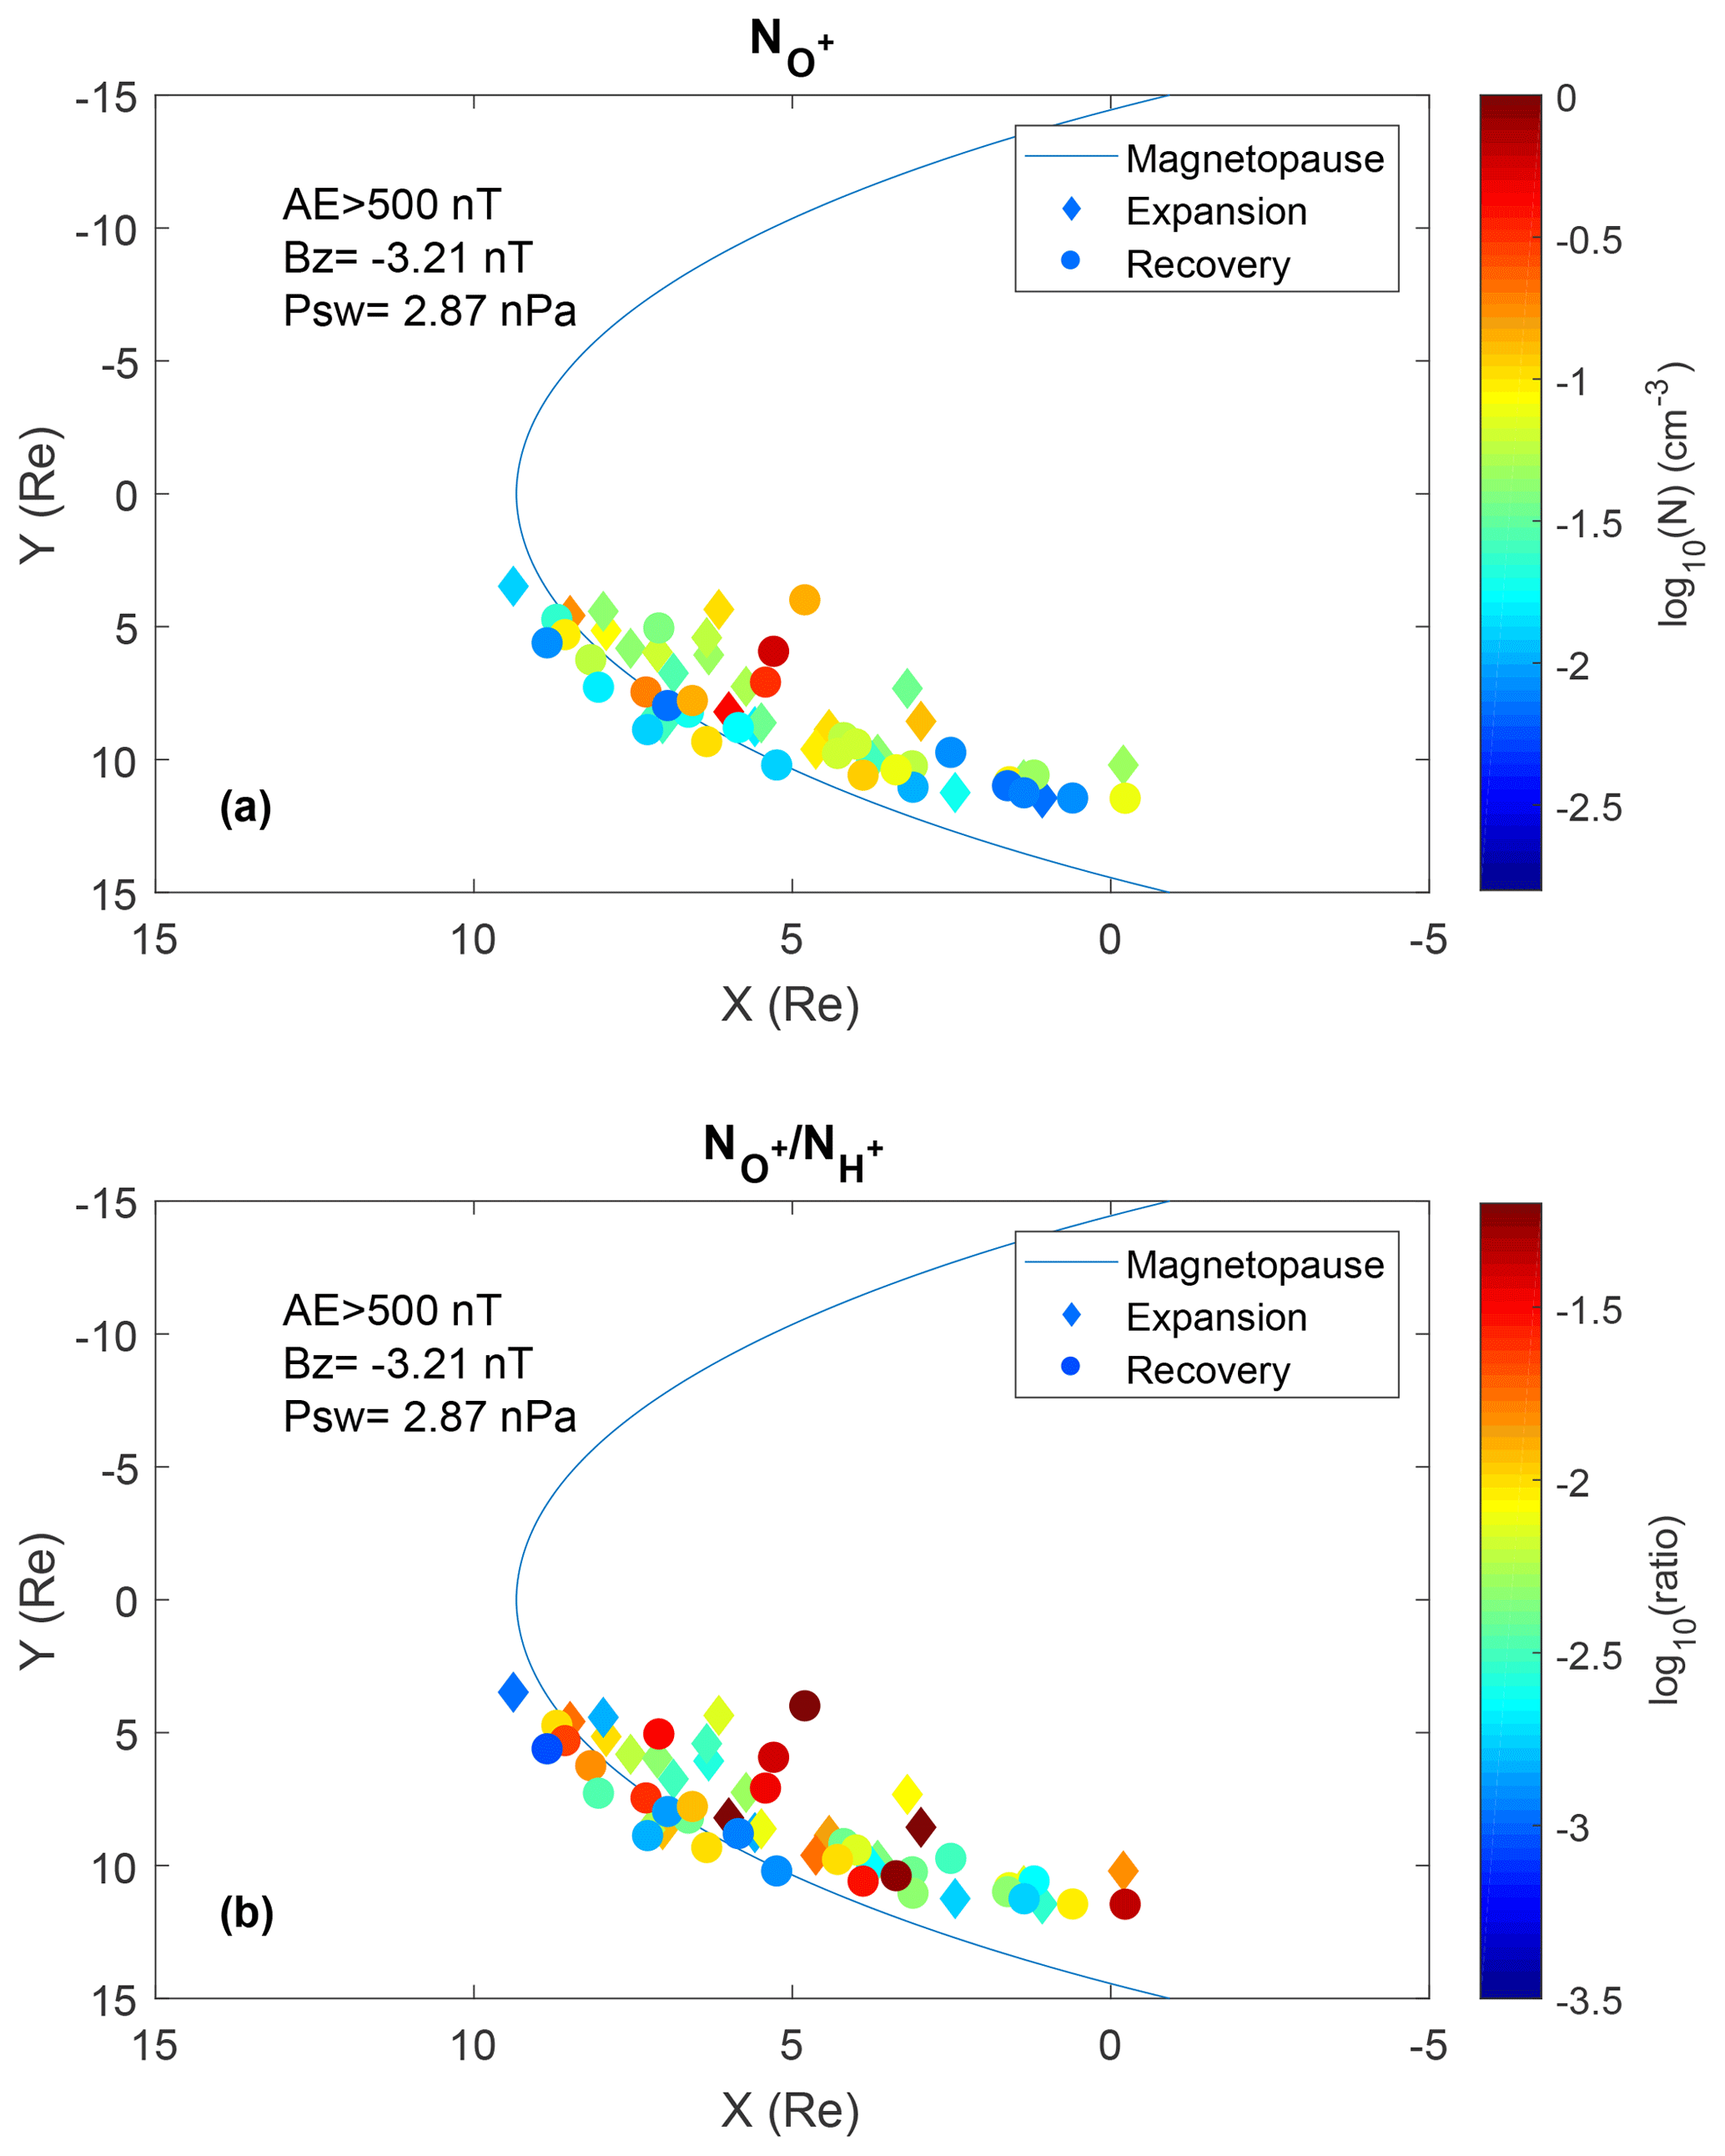
Figure 3Maps of 57 events of energetic O+ at the duskside magnetopause during intense substorms with an AE index larger than 500 nT in the XYGSM plane. The O+ density and the density ratio of are shown by the color signatures at the corresponding magnetopause locations in (a) and (b), respectively. The blue curve line represents the nominal magnetopause. The diamond and circle represent the event at the magnetopause during the intense substorm expansion phase and recovery phase, respectively.
Figure 4 presents the relationship between the energetic O+ at the duskside magnetopause and AE index during intense substorms. From top to bottom, panels show the O+ and H+ densities (Fig. 4a), the density ratio (Fig. 4b), and particle flux ratios at different energy ranges (Fig. 4c), respectively. The energy channel ranges for O+ and H+ in the HPCA are the same. So the particle flux ratio is directly defined as the ratio between mean values of their fluxes, respectively. The particle fluxes are chosen at energies ∼1 keV (energy range from 987.82 to 1165.21 eV), ∼ 10 keV (energy range from 9.97 to 11.77 keV), ∼20 keV (energy range from 19.31 to 22.78 keV), and ∼35 keV (energy range from 31.69 to 37.39 keV). The error bars indicating the 90 % confidence interval (CI) are also overplotted in each point. The confidence interval is based on the following formula:
where , s, and n are the mean value, standard deviation, and sampling number of observations, respectively. k in the above formula can be determined by calculating a 90 % confidence interval for each event (the k value is 1.65). Figure 4a shows that energetic O+ density at the duskside magnetopause during intense substorms is in the range from 0.007 to 0.599 cm−3. The maximum density value of energetic O+ at the duskside magnetopause during the intense substorm recovery phase is presented at the higher AE index at about 606 nT. The density ratio decreases with the AE index from 900 to 1100 nT. The variations of the O+ density and density ratio with the AE index do not show an obvious difference between during the expansion phase and the recovery phase.
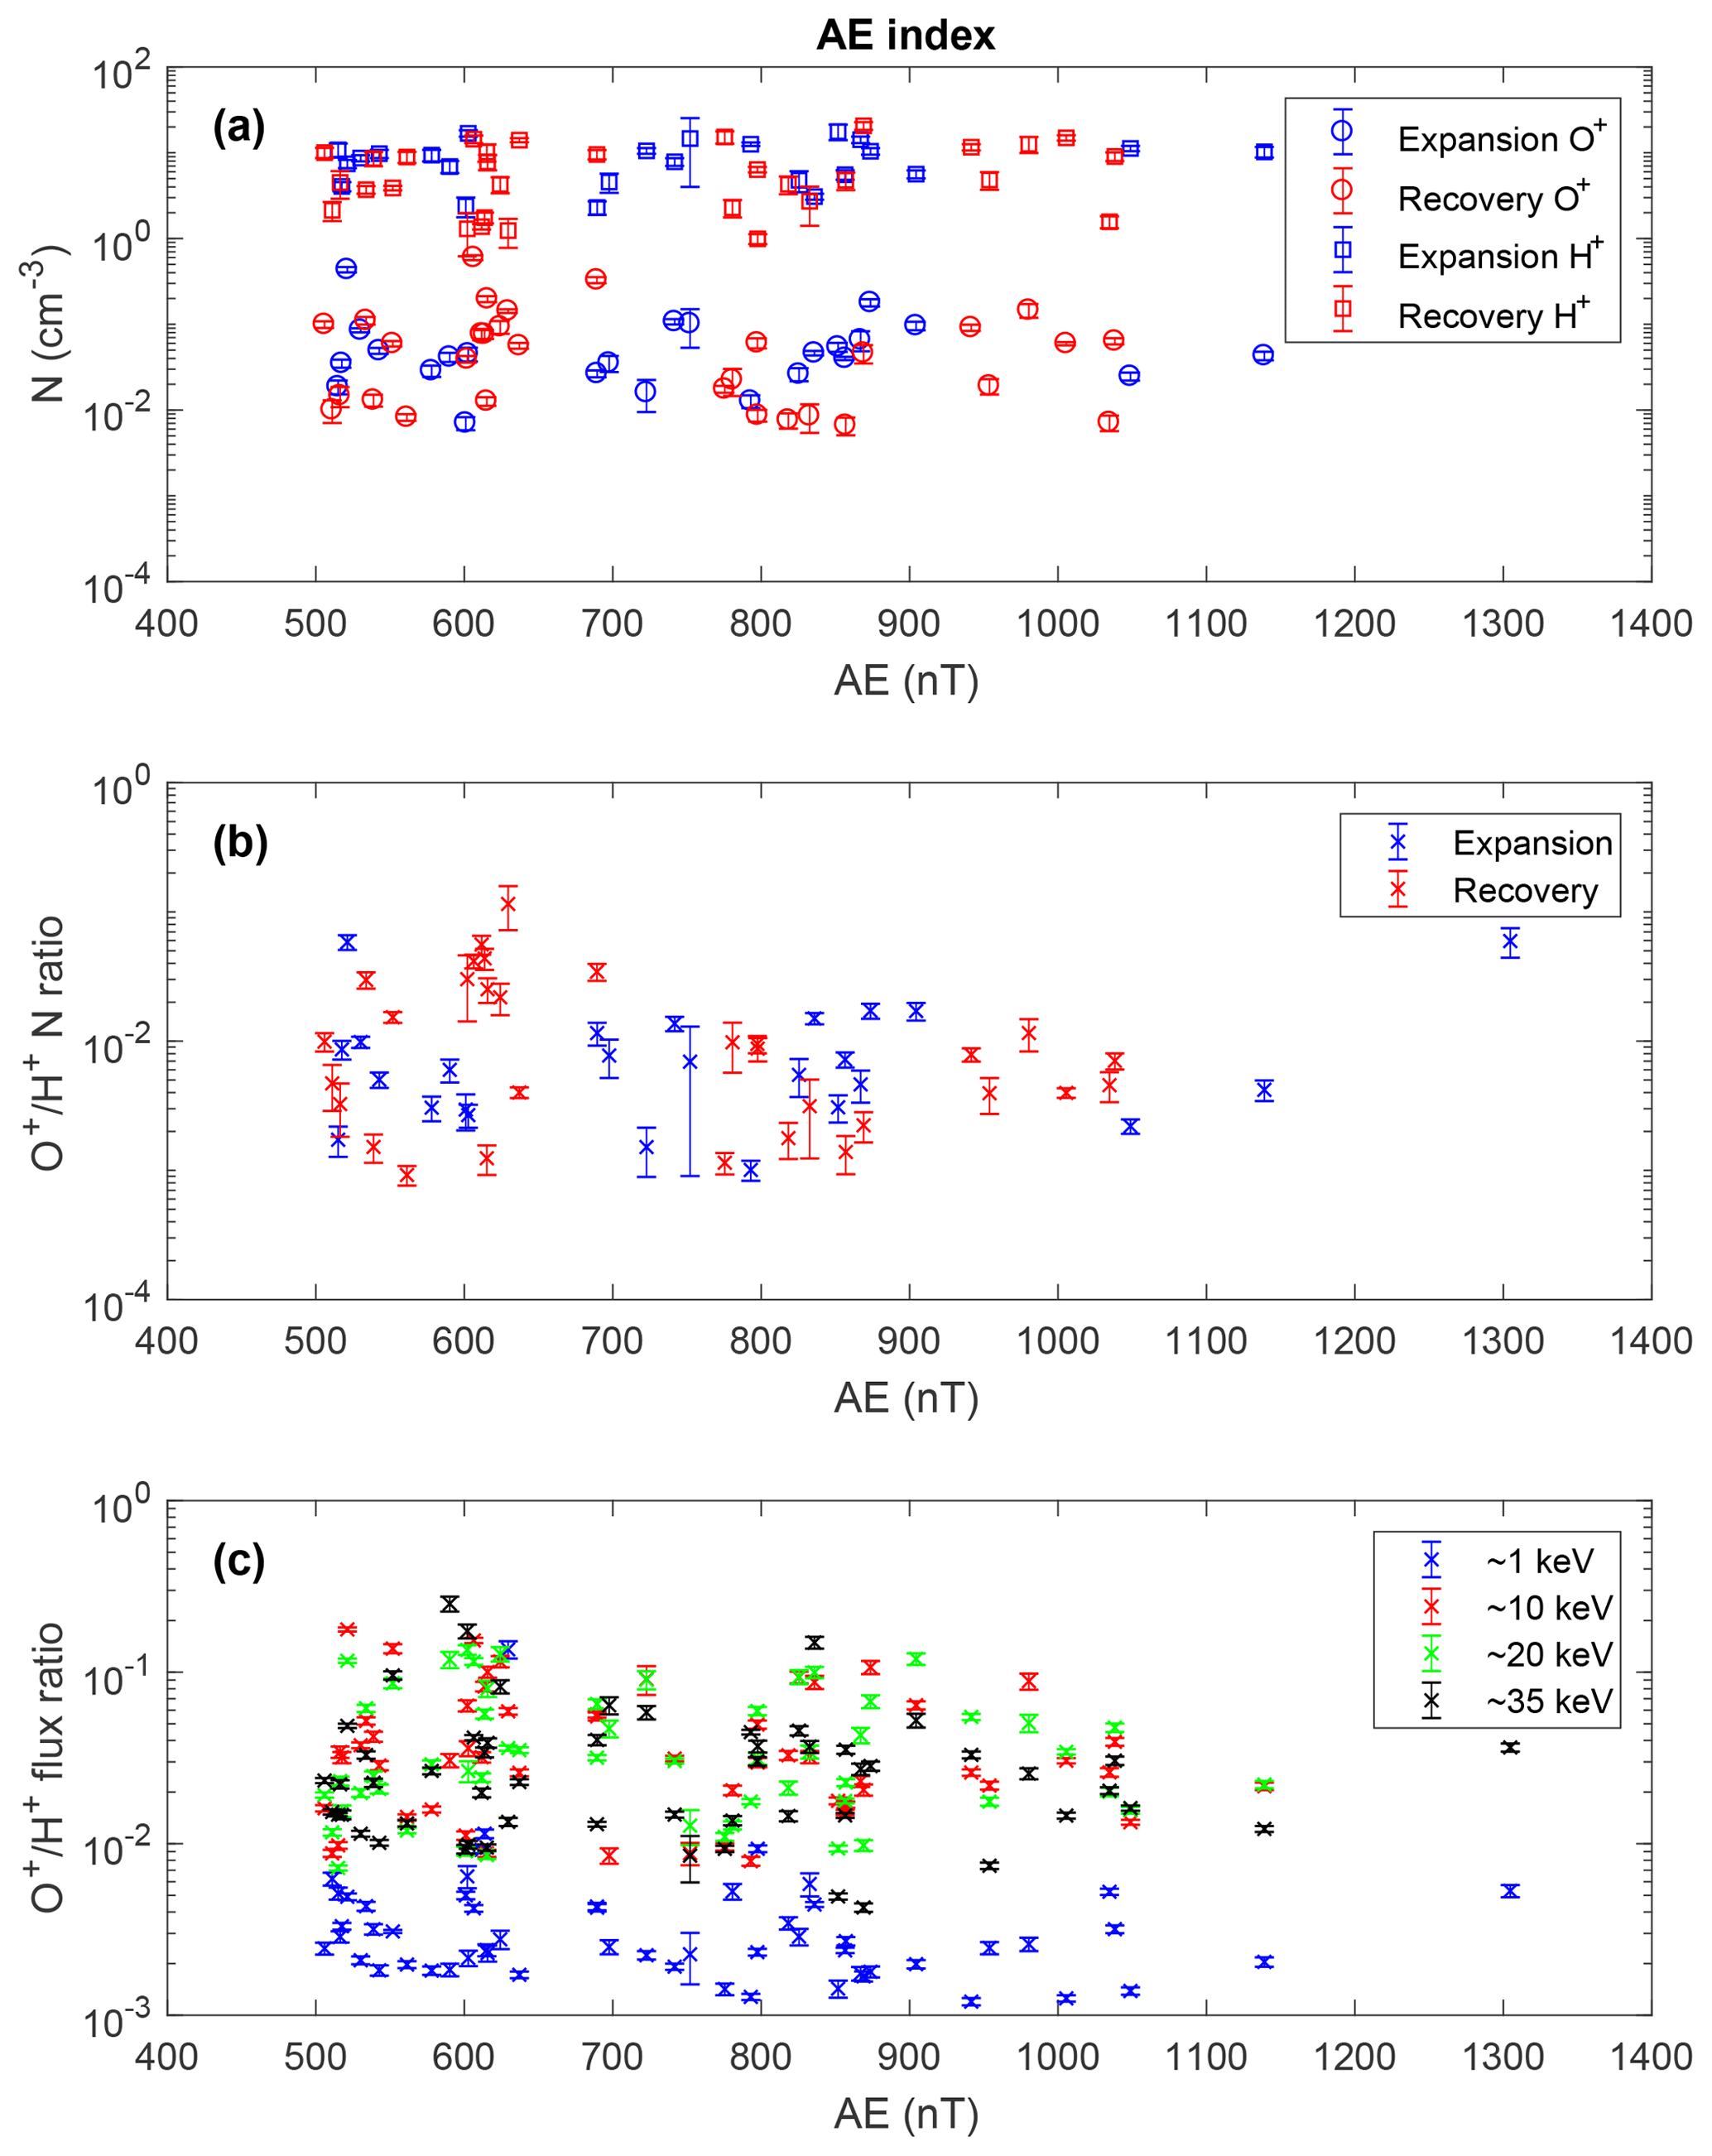
Figure 4The relationship between the energetic O+ at the duskside magnetopause and the AE index during intense substorms. From top to bottom, panels show the O+ and H+ densities (a), the density ratio (b), and the particle flux ratio (c), respectively. Error bars indicate 90 % confidence intervals.
Figure 5 shows the relationship between the energetic O+ at the duskside magnetopause and IMF By during intense substorms. The format of Fig. 5 is the same as that of Fig. 4. Figure 5a shows that the O+ and H+ densities decrease with IMF By from −6 to 0 nT and increase with IMF By from 4 to 8 nT. From Fig. 5b, the density ratio shows an exponential growth with the IMF By. Based on the scatter plot in Fig. 5b, we can define linear functional dependence between the logarithm of density ratio and IMF By, as Eq. (1) shows, and the corresponding correlation coefficient is 94 %. The correlation coefficient close to 100 % indicates that there is a great correlation.
The dependency is constructed using a linear least-squares fit unless otherwise stated. The particle flux ratios at energy ∼10, ∼20, and ∼35 keV also show an obvious exponential increase with IMF By. This dependency is consistent with Welling et al. (2011) simulation results found in the ring current.
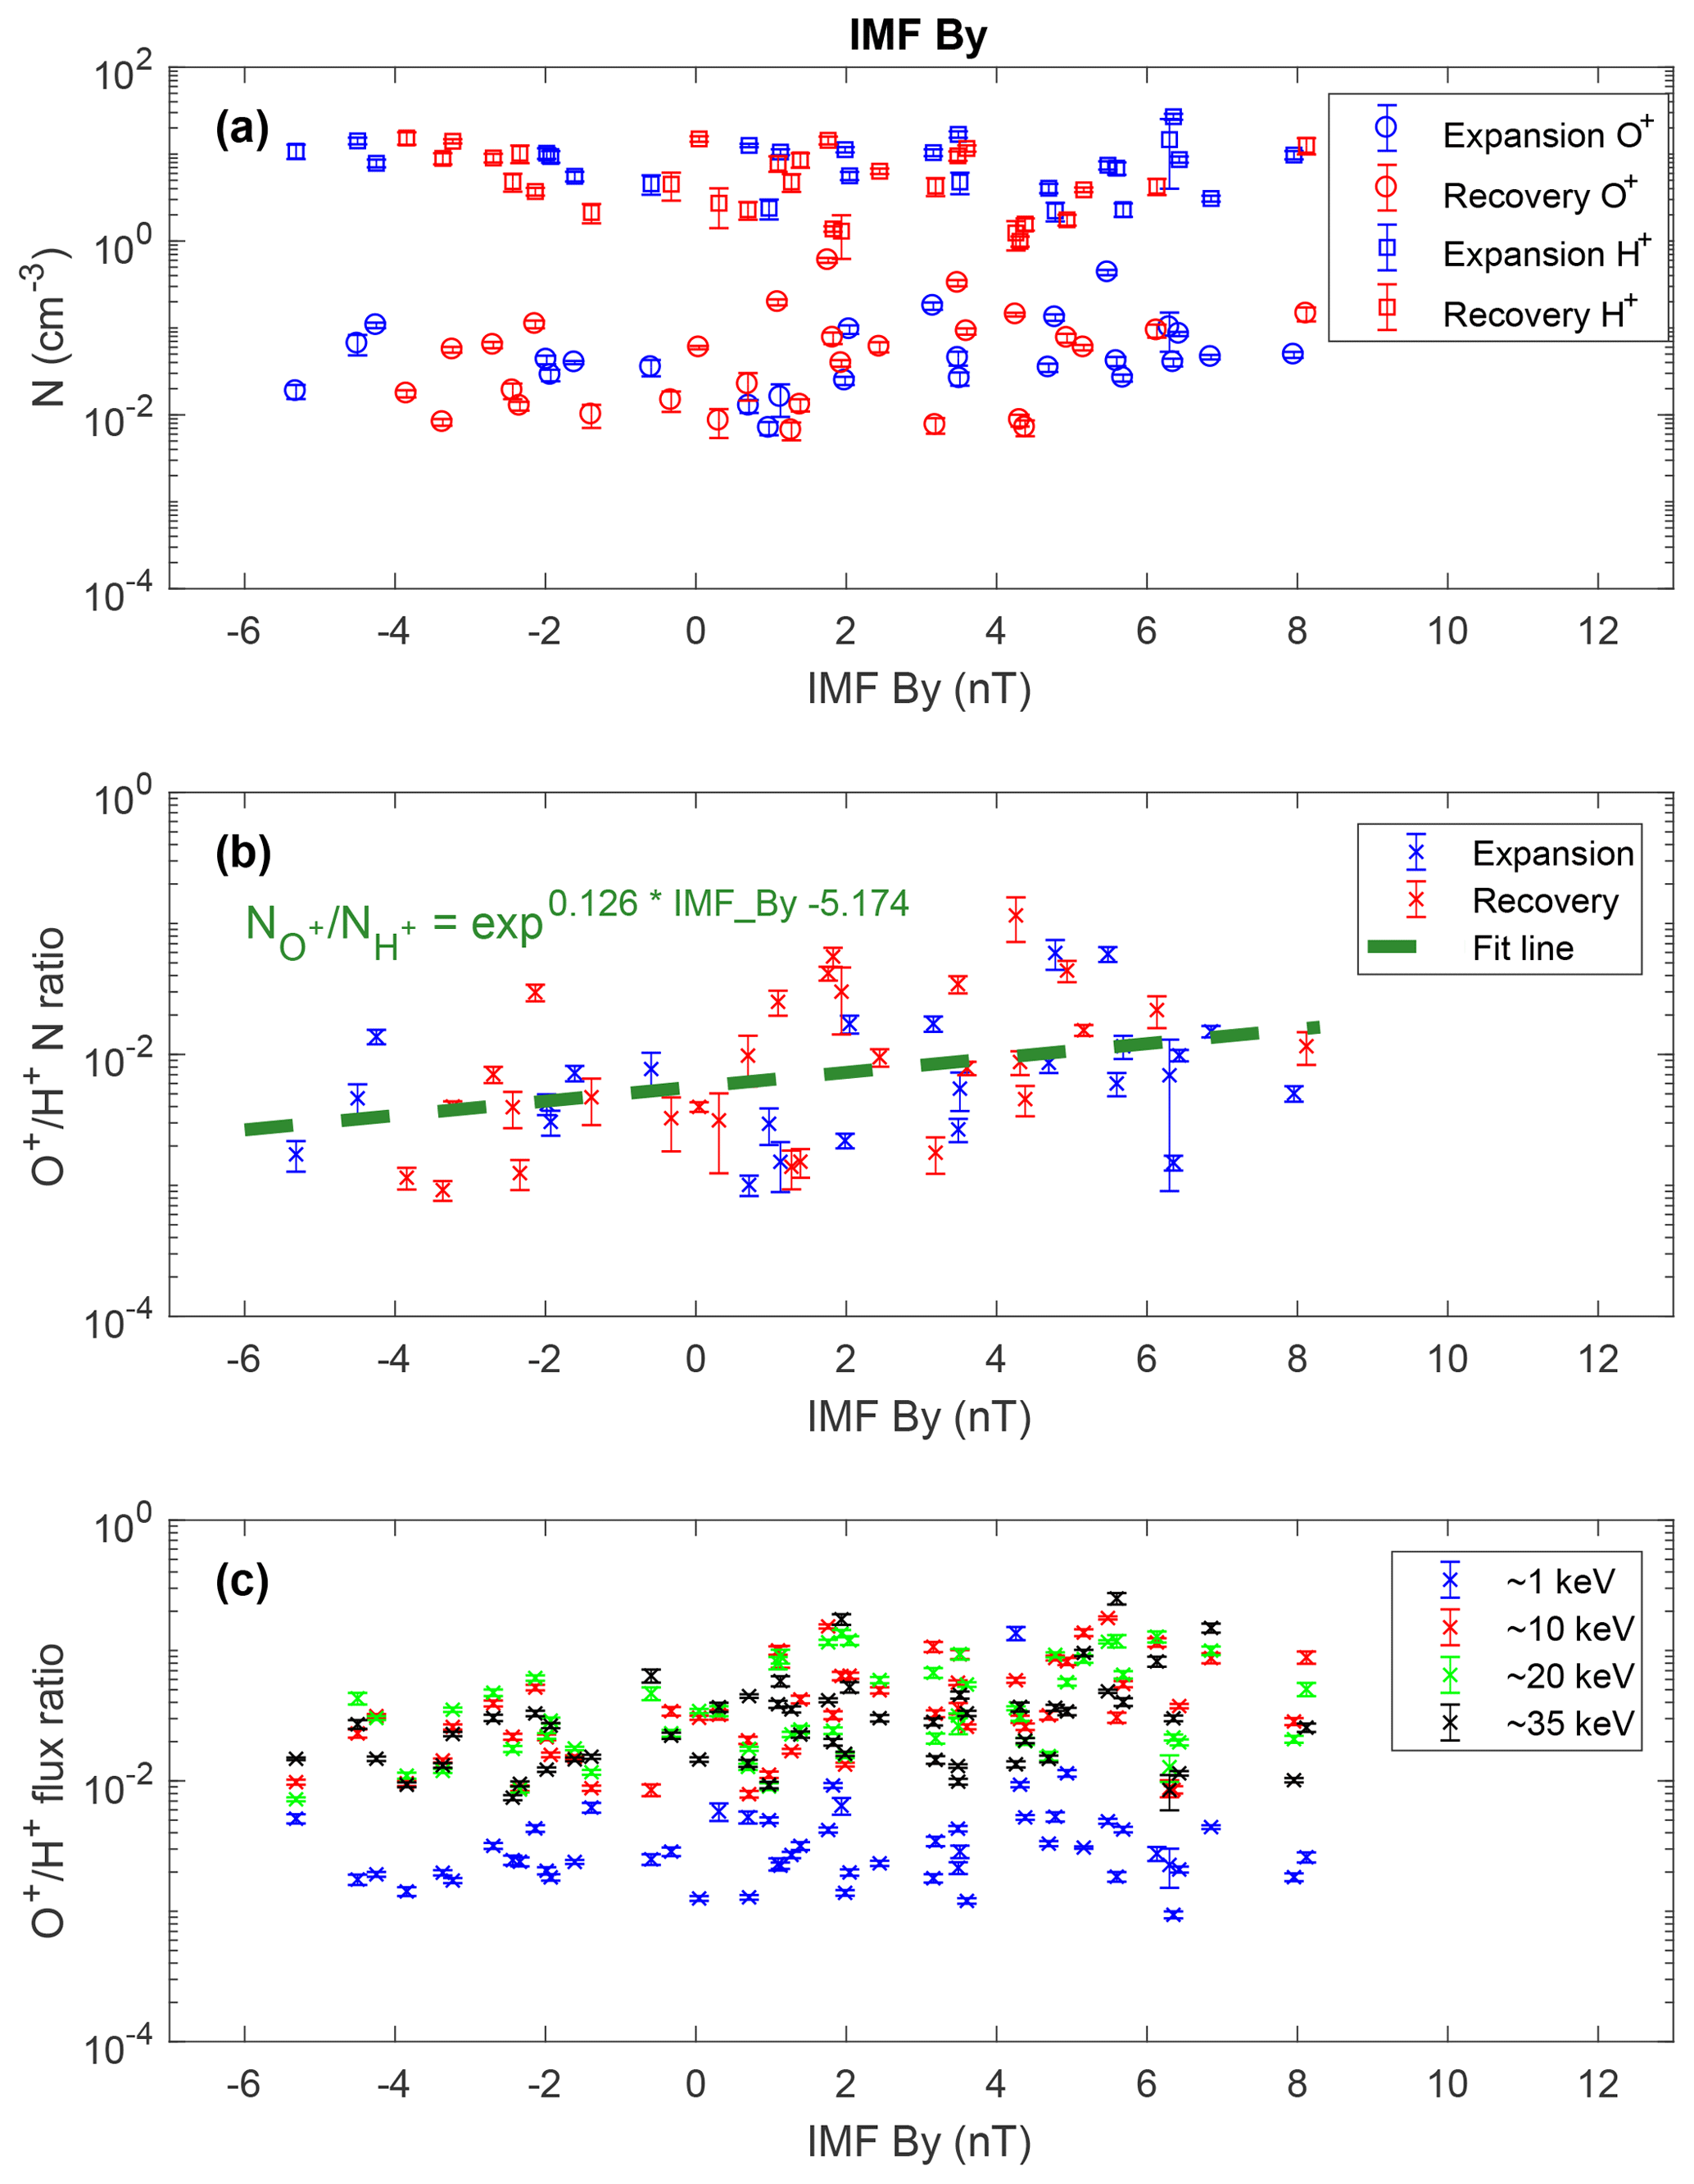
Figure 5The relationship between the energetic O+ at the duskside magnetopause and IMF By during intense substorms. The format is the same as that of Fig. 4.
Figure 6 shows the relationship between the energetic O+ at the duskside magnetopause and IMF Bz during intense substorms. The format of Fig. 6 is the same as that of Fig. 4. Figure 6a and b both show that among 57 events of energetic O+ at the duskside magnetopause boundary layer during intense substorms, there are 50 events under southward IMF and only 7 events under northward IMF. It is noted that 26 events occurred during the expansion phase of intense substorms which are all under the southward IMF conditions, as the blue points show. Meanwhile, the events that occurred under northward IMF are all during the intense substorm recovery phase, as the right red points with positive IMF Bz show. From −10 to 0 nT, the O+ density shows an obvious decrease with IMF Bz. To better describe this variation trend, the empirical functional relation between the logarithm of O+ density and IMF Bz (from −10 to 0 nT) is established in Eq. (2) and the corresponding correlation coefficient is 94 %, while the O+ density has a positive correlation with IMF Bz from 0 to 5 nT.
From Fig. 6b, the density ratio during the recovery phase decreases with IMF Bz from about −2 to 2 nT. The maximum density of energetic O+ at the duskside magnetopause is under southward IMF. Meanwhile, the maximum density ratio at the duskside magnetopause is also under southward IMF.
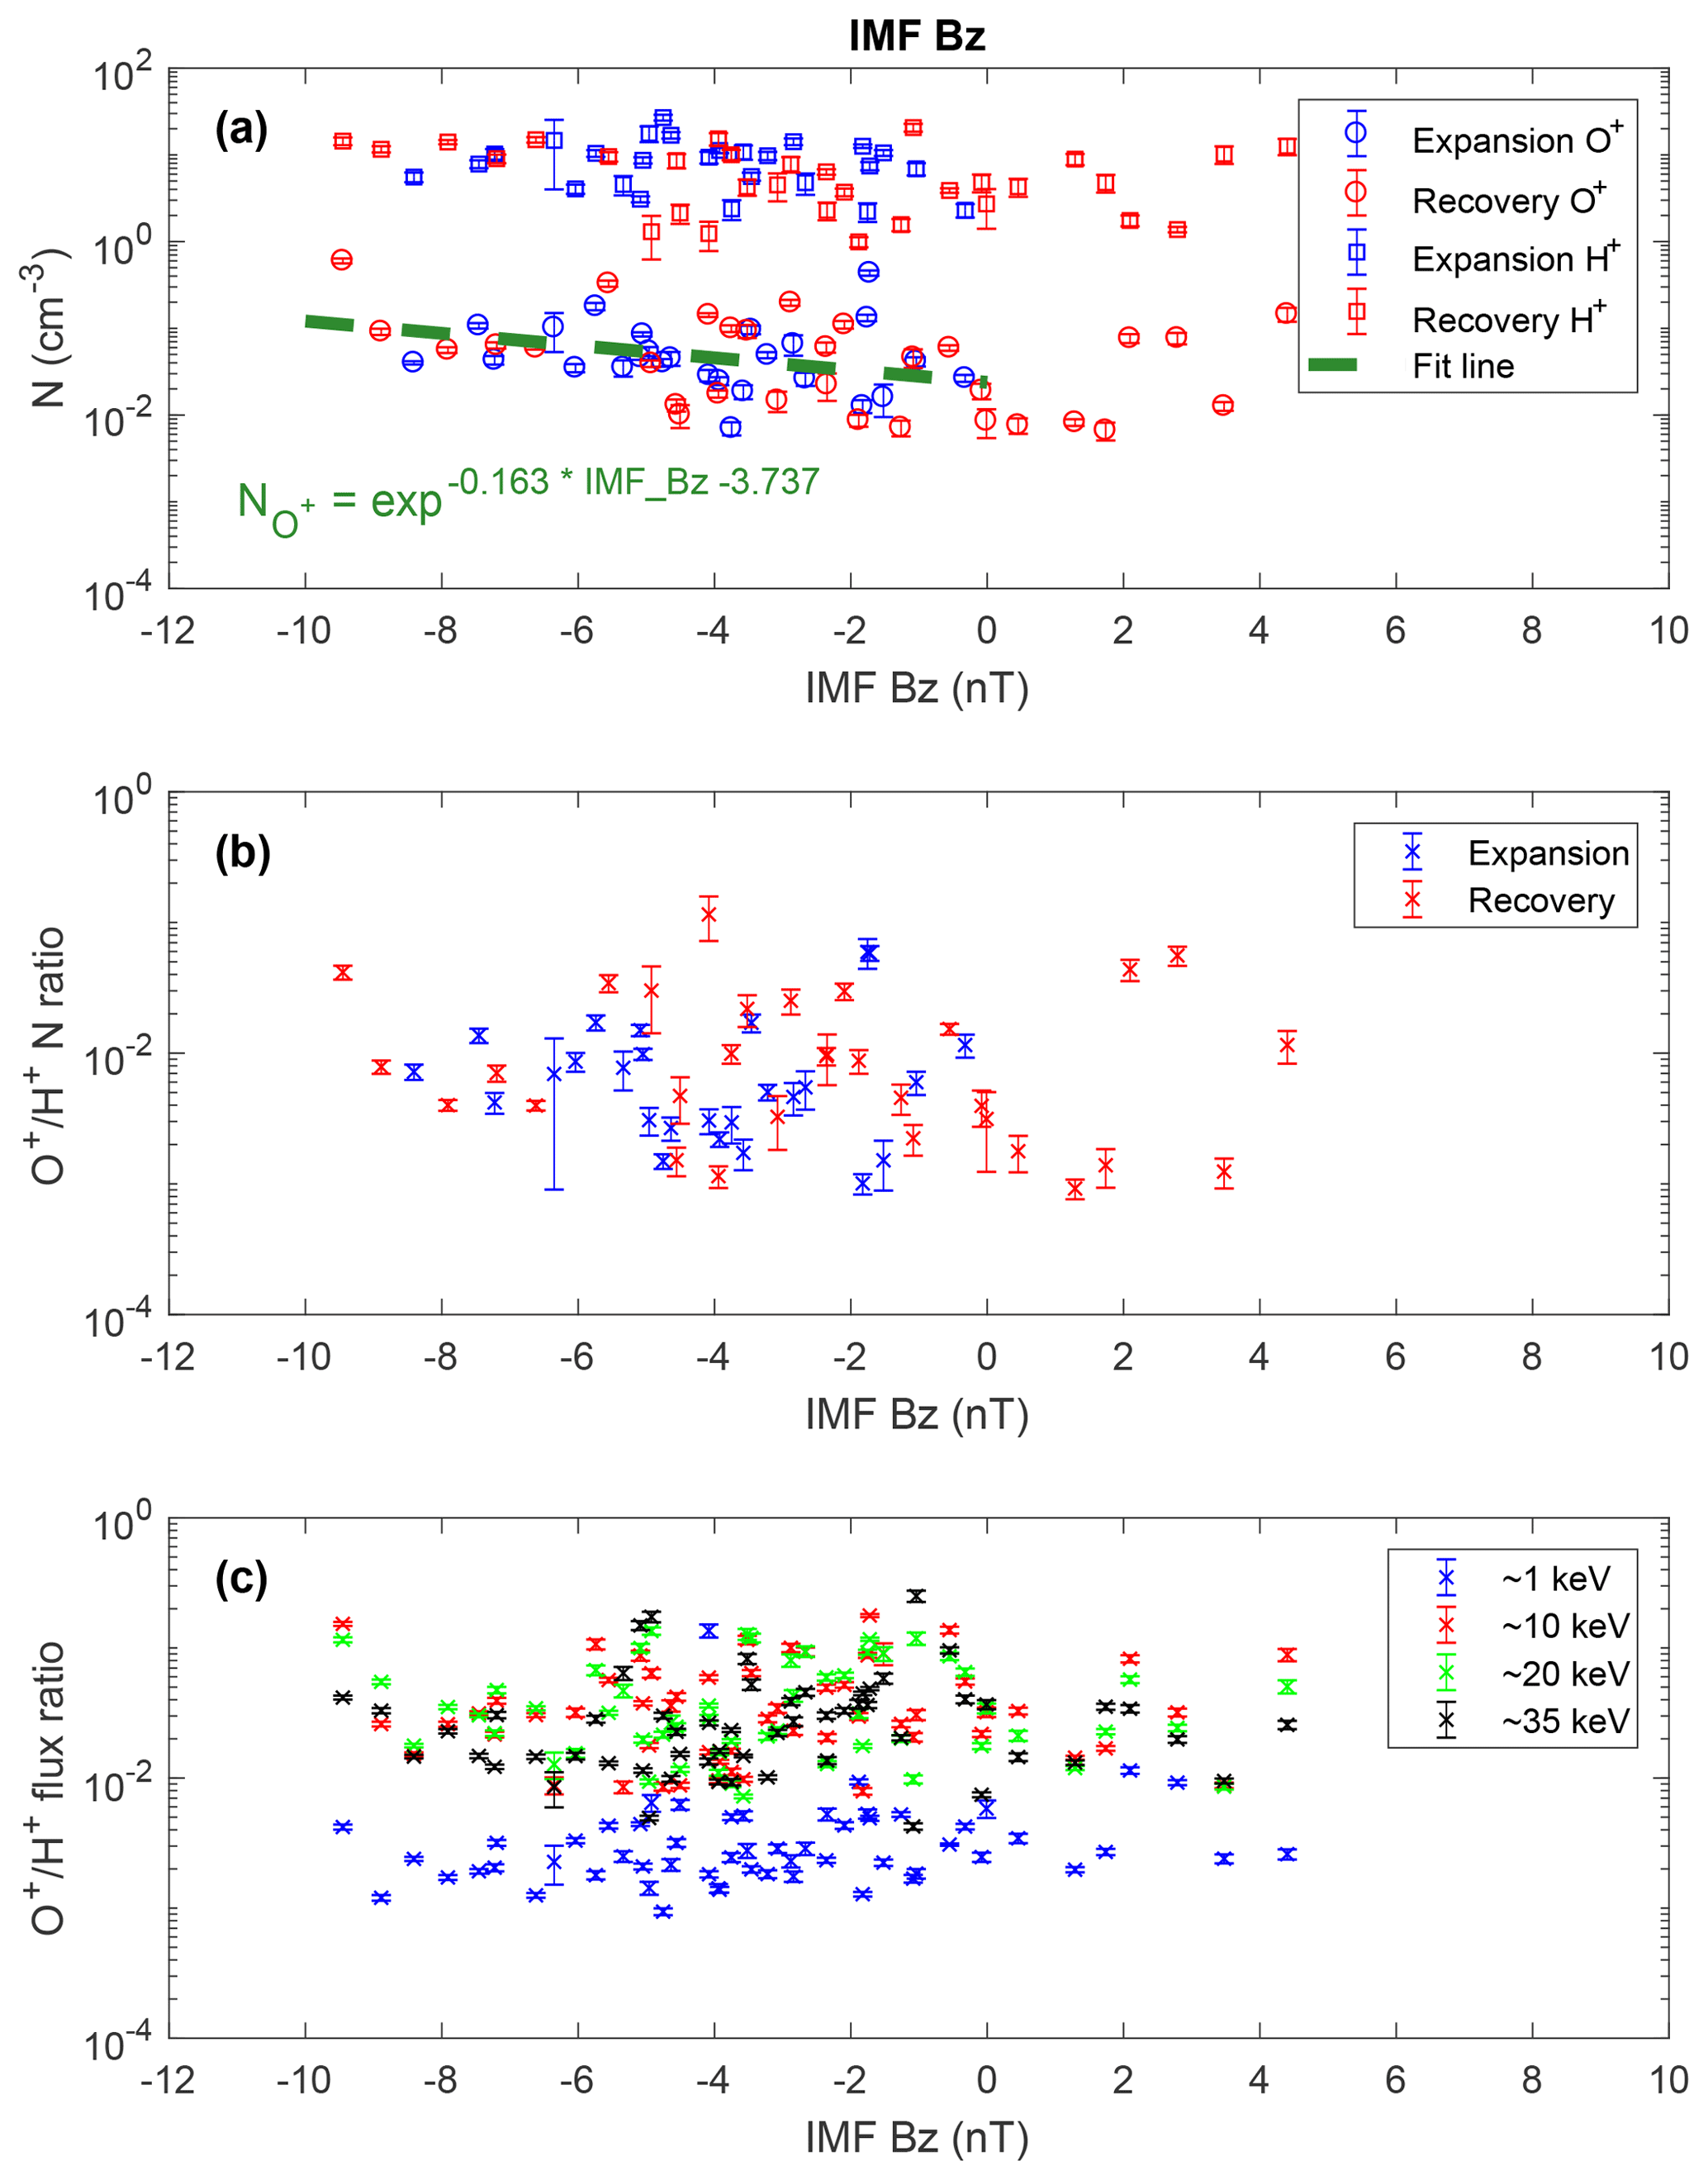
Figure 6The relationship between the energetic O+ at the duskside magnetopause and IMF Bz during intense substorms. The format is the same as that of Fig. 4.
Figure 7 displays the relationship between the energetic O+ at the duskside magnetopause and solar wind dynamic pressure during intense substorms. The format of Fig. 7 is the same as that of Fig. 4. Figure 7a shows that the O+ density at the duskside magnetopause during intense substorms has a positive correlation with the solar wind dynamic pressure. The empirical functional relation between the logarithm of O+ density and solar wind dynamic pressure (from 1 to 4.5 nPa) is also established in Eq. (3), and the corresponding correlation coefficient is 94 %.
From Fig. 7b, the density ratio during the recovery phase shows a decrease from about 2.5 to 3 nPa. It is noted that the density ratio increases with solar wind dynamic pressure from about 3 to 4 nPa. The maximum density of energetic O+ at the duskside magnetopause, ∼0.599 cm−3, that takes place at solar wind dynamic pressure is about 3.9 nPa, while the maximum density ratio at the duskside magnetopause appeared at solar wind dynamic pressure around 2.2 nPa. More details can be found in the Supplement.
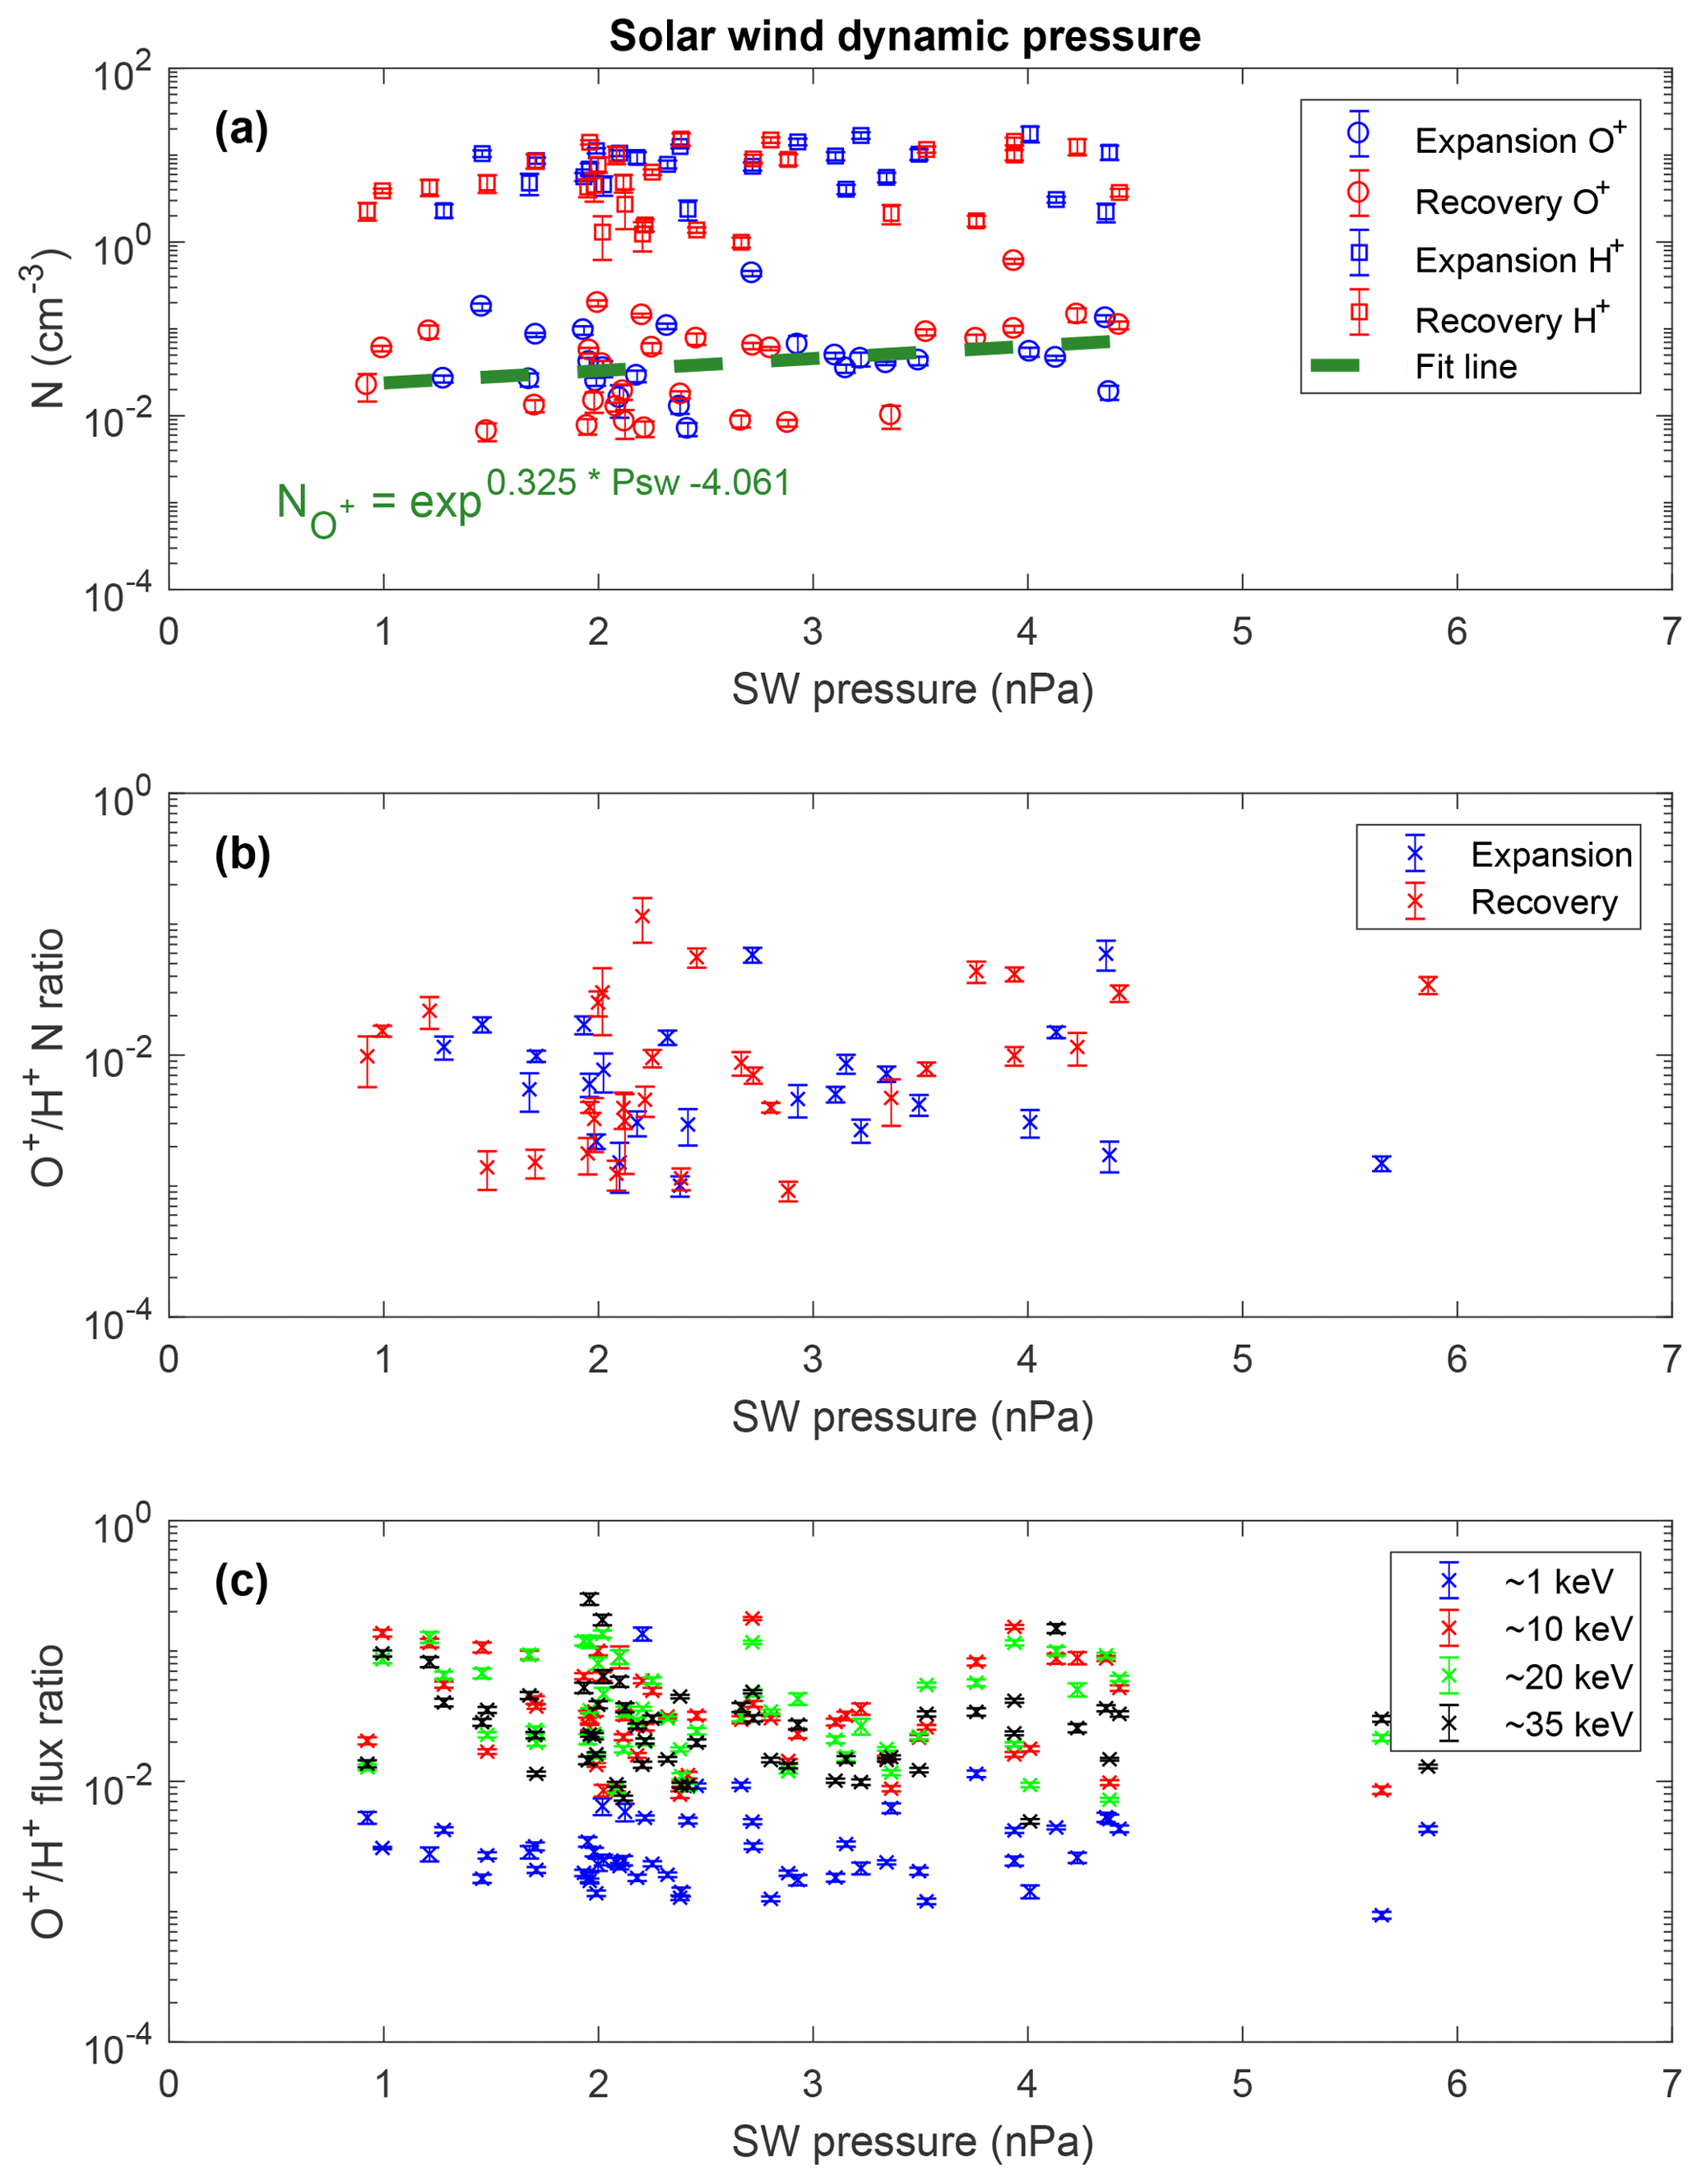
Figure 7The relationship between the energetic O+ at the duskside magnetopause and solar wind dynamic pressure during intense substorms. The format is the same as that of Fig. 4.
Energetic O+ (1–40 keV) with high density are observed by MMS satellites at the duskside magnetopause during the expansion phases and recovery phases of intense substorms, as displayed in Fig. 3a. The density of energetic O+ is in range from 0.007 to 0.599 cm−3 at the duskside magnetopause boundary layer during intense substorms. In a companion paper from Zeng et al. (2020), they study the O+ abundance variations on the solar wind conditions at the dayside magnetopause boundary layer and not specific to the events that occurred during intense substorms. The mean value of the O+ density at the duskside magnetopause boundary layer is 0.038 cm−3 in that paper, while during the intense substorm, the O+ density increases to 0.075 cm−3 in this study. There are two reasons for this high density of energetic O+ observed during the intense substorm. The first is the time interval for the observations. Our observations are during intense substorms' expansion phase and recovery phase. Daglis et al. (1991) proposed that energetic O+ were significantly higher in the NEPS in the magnetotail after intense substorm onset. The impulsive electric field accompanied by intense substorm dipolarization plays a key role in the energization and sunward transfer of oxygen ions in the duskside of the midnight plasma sheet in the magnetotail (e.g., Fok et al., 2006; Nosé et al., 2000). These energetic O+ (tens of keV) can be transported sunward into the duskside magnetopause boundary layer. The second reason for the high densities is the locations of the observations. Our observations are near the duskside magnetopause. This region is easily accessible by energetic O+ during intense geomagnetic activity (Fuselier et al., 2016a). Phan et al. (2004) pointed out that energetic O+ with very high density 0.2–0.3 cm−3 in the reconnection jets at the duskside mid-latitude magnetopause were observed by Cluster.
During dynamic periods and intense substorm times, light ions yielded more symmetric patterns in density than heavy ions, and the O+ patterns in the active plasma sheet are a function of IMF conditions (Winglee and Harnett, 2011; Winglee et al., 2005). Welling et al. (2011) used multispecies MHD and the PWOM to drive a ring current model and found that positive IMF By pushed the stronger O+ concentrations toward the duskside at a geocentric distance of about 6.6 RE. This O+ density duskward preference with positive IMF By in the NEPS is similar to our results. It may indicate that O+ in the magnetopause boundary layer enhancing with IMF By is due to the local time variations of O+ in the NEPS tied to IMF By. Our result of O+ density increase with IMF By also agrees with Kronberg et al. (2012). They showed for 10 keV O+ strong increases under the duskward IMF indicated by the clock angle in the inner magnetosphere. It is suggested that the O+ abundance at the duskside magnetopause has a corresponding relation to the O+ in the duskside near-Earth magnetosphere during intense substorms. The O+ path from the cusp to the magnetotail is asymmetric, and it has the best correlation with the IMF directions. This path asymmetry mainly controlled by the IMF By may influence the O+ abundance at the duskside magnetopause. When the IMF By is positive, the O+ from the northern/southern cusp tends to flow toward the dawnside/duskside. The transport path for negative IMF By is more symmetric but shows some evidence of a reversed asymmetry when the negative IMF By is large enough, while the IMF Bz has little influence on the asymmetry (Liao et al., 2010).
Due to not enough events that occurred under northward IMF being observed, the influence of IMF Bz on the O+ abundance (1–40 keV) during intense substorms is not clear, while Luo et al. (2017) found that the O+ intensity ( keV) was significantly higher under southward IMF than that under northward IMF, especially at the duskside magnetopause. Zeng et al. (2020) also showed that the duskside asymmetry of O+ density (1–40 keV) in the dayside magnetopause under northward IMF was less obvious than under southward IMF when the IMF By was the same. Under the southward IMF, the interactions between the solar wind and the magnetosphere become active. The inductive electric field or magnetic field gradient related to magnetic reconfiguration will enhance with negative IMF Bz. So, the large-scale dawn–dusk electric field drift along with the gradient–curvature drift can force oxygen ions to convect to the duskside magnetopause boundary layer (Kronberg et al., 2015; Luo et al., 2017).
In this statistical study, there are 50 magnetopause boundary layer crossing events during intense substorms under a southward IMF as opposed to 7 events under a northward IMF. Choosing the intense substorm may increase the probability of observing the events under a southward IMF quite significantly. Among 57 events of energetic O+ near the duskside magnetopause, there are 26 events during the intense substorm expansion phase which are all under the southward IMF, as the blue circle shows in Fig. 6b. There are only 7 events under a northward IMF in our study, and they all occurred during the intense substorm recovery phase. But what relation between the IMF directions and phase of substorm exists is beyond the scope of this article.
Previous studies demonstrated that the oxygen ions that originate from the aurora region could rapidly feed in the NEPS during intense substorm expansion phases (e.g., Daglis and Axford, 1996; Duan et al., 2017; Yu et al., 2013). Oxygen ions can be efficiently energized in the NEPS during intense substorm dipolarization (e.g., Duan et al., 2017; Fok et al., 2006; Nosé et al., 2000). Under southward IMF conditions, these energetic oxygen ions in the NEPS can be convected sunward and drift westward. As a result, the energetic O+ arriving near the duskside magnetopause can participate in the magnetopause reconnection and escape along reconnected field lines during an intense substorm expansion phase, as reported by Wang et al. (2014) and Zong et al. (2001). When O+ participate in the reconnection jets, the reconnection rate will likely be reduced by the mass loading but not suppressed at the magnetopause (Fuselier et al., 2019). Whether these energetic O+ at the duskside boundary layer could suppress the intense substorm needs further investigation.
Using the measurements from the MMS satellite during phase 1, we have studied 57 events of the energetic O+ (1–40 keV) at the duskside magnetopause boundary layer and their variations on the solar wind conditions (IMF By, IMF Bz, and solar wind dynamic pressure) during intense substorm expansion phases and recovery phases. According to the above analysis, we can draw our main conclusions as follows. In our 57 events of energetic O+ at the duskside magnetopause boundary layer, there are 26 events during the expansion phase of intense substorms and 31 events during the recovery phase. It is noted that the mean values of the O+ density during the expansion phase and recovery phases are 0.069 and 0.081 cm−3, respectively, and the maximum density ratio occurred during the intense substorm recovery phase. It is found that 26 events of energetic O+ at the duskside magnetopause during intense substorms expansion phase are all under the southward IMF conditions, and only 7 events under northward IMF which are all during the intense substorm recovery phase. The O+ density shows an exponential increase with the IMF Bz absolute value under the southward IMF. Similarly, it also presents an exponential growth with solar wind dynamic pressure, and the empirical functional relations are established. Like previous studies during substorm in the near-Earth magnetosphere, the density ratios in the duskside magnetopause boundary layer enhance with the IMF By. It is suggested that the O+ abundance in the duskside magnetopause boundary layer has a close correlation with the O+ variations in the near-Earth magnetosphere during intense substorm.
All data used in this study are publicly accessible. MMS data are available at the MMS Science Data Center (MMS SDC, 2020; https://lasp.colorado.edu/mms/sdc/public/). The OMNI data can be downloaded from the NASA Goddard Space Flight Center Coordinated Data Analysis Web (CDAWeb: http://cdaweb.gsfc.nasa.gov/, Goddard Space Flight Center, 2020).
The supplement related to this article is available online at: https://doi.org/10.5194/angeo-38-123-2020-supplement.
CZ conducted the majority of the data processing, analysis, and writing for this study. SD, CW, LD, and SF participated in the interpretation of the data and modified this paper. JB, RT, BG, and CR produced the data and controlled the data quality. All the authors discussed the results and commented on the paper.
The authors declare that they have no conflict of interest.
We acknowledge the entire MMS team for providing high-quality data.
This research has been supported by the National Natural Science Foundation of China (grant nos. 41874196, 41674167, 41731070, 41574161, and 41574159), the Strategic Pioneer Program on Space Science, Chinese Academy of Sciences (grant nos. XDA15052500, XDA15350201, and XDA15011401), the NSSC Research Fund for Key Development Directions, and in part by the Specialized Research Fund for State Key Laboratories.
This paper was edited by Matina Gkioulidou and reviewed by three anonymous referees.
Angelopoulos, V., Cruce, P., Drozdov, A., Grimes, E. W., Hatzigeorgiu, N., King, D. A., Larson, D., Lewis, J. W., McTiernan, J. M., Roberts, D. A., Russell, C. L., Hori, T., Kasahara, Y., Kumamoto, A., Matsuoka, A., Miyashita, Y., Miyoshi, Y., Shinohara, I., Teramoto, M., Faden, J. B., Halford, A. J., McCarthy, M., Millan, R. M., Sample, J. G., Smith, D. M., Woodger, L. A., Masson, A., Narock, A. A., Asamura, K., Chang, T. F., Chiang, C.-Y., Kazama, Y., Keika, K., Matsuda, S., Segawa, T., Seki, K., Shoji, M., Tam, S. W. Y., Umemura, N., Wang, B.-J., Wang, S.-Y., Redmon, R., Rodriguez, J. V., Singer, H. J., Vandegriff, J., Abe, S., Nose, M., Shinbori, A., Tanaka, Y.-M., UeNo, S., Andersson, L., Dunn, P., Fowler, C., Halekas, J. S., Hara, T., Harada, Y., Lee, C. O., Lillis, R., Mitchell, D. L., Argall, M. R., Bromund, K., Burch, J. L., Cohen, I. J., Galloy, M., Giles, B., Jaynes, A. N., Le Contel, O., Oka, M., Phan, T. D., Walsh, B. M., Westlake, J., Wilder, F. D., Bale, S. D., Livi, R., Pulupa, M., Whittlesey, P., DeWolfe, A., Harter, B., Lucas, E., Auster, U., Bonnell, J. W., Cully, C. M., Donovan, E., Ergun, R. E., Frey, H. U., Jackel, B., Keiling, A., Korth, H., McFadden, J. P., Nishimura, Y., Plaschke, F., Robert, P., Turner, D. L., Weygand, J. M., Candey, R. M., Johnson, R. C., Kovalick, T., Liu, M. H., McGuire, R. E., Breneman, A., Kersten, K., and Schroeder, P.: The Space Physics Environment Data Analysis System (SPEDAS), Space Sci. Rev., 215, 9, https://doi.org/10.1007/s11214-018-0576-4, 2019.
Birn, J., Thomsen, M. F., Borovsky, J. E., Reeves, G. D., McComas, D. J., Belian, R. D., and Hesse, M.: Substorm ion injections: Geosynchronous observations and test particle orbits in three-dimensional dynamic MHD fields, J. Geophys. Res., 102, 2325–2341, https://doi.org/10.1029/96JA03032, 1997.
Bouhram, M., Klecker, B., Paschmann, G., Haaland, S., Hasegawa, H., Blagau, A., Rème, H., Sauvaud, J.-A., Kistler, L. M., and Balogh, A.: Survey of energetic O+ ions near the dayside mid-latitude magnetopause with Cluster, Ann. Geophys., 23, 1281–1294, https://doi.org/10.5194/angeo-23-1281-2005, 2005.
Burch, J. L., Moore, T. E., Torbert, R. B., and Giles, B. L.: Magnetospheric Multiscale Overview and Science Objectives, Space Sci. Rev., 199, 5–21, https://doi.org/10.1007/s11214-015-0164-9, 2016.
Daglis, I. A. and Axford, W. I.: Fast ionospheric response to enhanced activity in geospace: Ion feeding of the inner magnetotail, J. Geophys. Res., 101, 5047–5065, https://doi.org/10.1029/95JA02592, 1996.
Daglis, I. A., Paschalidis, N. P., Sarris, E. T., Axford, W. I., Kremser, G., Wilken, B., and Gloeckler, G.: Statistical features of the substorm expansion phase as observed by AMPTE/CCE spacecraft, in: Magnetospheric Substorms, edited by: Kan, J. R., Potemra, T. A., Kokubun, S., and Iijima, T., Geophys. Monogr. Ser, Vol. 64, AGU, Washington, D.C., 323–332, https://doi.org/10.1029/GM064p0323, 1991.
Daglis, I. A., Livi, S., Sarris, E. T., and Wilken, B.: Energy density of ionospheric and solar wind origin ions in the near-Earth magnetotail during substorms, J. Geophys. Res., 99, 5691–5703, https://doi.org/10.1029/93JA02772, 1994.
Dai, L., Wygant, J. R., Cattell, C. A., Thaller, S., Kersten, K., Breneman, A., Tang, X., Friedel, R. H., Claudepierre, S. G., and Tao, X.: Evidence for injection of relativistic electrons into the Earth's outer radiation belt via intense substorm electric fields, Geophys. Res. Lett., 41, 1133–1141, https://doi.org/10.1002/2014GL059228, 2014.
Dai, L., Wang, C., Duan, S., He, Z., Wygant, J. R., Cattell, C. A., Tao, X., Su, Z., Kletzing, C., Baker, D. N., Li, X., Malaspina, D., Blake, J. B., Fennell, J., Claudepierre, S., Turner, D. L., Reeves, G. D., Funsten, H. O., Spence, H. E., Angelopoulos, V., Fruehauff, D., Chen, L., Thaller, S., Breneman, A., and Tang, X.: Near-Earth injection of MeV electrons associated with intense dipolarization electric fields: Van Allen Probes observations, Geophys. Res. Lett., 42, 6170–6179, https://doi.org/10.1002/2015GL064955, 2015.
Duan, S. P., Liu, Z. X., Liang, J., Zhang, Y. C., and Chen, T.: Multiple magnetic dipolarizations observed by THEMIS during a substorm, Ann. Geophys., 29, 331–339, https://doi.org/10.5194/angeo-29-331-2011, 2011.
Duan, S. P., Dai, L., Wang, C., Liang, J., Lui, A. T. Y., Chen, L. J., He, Z. H., Zhang, Y. C., and Angelopoulos, V.: Evidence of kinetic Alfvén eigenmode in the near-Earth magnetotail during substorm expansion phase, J. Geophys. Res.-Space, 121, 4316–4330, https://doi.org/10.1002/2016JA022431, 2016.
Duan, S., Dai, L., Wang, C., He, Z., Cai, C., Zhang, Y. C., Dandouras, I., Reme, H., André, M., and Khotyaintsev, Y. V.: Oxygen Ions O+ Energized by Kinetic Alfvén Eigenmode During Dipolarizations of Intense Substorms, J. Geophys. Res.-Space, 122, 11256–11273, https://doi.org/10.1002/2017JA024418, 2017.
Ebihara, Y., Fok, M.-C., Immel, T. J., and Brandt, P. C.: Rapid decay of storm time ring current due to pitch angle scattering in curved field line, J. Geophys. Res., 116, A03218, https://doi.org/10.1029/2010JA016000, 2011.
Elliott, H. A., Comfort, R. H., Craven, P. D., Chandler, M. O., and Moore, T. E.: Solar wind influence on the oxygen content of ion outflow in the high-altitude polar cap during solar minimum conditions, J. Geophys. Res., 106, 6067–6084, https://doi.org/10.1029/2000JA003022, 2001.
Ergun, R. E., Tucker, S., Westfall, J., Goodrich, K. A., Malaspina, D. M., Summers, D., Wallace, J., Karlsson, M., Mack, J., Brennan, N., Pyke, B., Withnell, P., Torbert, R., Macri, J., Rau, D., Dors, I., Needell, J., Lindqvist, P.-A., Olsson, G., and Cully, C. M.: The Axial Double Probe and Fields Signal Processing for the MMS Mission, Space Sci. Rev., 199, 167–188, https://doi.org/10.1007/s11214-014-0115-x, 2016.
Fok, M., Moore, T. E., Brandt, P. C., Delcourt, D. C., Slinker, S. P., and Fedder, J. A.: Impulsive enhancements of oxygen ions during substorms, J. Geophys. Res., 111, A10222, https://doi.org/10.1029/2006JA011839, 2006.
Fuselier, S. A., Klumpar, D. M., Peterson, W. K., and Shelley, E. G.: Direct injection of ionospheric O+ into the dayside low latitude boundary layer, Geophys. Res. Lett., 16, 1121–1124, https://doi.org/10.1029/GL016i010p01121, 1989.
Fuselier, S. A., Klumpar, D. M., and Shelley, E. G.: Ion Reflection and transmission during reconnection at the Earth's subsolar magnetopause, Geophys. Res. Lett., 18, 139–142, https://doi.org/10.1029/90GL02676, 1991.
Fuselier, S. A., Burch, J. L., Cassak, P. A., Goldstein, J., Gomez, R. G., Goodrich, K., Lewis, W. S., Malaspina, D., Mukherjee, J., Nakamura, R., Petrinec, S. M., Russell, C. T., Strangeway, R. J., Torbert, R. B., Trattner, K. J., and Valek, P.: Magnetospheric ion influence on magnetic reconnection at the duskside magnetopause, Geophys. Res. Lett., 43, 1435–1442, https://doi.org/10.1002/2015GL067358, 2016a.
Fuselier, S. A., Lewis, W. S., Schiff, C., Ergun, R., Burch, J. L., Petrinec, S. M., and Trattner, K. J.: Magnetospheric Multiscale Science Mission Profile and Operations, Space Sci. Rev., 199, 77–103, https://doi.org/10.1007/s11214-014-0087-x, 2016b.
Fuselier, S. A., Trattner, K. J., Petrinec, S. M., Denton, M. H., Toledo-Redondo, S., André, M., Aunai, N., Chappell, C. R., Glocer, A., Haaland, S., Hesse, M., Kistler, L. M., Lavraud, B., Li, W., Moore, T. E., Graham, D., Alm, L., Tenfjord, P., Dargent, J., Vines, S. K., Nykyri, K., Burch, J. L., and Strangeway, R. J.: Mass-loading the Earth's dayside magnetopause boundary layer and its effect on magnetic reconnection, Geophys. Res. Lett., 46, 6204–6213, https://doi.org/10.1029/2019GL082384, 2019.
Ganushkina, N. Yu., Pulkkinen, T. I., and Fritz, T.: Role of substorm-associated impulsive electric fields in the ring current development during storms, Ann. Geophys., 23, 579–591, https://doi.org/10.5194/angeo-23-579-2005, 2005.
Goddard Space Flight Center: Coordinated Data Analysis Web (CDAWeb), available at: http://cdaweb.gsfc.nasa.gov/, last access: 25 January 2020.
Kim, K. C., Lee, D.-Y., Lee, E. S., Choi, C. R., Kim, K. H., Moon, Y. J., Cho, K. S., Park, Y. D., and Han, W. Y.: A new perspective on the role of the solar wind dynamic pressure in the ring current particle loss through the magnetopause, J. Geophys. Res., 110, A09223, https://doi.org/10.1029/2005JA011097, 2005.
Kronberg, E. A., Haaland, S. E., Daly, P. W., Grigorenko, E. E., Kistler, L. M., Fränz, M., and Dandouras, I.: Oxygen and hydrogen ion abundance in the near-Earth magnetosphere: Statistical results on the response to the geomagnetic and solar wind activity conditions, J. Geophys. Res., 117, A12208, https://doi.org/10.1029/2012JA018071, 2012.
Kronberg, E. A., Ashour-Abdalla, M., Dandouras, I., Delcourt, D. C., Grigorenko, E. E., Kistler, L. M., Kuzichev, I. V., Liao, J., Maggiolo, R., Malova, H. V., Orlova, K. G., Peroomian, V., Shklyar, D. R., Shprits, Y. Y., Welling, D. T., and Zelenyi, L. M.: Circulation of Heavy Ions and Their Dynamical Effects in the Magnetosphere: Recent Observations and Models, Space Sci. Rev., 184, 173–235, https://doi.org/10.1007/s11214-014-0104-0, 2014.
Kronberg, E. A., Grigorenko, E. E., Haaland, S. E., Daly, P. W., Delcourt, D. C., Luo, H., Kistler, L. M., and Dandouras, I.: Distribution of energetic oxygen and hydrogen in the near-Earth plasma sheet, J. Geophys. Res.-Space, 120, 3415–3431, https://doi.org/10.1002/2014JA020882, 2015.
Lennartsson, W. and Shelley, E. G.: Survey of 0.1- to 16-keV/e plasma sheet ion composition, J. Geophys. Res., 91, 3061–3076, https://doi.org/10.1029/JA091iA03p03061, 1986.
Li, X., Hudson, M., Chan, A., and Roth, I.: Loss of ring current O+ ions due to interaction with Pc 5 waves, J. Geophys. Res., 98, 215–231, https://doi.org/10.1029/92JA01540, 1993.
Liao, J., Kistler, L. M., Mouikis, C. G., Klecker, B., Dandouras, I., and Zhang, J.-C.: Statistical study of O+ transport from the cusp to the lobes with Cluster CODIF data, J. Geophys. Res., 115, A00J15, https://doi.org/10.1029/2010JA015613, 2010.
Lindqvist, P.-A., Olsson, G., Torbert, R. B., King, B., Granoff, M., Rau, D., Needell, G., Turco, S., Dors, I., Beckman, P., Macri, J., Frost, C., Salwen, J., Eriksson, A., Åhlén, L., Khotyaintsev, Y. V., Porter, J., Lappalainen, K., Ergun, R. E., Wermeer, W., and Tucker, S.: The Spin-Plane Double Probe Electric Field Instrument for MMS, Space Science Reviews, 199(1–4), 137–165, https://doi.org/10.1007/s11214-014-0116-9, 2016.
Liu, Y. H., Mouikis, C. G., Kistler, L. M., Wang, S., Roytershteyn, V., and Karimabadi, H.: The heavy ion diffusion region in magnetic reconnection in the Earth's magnetotail, J. Geophys. Res.-Space, 120, 3535–3551, https://doi.org/10.1002/2015JA020982, 2015.
Lui, A. T. Y., Liou, K., Nosé, M., Ohtani, S., Williams, D. J., Mukai, T., Tsuruda, K., and Kokubun, S.: Near-Earth dipolarization: Evidence for a non-MHD process, Geophys. Res. Lett., 26, 2905–2908, https://doi.org/10.1029/1999GL003620, 1999.
Luo, H., Kronberg, E. A., Nykyri, K., Trattner, K. J., Daly, P. W., Chen, G. X., Du, A. M., and Ge, Y. S.: IMF dependence of energetic oxygen and hydrogen ion distributions in the near-Earth magnetosphere: Dawn-Dusk Asymmetry of Energetic Ions, J. Geophys. Res.-Space, 122, 5168–5180, https://doi.org/10.1002/2016JA023471, 2017.
MMS Science Data Center: MMS SDC, available at: https://lasp.colorado.edu/mms/sdc/public/, last access: 25 January 2020.
Nosé, M., Lui, A. T. Y., Ohtani, S., Mauk, B. H., McEntire, R. W., Williams, D. J., Mukai, T., and Yumoto, K.: Acceleration of oxygen ions of ionospheric origin in the near-Earth magnetotail during substorms, J. Geophys. Res.-Space, 105, 7669–7677, https://doi.org/10.1029/1999JA000318, 2000.
Ohtani, S., Nosé, M., Christon, S. P., and Lui, A. T. Y.: Energetic O+ and H+ ions in the plasma sheet: Implications for the transport of ionospheric ions, J. Geophys. Res.-Space, 116, A10211, https://doi.org/10.1029/2011JA016532, 2011.
Ono, Y., Nosé, M., Christon, S. P., and Lui, A. T. Y.: The role of magnetic field fluctuations in nonadiabatic acceleration of ions during dipolarization, J. Geophys. Res.-Space, 114, A05209, https://doi.org/10.1029/2008JA013918, 2009.
Phan, T. D., Dunlop, M. W., Paschmann, G., Klecker, B., Bosqued, J. M., Rème, H., Balogh, A., Twitty, C., Mozer, F. S., Carlson, C. W., Mouikis, C., and Kistler, L. M.: Cluster observations of continuous reconnection at the magnetopause under steady interplanetary magnetic field conditions, Ann. Geophys., 22, 2355–2367, https://doi.org/10.5194/angeo-22-2355-2004, 2004.
Pollock, C., Moore, T., Jacques, A., Burch, J., Gliese, U., Saito, Y., Omoto, T., Avanov, L., Barrie, A., Coffey, V., Dorelli, J., Gershman, D., Giles, B., Rosnack, T., Salo, C., Yokota, S., Adrian, M., Aoustin, C., Auletti, C., Aung, S., Bigio, V., Cao, N., Chandler, M., Chornay, D., Christian, K., Clark, G., Collinson, G., Corris, T., De Los Santos, A., Devlin, R., Diaz, T., Dickerson, T., Dickson, C., Diekmann, A., Diggs, F., Duncan, C., Figueroa-Vinas, A., Firman, C., Freeman, M., Galassi, N., Garcia, K., Goodhart, G., Guererro, D., Hageman, J., Hanley, J., Hemminger, E., Holland, M., Hutchins, M., James, T., Jones, W., Kreisler, S., Kujawski, J., Lavu, V., Lobell, J., LeCompte, E., Lukemire, A., MacDonald, E., Mariano, A., Mukai, T., Narayanan, K., Nguyan, Q., Onizuka, M., Paterson, W., Persyn, S., Piepgrass, B., Cheney, F., Rager, A., Raghuram, T., Ramil, A., Reichenthal, L., Rodriguez, H., Rouzaud, J., Rucker, A., Saito, Y., Samara, M., Sauvaud, J.-A., Schuster, D., Shappirio, M., Shelton, K., Sher, D., Smith, D., Smith, K., Smith, S., Steinfeld, D., Szymkiewicz, R., Tanimoto, K., Taylor, J., Tucker, C., Tull, K., Uhl, A., Vloet, J., Walpole, P., Weidner, S., White, D., Winkert, G., Yeh, P.-S., and Zeuch, M.: Fast Plasma Investigation for Magnetospheric Multiscale, Space Sci. Rev., 199, 331–406, https://doi.org/10.1007/s11214-016-0245-4, 2016.
Russell, C. T., Anderson, B. J., Baumjohann, W., Bromund, K. R., Dearborn, D., Fischer, D., Le, G., Leinweber, H. K., Leneman, D., Magnes, W., Means, J. D., Moldwin, M. B., Nakamura, R., Pierce, D., Plaschke, F., Rowe, K. M., Slavin, J. A., Strangeway, R. J., Torbert, R., Hagen, C., Jernej, I., Valavanoglou, A., and Richter, I.: The Magnetospheric Multiscale Magnetometers, Space Sci. Rev., 199, 189–256, https://doi.org/10.1007/s11214-014-0057-3, 2016.
Shue, J.-H., Song, P., Russell, C. T., Steinberg, J. T., Chao, J. K., Zastenker, G., Vaisberg, O. L., Kokubun, S., Singer, H. J., Detman, T. R., and Kawano, H.: Magnetopause location under extreme solar wind conditions, J. Geophys. Res.-Space, 103, 17691–17700, https://doi.org/10.1029/98JA01103, 1998.
Sonnerup, B. U., Paschmann, G., Papamastorakis, I., Sckopke, N., Haerendel, G., Bame, S. J., Asbridge, J. R., Gosling, J. T., and Russell, C. T.: Evidence for magnetic field reconnection at the Earth's magnetopause, J. Geophys. Res., 86, 10049–10067, https://doi.org/10.1029/JA086iA12p10049, 1981.
Slapak, R., Nilsson, H., Westerberg, L. G., and Eriksson, A.: Observations of oxygen ions in the dayside magnetosheath associated with southward IMF, J. Geophys. Res., 117, A07218, https://doi.org/10.1029/2012JA017754, 2012.
Slapak, R., Nilsson, H., Westerberg, L. G., and Larsson, R.: O+ transport in the dayside magnetosheath and its dependence on the IMF direction, Ann. Geophys., 33, 301–307, https://doi.org/10.5194/angeo-33-301-2015, 2015.
Tang, B. and Wang, C.: Large scale current systems developed from substorm onset: Global MHD results, Science China Technological Sciences, 61, 389–396, https://doi.org/10.1007/s11431-017-9132-y, 2018.
Wang, S., Kistler, L. M., Mouikis, C. G., Liu, Y., and Genestreti, K. J.: Hot magnetospheric O+ and cold ion behavior in magnetopause reconnection: Cluster observations, J. Geophys. Res.-Space, 119, 9601–9623, https://doi.org/10.1002/2014JA020402, 2014.
Welling, D. T., Jordanova, V. K., Zaharia, S. G., Glocer, A., and Toth, G.: The effects of dynamic ionospheric outflow on the ring current, J. Geophys. Res., 116, A00J19, https://doi.org/10.1029/2010JA015642, 2011.
Winglee, R. M. and Harnett, E.: Influence of heavy ionospheric ions on substorm onset, J. Geophys. Res., 116, A11212, https://doi.org/10.1029/2011JA016447, 2011.
Winglee, R. M., Lewis, W., and Lu, G.: Mapping of the heavy ion outflows as seen by IMAGE and multifluid global modeling for the 17 April 2002 storm, J. Geophys. Res., 110, A12S24, https://doi.org/10.1029/2004JA010909, 2005.
Yau, A. W. and André, M.: Sources of Ion Outflow in the High Latitude Ionosphere, Space Sci. Rev., 80, 1–25, https://doi.org/10.1023/A:1004947203046, 1997.
Yau, A. W., Howarth, A., Peterson, W. K., and Abe, T.: Transport of thermal-energy ionospheric oxygen (O+) ions between the ionosphere and the plasma sheet and ring current at quiet times preceding magnetic storms, J. Geophys. Res., 117, A07215, https://doi.org/10.1029/2012JA017803, 2012.
Yu, Y. and Ridley, A. J.: Exploring the influence of ionospheric O+ outflow on magnetospheric dynamics: dependence on the source location, J. Geophys. Res.-Space, 118, 1711–1722, https://doi.org/10.1029/2012JA018411, 2013.
Young, D. T., Burch, J. L., Gomez, R. G., De Los Santos, A., Miller, G. P., Wilson, P., Paschalidis, N., Fuselier, S. A., Pickens, K., Hertzberg, E., Pollock, C. J., Scherrer, J., Wood, P. B., Donald, E. T., Aaron, D., Furman, J., George, D., Gurnee, R. S., Hourani, R. S., Jacques, A., Johnson, T., Orr, T., Pan, K. S., Persyn, S., Pope, S., Roberts, J., Stokes, M. R., Trattner, K. J., and Webster, J. M.: Hot Plasma Composition Analyzer for the Magnetospheric Multiscale Mission, Space Sci. Rev., 199, 407–470, https://doi.org/10.1007/s11214-014-0119-6, 2016.
Zeng, C., Duan, S., Wang, C., Dai, L., Fuselier, S., Burch, J., Torbert, R. B., and Giles, B. L.: Statistical study of oxygen ions abundance and spatial distribution in the dayside magnetopause boundary layer: MMS observations, J. Geophys. Res.-Space, in review, 2020.
Zong, Q.-G., Wilken, B., Fu, S. Y., Fritz, T. A., Korth, A., Hasebe, N., Williams, D. J., and Pu, Z.-Y.: Ring current oxygen ions escaping into the magnetosheath, J. Geophys. Res., 106, 25541–25556, https://doi.org/10.1029/2000JA000127, 2001.