the Creative Commons Attribution 4.0 License.
the Creative Commons Attribution 4.0 License.
High-resolution Beijing mesosphere–stratosphere–troposphere (MST) radar detection of tropopause structure and variability over Xianghe (39.75° N, 116.96° E), China
Feilong Chen
Yufang Tian
Shaodong Zhang
Kaiming Huang
Chen Wu
Weifan Zhang
As a result of partial specular reflection from the atmospheric stable layer, the radar tropopause (RT) can simply and directly be detected by VHF radars with vertical incidence. Here, the Beijing mesosphere–stratosphere–troposphere (MST) radar measurements are used to investigate the structure and the variabilities in the tropopause in Xianghe, China, with a temporal resolution of 0.5 h from November 2011 to May 2017. The high-resolution radar-derived tropopause is compared with the thermal lapse-rate tropopause (LRT) that is defined by the World Meteorological Organization (WMO) criterion from twice-daily radiosonde soundings and with the dynamical potential vorticity tropopause (PVT) that is defined as the height of the 2 PVU (PVU – potential vorticity units; 1 PVU = 106 m2 s−1 K kg−1) surface. We only consider tropopauses below 16 km in this study because of limitations with the radar system. During all the seasons, the RT and the LRT in altitude agree well with each other, with a correlation coefficient of ≥0.74. Statistically, weaker (higher) tropopause sharpness seems to contribute to larger (smaller) difference between the RT and the LRT in altitude. The RT agrees well with the PVT in altitude during winter and spring, with a correlation coefficient of ≥0.72, while the correlation coefficient in summer is only 0.33. As expected, the monthly mean RT and LRT height both show seasonal variations. Lomb–Scargle periodograms show that the tropopause exhibits obvious diurnal variation throughout the seasons, whereas the semidiurnal oscillations are rare and are occasionally observed during summer and later spring. Our study shows the potential of the Beijing MST radar to determine the tropopause height as well as present its diurnal oscillations.
- Article
(8255 KB) - Full-text XML
- BibTeX
- EndNote
The tropopause marks a transition zone separating the well-mixed convectively active troposphere from the stably stratified and more quiescent stratosphere. Its structure and variability are characterized by large changes in thermal (e.g., lapse rate), dynamical (e.g., potential vorticity), and chemical properties (e.g., ozone and water vapor), and it hence plays a key role in the stratosphere–troposphere exchange (STE) processes (Hoinka, 1998; Seidel et al., 2001). The height of the tropopause depends significantly on the latitude, being located at about 17 km near the Equator and less than 9–10 km at polar latitudes (Ramakrishnan, 1933). Over subtropical latitudes with the presence of subtropical jet, where the tropopause experiences rapid change or breaking, tropopause folding events are commonly observed (Pan et al., 2004). Climatologically, the altitude of the tropopause represents the seasonal variation in the flux of stratospheric air intruding into the troposphere (Appenzeller et al., 1996). Moreover, the tropopause height trends can be a sensitive indicator of anthropogenic climate change (Sausen and Santer, 2003; Santer et al., 2003a; Añel et al., 2006).
A variety of methods are available to determine the extratropical tropopause. Radiosonde sounding is most commonly used to define the thermal tropopause (hereafter referred to as LRT) based on the temperature lapse rate (WMO, 1957). The thermal definition of the tropopause can be applied globally, and the tropopause height can easily be determined from one individual profile (Santer et al., 2003b). Another feasible definition is to use a specific potential vorticity (PV) surface to represent the dynamical tropopause (hereafter referred to as PVT; Reed, 1955). The dynamical definition has the advantage that the PV is a conserved property (under adiabatic and frictionless conditions) of an air mass (Bethan et al., 1996). Values in the range 1–4 PVU (PVU – potential vorticity units; 1 PVU = 106 m2 s−1 K kg−1) are used in previous research in the Northern Hemisphere (e.g., Baray et al., 2000; Sprenger et al., 2003; Hoerling et al., 1991). The threshold of 2 PVU surface is the most commonly used (Gettelman et al., 2011). Dynamical definition, however, is not applicable near the Equator, where the PV tends to be 0 (e.g., Hoerling et al., 1991; Nielsen-Gammon, 2001). Creating a blended tropopause globally may probably a good way forward (Wilcox et al., 2012). In addition, the data of GPS radio occultation satellites are also an effective way and commonly applied to study tropopause (e.g., Schmidt et al., 2005; Son et al., 2011).
As a result of partial specular reflection from the stable atmospheric layer, the radar tropopause (RT) can be represented well and identified by atmospheric radars operating at the meter wavelength (VHF band) and directed at vertical incidence (Gage and Green, 1979). Research activity increased remarkably following the first report on VHF radar detection of tropopause by Gage and Green (1979), for instance, the research in middle latitudes (e.g., Hermawan et al., 1998), polar regions (e.g., Hall, 2013a), and tropical regions (e.g., Das et al., 2008; Ravindrababu et al., 2014). Several methods have been proposed to determine the tropopause height via radar echo power, including the largest gradient in echo power (Vaughan et al., 1995; Alexander et al., 2013), the maximum echo power (Vaughan et al., 1995; Hall et al., 2009), and the specific value of echo power (Gage and Green, 1982; Yamamoto et al., 2003). The method of the RT height determination used in this paper will be described in detail in the next section.
The biggest advantage of VHF radar measurements is the ability of continuous operation unmanned in any weather conditions. Of course, no definition of the tropopause is perfect. The VHF radar system can only be limited to a few locations globally. A detailed review of the close relationship between these different tropopause definitions is provided by Alexander et al. (2013).
By means of the radiosonde, reanalysis, and satellite data available globally, long-term (annual or longer) variability in tropopause height has received extensive attention (e.g., Randel et al., 2000; Angell and Korshover, 2009; Son et al., 2011; Liu et al., 2014). However, short-term (diurnal or semidiurnal) variability in the tropopause is hard examined with these measurements. In contrast, benefiting from the much higher temporal resolution, the radar definition of the tropopause provides good capability for studying the diurnal and semidiurnal variation in tropopause height. Earlier, Yamamoto et al. (2003) reported the capability of the equatorial atmospheric radar to examine the diurnal variation in tropopause height. Then, the diurnal variability of the tropical tropopause was investigated in detail by Das et al. (2008) using the Indian Gadanki mesosphere–stratosphere–troposphere (MST) radar. Its diurnal variation over a polar-latitude station was investigated by Hall (2013b). In the absence of pressure and temperature parameters, the evidence of atmospheric tides can be represented well by winds (e.g., Huang et al., 2015).
The tropopause structure in the midlatitudes is different from that in other regions. The double tropopause structure is a ubiquitous feature over midlatitude regions near 40∘ N (Pan et al., 2004; Randel et al., 2007a). Strong evidence has revealed that the poleward intrusion of subtropical tropospheric air that occurred above the subtropical jet has resulted in the double structure (Pan et al., 2009). The higher part (second tropopause near ∼16 km) is characterized by tropical features of the cold and higher level, whereas the lower part (first tropopause near ∼12 km) is characterized by polar features of the warm and lower level. In the present study, we focus only on the first tropopauses below 16 km, and these will be referred to as tropopause hereafter.
In this study, using more than 5 years of Beijing MST radar echo-power measurements in vertical beam, we mainly focus on the high-resolution characteristics of the tropopause structure and their comparison with the simultaneous radiosonde and dynamical definitions. Another important objective of this study is to examine the diurnal and semidiurnal variability in the tropopause. The observational characteristics of, for example, winds, echo power, and the data-acquisition rate near the tropopause layer are also presented in the paper.
2.1 Radar dataset
As an important part of the Chinese Meridian Project, two MST radar systems are designed and constructed to improve the understanding of the extratropical troposphere, lower stratosphere, and mesosphere (Wang, 2010), which are Wuhan and Beijing MST radars. The Beijing MST radar located in Xianghe, Hebei province, China (39.75∘ N, 116.96∘ E, 22 m a.s.l.), was designed and constructed by the Institute of Atmospheric Physics, Chinese Academy of Sciences, and started its routine operation on 20 October 2011 (Tian and Lu, 2017). The radar is a high-power coherent-pulse Doppler radar operating at 50 MHz, with the maximum peak power of 172 kW and the half-power beam width of 3.2∘. Five beams are applied: one vertically pointed beam and four 15∘ off-zenith beams tilted to the north, east, south, and west. In order to obtain the high-quality measurements from the troposphere, lower stratosphere, and mesosphere simultaneously, the radar is designed to operate routinely in three separate modes: low mode (designed range ∼2.5–12 km), middle mode (∼10–25 km), and high mode (∼60–90 km), with vertical resolutions of 150, 600, and 1200 m, respectively. Under the routine operation, the 15 min break is followed by the 15 min operation cycle (5 min for each mode). As a result, the time resolutions of the low-, middle-, and high-mode measurements are all 30 min. A more detailed review of the radar system is given by Chen et al. (2016).
Here only the low-mode echo-power measurements are used to determine the RT height. Although the designed detectable range of the low mode is from ∼2.5–12 km, the vertically pointed beam can receive stronger echoes from a higher level (∼14–15 km) compared with those from off-vertical beams due to the partial specular reflection mechanism. The measurements in the middle mode are applied to calculate the winds or echo power within ∼5–6 km of the tropopause. The parameters for the two routine operation modes are listed in Table 1. The monthly total number of the echo-power profiles available in vertical beam (low mode) is shown in Fig. 1. The outliers or severely contaminated data mainly induced by system problems are eliminated. The large data gap in September is due to the annual preventive maintenance.
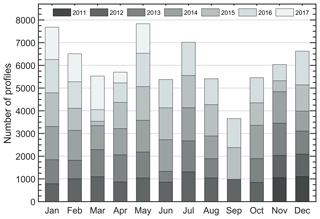
Figure 1Distribution of the monthly total number of radar return echo-power profiles that are available from vertical beam in low mode, collected for the period November 2011–May 2017.
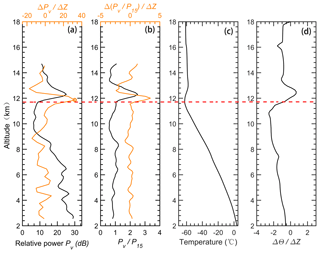
Figure 2Example vertical profiles of (a) relative radar echo power (black line) along with its gradient variation (orange line), (b) radar aspect sensitivity (black line) along with its gradient variation (orange line), (c) radiosonde temperature, and (d) potential temperature gradient at 00:00 UTC on 4 November 2011. The horizontal red dashed line marks the LRT height. The orange circle in (a) denotes the RT height.
Table 1Routine operational parameters in low and middle mode for the Beijing MST radar used in this study.
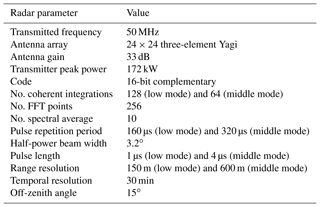
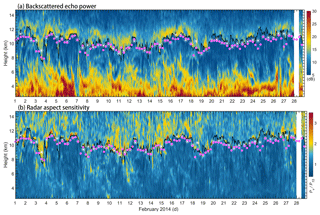
Figure 3Altitude–time intensity plot of (a) radar backscattered echo power and (b) radar aspect sensitivity for February 2014. The tropopauses determined based on the radar echo definition are shown as a black solid curve. The white asterisks and pink dots indicate the location of the LRT derived from simultaneous twice-daily radiosonde data and the PVT from ECMWF ERA-Interim reanalysis, respectively. White stripe indicates the time frame of radar missing data.
2.2 Tropopause definitions
Due to the large gradient in potential temperature, radar return power received at vertical incidence is significantly enhanced upon the transition zone of the tropopause layer. Using this characteristic, the RT height can be determined effectively. Here, the RT is defined as the altitude (above 500 hPa) where the maximum vertical gradient of echo power is located (Vaughan et al., 1995; Alexander et al., 2013; Ravindrababu et al., 2014; Chen et al., 2018). Considering the occasional and random noise to which the derived RT is sensitive, the echo-power profiles are smoothed by a three-point running mean. In order to further reduce the influence of the noise, the RT definition used here needs to satisfy an additional criterion: the determined RT height should be continuous with the adjacent RT heights (one on each side). Otherwise it needs to search for the second peak gradient (eliminated if the second peak does not meet the additional criterion). “Continuous” here means that the discrepancy between the two successive heights (in time, at 0.5 h interval) should be <0.6 km. A typical example of the RT and LRT is illustrated in Fig. 2. The LRT is identified based on the World Meteorological Organization (WMO) criteria (WMO, 1957). The radar aspect sensitivity is expressed as the ratio between vertical (pv) and oblique (po) beam (here it is a 15∘ east beam) echo power. The radiosonde soundings are launched twice daily from the Beijing Meteorological Observatory (39.93∘ N, 116.28∘ E; station number 54511), which is less than 45 km from the radar site. In this case, the LRT and RT corresponded well and are at 11.65 and 11.85 km, respectively. As expected, the LRT characterized by a rapid increase in the potential temperature gradient also corresponds to a large gradient in radar aspect sensitivity. Note that the height with the maximum value in echo power lies at a higher altitude than that of the RT, at ∼700 m above the LRT. The dynamical tropopauses used in this paper are derived from the European Centre for Medium-Range Weather Forecasts (ECMWF) ERA-Interim Reanalysis (Dee et al., 2011) and are defined as the surface of 2 PVU potential vorticity, which is the same as that used by Sprenger et al. (2003) and Alexander et al. (2013).
2.3 Tropopause sharpness definition
For the compared data pairs between the RT and LRT, we calculate the corresponding tropopause sharpness that represents the strength of the tropopause inversion layer. As defined by Wirth (2000), the tropopause sharpness STP can be calculated as
where TP denotes the tropopause height, ΔZ=1 km, and TTP indicates the corresponding temperature. This definition is also used in Alexander et al. (2013), and we use it for a good comparison with our results.
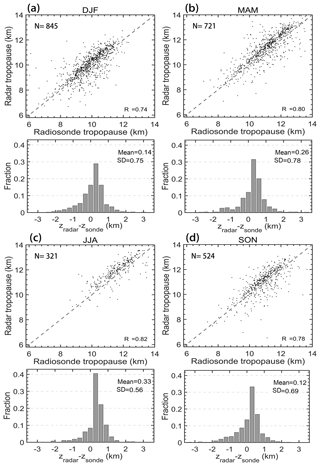
Figure 4Seasonal scatterplots of the RT versus LRT, and histogram distribution of altitude differences between the RT and the LRT, for (a) winter (DJF), (b) spring (MAM), (c) summer (JJA), and (d) autumn (SON) during the period November 2011–May 2017. The positive values in the histogram indicate the RT being located at a higher level than the LRT. The grey dashed line shows the 1:1 line. Here, N, R2, mean, and SD indicate the sample numbers, correlation coefficient, mean difference, and standard deviation of the difference, respectively.
3.1 High-resolution radar tropopause structure
The height–time cross section of radar echo power and aspect sensitivity is shown in Fig. 3 for a typical month (February 2014) along with the RT, PVT, and LRT marked in the figure. The RTs agreed well with both the LRT and PVT in height, and most of the RTs exhibit a slightly higher altitude. However, the differences between the RT and LRT are sometimes large (reaching ∼1–2 km), especially when the RTs experience rapid change. Regardless of the background synoptic condition, the difference in the definitions themselves is to a large degree the main contributing factor to the large difference between the RT and LRT. For example, a second layer with significant enhanced echo power is observed above the radar-derived RT for the cases on 4 and 5 February 2012 (Fig. 3a). According to the definitions, the RT is defined well as the first layer, with enhanced echo power, and the LRT matched the second layer, similar to that observed by Yamamoto et al. (2003) and Fukao et al. (2003). It noteworthy that the RT separates the troposphere characterized by low aspect sensitivity well from the lower-stratosphere characterized by high aspect sensitivity (Fig. 3b).
3.2 Comparisons between different definitions
To further quantify the consistency and difference in altitude between different tropopause definitions, a detailed comparison is carried out in this section. The seasonal scatterplots for RT versus LRT and the histogram distribution of altitude differences between them are shown in Fig. 4 for the period November 2011–May 2017. A total of 2411 data pairs are obtained for comparison. Among them, the number of data pairs is 845 for DJF (winter), 721 for MAM (spring), 321 for JJA (summer), and 524 for SON (autumn). Comparisons have shown good consistency throughout the seasons, and most of the RTs exhibit a slightly higher than the LRTs. The correlation coefficient is 0.74, 0.80, 0.82, and 0.78 for DJF, MAM, JJA, and SON, respectively. The mean and standard deviation difference (RT minus LRT) calculated in DJF, MAM, JJA, and SON is 0.14±0.75, 0.26±0.78, 0.33±0.56, and 0.12±0.69 km, respectively. The proportion of the data pairs with differences <500 m is reasonably good during four seasons and is 63 %, 61 %, 64 %, and 67 % for DJF, MAM, JJA, and SON, respectively. Results of Fig. 4 indicate the potential of the Beijing MST radar to detect tropopauses throughout the seasons.
To examine the potential role of the sharpness, Fig. 5a and b show the histogram distribution of the tropopause sharpness along with the probability density curve for data pairs with differences (absolute values of RT minus LRT) <0.5 and >1 km, respectively. Results indicate that higher probabilities of large tropopause sharpness values occur when the RT–LRT difference is less than 0.5 km. No matter whether this distribution feature is associated with the cyclonic–anticyclonic systems (e.g., Randel et al., 2007b; Randel and Wu, 2010), the results more or less demonstrate that the larger (weaker) tropopause sharpness contributes to a lower (higher) difference between the RT and LRT. From the perspective of seasonal statistics, the tropopause sharpness over Beijing station shows similar distribution characteristics throughout the seasons (not shown), which is different from that in polar regions, where the sharpness is significantly higher during summer than during winter (Zängl and Hoinka, 2001).
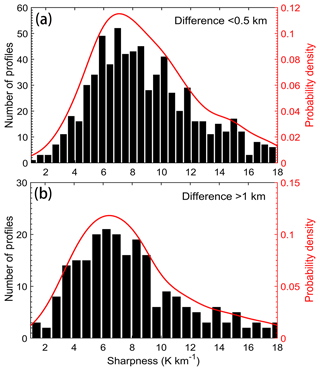
Figure 5Histogram distribution of the tropopause sharpness for (a) difference of <0.5 km and (b) difference of >1 km, respectively, between the LRT and the RT.
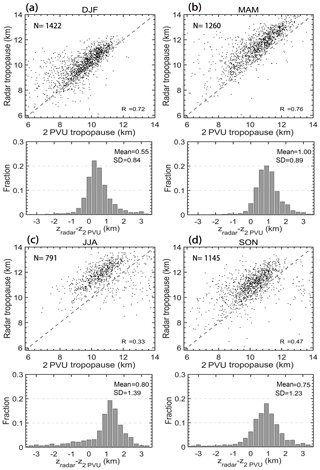
The seasonal scatterplots and height difference histograms between the RT and PVT are illustrated and quantified in Fig. 6. The total number of data pairs to be compared for winter, spring, summer, and autumn is 1422, 1260, 791, and 1145, respectively. During winter and spring (Fig. 6a and b), the RTs agree reasonably well with the PVTs, with the correlation coefficient of 0.72 and 0.76 and the mean difference (RT minus PVT) of 0.55±0.84 km and 1±0.89 km, respectively. In contrast, the consistency for summer and autumn (Fig. 6c and d) is relatively bad, with a correlation coefficient of 0.33 and 0.47 and mean difference of 0.80±1.39 km and 0.75±1.23 km, respectively. Especially for summer, the proportion of the comparing data pairs with a difference <0.5 km is only 10.6 % (84).
3.3 Observational characteristics in the vicinity of tropopause
Middle-mode radar measurements are used for examining the horizontal wind, return power, and effective wind data-acquisition rate within 5–6 km of the tropopause (upper troposphere and lower stratosphere). Figure 7a and c show the vertical scatterplots of the static stability (represented by the buoyancy frequency squared) as a function of height relative to the LRT, and Fig. 7b and d show the radar echo power as a function of height relative to the RT during 2 specific years, 2012–2013, for extended winter NDJFM (November–December–January–February–March) and summer MJJAS (May–June–July–August–September) seasons. Mean and standard deviations are also plotted in each panel of Fig. 7. Results clearly show a sudden jump in static stability and radar power near the tropopause layer. The sudden increase in echo power is more gradual than that in static stability. The amplitude of the sudden increase in radar power experienced was slightly larger during NDJFM than during MJJAS (red lines of Fig. 7b and d). Another interesting feature in the lower stratosphere is that the static stability shows less dispersity during NDJFM than during MJJAS.
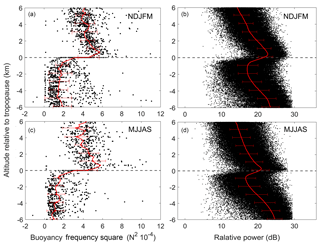
Figure 7Scatterplots of (a, c) static stability (N2) and (b, d) radar-relative echo power as a function of altitude relative to the LRT (a, c) and RT (b, d) for extended winter (NDJFM) and summer (MJJAS) seasons for 2 specific years (2012–2013). Red lines in each panel denote the corresponding mean profiles, and the error bars indicate the standard deviations.
Figure 8 shows the profiles of the mean data-acquisition rate in radar wind for low and middle modes during November 2011–May 2017. Both profiles exhibit a sudden increase with height near the tropopause, with the first peak located ∼1 km higher above the mean tropopause height. Note that the second inversion in the middle-mode profile that occurred near 16 km is associated with the second tropopause. As limited by the highest detectable altitude (the data-acquisition rate decreased to lower than 20 % at ∼16 km), the profile in low mode shows little evidence of a second inversion.
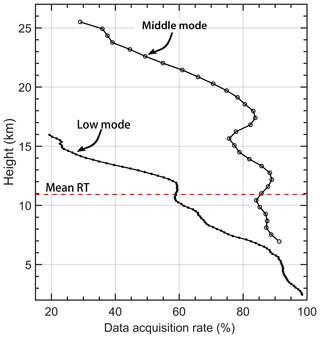
Figure 8Vertical height profiles of the averaged effective radar wind data-acquisition rate in low mode and middle mode during November 2011–May 2017. The red dashed line indicates the mean RT height.
Figure 9 shows time–height intensity plot of the monthly mean radar-derived horizontal wind during November 2011–May 2017 together with the monthly mean location of the RT and LRT. The monthly mean RT and LRT agreed well with each other in height, within 400 m in August and September, and this agreement was even lower (within 200 m) in other months. They both exhibit a clear seasonal variation, with a maximum in early autumn of ∼11.6 km and a minimum in early spring of ∼10.3 km. The monthly mean wind jet varies with season, with the thinnest thickness and lowest strength in summer. The mean tropopause height corresponds to the lower boundary location of the peak wind layer. The error bars of both the RT and LRT help to illustrate that the tropopauses changes by larger amplitude in winter and June than in other months.
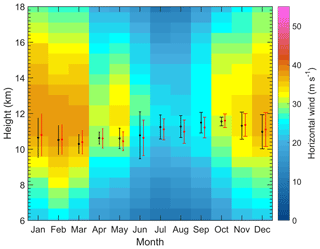
Figure 9Height–time intensity map of monthly mean horizontal wind speed (shaded; m s−1) derived from the middle mode of Beijing MST radar during November 2011–May 2017. Also shown is the monthly mean height of RT (black dots) and LRT (red dots; offset by +6 d) along with the vertical error bars representing the standard deviations.
3.4 Periodogram analysis of the radar tropopause
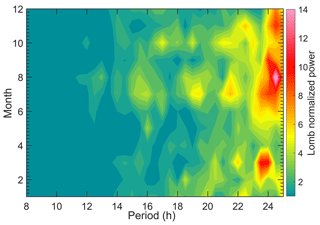
High-temporal-resolution detection of the tropopause by the VHF radar allowed us to investigate the diurnal or semidiurnal variability in the tropopause. Atmospheric tides are well-known global oscillations contributing to the diurnal variation in temperature and background winds, which in turn modulate the tropopause height. With the absence of temperature measurements, zonal and meridional winds are applied to demonstrate the evidence of diurnal or semidiurnal modulation by tides. The frequency power spectrum of the RT height, zonal wind, and meridional wind, calculated by means of Lomb–Scargle method (Press and Rybicki, 1989), is illustrated in Fig. 10 for two typical months: May 2015 and December 2016. The Lomb–Scargle algorithm is applied due to the presence of data gaps (∼2 d per week, especially during 2012–2013). The dominant ∼24 h periodicity in all the three parameters is obvious for both months. The evidence of the ∼12 h period is observed for May 2015 (Fig. 10a), although the power is relatively weaker. Through the analysis for each individual month, we found that the semidiurnal component in the three parameters is generally and occasionally observed in summer and later spring during our experimental period. Characteristics of the diurnal variation in RT height can be represented better in Fig. 11, which shows the mean Lomb–Scargle power spectrum of the RT as a function of the month during November 2011–May 2017. Compared with other months, the dominant diurnal periodicity is less evident in April. We need to clarify that atmospheric tides are of course not the only source of the diurnal variation in tropopause height; diurnal convective activities (Yamamoto et al., 2003) might also be an important cause. Here this will not be discussed in detail.
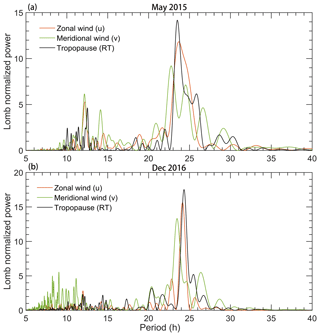
Figure 10Lomb–Scargle periodograms of the RT height and zonal and meridional wind oscillations for specific months of (a) May 2015 and (b) December 2016. The zonal and meridional wind for (a) is sampled at 9.85 km and (b) at 11 km.
As for the radar echo-power definition, the RT estimation will sometimes fail due to the system problems, even if the thermal tropopause is well defined (Hall et al., 2009). Apart from the system problems (e.g., the damage of T/R module – transmit–receive module), the following two conditions are primarily responsible for the failure (or difficulty) of both the radar and thermal definitions over the radar site latitude (∼40∘ N). Firstly, the temperature sometimes continued to decrease until the stratosphere (above 16 km) in summer and early autumn, leading to the failure and/or difficulty of both the radar and thermal definitions (a typical case is shown in Fig. 12a). It needs to be noted that the temperature inversion layer that occurred at ∼16 km in summer or early autumn is the second tropopause with characteristics of the tropics (Pan et al., 2004; Randel et al., 2007a). Secondly, some specific meteorological processes can lead to the ambiguities and indefiniteness in thermal and radar definitions, such as fronts, cyclones or typhoons, and folding (e.g., Nastrom et al., 1989; May et al., 1991; Roettger, 2001; Alexander et al., 2013). Such ambiguities often result in large difference in altitude between the RT and LRT. Apart from the situations above, another condition is also commonly responsible for the difficulty in identifying the thermal tropopause from radiosonde profiles during summer. As a typical case, in Fig. 12b, a significant inversion in temperature (at ∼12 km) is recorded from the radiosonde profile, but the altitude extent of inversion layer is too thin to meet the WMO criterion that the thermal definition requires. In contrast, the apparent enhancement in radar echo power corresponding to such inversion layer is strong enough to define the RT well. The temperature inversion located near ∼16 km (the second tropopause) is not the focus of this paper.
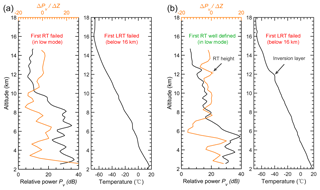
Figure 12Example profiles of radar echo power and radiosonde temperature in which (a) both the RT and LRT definitions fail due to the continuing decrease in temperature at 00:00 UTC (coordinated universal time) on 7 July 2012 and (b) the temperature inversion layer that failed to meet the LRT definition but was well defined in RT definition at 12:00 UTC on 2 August 2012. Please note that we only consider the conditions below 16 km.
Pan et al. (2004) reported that the differences between the LRT and PVT are more distinct in the vicinity of subtropical jet. In the Northern Hemisphere, the axis of the subtropical jet is situated near ∼30∘ N in spring and winter, whereas in summer and early autumn the subtropical jet shifts northward to ∼40∘ N (see Fig. 4 in Ding and Wang, 2006). We preliminarily considered that the inconsistency between the RT and PVT in summer and early autumn (Fig. 6c and d) is most likely related to the subtropical jet shifting poleward to ∼40∘ N. The existing cyclones or anticyclones in the upper troposphere (Wirth, 2000), of course, may also be an important influence factor for the significant asymmetric differences (most of the scattered points deviate significantly from the 1:1 line). The asymmetric differences, which are most of the RTs being located higher than the 2 PVU tropopause height, suggest that the 2 PVU surface is not the best measure of a dynamical tropopause over Beijing during summertime. More detailed discussion about the striking asymmetric differences in height between LRT and PVT can be seen in Wirth (2001) and will not be given here. In any case, we need to be careful when using the 2 PVU dynamical definition to define the tropopause over the radar site latitude ∼40∘ N, especially in summer.
With respect to the characteristics of the tropopause and the comparison between different definitions, there are many differences between midlatitude and polar regions. In the midlatitudes (∼40∘ N), our results show that (1) the agreement between RT and LRT is similarly good throughout the seasons, (2) RTs are generally located higher than the LRT, (3) the thermal definition sometimes fails in summer and early autumn, and (4) the agreement between the RT–LRT and PVT in summer is poor. This is in contrast to previous research about the tropopause over polar regions (Wirth, 2000; Alexander et al., 2013) that reported that (1) the difference between the RT and LRT is larger during winter than that during summer, (2) RTs are generally located lower than the LRT, (3) the thermal definition sometimes fails in winter and spring, and (4) the comparison between the RT and PVT showed the similar good agreement during both summer and winter.
Over a polar-latitude station, the seasonal characteristics of the diurnal oscillation in tropopause height were investigated using 5 years of SOUSY VHF radar measurements (Hall, 2013b). The sunlight variability in polar regions is different from that in other latitudes of the world. Different sunlight variation actually will lead to differences in atmospheric tides and then result in a different diurnal variation in tropopause height. Here we found that the diurnal oscillation of RT height at Xianghe is ubiquitous and obvious throughout the seasons except for in the month of April (Fig. 11). In contrast, at the polar latitude and in the months of November to February, when there is no sunlight, Hall (2013b) observed little evidence of 24 h diurnal variability in RT height.
In this paper, we present the high-resolution structure and variability in the tropopause in Xianghe, China (39.75∘ N, 116.96∘ E), based on the Beijing MST radar vertical-beam echo-power data collected during the period November 2011–May 2017. The fine-scale structure of the RT is determined well, with a high temporal resolution of 0.5 h. Comparison results have shown good agreement in altitude between the RT and LRT, with a correlation coefficient of ≥0.74 for the four seasons. Higher tropopause sharpness seems to contribute to fewer differences between the RT and LRT in altitude, and weaker sharpness appears to be responsible for higher difference. The agreement between the RT and PVT is relatively good in winter and spring, with a correlation coefficient of 0.72 and 0.76 respectively, but poor during summer, with a correlation coefficient of only 0.33. We initially suggested that the poor consistency between RT and PVT is associated with the subtropical jet shifting poleward to ∼40∘ N.
As expected, the sudden jump in static stability (represented by the buoyancy frequency squared) and the rapid increase in radar echo power upon the tropopause layer are clearly observed. Upon the tropopause layer, a sudden increase in the effective radar data-acquisition rate is also observed. Both the monthly mean RT and LRT height have shown a clear seasonal variation. The variability and oscillation of RT height with diurnal or lower timescales are presented. Obvious diurnal variation in tropopause height, zonal wind, and meridional wind is generally observed throughout the seasons, indicating that the modulation is most likely from the atmospheric tides. The semidiurnal variation in RT height is not so obvious and commonly observed occasionally in summer and late spring.
MST radar data are publicly and freely available at http://159.226.22.74/ (last access: July 2019). ECMWF ERA-interim data are publicly and freely available at https://www.ecmwf.int/en/forecasts/datasets (last access: July 2019). Global radiosonde data are publicly available from the NOAA ESRL database at https://ruc.noaa.gov/raobs/ (last access: July 2019).
FC originally conceived and designed the study, in consultation with GC. The processing and data analysis for radar, radiosonde, and reanalysis data were developed by FC. GC, YT, SZ, and KH were the people in charge of MST radar data archiving, image generation, and quality control. CW and WZ helped to check the paper.
We acknowledge the Chinese Meridian Project for providing the MST radar data. The authors sincerely acknowledge the ECMWF for providing global reanalysis data.
This research has been supported by the National Natural Science Foundation of China (grant nos. 41474132 and 41722404).
This paper was edited by Andrew J. Kavanagh and reviewed by two anonymous referees.
Alexander, S. P., Murphy, D. J., and Klekociuk, A. R.: High resolution VHF radar measurements of tropopause structure and variability at Davis, Antarctica (69∘ S, 78∘ E), Atmos. Chem. Phys., 13, 3121–3132, https://doi.org/10.5194/acp-13-3121-2013, 2013.
Añel, J. A., Antuña, J. C., de la Torre, L., Nieto, R., and Gimeno L.: Changes in tropopause height for the Eurasian region determined from CARDS radiosonde data, Naturwissenschafte, 93, 603–609, https://doi.org/10.1007/s00114-006-0147-5, 2006.
Angell, J. K. and Korshover, J.: Quasi-biennial and long-term fluctuations in tropopause pressure and temperature, and the relation to stratospheric water vapor content, Mon. Weather Rev., 102, 29–34, 2009.
Appenzeller, C., Holton, J. R., and Rosenlof, K. H.: Seasonal Variation of Mass Transport Across the Tropopause, J. Geophys. Res., 101, 15071–15078, 1996.
Baray, J., Daniel, V., Ancellet, G., and Legras, B.: Planetary-scale tropopause folds in the southern subtropics, Geophys. Res. Lett., 27, 353–356, 2000.
Bethan, S., Vaughan, G., and Reid, S. J.: A comparison of ozone and thermal tropopause heights and the impact of tropopause definition on quantifying the ozone content of the troposphere, Q. J. Roy. Meteor. Soc., 122, 929–944, 1996.
Chen, F., Chen, G., Shi, C., Tian, Y., Zhang, S., and Huang, K.: Strong downdrafts preceding rapid tropopause ascent and their potential to identify cross-tropopause stratospheric intrusions, Ann. Geophys., 36, 1403–1417, https://doi.org/10.5194/angeo-36-1403-2018, 2018.
Chen, G., Cui, X., Chen, F., Zhao, Z., Wang, Y., Yao, Q., and Gong, W.: MST Radars of Chinese Meridian Project: System Description and Atmospheric Wind Measurement, IEEE T. Geosci. Remote Sens., 54, 4513–4523, 2016.
Das, S. S., Jain, A. R., Kumar, K. K., and Rao, D. N.: Diurnal variability of the tropical tropopause: Significance of VHF radar measurements, Radio Sci., 43, 1–14, https://doi.org/10.1029/2008RS003824, 2008.
Dee, D. P., Uppala, S. M., Simmons, A. J., et al.: The ERA-Interim reanalysis: configuration and performance of the data assimilation system, Q. J. Roy. Meteor. Soc., 137, 553–597, https://doi.org/10.1029/2002RS002767, 2011.
Ding, A. and Wang, T.: Influence of stratosphere-to-troposphere exchange on the seasonal cycle of surface ozone at Mount Waliguan in western China, Geophys. Res. Lett., 33, 233–252, https://doi.org/10.1029/2005GL024760, 2006.
Fukao, S., Hashiguchi, H., Yamamoto, M., Tsuda, T., Nakamura, T., Yamamoto, M. K., Sato, T., Hagio, M., and Yabugaki, Y.: Equatorial Atmosphere Radar (EAR): System description and first results, Radio Sci., 38, 1053, https://doi.org/10.1029/2002RS002767, 2003.
Gage, K. S. and Green, J. L.: Tropopause Detection by Partial Specular Reflection with Very-High-Frequency Radar, Science, 203, 1238–1240, 1979.
Gage, K. S. and Green, J. L.: An objective method for the determination of tropopause height from VHF radar observations, J. Appl. Meteorol., 21, 1150–1154, 1982.
Gettelman, A., Hoor, P., Pan, L. L., Randel, W. J., Hegglin, M. I., and Birner, T.: The extratropical upper troposphere and lower stratosphere, Rev. Geophys., 49, RG3003, https://doi.org/10.1029/2011RG000355, 2011.
Hall, C.: The radar tropopause above Svalbard 2008–2012: Characteristics at various timescales, J. Geophys. Res., 118, 2600–2608, 2013a.
Hall, C.: The radar tropopause at 78∘ N, 16∘ E: Characteristics of diurnal variation, J. Geophys. Res., 118, 6354–6359, https://doi.org/10.1002/jgrd.50560, 2013b.
Hall, C. M., Röttger, J., Kuyeng, K., Sigernes, F., Claes, S., and Chau, J. L.: Tropopause altitude detection at 78∘ N, 16∘ E, 2008: First results of the refurbished SOUSY radar, Radio Sci., 44, 1–12, https://doi.org/10.1029/2009RS004144, 2009.
Hermawan, E., Tsuda, T., and Adachi, T.: MU radar observations of tropopause variations by using clear air echo characteristics, Earth Planet. Space, 50, 361–370, 1998.
Hoerling, M. P., Schaack, T. K., and Lenzen, A. J.: Global Objective Tropopause Analysis, Mon. Weather Rev., 119, 1816–1831, 1991.
Hoinka, K. P.: Statistics of the Global Tropopause Pressure, Mon. Weather Rev., 126, 3303–3325, 1998.
Huang, C., Zhang, S., Zhou, Q., Yi, F., Huang, K., Gong, Y., Zhang, Y., and Gan, Q.: WHU VHF radar observations of the diurnal tide and its variability in the lower atmosphere over Chongyang (114.14∘ E, 29.53∘ N), China, Ann. Geophys., 33, 865–874, https://doi.org/10.5194/angeo-33-865-2015, 2015.
Liu, Y., Xu, T., and Liu, J.: Characteristics of the seasonal variation of the global tropopause revealed by cosmic/GPS data, Adv. Space Res., 54, 2274–2285, 2014.
May, P. T., Yamamoto, M., Fukao, S., Sato, T., Kato, S., and Tsuda, T.: Wind and reflectivity fields around fronts observed with a VHF radar, Radio Sci., 26, 1245–1249, 1991.
Nastrom, G. D., Green, J. L., Gage, K. S., and Peterson, M. R.: Tropopause Folding and the Variability of the Tropopause Height as Seen by the Flatland VHF Radar, J. Appl. Meteorol., 28, 1271–1281, 1989.
Nielsen-Gammon, J. W.: A visualization of the global dynamic tropopause, B. Am. Meteorol. Soc., 82, 1151–1168, 2001.
Pan, L. L., Randel, W. J., Gary, B. L., Mahoney, M. J., and Hintsa, E. J.: Definitions and sharpness of the extratropical tropopause: A trace gas perspective, J. Geophys. Res., 109, D23103, https://doi.org/10.1029/2004JD004982, 2004.
Pan, L. L., Randel, W. J., Gille, J. C., Hall, W. D., Nardi, B., Massie, S., Yudin, V., Khosravi, R., Konopka, P., and Tarasick, D.: Tropospheric intrusions associated with the secondary tropopause, J. Geophys. Res., 114, D10302, https://doi.org/10.1029/2008JD011374, 2009.
Press, W. H. and Rybicki, G. B.: Fast algorithm for spectral analysis of unevenly sampled data, Astrophys. J., 338, 277–280, 1989.
Ramakrishnan, K. P.: Distortion of the tropopause due to meridional movements in the sub-stratosphere, Nature, 132, 932–932, 1933.
Randel, W. J. and Wu, F.: The Polar Summer Tropopause Inversion Layer, J. Atmos. Sci., 67, 2572–2581, 2010.
Randel, W. J., Wu, F., and Gaffen, D. J.: Interannual variability of the tropical tropopause derived from radiosonde data and NCEP reanalyses, J. Geophys. Res.-Atmos., 105, 15509–15523, 2000.
Randel, W. J., Seidel, D. J., and Pan, L. L.: Observational characteristics of double tropopauses, J. Geophys. Res., 112, D07309, https://doi.org/10.1029/2006JD007904, 2007a.
Randel, W. J., Wu, F., and Forster, P. M.: The extratropical tropopause inversion layer: Global observations with GPS data, and a radiative forcing mechanism, J. Atmos. Sci., 64, 4489–4496, 2007b.
Ravindrababu, S., Venkat Ratnam, M., Sunilkumar, S. V., Parameswaran, K., and Krishna Murthy, B. V.: Detection of tropopause altitude using Indian MST radar data and comparison with simultaneous radiosonde observations, J. Atmos. Sol.-Terr. Phy., 121, 679–687, 2014.
Reed, R. J.: A study of a characteristic tpye of upper-level frontogenesis, J. Atmos. Sci., 12, 226–237, 1955.
Roettger, J.: Observations of the polar d-region and the mesosphere with the Eiscat Svalbard radar and the SOUSY Svalbard Radar (scientific paper), Memoirs of National Institute of Polar Research, 54, 9–20, 2001.
Santer, B. D., Sausen, R., Wigley, T. M., Boyle, J. S., Achutarao, K., Doutriaux, C., Hansen, J. E., Meehl, G. A., Roeckner, E., Ruedy, R., Schmidt, G., and Taylor, K. E.: Behavior of tropopause height and atmospheric temperature in models, reanalyses, and observations: Decadal changes, J. Geophys. Res., 108, 4002, https://doi.org/10.1029/2002JD002258, 2003a.
Santer, B. D., Wehner, M. F., Wigley, T. M., Sausen, R., Meehl, G. A., Taylor, K. E., Ammann, C., Arblaster, J., Washington, W. M., Boyle, J. S., and Brüggemann, W.: Contributions of anthropogenic and natural forcing to recent tropopause height changes, Science, 301, 479–483, 2003b.
Sausen, R. and Santer, B. D.: Use of Changes in Tropopause Height to Detect Human Influences on Climate, Meteorol. Z., 12, 131–136, 2003.
Schmidt, T., Heise, S., Wickert, J., Beyerle, G., and Reigber, C.: GPS radio occultation with CHAMP and SAC-C: global monitoring of thermal tropopause parameters, Atmos. Chem. Phys., 5, 1473–1488, https://doi.org/10.5194/acp-5-1473-2005, 2005.
Seidel, D. J., Ross, R. J., Angell, J. K., and Reid, G. C.: Climatological characteristics of the tropical tropopause as revealed by radiosondes, J. Geophys. Res., 106, 7857–7878, 2001.
Son, S. W., Tandon, N. F., and Polvani, L. M.: The fine-scale structure of the global tropopause derived from COSMIC GPS radio occultation measurements, J. Geophys. Res.-Atmos., 116, D20113, https://doi.org/10.1029/2011JD016030, 2011.
Sprenger, M., Croci Maspoli, M., and Wernli, H.: Tropopause folds and cross-tropopause exchange: a global investigation based upon ECMWF analyses for the time period March 2000 to February 2001, J. Geophys. Res.-Atmos., 108, 291–302, 2003.
Tian, Y. and Lu, D.: Comparison of Beijing MST Radar and Radiosonde Horizontal Wind Measurements, Adv. Atmos. Sci., 34, 39–53, https://doi.org/10.1007/s00376-016-6129-4, 2017.
Vaughan, G., Howells, A., and Price, J. D.: Use of MST radars to probe the mesoscale structure of the tropopause, Tellus A, 47, 759–765, 1995.
Wang, C.: Development of the Chinese meridian project, Chinese J. Space Sci., 30, 382–384, 2010.
Wilcox, L. J., Hoskins, B. J., and Shine, K. P.: A global blended tropopause based on ERA data. Part I: Climatology, Q. J. Roy. Meteor. Soc., 138, 561–575, https://doi.org/10.1002/qj.951, 2012.
Wirth, V.: Thermal versus dynamical tropopause in upper-tropospheric balanced flow anomalies, Q. J. Roy. Meteor. Soc., 126, 299–317, 2000.
Wirth, V.: Cyclone-anticyclone asymmetry concerning the height of the thermal and the dynamical tropopause, J. Atmos. Sci., 58, 26–37, 2001.
WMO: A three-dimensional science, WMO Bull., 6, 134–138, 1957.
Yamamoto, M., Oyamatsu, M., Horinouchi, T., Hashiguchi, H., and Fukao, S.: High time resolution determination of the tropical tropopause by the Equatorial Atmosphere Radar, Geophys. Res. Lett., 30, 2094, https://doi.org/10.1029/2003GL018072, 2003.
Zängl, G. and Hoinka, K. P.: The tropopause in the polar regions, J. Climate, 14, 3117–3139, 2001.


