the Creative Commons Attribution 4.0 License.
the Creative Commons Attribution 4.0 License.
Quarterdiurnal signature in sporadic E occurrence rates and comparison with neutral wind shear
Christina Arras
Christoph Geißler
Friederike Lilienthal
The GPS radio occultation (RO) technique is used to study sporadic E (Es) layer plasma irregularities of the Earth's ionosphere on a global scale using GPS signal-to-noise ratio (SNR) profiles from the COSMIC/FORMOSAT-3 satellite. The maximum deviation from the mean SNR can be attributed to the height of the Es layer. Es are generally accepted to be produced by ion convergence due to vertical wind shear in the presence of a horizontal component of the Earth's magnetic field, while the wind shear is provided mainly by the solar tides. Here we present analyses of quarterdiurnal tide (QDT) signatures in Es occurrence rates. From a local comparison with mesosphere/lower thermosphere wind shear obtained with a meteor radar at Collm (51.3∘ N, 13.0∘ E), we find that the phases of the QDT in Es agree well with those of negative vertical shear of the zonal wind for all seasons except for summer, when the QDT amplitudes are small. We also compare the global QDT Es signal with numerical model results. The global distribution of the Es occurrence rates qualitatively agrees with the modeled zonal wind shears. The results indicate that zonal wind shear is indeed an important driving mechanism for the QDT seen in Es.
- Article
(5733 KB) - Full-text XML
- BibTeX
- EndNote
In the lower E region of the ionosphere, thin layers of high electron density are frequently found, the so-called lower ionospheric sporadic E (Es) layers. Es layers are thin clouds of accumulated plasma, which occur primarily at mid latitudes and maximize during summer (e.g., Arras et al., 2008). They are generally formed at altitudes between 90 and 120 km. According to the wind shear theory (Whitehead, 1961) the process of Es formation is a metallic ion convergence owing to the interaction between the Earth's magnetic field, the metallic ion concentration, and the vertical gradient of the horizontal neutral wind, “wind shear” in brief. Neglecting diffusion, the vertical velocity component of the neutral gas, and the electric force, the vertical ion drift wI may be written as (e.g., Haldoupis, 2012; Fytterer et al., 2014; Oikonomou et al., 2014)
where U and V are the zonal and meridional wind components of the neutral gas pointing towards the east and the north, respectively, while I is the inclination of the Earth's magnetic field. The parameter describes the ratio of the ion-neutral gas collision frequency ν and the gyro frequency , with e as the elementary charge, B0 as the total intensity of the Earth's magnetic field, and mI as the ion mass. Note that in Eq. (1), in contrast to the usual notations in the literature, Cartesian coordinates are used. Given that r≫1 below 115 km (Bishop and Earle, 2003), in the lower E region the zonal wind component is more efficient in causing vertical plasma motion than the meridional wind component. Consequently, the second term of Eq. (1) becomes small at these heights, and therefore negative vertical zonal wind shear, i.e., a negative vertical gradient of the zonal horizontal wind, is primarily responsible for the formation of Es. Note that Eq. (1) holds only for magnetic mid latitudes (about 20–70∘), where electric forces can be neglected.
General correspondence between wind shear and Es was found, e.g., from comparisons using winds from the Horizontal Wind Model (Chu et al., 2014). Recently, Shinagawa et al. (2017) calculated the global distribution of the vertical ion convergence based on GAIA Earth system model simulations and showed that their global distribution is roughly consistent with Es occurrence rates (OR). Liu et al. (2018) found correspondence between Es OR taken from Global Positioning System (GPS) radio occultation (RO) data and wind shear calculated from the TIMED/TIDI satellite-borne zonal winds.
The dynamics of the upper mesosphere and lower thermosphere are strongly influenced by atmospheric waves (e.g., Yiǧit and Medvedev, 2015), including the solar tides with periods of a solar day, and its harmonics. Their wind amplitudes usually maximize around or above 120 km. In these regions, the tidal amplitudes are on the order of magnitude of the mean wind. Shorter period waves often have smaller amplitudes, so that the main diurnal variability is due to the diurnal tide (DT), to the semidiurnal tide (SDT), and, to a lesser degree, to the terdiurnal tide (TDT). The quarterdiurnal tide (QDT), although it also forms an integral part of the middle and upper atmosphere dynamics, has attained much less attention, mainly due to its smaller amplitude. The solar tides are a major source of the vertical wind shear, and they frequently provide larger vertical gradients – both negative and positive depending on local time – than the background wind. Therefore, tide-like structures are expected in Es occurrence rates. Actually, the SDT and DT are generally accepted to be the major driver of Es (Mathews, 1998), leading to the reproduction of downward moving tidal signatures visible, e.g., in Es ionosonde registrations (e.g., Haldoupis et al., 2006; Haldoupis, 2012). By combining GPS Es registrations and radar wind measurements at mid latitudes, Arras et al. (2009) showed that the Es occurrence frequencies in the course of 1 d actually maximize when the zonal wind shear provided by the SDT is negative. Modeling by Resende et al. (2018b) showed the connection between Es and tides, although they focused on the equatorial region, where electric field effects become important. More recently, Fytterer et al. (2013) found a clear correlation between mid-latitude zonal wind shear and Es for the 8 h component also. Fytterer et al. (2014) showed correspondence between the TDT in Es and the wind shear on a global scale. Thus, Fytterer et al. (2013, 2014) confirmed that not only DT and SDT, but TDT wind shear as well, contributes to Es formation.
There remains the question about the role of the QDT in the formation of Es, and a possible connection with the QDT neutral wind shear at mid latitudes. Some publications reported that no QDT signature was found in some ionospheric records (e.g., Cyprus, 35∘ N, 33∘ E, Oikonomou et al., 2014). However, 6 h tidal signatures were observed in lower ionospheric Es parameters already (Tong et al., 1988; Morton et al., 1993). For the neutral atmosphere, observations of the QDT in barographic records (e.g., Warburton and Goodkind, 1977; Hupe et al., 2018) have been reported, and some reports on observations from mesosphere and lower thermosphere (MLT) radars are available (Smith et al., 2004; Liu et al., 2006; Jacobi et al., 2017, 2018; Guharay et al., 2018). Few attempts to numerically model the QDT were undertaken (Smith et al., 2004; Jacobi et al., 2018). On a global scale, the 6 h harmonics of ozone heating rates were calculated from Aura/MLS satellite observations by Xu et al. (2012), who noted that the main 6 h forcing during solstice is in the winter hemisphere. Xu et al. (2014) analyzed nonmigrating tides from TIMED/SABER observations. In a further study, Liu et al. (2015), again using TIMED/SABER data, analyzed the migrating QDT between 50∘ S and 50∘ N in the middle atmosphere. Azeem et al. (2016) analyzed temperature data from the NIRS instrument on the International Space Station and from SABER during June and July 2010, and found that the QDT was a significant dynamical feature in the thermosphere. The seasonal/latitudinal structure of the QDT is complex. Generally, the seasonal cycle exhibits a maximum in winter and also during equinoxes. Regarding the latitudinal distribution, several maximums at low, mid, and higher latitudes were observed and modeled (Smith et al., 2004; Liu et al., 2015; Azeem et al., 2016). The latitudinal structure is dominated by the (4, 6) Hough mode, but other modes are also present (Liu et al., 2015).
Returning to Es, their 6 h component has not yet been analyzed in detail using GPS RO observations, which motivates us to search for the QDT signature in Es OR derived from RO and compare them with local wind shear observations and global model predictions. Therefore, in this paper we analyze the quarterdiurnal oscillation seen in Es, obtained from GPS RO measurements by the FORMOsa SATellite mission-3/Constellation Observing System for Meteorology, Ionosphere and Climate (FORMOSAT-3/COSMIC). We compare Es phases with phases of negative wind shear obtained from the local radar observations at Collm (51.3∘ N, 13.0∘ E) and compare the global distribution of 6 h amplitudes Es with the wind shear amplitudes from numerical modeling. The remainder of the paper is organized as follows. In Sect. 2 the Es detection and the radar wind observations are briefly described, and the numerical global circulation model is introduced. Results of QDT analysis and comparison with wind shear observations and modeling are presented in Sect. 3. Section 4 concludes the paper.
2.1 Sporadic E occurrence rates
The FORMOSAT-3/COSMIC constellation consists of six low-Earth orbiting (LEO) microsatellites which orbit the Earth at an initial altitude of 800 km. The satellites perform RO measurement in both the neutral atmosphere and the ionosphere (Anthes et al., 2008). During an occultation, signals of rising or setting GPS satellites are received by a LEO satellite. While the signals pass the Earth's atmosphere they are modified by the atmospheric conditions, in particular the ionospheric electron density, which causes refraction and degradation of the GPS waves. This can be utilized to obtain information about the ionosphere and the neutral atmosphere. More detailed information on the principles of the RO technique is given by Hajj et al. (2002) and Kursinski et al. (1997).
The method to derive Es information from RO signals was described in Arras and Wickert (2018). In brief, for our investigations, the signal-to-noise ratio (SNR) profiles of the GPS L1 phase measurements (UCAR, 2018) are used. The SNR is very sensitive to vertical variations of the electron density, and these occur within an Es layer. These vertically localized electron density variations lead to phase fluctuations of the GPS signal, which can be observed as changes in the received signal strength (Hajj et al., 2002). In order to avoid influences from the different basic signal power values on the further data analysis, every SNR profile is normalized first. In the case of absence of ionospheric disturbances, the SNR value is almost constant at altitudes above 35 km. The SNR standard deviation profile is considered to be disturbed when it exceeds an empirically found threshold of 0.2. If large standard deviation values are concentrated within a thin layer of less than 10 km vertical extent, we assume that the respective SNR profile includes the signature of an Es layer. The height where the SNR value deviates most from the mean of the SNR profile is considered the altitude of the Es layer. This has been validated by comparisons with ionosonde Es observations (Arras and Wickert, 2018; Resende et al., 2018a).
Figure 1 shows 2007–2016 mean zonal mean Es OR. Sporadic E OR were calculated as the number of Es within a 5∘ latitude and 10 km height window, divided by the number of ROs in the respective latitude window. Figure 1 shows seasonal mean OR for December–February (DJF), March–May (MAM), June–August (JJA), and September–November (SON). The distributions are similar to those shown by Fytterer et al. (2014) obtained from a more limited dataset. Maximum OR are found at altitudes slightly below 100 km for low latitudes, but above 100 km for mid to high latitudes except for autumn. OR maximize in summer, which is thought to be due to increased meteor influx during that season (Haldoupis et al., 2007). The summer maximum is more pronounced in the Northern Hemisphere, which is due to the South Atlantic Anomaly and the weaker magnetic field there (e.g., Arras et al., 2008; Chu et al., 2014; Arras and Wickert, 2018), so that Southern Hemisphere summer zonal mean OR are smaller than Northern Hemisphere ones. Near the Equator, Es OR are small, owing to the horizontal magnetic field at the magnetic Equator, which does not allow the electrons to follow the vertically moving ions (e.g., Arras et al., 2008, 2010; Arras and Wickert, 2018).
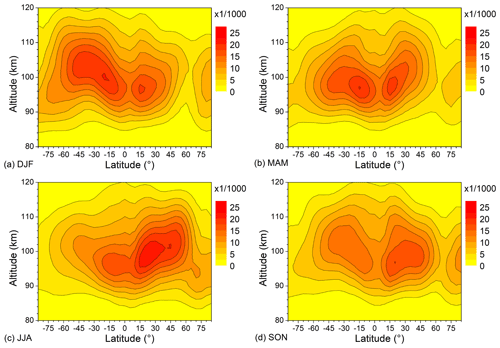
Figure 1Zonal and seasonal mean Es occurrence rates for (a) DJF, (b) MAM, (c) JJA, and (d) SON. Data are averages over 2007–2016.
Although OR maximize in summer, they are also found in the winter hemisphere at low latitudes. The winter low-latitude maximum is clearly visible in the Northern Hemisphere (NH; Fig. 1a). It is also seen in the Southern Hemisphere (SH) winter (Fig. 1c), but the OR values are lower than those in the NH winter, again because of the South Atlantic Anomaly, where the Es OR are low. Regarding the MAM and SON distributions (Fig. 1b, d), they are both not really symmetric about the Equator, but the shapes of the respective NH and SH distributions are different within one panel. On the other hand, during both seasons the distributions of the respective spring hemispheres (MAM-NH and SON-SH) reveal a similar shape, and this is also true of the respective autumn hemispheres (MAM-SH and SON-NH). The SON-SH values are lower than the MAM-NH values due to the South Atlantic Anomaly. Interestingly, the MAM-SH values are larger than their counterparts in the SON-NH, which might be due to an Es hotspot over Indonesia and especially Australia that is visible in the global distribution, e.g., presented by Arras et al. (2008).
2.2 Collm mesosphere/lower thermosphere wind shear
At Collm (51.3∘ N, 13.0∘ E), a SKiYMET meteor radar has been operated at 36.2 MHz since summer 2004. The radar operates in an all-sky configuration, and the main parameters observed are the MLT radial winds determined from the Doppler shift of individual meteor trails. Details of the radar system and the radial wind determination principle can be found in Jacobi (2012), Stober et al. (2012), and Lilienthal and Jacobi (2015). During 2015 the radar were upgraded by increasing the peak power and replacing the Yagi antennas with crossed dipoles. The transmit frequency is still the same (Stober et al., 2017). The individual meteor trail reflection heights vary between about 75 and 110 km, with a maximum meteor count rate at an altitude slightly below 90 km (e.g., Stober et al., 2008). The data are binned here in six different non-overlapping height gates centered at 82, 85, 88, 91, 94, and 98 km. The hourly mean reflection height may slightly deviate from the nominal heights due to the uneven height distribution of meteors within each gate (Jacobi, 2012). Individual radial winds calculated from the meteors are collected to form hourly mean horizontal winds using a least-squares fit of the horizontal wind components to the raw data under the assumption that vertical winds are small (Hocking et al., 2001). Hourly values of the zonal wind shear are calculated from adjacent height gates as in Arras et al. (2009) and Fytterer et al. (2013). The reference height for shear values is attributed to the center between the nominal heights of the wind values, except for the upper height gate where the real mean height is close to 97 km, so that the uppermost wind shear level is placed at 95.5 km.
Two examples of the diurnal zonal wind and wind shear variation in the MLT over Collm are shown in Fig. 2. In the left panels, height–time cross sections of 2007–2016 mean (a) DJF and (c) JJA mean diurnal zonal winds and wind shears S(t) over Collm are shown. In winter, maximum wind values exceed 70 (50) m s−1 in the eastward (westward) direction, while the zonal wind shear maximizes at more than −8 (+6) m s−1 km−1, similar to the values shown by Arras et al. (2009). We note that during two time intervals per day, strong negative wind shear prevails, which according to the wind shear theory supports Es formation. During summer (Fig. 2c), the background wind shear is strongly positive, and only at the upper height gate do short time intervals of negative wind shear occur. Therefore, at altitudes below ∼93 km, Es formation is much less supported by the mean wind distribution, which is consistent with the greater mean Es heights in summer than in winter at mid latitudes (see Fig. 1).
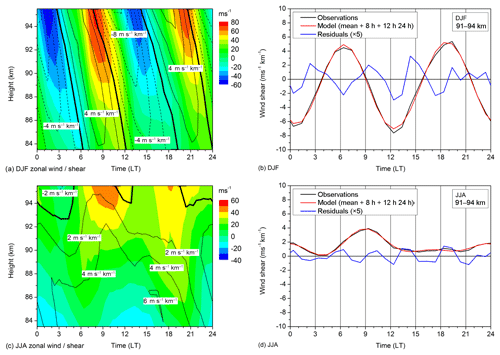
Figure 22007–2016 mean DJF and JJA mean diurnal cycle of zonal wind and wind shear over Collm. Left panels: height–time cross sections of zonal wind (color coding) and wind shear (contour lines) for (a) DJF and (c) JJA. Dashed contour lines denote negative wind shear. Note the different color scaling for the DJF and JJA mean winds. Right panels: (b) DLF and (d) JJA wind shear at about 91.5 km (black line), together with a fit including mean, 8, 12, and 24 h components (red line). The residuals, multiplied by a factor of 5, are added as blue line.
Clearly, the main contribution to zonal wind and wind shear variability, in particular during winter, is due to the SDT and partly DT. To visualize the higher-frequency wind shear variations, in the right panels of Fig. 2, the diurnal zonal wind shear values S(t) at 92.5 km are shown for (b) DJF and (d) JJA, together with a modeled least-squares fit SMod(t) including diurnal mean S0, as well as the 8, 12, and 24 h components:
with t as the time and Pi as the above-mentioned periods, and the coefficients ai and bi being determined by minimizing . The amplitudes Ai and phases Ti of the wind shear are calculated as
Note that the phases are defined here as the time of maximum negative wind shear, so that a Pi∕2 term is added to the right-hand side of the second part of Eq. (3). The residuals S(t)−SMod(t), multiplied by a factor of 5 for better visibility, are added as blue line in the right panels of Fig. 2. Obviously, there is a quarterdiurnal signature during winter (Fig. 2b) and at this altitude level. Amplitudes and phases of this variation are calculated via a least-squares fit similar to Eqs. (2) and (3), but in addition including the QDT period P4=6 h in the analysis. In contrast to winter, there is no significant 6 h component of the wind shear visible during summer (Fig. 2d), which is consistent with small QDT amplitudes in summer, as was shown by (Jacobi et al., 2017).
Figure 3 shows the 2007–2016 mean seasonal mean Collm residual zonal wind shear after removing the mean shear and the 8, 12, and 24 h components for (a) DJF, (b) MAM, (c) JJA, and (d) SON. The 6 h phases, defined as the time of maximum negative wind shear according to Eq. (3), are added. The QDT at Collm is relatively strong in winter, but very weak and insignificant in summer, and consequently as in Fig. 2d the 6 h signal is not visible for JJA. For the other seasons the QDT shear tends to increase with altitude, although in MAM the QDT signal is not the major one at the upper height gate. In SON, the QDT seasonal means consist of a superposition of summer, transition, and winter oscillations (see Jacobi et al., 2017, their Figs. 3 and 6). As a consequence, at the upper height gates a clear QDT signature is visible, but these are not connected with the QDT at the lower heights, also leading to a break in the vertical phase change.
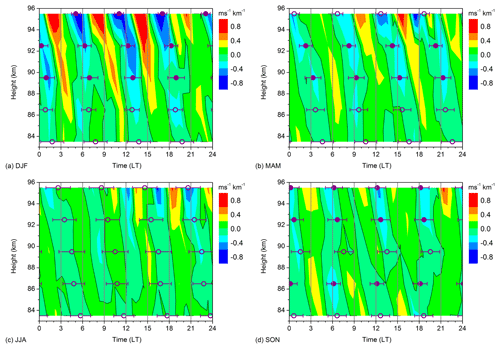
Figure 32007–2016 mean seasonal mean Collm residual wind shear after removing diurnal mean shear, 8, 12, and 24 h components for (a) DJF, (b) MAM, (c) JJA, and (d) SON. The 6 h phases, defined as the time of maximum negative wind shear, are added together with their standard deviation calculated from phases of single years. Solid symbols denote oscillations significant at the 5 % level according to a t-test.
2.3 MUAM circulation model predictions
We use the nonlinear Middle and Upper Atmosphere Model (MUAM) to investigate the QDT with wavenumber 4. MUAM is a three-dimensional mechanistic primitive equation model based on the COMMA-LIM (Fröhlich et al., 2003b; Jacobi et al., 2006) model. The more recent version of the model, MUAM, is documented by Pogoreltsev (2007), Pogoreltsev et al. (2007), and Lilienthal et al. (2017, 2018). MUAM extends from the surface (1000 hPa) to the lower thermosphere, while the lower 30 km zonal mean temperatures are nudged with monthly mean 2000–2010 mean ERA-Interim reanalyses of zonal mean temperature. This ensures that the zonal mean dynamics of the lower atmosphere is close to the reanalyses, while waves are allowed to form anyway. The model has a horizontal resolution of 5×5.625∘ and a vertical resolution of 2842 km in logarithmic pressure coordinates with a constant scale height of H=7 km. Parameterizations of gravity waves, of solar and infrared radiation, as well as of several ionospheric effects are included. The latter, however, are only represented based on simple empirical distributions.
Solar heating in the middle atmosphere is parameterized following Strobel (1978). This considers heating due to the most important gases such as H2O, CO2, ozone, O2, and N2. Note that these gases are taken as zonal means, different from other versions of MUAM (e.g., Suvorova and Pogoreltsev, 2011; Ermakova et al., 2017), so that mainly migrating tides are forced through the solar heating. Monthly mean zonal mean ozone fields up to 50 km altitude are taken from the Stratosphere-troposphere Processes And their Role in Climate project (SPARC; Randel and Wu, 2007), and an exponential decrease in ozone is applied above 50 km. Monthly volume mixing ratios for CO2 have been chosen according to measurements from Mauna Loa Observatory for the year 2005 (e.g., 378 ppm for January; NOAA ESRL Global Monitoring Division, 2018), and the mixing ratio is assumed constant across latitudes and longitudes. CO2 mixing ratios are taken as constant with height until 87.5 km, and then decrease exponentially. Chemical heating due to recombination of O2 and O (Riese et al., 1994), and heating due to extreme ultraviolet radiation, are added. This is described in more detail by Fröhlich et al. (2003a).
Gravity waves in the middle atmosphere are calculated by a linear Lindzen-type (Lindzen, 1981) parameterization based on Jakobs et al. (1986) and updated as described by Fröhlich et al. (2003a, b) and Jacobi et al. (2006). Due to the fact that this parameterization does not account for gravity waves in the thermosphere, it is coupled with a modified parameterization following Yiǧit et al. (2008, 2009), and both parameterizations are connected via the eddy diffusion coefficient. To avoid large interactions between both parameterizations, we limit the phase speeds of the Lindzen-type scheme to 5–30 m s−1, while the Yiǧit scheme covers larger phase speeds between 35 and 105 m s−1. This way, the Yiǧit parameterization mainly affects the thermosphere, while the Lindzen-type parameterization affects the stratosphere and mesosphere. Overlaps between both parameterizations are small and the contributions of both routines to the tendency terms can be simply summed up (Lilienthal et al., 2018).
In the configuration used here, the model incorporates a spin-up of 120 model days. Within that time, the heating rates are zonally averaged and therefore build up a background climatology without any tidal forcing. Note that we do not explicitly excite any kind of waves at the lower boundary during the whole simulation. In the following 90 model days, the heating rates are allowed to be zonally variable, and through their diurnal variability tides start to propagate. In this model version, the sun's zenith angle is kept fixed to the middle of the respective month. The last 30 model days are analyzed and the results of tidal analysis are presented here. Since there is no change in any forcing, the day-to-day variability is negligibly small.
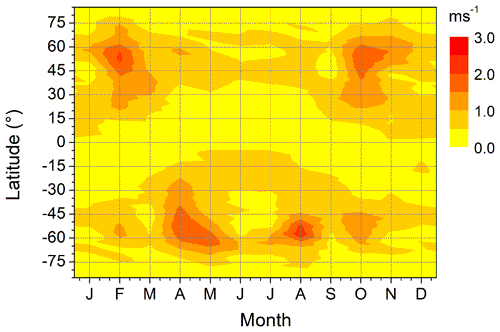
Figure 4 shows the annual cycle of the simulated monthly 6 h zonal wind amplitudes at ∼101 km altitude, which is close to the height of maximum Es OR. QDT amplitudes for other model heights are shown in the Appendix. The QDT zonal wind amplitudes are larger in winter than in summer, which have also been observed (Jacobi et al., 2017). Winter maximums are seen at higher and mid latitudes, and are also predicted by Smith et al. (2004). Winter QDT amplitudes in both hemispheres tend to maximize in early and late winter, with a relative minimum during solstice. There is also a tendency for the spring maximum at mid latitudes that was reported by Jacobi et al. (2017). We also note maximums at 30–40∘, as reported by Liu et al. (2015). Note that, since the solar forcing is parameterized using zonal mean climatologies of minor species, the MUAM amplitudes only show migrating components, while the radar observations deliver the total amplitude. However, from amplitude and phase comparisons between two stations, Jacobi et al. (2017) concluded that the major contribution to the QDT observed by radar is mainly due to the migrating tide, and comparison between model results and radar is justified.
3.1 Local comparison of 6 h radar wind shear and Es occurrence rates
Here, we compare the diurnal cycle of Es OR at the latitude of Collm with the wind shear observed by the MR with respect to the QDT signature, similar to the approach of Arras et al. (2009) and Fytterer et al. (2013) for the 12 and 8 h components, respectively. Similarly to Fig. 1, OR have been calculated as the number of Es divided by the number of RO, but here a latitude window of 10∘ centered at 51∘ N was chosen, and the data were sampled in hourly bins according to local time. The phases of nonmigrating tides at different longitudes are different, so that the nonmigrating components average out if we sample irrespective of longitude and therefore effectively average over longitudes. Therefore, only the migrating tidal components contribute to the diurnal cycle in our analyses. As in Fig. 1, the data refer to 10 km height gates. The diurnal cycles for four seasons are shown in Fig. 5. We note the downward propagation of Es OR signatures, which are dominated by the SDT and, to a lesser degree, by a diurnal variation (see, e.g., Arras et al., 2009). The strongest amplitudes are seen in summer, while minimum amplitudes are found in winter, which is due to the overall seasonal cycle of OR at higher mid latitudes: see Fig. 1.
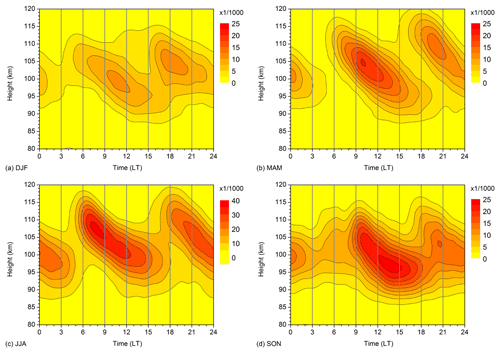
Figure 52007–2016 mean seasonal mean diurnal cycle of Es occurrence rates for (a) DJF, (b) MAM, (c) JJA, and (d) SON in a latitude band 46–56∘ N and in height gates of 10 km. Note the different scaling for JJA.
The residuals of Es OR after removing daily mean and 8, 12, and 24 h components, i.e., calculated in the same manner as the wind shear residuals in Fig. 3, are shown in Fig. 6. The QDT phases are calculated according to the right-hand side of the second part of Eq. (3), but without the P4∕2 term, since we are interested in the times of maximum Es. The zonal wind shear phases shown in Fig. 3 are also added in the lower parts of the respective panels of Fig. 6. Again, solid symbols indicate that the amplitudes are significant at the 5 % level according to a t-test. The QDT in Es is strongest in summer, as are the overall OR (see Fig. 5). Vertical phase gradients in summer are large, but smaller in winter and autumn, which is also the case with the QDT in neutral winds (Smith et al., 2004; Jacobi et al., 2017). In autumn, significant QDT amplitudes are only found in a small height range at 95–100 km. Generally, the QDT in Es disappears below 90–95 km. In all seasons, negative wind shear phases and Es phases agree within their standard deviations in the upper two radar height gates, i.e., above 90 km. This is also the case in summer, although both wind shear and Es amplitudes are not significant then. This indicates that the QDT in Es actually forms at the nodes of the negative QDT wind shear component. Therefore the Es formation process, which is responsible for the strong 12 h component in Es, also acts for the much weaker QDT.
3.2 Global distribution of 6 h wind shear and Es occurrence rates
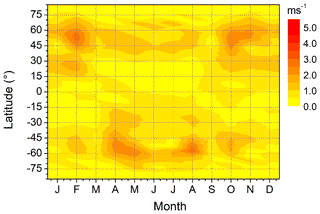
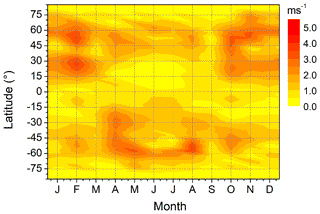
The Es QDT amplitudes are not necessarily directly related to the respective wind shear amplitudes, because Es intensities and OR depend on wind shear, but also on the ionization of metallic ions, and the latter are thought to exhibit a seasonal cycle owing to the variability of meteor influx (Haldoupis et al., 2007). Therefore, e.g., at mid latitudes, the largest Es OR amplitudes are found in summer (see Fig. 6), while the largest QDT in the neutral wind is seen during winter (Figs. 3 and 4). Further, wind shear theory includes the influence of the horizontal magnetic field leading to a latitudinal dependence of Es OR, as well as to anomalies like the South Atlantic Anomaly. To take this into account when showing the global distribution of Es QDT amplitudes, following Fytterer et al. (2014) we calculated relative amplitudes OR. We show their global distribution at an altitude of 101 km in Fig. 7a. The zonal wind shear QDT at the nearest model level at 100.9 km height, calculated from MUAM monthly simulations, is shown in Fig. 7b. The respective distributions at other altitudes are shown in the Appendix. Both parameters in Fig. 7 show a corresponding maximum in the winter higher mid latitudes in both hemispheres. In the Southern Hemisphere, the QDT in both Es and wind shear is small during boreal winter. In the Northern Hemisphere summer, a further QDT maximum in Es is found, which is, however, only weakly represented in the wind shear. During the equinoxes, corresponding maximums are again found at lower and mid latitudes, especially in the Northern Hemisphere. Overall, there is a striking similarity between Es and wind shear QDT, in particular taking into account that the wind shear here is not taken from observations, but from numerical modeling with tides being forced self-consistently and not based on observed distributions.
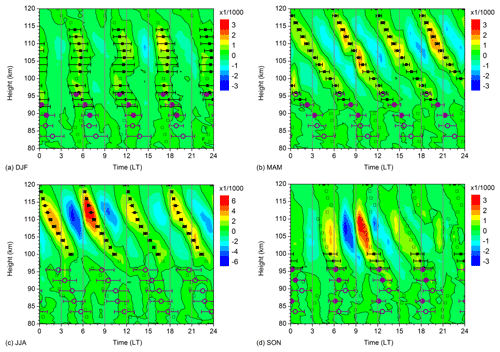
Figure 62007–2016 mean seasonal mean diurnal cycle of Es residual occurrence rates after removing diurnal mean, 8, 12, and 24 h components for (a) DJF, (b) MAM, (c) JJA, and (d) SON in a latitude band 46–56∘ N and in height gates of 10 km. Note the different scaling for JJA; 6 h phases of OR and Collm wind shear are added as squares and circles, respectively. Solid symbols denote oscillations significant at the 5 % level according to a t-test. The error bars show standard deviations calculated from phases for single years.

Figure 7(a) 2007–2016 mean monthly mean QDT Es relative amplitudes at 101 km. (b) MUAM zonal wind shear at the nearest model level at 100.9 km.
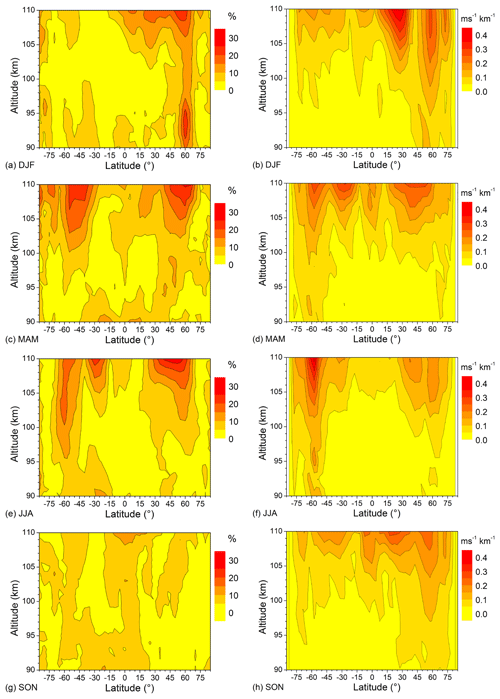
Figure 8Left column: 2007–2016 mean monthly mean QDT Es relative amplitudes for (a) DJF, (c) MAM, (e) JJA, and (g) SON. Right column: corresponding MUAM QDT component of zonal wind shear for (b) DJF, (d) MAM, (f) JJA, and (h) SON.
Figure 8 shows in the left column seasonal mean relative Es amplitudes as latitude–height plots, while the corresponding modeled QDT shear amplitudes are presented in the right column. We show values only between 90 and 110 km, because below and above the OR become small (Figs. 1 and 5), and therefore the A4, r distribution tends to become more irregular. There is an overall close correspondence between Es and wind shear during the solstices (Fig. 8a, b, e, f). Wind shear amplitudes then are large in the mid- to high-latitude winter hemisphere, with large values down to the upper mesosphere, while corresponding Es amplitudes are large there, too. A secondary maximum in the lower thermosphere winter near 30∘ is also seen in both Es and wind shear. In JJA, there is also a qualitatively corresponding maximum in the summer hemisphere. This is also visible in the DJF wind shear, however, only very weakly expressed in DJF Es. During boreal spring (Fig. 8b, c), there are corresponding maximums in Es and wind shear QDT at higher mid latitudes, peaking at 60∘ S and at 45–60∘ N. There is also an indication of a joint maximum close to the Equator. The latter, however, is probably coincidental, since the wind shear theory according to Eq. (1) does not hold for magnetic latitudes below about 20∘. There is a modeled QDT wind shear maximum near 30∘ S during MAM, which is not visible in Es, similar to the situation during austral spring (Fig. 8g, f). Generally, the correspondence between wind shear and Es QDT is weakest during SON. This may partly be due to the seasonal cycle and the fact that seasonal averages are taken from monthly data that may be very different (e.g., a clear minimum/maximum in September/November at higher northern mid latitudes; see Fig. 7). Also, the overall correspondence between Es and wind shear QDT mainly refers to the position of maximums and minimums, while the absolute values may differ. Still, however, there is a correspondence visible between the global distribution of the QDT in Es and the one seen in wind shear, indicating the presence of the wind shear mechanism also for the QDT.
We have analyzed the migrating QDT amplitudes and phases from Es OR obtained from GPS RO observations. Comparing the Es phases with those from wind shear observed by radar over a mid-latitude site shows a clear correspondence, indicating that the wind shear mechanism is indeed an important source for the Es QDT. Note, however, that we have compared the local QDT phases with the migrating signal from Es, and although the migrating QDT is the dominating one at the latitude of the observations, a future analysis will have to consider this in detail and also analyze the nonmigrating components from the Es QDT. Wind shear and Es QDT phase gradients are smaller in winter than in summer, indicating shorter QDT wavelengths in summer than in winter, which is in agreement with observations (Smith et al., 2004; Jacobi et al., 2017). However, as long as the amplitudes do not increase exponentially, phase gradients also include the effect of amplitude change. Therefore, wavelengths cannot be derived from the shear phases directly, so that the global Es OR will not provide the neutral atmosphere wavelengths, but only deliver a qualitative measure.
The amplitudes of tidal signatures in Es are not only determined by the wind shear, but also depend on the metallic ion concentration and Earth's magnetic field parameters, so that a correlation between Es and wind shear is possible only for a defined region, and for each season separately. Comparing the amplitude distributions on a global scale was possible by dividing the Es amplitudes by the background OR, which will take out most of the seasonal and regional dependencies of Es OR. Indeed, the global structure of the QDT in Es OR and wind shear show strong similarities, which, besides the indication that the wind shear mechanism is actually an important driver for Es formation, gives some confidence in the horizontal structure of the modeled tides also.
The modeled QDT amplitudes are too small in comparison with observations. Although it is an ongoing question that numerical models tend to underestimate tides, at least for some regions or seasons (e.g., Smith, 2012; Pokhotelov et al., 2018), the reasons for this underestimation in MUAM are subject to current investigations. Another issue is the relatively coarse meridional model resolution, which may smooth some details of the meridional structure of the QDT. Future experiments will be performed with higher horizontal resolution.
The MUAM model code can be obtained from the corresponding author on request.
Radio occultation data are freely available from UCAR on http://cdaac-www.cosmic.ucar.edu/cdaac/products.html (UCAR, 2018). Collm radar wind shears are available from the corresponding author on request.
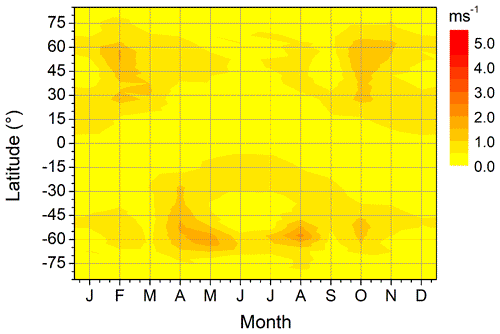
Figures A1–A3 show results of MUAM simulations of the QDT amplitude in zonal wind, similar to Fig. 4, but for different altitudes. Figures A4–A5 show comparisons of global Es QDT amplitude distributions and MUAM QDT zonal wind shear amplitudes, similar to Fig. 7, but for different altitudes.

Figure A4(a) 2007–2016 mean monthly mean QDT Es relative amplitudes at 95 km. (b) MUAM zonal wind shear at the nearest model level at 95.2 km.

Figure A5As in Fig. A4, but showing Es relative amplitudes at 107 km and zonal wind shear at 106.6 km.
CJ performed Collm radar wind measurements and analyses, as well as the tidal analyses based on GPS Es, which had been analyzed by CA. CG designed and performed the MUAM model runs together with FL. CJ drafted the first version of the text.
Christoph Jacobi is one of the editors-in-chief of Annales Geophysicae.
This article is part of the special issue “Vertical coupling in the atmosphere-ionosphere system”. It is a result of the 7th Vertical coupling workshop, Potsdam, Germany, 2–6 July 2018.
The provision of FORMOSAT-3/COSMIC data by the University Corporation for Atmospheric Research is gratefully acknowledged. Christoph Jacobi, Friederike Lilienthal, and Christoph Geißler acknowledge support through the Deutsche Forschungsgemeinschaft (DFG) under grants JA 836∕30-1 and JA 836∕34-1. Christina Arras acknowledges support by DFG Priority Program DynamicEarth, SPP 1788.
This paper was edited by Petra Koucka Knizova and reviewed by two anonymous referees.
Anthes, R. A., Bernhardt, P. A., Chen, Y., Cucurull, L., Dymond, K. F., Ector, D., Healy, S. B., Ho, S.-P., Hunt, D. C., Kuo, Y.-H., Liu, H., Manning, K., McCormick, C., Meehan, T. K., Randel, W. J., Rocken, C., Schreiner, W. S., Sokolovskiy, S. V., Syndergaard, S., Thompson, D. C., Trenberth, K. E., Wee, T.-K., Yen, N. L., and Zeng, Z.: The COSMIC/FORMOSAT-3 Mission: Early Results, B. Am. Meteorol. Soc., 89, 313–334, https://doi.org/10.1175/BAMS-89-3-313, 2008. a
Arras, C. and Wickert, J.: Estimation of ionospheric sporadic E intensities from GPS radio occultation measurements, J. Atmos. Sol.-Terr. Phys., 171, 60–63, https://doi.org/10.1016/j.jastp.2017.08.006, 2018. a, b, c, d
Arras, C., Wickert, J., Beyerle, G., Heise, S., Schmidt, T., and Jacobi, C.: A global climatology of ionospheric irregularities derived from GPS radio occultation, Geophys. Res. Lett., 35, L14809, https://doi.org/10.1029/2008GL034158, 2008. a, b, c, d
Arras, C., Jacobi, C., and Wickert, J.: Semidiurnal tidal signature in sporadic E occurrence rates derived from GPS radio occultation measurements at higher midlatitudes, Ann. Geophys., 27, 2555–2563, https://doi.org/10.5194/angeo-27-2555-2009, 2009. a, b, c, d, e
Arras, C., Jacobi, C., Wickert, J., Heise, S., and Schmidt, T.: Sporadic E signatures revealed from multi-satellite radio occultation measurements, Adv. Radio Sci., 8, 225–230, https://doi.org/10.5194/ars-8-225-2010, 2010. a
Azeem, I., Walterscheid, R. L., Crowley, G., Bishop, R. L., and Christensen, A. B.: Observations of the migrating semidiurnal and quaddiurnal tides from the RAIDS/NIRS instrument, J. Geophys. Res.-Space, 121, 4626–4637, https://doi.org/10.1002/2015JA022240, 2016. a, b
Bishop, R. L. and Earle, G. D.: Metallic ion transport associated with midlatitude intermediate layer development, J. Geophys. Res.-Space, 108, SIA 3-1–SIA 3-8, https://doi.org/10.1029/2002JA009411, 2003. a
Chu, Y. H., Wang, C. Y., Wu, K. H., Chen, K. T., Tzeng, K. J., Su, C. L., Feng, W., and Plane, J. M. C.: Morphology of sporadic E layer retrieved from COSMIC GPS radio occultation measurements: Wind shear theory examination, J. Geophys. Res.-Space, 119, 2117–2136, https://doi.org/10.1002/2013JA019437, 2014. a, b
Ermakova, T. S., Statnaya, I. A., Fedulina, I. N., Suvorova, E. V., and Pogoreltsev, A. I.: Three-dimensional semi-empirical climate model of water vapor distribution and its implementation to the radiation module of the middle and upper atmosphere model, Russ. Meteorol. Hydrol., 42, 594–600, https://doi.org/10.3103/S1068373917090060, 2017. a
Fröhlich, K., Pogoreltsev, A., and Jacobi, C.: The 48 layer COMMA-LIM model: model description, new aspects, and climatology, Rep. Inst. Meteorol. Univ. Leipzig, 161–189, available at: http://nbn-resolving.de/urn:nbn:de:bsz:15-qucosa-217766 (last access: 1 February 2018), 2003a. a, b
Fröhlich, K., Pogoreltsev, A., and Jacobi, C.: Numerical simulation of tides, Rossby and Kelvin waves with the COMMA-LIM model, Adv. Space Res., 32, 863–868, https://doi.org/10.1016/S0273-1177(03)00416-2, 2003b. a, b
Fytterer, T., Arras, C., and Jacobi, C.: Terdiurnal signatures in sporadic E layers at midlatitudes, Adv. Radio Sci., 11, 333–339, https://doi.org/10.5194/ars-11-333-2013, 2013. a, b, c, d
Fytterer, T., Arras, C., Hoffmann, P., and Jacobi, C.: Global distribution of the migrating terdiurnal tide seen in sporadic E occurrence frequencies obtained from GPS radio occultations, Earth Planets Space, 66, 1–9, https://doi.org/10.1186/1880-5981-66-79, 2014. a, b, c, d, e
Guharay, A., Batista, P. P., Buriti, R. A., and Schuch, N. J.: On the variability of the quarter-diurnal tide in the MLT over Brazilian low-latitude stations, Earth Planets Space, 70, 140, https://doi.org/10.1186/s40623-018-0910-9, 2018. a
Hajj, G., Kursinski, E., Romans, L., Bertiger, W., and Leroy, S.: A technical description of atmospheric sounding by GPS occultation, J. Atmos. Sol.-Terr. Phys., 64, 451–469, https://doi.org/10.1016/S1364-6826(01)00114-6, 2002. a, b
Haldoupis, C.: Midlatitude Sporadic E. A Typical Paradigm of Atmosphere-Ionosphere Coupling, Space Sci. Rev., 168, 441–461, https://doi.org/10.1007/s11214-011-9786-8, 2012. a, b
Haldoupis, C., Meek, C., Christakis, N., Pancheva, D., and Bourdillon, A.: Ionogram height-time-intensity observations of descending sporadic E layers at mid-latitude, J. Atmos. Sol.-Terr. Phys., 68, 539–557, https://doi.org/10.1016/j.jastp.2005.03.020, 2006. a
Haldoupis, C., Pancheva, D., Singer, W., Meek, C., and MacDougall, J.: An explanation for the seasonal dependence of midlatitude sporadic E layers, J. Geophys. Res.-Space, 112, A06315, https://doi.org/10.1029/2007JA012322, 2007. a, b
Hocking, W., Fuller, B., and Vandepeer, B.: Real-time determination of meteor-related parameters utilizing modern digital technology, J. Atmos. Sol.-Terr. Phys., 63, 155–169, https://doi.org/10.1016/S1364-6826(00)00138-3, 2001. a
Hupe, P., Ceranna, L., and Pilger, C.: Using barometric time series of the IMS infrasound network for a global analysis of thermally induced atmospheric tides, Atmos. Meas. Tech., 11, 2027–2040, https://doi.org/10.5194/amt-11-2027-2018, 2018. a
Jacobi, C.: 6 year mean prevailing winds and tides measured by VHF meteor radar over Collm (51.3∘ N, 13.0∘ E), J. Atmos. Sol.-Terr. Phys., 78–79, 8–18, https://doi.org/10.1016/j.jastp.2011.04.010, 2012. a, b
Jacobi, C., Fröhlich, K., and Pogoreltsev, A.: Quasi two-day-wave modulation of gravity wave flux and consequences for the planetary wave propagation in a simple circulation model, J. Atmos. Sol.-Terr. Phys., 68, 283–292, https://doi.org/10.1016/j.jastp.2005.01.017, 2006. a, b
Jacobi, C., Krug, A., and Merzlyakov, E.: Radar observations of the quarterdiurnal tide at midlatitudes: Seasonal and long-term variations, J. Atmos. Sol.-Terr. Phys., 163, 70–77, https://doi.org/10.1016/j.jastp.2017.05.014, 2017. a, b, c, d, e, f, g, h
Jacobi, C., Geißler, C., Lilienthal, F., and Krug, A.: Forcing mechanisms of the 6 h tide in the mesosphere/lower thermosphere, Adv. Radio Sci., 16, 141–147, https://doi.org/10.5194/ars-16-141-2018, 2018. a, b
Jakobs, H. J., Bischof, M., Ebel, A., and Speth, P.: Simulation of gravity wave effects under solstice conditions using a 3-D circulation model of the middle atmosphere, J. Atmos. Sol.-Terr. Phys., 48, 1203–1223, https://doi.org/10.1016/0021-9169(86)90040-1, 1986. a
Kursinski, E. R., Hajj, G. A., Schofield, J. T., Linfield, R. P., and Hardy, K. R.: Observing Earth's atmosphere with radio occultation measurements using the Global Positioning System, J. Geophys. Res.-Atmos., 102, 23429–23465, https://doi.org/10.1029/97JD01569, 1997. a
Lilienthal, F. and Jacobi, C.: Meteor radar quasi 2-day wave observations over 10 years at Collm (51.3∘ N, 13.0∘ E), Atmos. Chem. Phys., 15, 9917–9927, https://doi.org/10.5194/acp-15-9917-2015, 2015. a
Lilienthal, F., Jacobi, C., Schmidt, T., de la Torre, A., and Alexander, P.: On the influence of zonal gravity wave distributions on the Southern Hemisphere winter circulation, Ann. Geophys., 35, 785–798, https://doi.org/10.5194/angeo-35-785-2017, 2017. a
Lilienthal, F., Jacobi, C., and Geißler, C.: Forcing mechanisms of the terdiurnal tide, Atmos. Chem. Phys., 18, 15725–15742, https://doi.org/10.5194/acp-18-15725-2018, 2018. a, b
Lindzen, R. S.: Turbulence and stress owing to gravity wave and tidal breakdown, J. Geophys. Res.-Oceans, 86, 9707–9714, https://doi.org/10.1029/JC086iC10p09707, 1981. a
Liu, M., Xu, J., Yue, J., and Jiang, G.: Global structure and seasonal variations of the migrating 6-h tide observed by SABER/TIMED, Sci. China Earth Sci., 58, 1216–1227, https://doi.org/10.1007/s11430-014-5046-6, 2015. a, b, c, d
Liu, R., Lu, D., Yi, F., and Hu, X.: Quadratic nonlinear interactions between atmospheric tides in the mid-latitude winter lower thermosphere, J. Atmos. Sol.-Terr. Phys., 68, 1245–1259, https://doi.org/10.1016/j.jastp.2006.03.004, 2006. a
Liu, Y., Zhou, C., Tang, Q., Li, Z., Song, Y., Qing, H., Ni, B., and Zhao, Z.: The seasonal distribution of sporadic E layers observed from radio occultation measurements and its relation with wind shear measured by TIMED/TIDI, Adv. Space Res., 62, 426–439, https://doi.org/10.1016/j.asr.2018.04.026, 2018. a
Mathews, J.: Sporadic E: current views and recent progress, J. Atmos. Sol.-Terr. Phys., 60, 413–435, https://doi.org/10.1016/S1364-6826(97)00043-6, 1998. a
Morton, Y. T., Mathews, J., and Zhou, Q.: Further evidence for a 6-h tide above Arecibo, J. Atmos. Terr. Phys., 55, 459–465, https://doi.org/10.1016/0021-9169(93)90081-9, 1993. a
NOAA ESRL Global Monitoring Division: Atmospheric Carbon Dioxide Dry Air Mole Fractions from quasi-continuous measurements at Mauna Loa, Hawaii, National Oceanic and Atmospheric Administration (NOAA), Earth System Research Laboratory (ESRL), Global Monitoring Division (GMD): Boulder, Colorado, USA, compiled by: Thoning, K. W., Kitzis, D. R., and Crotwell, A., Version 2015-12, updated annually, 2018. a
Oikonomou, C., Haralambous, H., Haldoupis, C., and Meek, C.: Sporadic E tidal variabilities and characteristics observed with the Cyprus Digisonde, J. Atmos. Sol.-Terr. Phys., 119, 173–183, https://doi.org/10.1016/j.jastp.2014.07.014, 2014. a, b
Pogoreltsev, A. I.: Generation of normal atmospheric modes by stratospheric vacillations, Izv. Atmos. Ocean. Phys., 43, 423–435, https://doi.org/10.1134/S0001433807040044, 2007. a
Pogoreltsev, A. I., Vlasov, A. A., Fröhlich, K., and Jacobi, C.: Planetary waves in coupling the lower and upper atmosphere, J. Atmos. Sol.-Terr. Phys., 69, 2083–2101, https://doi.org/10.1016/j.jastp.2007.05.014, 2007. a
Pokhotelov, D., Becker, E., Stober, G., and Chau, J. L.: Seasonal variability of atmospheric tides in the mesosphere and lower thermosphere: meteor radar data and simulations, Ann. Geophys., 36, 825–830, https://doi.org/10.5194/angeo-36-825-2018, 2018. a
Randel, W. J. and Wu, F.: A stratospheric ozone profile data set for 1979–2005: Variability, trends, and comparisons with column ozone data, J. Geophys. Res.-Atmos., 112, D06313, https://doi.org/10.1029/2006JD007339, 2007. a
Resende, L. C. A., Arras, C., Batista, I. S., Denardini, C. M., Bertollotto, T. O., and Moro, J.: Study of sporadic E layers based on GPS radio occultation measurements and digisonde data over the Brazilian region, Ann. Geophys., 36, 587–593, https://doi.org/10.5194/angeo-36-587-2018, 2018a. a
Resende, L. C. A., Batista, I. S., Denardini, C. M., Batista, P. P., Carrasco, A. J., Andrioli, V. F., and Moro, J.: The influence of tidal winds in the formation of blanketing sporadic e-layer over equatorial Brazilian region, J. Atmos. Sol.-Terr. Phys., 171, 64–71, https://doi.org/10.1016/j.jastp.2017.06.009, 2018b. a
Riese, M., Offermann, D., and Brasseur, G.: Energy released by recombination of atomic oxygen and related species at mesopause heights, J. Geophys. Res.-Atmos., 99, 14585–14593, https://doi.org/10.1029/94JD00356, 1994. a
Shinagawa, H., Miyoshi, Y., Jin, H., and Fujiwara, H.: Global distribution of neutral wind shear associated with sporadic E layers derived from GAIA, J. Geophys. Res.-Space, 122, 4450–4465, https://doi.org/10.1002/2016JA023778, 2017. a
Smith, A. K.: Global Dynamics of the MLT, Surv. Geophys., 33, 1177–1230, https://doi.org/10.1007/s10712-012-9196-9, 2012. a
Smith, A. K., Pancheva, D. V., and Mitchell, N. J.: Observations and modeling of the 6-hour tide in the upper mesosphere, J. Geophys. Res.-Atmos., 109, D10105, https://doi.org/10.1029/2003JD004421, 2004. a, b, c, d, e, f
Stober, G., Jacobi, C., Fröhlich, K., and Oberheide, J.: Meteor radar temperatures over Collm (51.3∘ N, 13∘ E), Adv. Space Res., 42, 1253–1258, https://doi.org/10.1016/j.asr.2007.10.018, 2008. a
Stober, G., Jacobi, C., Matthias, V., Hoffmann, P., and Gerding, M.: Neutral air density variations during strong planetary wave activity in the mesopause region derived from meteor radar observations, J. Atmos. Sol.-Terr. Phys., 74, 55–63, https://doi.org/10.1016/j.jastp.2011.10.007, 2012. a
Stober, G., Matthias, V., Jacobi, C., Wilhelm, S., Höffner, J., and Chau, J. L.: Exceptionally strong summer-like zonal wind reversal in the upper mesosphere during winter 2015/16, Ann. Geophys., 35, 711–720, https://doi.org/10.5194/angeo-35-711-2017, 2017. a
Strobel, D. F.: Parameterization of the atmospheric heating rate from 15 to 120 km due to O2 and O3 absorption of solar radiation, J. Geophys. Res.-Oceans, 83, 6225–6230, https://doi.org/10.1029/JC083iC12p06225, 1978. a
Suvorova, E. V. and Pogoreltsev, A. I.: Modeling of nonmigrating tides in the middle atmosphere, Geomagn. Aeronomy, 51, 105–115, https://doi.org/10.1134/S0016793210061039, 2011. a
Tong, Y., Mathews, J. D., and Ying, W. P.: An upper E region quarterdiurnal tide at Arecibo?, J. Geophys. Res.-Space, 93, 10047–10051, https://doi.org/10.1029/JA093iA09p10047, 1988. a
UCAR: http://cdaac-www.cosmic.ucar.edu/cdaac/products.html, last access: 26 September 2018. a
Warburton, R. J. and Goodkind, J. M.: The influence of barometric-pressure variations on gravity, Geophys. J. Int., 48, 281–292, https://doi.org/10.1111/j.1365-246X.1977.tb03672.x, 1977. a
Whitehead, J.: The formation of the sporadic-E layer in the temperate zones, J. Atmos. Terr. Phys., 20, 49–58, https://doi.org/10.1016/0021-9169(61)90097-6, 1961. a
Xu, J., Smith, A. K., Jiang, G., Yuan, W., and Gao, H.: Features of the seasonal variation of the semidiurnal, terdiurnal and 6-h components of ozone heating evaluated from Aura/MLS observations, Ann. Geophys., 30, 259–281, https://doi.org/10.5194/angeo-30-259-2012, 2012. a
Xu, J., Smith, A. K., Liu, M., Liu, X., Gao, H., Jiang, G., and Yuan, W.: Evidence for nonmigrating tides produced by the interaction between tides and stationary planetary waves in the stratosphere and lower mesosphere, J. Geophys. Res.-Atmos., 119, 471–489, https://doi.org/10.1002/2013JD020150, 2014. a
Yiǧit, E. and Medvedev, A. S.: Internal wave coupling processes in Earth's atmosphere, Adv. Space Res., 55, 983–1003, https://doi.org/10.1016/j.asr.2014.11.020, 2015. a
Yiǧit, E., Aylward, A., and Medvedev, A.: Parameterization of the effects of vertically propagating gravity waves for thermosphere general circulation models: Sensitivity study, J. Geophys. Res.-Atmos., 113, D19106, https://doi.org/10.1029/2008JD010135, 2008. a
Yiǧit, E., Medvedev, A. S., Aylward, A. D., Hartogh, P., and Harris, M. J.: Modeling the effects of gravity wave momentum deposition on the general circulation above the turbopause, J. Geophys. Res.-Atmos., 114, D07101, https://doi.org/10.1029/2008JD011132, 2009. a
- Abstract
- Introduction
- Dataset and model description
- Results
- Conclusions
- Code availability
- Data availability
- Appendix A: Modeled QDT amplitudes, wind shear amplitudes, and global Es distribution at different altitudes
- Author contributions
- Competing interests
- Special issue statement
- Acknowledgements
- Review statement
- References


