the Creative Commons Attribution 4.0 License.
the Creative Commons Attribution 4.0 License.
Estimating satellite and receiver differential code bias using a relative Global Positioning System network
Alaa A. Elghazouly
Mohamed I. Doma
Ahmed A. Sedeek
Precise total electron content (TEC) is required to produce accurate spatial and temporal resolution of global ionosphere maps (GIMs). Receivers and satellite differential code biases (DCBs) are one of the main error sources in estimating precise TEC from Global Positioning System (GPS) data. Recently, researchers have been interested in developing models and algorithms to compute DCBs of receivers and satellites close to those computed from the Ionosphere Associated Analysis Centers (IAACs). Here we introduce a MATLAB code called Multi Station DCB Estimation (MSDCBE) to calculate satellite and receiver DCBs from GPS data. MSDCBE based on a spherical harmonic function and a geometry-free combination of GPS carrier-phase, pseudo-range code observations, and weighted least squares was applied to solve observation equations and to improve estimation of DCB values. There are many factors affecting the estimated values of DCBs. The first one is the observation weighting function which depends on the satellite elevation angle. The second factor is concerned with estimating DCBs using a single GPS station using the Zero Difference DCB Estimation (ZDDCBE) code or using the GPS network used by the MSDCBE code. The third factor is the number of GPS receivers in the network. Results from MSDCBE were evaluated and compared with data from IAACs and other codes like M_DCB and ZDDCBE. The results of weighted (MSDCBE) least squares show an improvement for estimated DCBs, where mean differences from the Center for Orbit Determination in Europe (CODE) (University of Bern, Switzerland) are less than 0.746 ns. DCBs estimated from the GPS network show better agreement with IAAC than DCBs estimated from precise point positioning (PPP), where the mean differences are less than 0.1477 and 1.1866 ns, respectively. The mean differences of computed DCBs improved by increasing the number of GPS stations in the network.
- Article
(775 KB) - Full-text XML
- BibTeX
- EndNote
Total electron content (TEC) is an important parameter in the study of ionospheric dynamics, structures, and variabilities. The ionosphere is a dispersive medium for space geodetic techniques operating in the microwave band (Böhm and Schuh, 2013) that allows calculation of TEC using Global Positioning System (GPS) dual-frequency radio transmissions. The global availability of GPS has made it a valuable tool for monitoring regional and global Earth ionospheric activity (Hernández-Pajares et al., 1999; Komjathy et al., 2005; Li et al., 2015; Liu and Gao, 2004; Mannucci et al., 1993). Unfortunately, GPS-derived TEC measurements are adversely affected by an inherent inter-frequency bias within the receiver and satellite hardware, typically referred to as the differential code biases (DCBs). Careful estimation of the DCBs is required to obtain accurate TEC, which is used in several applications, such as in several ionospheric prediction models, and in the correction of GPS positioning measurements (McCaffrey et al., 2017). A number of methods have been proposed for the estimation of GPS receiver DCBs, each with varying requirements and limitations, including making assumptions about the ionospheric structure, the use of internal calibration (Arikan et al., 2008; Themens et al., 2013, 2015), or the use of a reference instrument or model. Estimating DCBs for receivers and satellites from GPS observations depends on two approaches, the relative and absolute methods. The relative method utilizes a GPS network, while the absolute method determines DCBs from a single station (Sedeek et al., 2017). In the current study, we applied a relative method to calculate DCBs of satellites and GPS receivers.
There has also been growing interest in measuring the accuracy of these methods and how different factors, e.g., ionospheric activity, play a role in these methods (McCaffrey et al., 2017). Nowadays, reliable GIMs and accurate DCBs of satellites and the International GNSS Service (IGS) stations can be obtained from IAACs like CODE (Schaer, 1999), the European Space Agency (ESA, Germany) (Feltens and Schaer, 1998), the Jet Propulsion Laboratory (JPL, USA) (Mannucci et al., 1998), and UPC (Technical University of Catalonia, Spain) (Hernández-Pajares et al., 1999; Orús et al., 2005). However, the IAAC DCB receivers' values are only available for IGS stations. Furthermore, some of the IGS ground receivers' DCB estimates are not available from all analysis centers. Also, some regions do not have any IGS ground stations, like our country Egypt, which means the TEC values over them would be interpolated from the nearest calculated values. As TEC values are dependent on DCB values, a mathematical model is required to calculate DCBs from GPS data.
In this study we introduce a mathematical model estimating satellites and receiver DCBs for a GPS network based on a spherical harmonic function (SHF) written under the MATLAB environment; the developed mathematical model uses a geometry-free combination of pseudo-range observables (P code). Weighted least squares were used to consider variation of the satellite elevation angle. The code was evaluated and compared with other researchers' codes in the “Results and analysis” section. In the “Conclusion” section we summarize the overall paper results.
For a GPS satellite, the pseudo-range and carrier-phase observations between a receiver and a satellite can be expressed as (Jin et al., 2008; Leandro, 2009; Leick et al., 2015; Zhang et al., 2018)
with r, s, j, and i the receiver, satellite, frequency, and epoch indices, and where are pseudo-range measurements, in meters, carrier-phase measurements, in meters, the geometric distance between satellite and receiver antennas, in meters, c the speed of light, in meters per second, dtr and dts receiver and satellite clock errors, respectively, in seconds, the neutral troposphere delay, in meters, and the ionosphere delay of pseudo-range and carrier-phase observations, in meters, Nj carrier-phase integer ambiguities, in cycles, λj carrier-phase wavelength, in meters, and receiver and satellite pseudo-range hardware delays, respectively, in metric units, and DCB receiver and satellite carrier-phase hardware delays, respectively, in metric units, Mj the pseudo-range multipath, in meters, Ej other un-modeled errors of pseudo-range measurements, in meters, pbr,i and pbs,i receiver and satellite carrier-phase initial phase bias, respectively, in metric units, mj the carrier-phase multipath, in meters, and ej other un-modeled errors of carrier-phase measurements, in meters.
Here, we consider a measurement scenario where one GPS receiver tracks dual-frequency code and phase data from a total of m satellites over t epochs, thereby implying that r=1, s=1, … m, j=1, 2, and i=1, …, t.
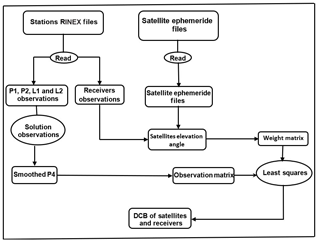
Firstly, the code read the RINEX files and extracted the pseudo-range and carrier-phase observations which are the range distances between the receivers and satellites measured using L1 and L2 frequencies. The “geometry-free” linear combination of GPS observations is used to derive the observation equations. The geometric range, clock offsets, and tropospheric delay are frequency independent and can be eliminated using this combination. The “geometry-free” linear combinations for pseudo-range and carrier-phase observations are given as (Al-Fanek, 2013)
is the combination of multipath and measurement noise on and (m), and is the combination of multipath and measurement noise on and (m).
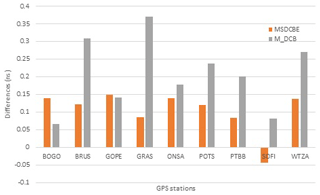
Figure 3Mean difference between the receiver DCB values of CODE and the computed values by each of MSDCBE and M_DCB estimated from 1 to 31 January 2010.
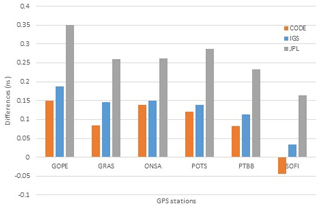
Figure 4Mean differences between receiver DCB values estimated by MSDCBE and those released by CODE, JPL, and IGS combined from 1 to 31 January 2010.
To reduce the multipath and noise level in the pseudo-range observables, the carrier-phase measurements are used to compute a more precise relative smoothed range. Although the carrier-phase observables are more precise than the code derived, they are ambiguous due to the presence of integer-phase ambiguities in the carrier-phase measurements. To take advantage of the low-noise carrier-phase-derived and unambiguous nature of the pseudo range, both measurements are combined to collect the best of both observations.
Smoothed P4,sm observations can be expressed as follows (Jin et al., 2012):
where t stands for the epoch number and ωt is the weight factor related to epoch t, and
when t is equal to 1, which means the first epoch of one observation arc, and P4,sm is equal to P4.
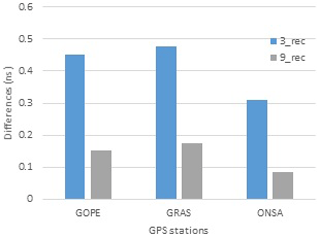
Figure 5Mean difference between the receiver DCB values of the IGS and the computed values by MSDCBE estimated from 1 to 5 January 2010.
To determine the receiver DCB, there are two different methods. The first one is to calibrate the receiver device and obtain the DCB directly. This method calculates the DCB of the receiver device, ignoring that from the antenna cabling used during observation (Hansen, 2002). The second method calculates the receiver DCB as a part of the GPS signal time delay which is independent of the type of antenna. MSDCBE code works like the second method (Fig. 1).
The ionosphere delay can be expressed as follows (Abid et al., 2016):
where f stands for the frequency of the carrier and slant total electron content (STEC) is the total electron content along the path of the signal. The observation equation can be formed by substituting Eq. (7) into Eq. (3) and replacing P4 by smoothed P4,sm; we get (Abid et al., 2016)
where c is the speed of light and DCBr and DCBs are differential code biases for receivers and satellites in seconds.
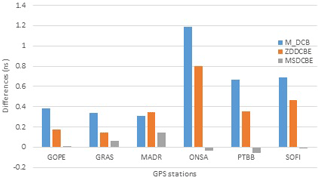
Figure 7Mean difference between the receiver DCB values of the IGS and the computed values by each of M_DCB, ZDDCBE, and MSDCBE estimated from 1 to 5 January 2010.
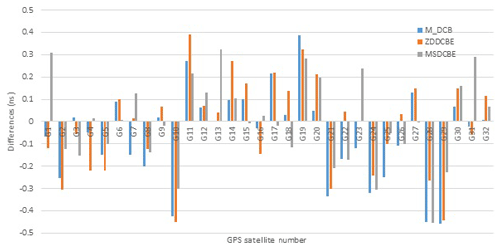
Figure 8Mean difference between the satellite DCB values of the IGS and the computed values by M_DCB, ZDDCBE, and MSDCBE estimated from 1 to 5 January 2010.
STEC can be translated into vertical total electron content (VTEC) using the modified single-layer model (MSLM) (Haines, 1985; Jin et al., 2012):
where MF is the mapping function, z is the satellite elevation angle, R is the radius of the Earth (6371 km), H is the attitude of the ionosphere thin shell (assumed as used by CODE = 506.7 km), and α=0.9782 (Jin et al., 2012).
To estimate the satellite and receiver HDs, the current study applies a model based on a spherical harmonic function to calculate them using zero-difference observations. The used model is expressed as follows (Schaer, 1999; Li et al., 2015; Elghazouly et al., 2019):
where β is the geocentric latitude of IPPs (ionosphere Pierce points), s is the solar fixed longitude of IPPs, N is the degree of the spherical function, and M is the order of the spherical harmonic function; fourth order is used. Pmn is the regularization Legendre series and Amn and Bmn are the estimated spherical harmonics coefficients.
By substituting Eqs. (8), (10), and (11) into Eq. (9), we get
Only one GPS station has more than 20 000 observations per day. When applying Eq. (12) using station observation data, the number of equations is much more than the number of unknown coefficients. These coefficients were determined using the weighted least squares method. The general form of the weighted least square function can be expressed as (Ghilani and Wolf, 2012)
where X is the unknown parameter vector, namely , , DCBr, and DCBs, A is the coefficient (design) matrix (coefficients of , , DCBr, and DCBs), L is the observation vector (values of P4,sm), and P is the weight matrix.
As is known, the quality of observations is affected by satellite elevation angle, and each observation has a weight value dependent on its satellite elevation angle. The weight value can be computed from the following Eqs. (14), (15), and (16) (Luo, 2013):
where f and d are two constants equal to 5 and 2 cm, respectively (Ray and Griffiths, 2008).
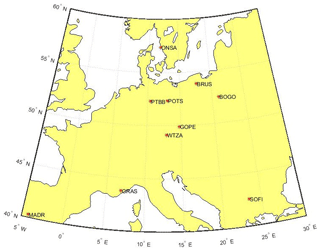
The MSDCBE software was written in MATLAB (version 2016a). The first input is GPS observations in Receiver Independent Exchange (RINEX) format according to the selected stations (Fig. 2) downloaded from ftp://garner.ucsd.edu/rinex (last access: 8 August 2018) and precise ephemeride (SP3) files of test days downloaded from http://www.GPScalendar.com/index.html?year=2010 (last access: 8 August 2018). In addition, IONosphere Map EXchange Format (IONEX) files of the IGS, CODE, and JPL are downloaded – as threshold values – from ftp://cddis.gsfc.nasa.gov/GPS/products/ionex/ (last access: 8 August 2018).
In the present contribution, to evaluate the performance of the developed model, numerical case studies were performed. The main goals of the numerical case studies are to investigate three issues.
The first issue is to investigate the effect of applying weighted least squares instead of least squares on satellites and GPS receiver DCBs, and this is done by comparing results from MSDCBE which apply weighted least squares with the published results of M_DCB by Jin et al. (2012) and with those of IAAC.
BOGO, BRUS, GOPE, GRAS, ONSA, POTS, PTBB, SOFI, and WTZA IGS station data from 1 to 31 January 2010 were applied as it was the same network used by Jin et al. (2012).
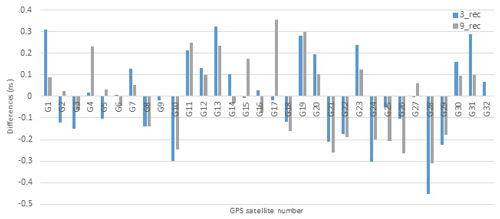
The second issue is to investigate the correlation between the size (number of receivers) of the GPS network and estimated DCBs for satellite and GPS receivers, and this is done by comparing DCB values of three stations, namely GOPE, GRAS, and ONSA, estimated from a network consisting of a 3 GPS receiver and a network consisting of a 9 GPS receiver.
This study was applied using IGS station data from 1 to 5 January 2010 of six stations, namely BOGO, BRUS, GOPE, GRAS, ONSA, POTS, PTBB, SOFI, and WTZA.
The third issue is to investigate the congruence of DCBs estimated from absolute and relative methods with other IAAC, and this is done by comparing results from MSDCBE with the published results of ZDDCBE by Sedeek et al. (2017).
This study was applied using data from 1 to 5 January 2010 of six stations, namely GOPE, GRAS, ONSA, MADR, PTBB, and SOFI, which was the same network used by Jin et al. (2012) and Sedeek et al. (2017).
4.1 Comparison of multi-station test results from MSDCBE and M_DCB
The first evaluation made by this paper is the evaluation of a weight function. MSDCBE used a weight function depending on the satellite elevation angle as mentioned before. Table 1 shows the differences and rms between satellites and receivers estimated from 1 to 31 January 2010 using multiple GPS stations of both MSDCBE (weighted) and M_DCB (unweighted).
Table 1The differences and rms between satellites and receivers estimated from 1 to 31 January 2010 using multiple GPS stations (MSDCBE and M_DCB minus CODE).
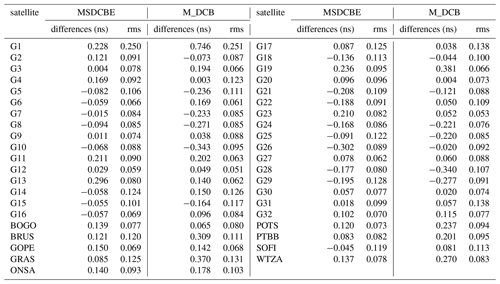
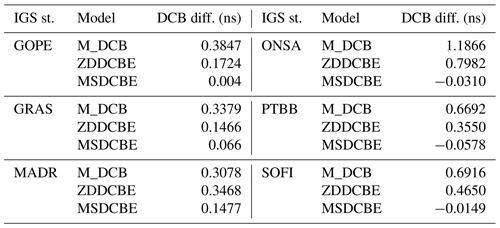
Table 2Mean difference between the receiver DCB values computed by the IGS and the computed values by using single-station M_DCB, ZDDCBE, and multi-station MSDCBE estimated from 1 to 5 January 2010.
From the table one can see that the differences of MSDCBE-estimated satellite DCBs are less than 0.302 ns and the rms of all satellite DCB differences is less than 0.128, except G1, whose rms = 0.250. The maximum difference of MSDCBE-estimated receiver DCBs is 0.150 ns of receiver GOPE and the minimum is 0.045 ns of receiver SOFI (Fig. 3). The maximum rms of MSDCBE-estimated receiver DCBs is 0.125. On the other hand, M_DCB results show that receiver DCB biases are slightly larger than those for satellites, but most of them are less than 0.4 ns, except G1, whose DCB bias reaches 0.746 ns. The rms of all differences is lower than 0.3 ns (Jin et al., 2012). Figure 4 shows the mean differences between receiver DCB values estimated by MSDCBE and those released by CODE, IGS, and JPL combined from 1 to 31 January 2010. The figure shows that the results of MSDCBE are mostly closer to those of CODE than IGS and JPL. By comparing Fig. 4 with the corresponding chart published by Jin et al. (2012), it is clear that all differences between MSDCBE receivers' DCB results and between CODE, IGS, and JPL are less than those from M_DCB, except station GOPE, which is almost equal.
4.2 Effect of network size factor on DCB estimation
By using multi-station DCB estimation, the number of stations used will appear as a factor influencing DCB estimation. This test was done by comparing DCBs computed by MSDCBE of a network of three receivers, namely GOPE, GRAS, ONSA, and DCBs of the same receivers, but this time as a part of a network of nine receivers, namely BOGO, BRUS, GOPE, GRAS, ONSA, PTBB, SOFI, and WTZA. Figure 5 shows these results which demonstrate that using nine receivers gives more accurate DCBs. Also, the satellite DCB differences (Fig. 6) almost improved, but not like receiver DCBs, because satellite DCBs are small values compared with those of receivers.
4.3 Comparison of multi station from MSDCBE and single station from ZDDCBE and M_DCB test results
In this section the performance of a multi-station network against single-station DCB estimation will be evaluated. Table 2 shows the mean difference between the receiver DCB values computed by IGS and the computed values by each of M_DCB, ZDDCBE, and MSDCBE estimated from 1 to 5 January 2010. Figure 7 shows these results graphically and Fig. 8 shows the mean differences computed from M_DCB, ZDDCBE, and MSDCBE for GPS satellites. The results show a significant difference between multi-station network and single-station DCB estimation. The maximum difference between receiver DCB estimation using IGS and MSDCBE is 0.1477 ns of the MADR station, but it is 1.1866 and 0.7982 ns for M_DCB and ZDDCBE, respectively.
The current study proposes a new MATLAB code called MSDCBE able to calculate DCBs of GPS satellites and receivers. This code was compared with two other codes and evaluated using IAAC data and, from all the above, we can conclude the following.
-
The estimated DCB results are affected by using a weight function according to satellite elevation angle observations. In addition, results show good agreement with IGS, CODE, and JPL results than using multi-station estimation DCB without a weight function.
-
When using multi-station DCB estimation, the number of input stations influences the DCB results. However, it is recommended to enlarge the size of the used network, but it needs high computer requirements and much more analysis time (only one station has more than 20 000 observations per a day).
-
The most effective factor in DCB estimation is using a multi-station network instead of a single station that appeared from results which improved from 1.1866 and 0.7982 ns maximum DCB mean differences for M_DCB and ZDDCBE single-station analysis to 0.1477 ns for MSDCBE. So, using multi-station network DCB estimation – if available – is strongly recommended.
The IGS stations data can be downloaded from ftp://garner.ucsd.edu/rinex, last access: 8 August 2018 (Scripps Orbit and Permanent Array Center (SOPAC) and California Spatial Reference Center (CSRC), garner GPS archive).
All the authors participated in the development of the used code. Alaa Elghazouly carried out most of the analysis and prepared the paper. All the co-authors helped in the interpretation of the results, read the paper, and commented on it.
The authors declare that they have no conflict of interest.
This article is part of the special issue “Vertical coupling in the atmosphere-ionosphere system”. It is a result of the 7th Vertical coupling workshop, Potsdam, Germany, 2–6 July 2018.
This paper was edited by Christina Arras and reviewed by four anonymous referees.
Abid, M., Mousa, A., Rabah, M., El Mewafi, M., and Awad, A.: Temporal and spatial variation of differential code biases: A case study of regional network in Egypt, Alexandria Engineering Journal, 55, 1507–1514, 2016.
Al-Fanek, O.: Ionospheric Imaging for Canadian Polar Regions, PhD thesis, Calgary, Alberta, 47–50, 2013.
Arikan, F., Nayir, H., Sezen, U., and Arikan, O.: Estimation of single station interfrequency interfrequency receiver bias using GPS-TEC, Radio Sci., 43, 1–2, https://doi.org/10.1029/2007rs003785, 2008.
Böhm, J. and Schuh, H.: Atmospheric Effects in Space Geodesy, Springer Atmospheric Sciences, eBook ISBN: 978-3-642-36932-2, 2013.
Elghazouly, A., Doma, M., Sedeek, A., Rabah, M., and Hamama, M.: Validation of Global TEC Mapping Model Based on Spherical Harmonic Expansion towards TEC Mapping over Egypt from a Regional GPS Network, Am. J. Geogr. Inform. Syst., 8, 89–95, 2019.
Feltens, J. and Schaer, S.: IGS Products for the Ionosphere, Proceedings of the 1998 IGS Analysis Center Workshop Darmstadt, Germany, 3–5, 1998.
Ghilani, C. and Wolf, P.: Elementary surveying: an introduction to geomatics, 13th Edn., 428–429, 2012.
Haines, G.: Spherical cap harmonic analysis, J. Geophys. Res.-Sol. Ea., 90, 2583e91, https://doi.org/10.1029/JB090iB03p02583, 1985.
Hansen, A.: Tomographic Estimation of the Ionosphere Using GPS Sensors, PhD Thesis, Department of Electrical Engineering, Stanford University, CA, 2002.
Hernández-Pajares, M., Juan, J., and Sanz, J.: New approaches in global ionospheric determination using ground GPS data, Atmos. Sol.-Terr. Phys., 61, 1237–1247, 1999.
Jin, R., Jin, S., and Feng, G.: M_DCB: MATLAB code for estimating GPS satellite and receiver differential code biases, GPS Solution, 16, 541–548, 2012.
Jin, S., Luo, O., and Park, P.: GPS observations of the ionospheric F2-layer behavior during the 20th November 2003 geomagnetic storm over South Korea, J. Geodesy, 82, 883–892, 2008.
Komjathy, A., Sparks, L., Wilson, B. D., and Mannucci, A. J.: Automated daily processing of more than 1000 ground-based GPS receivers for studying intense ionospheric storms, Radio Sci., 40, RS6006, https://doi.org/10.1029/2005RS003279, 2005.
Leandro, R.: Precise Point Positioning with GPS: A New Approach for Positioning, Atmospheric Studies, and Signal Analysis, Ph.D. dissertation, Department of Geodesy and Geomatics Engineering, Technical Report No. 267, University of New Brunswick, Fredericton, New Brunswick, Canada, 232 pp., 2009.
Leick, A., Rapoport, L., and Tatarnikov, D.: GPS satellite surveying, Wiley, New York, 261–265, 2015.
Li, Z., Yuan, Y., Wang, N., Hernandez-Pajares, M., and Huo, X.: SHPTS: towards a new method for generating precise global ionospheric TEC map based on spherical harmonic and generalized trigonometric series functions, J. Geodesy, 89, 331–345, 2015.
Liu, Z. and Gao, Y.: Ionospheric TEC predictions over a local area GPS reference network, GPS Solut, 8, 23–29, 2004.
Luo, X.: GPS Stochastic Modelling: Signal Quality Measures and ARMA Processes, PhD thesis, the Karlsruhe Institute of Technology, Karlsruhe, Germany, 84–86, 2013.
Mannucci, A. J., Wilson, B. D., and Edwards, C. D.: A new method for monitoring the Earth's ionospheric total electron content using the GPS global network. In: Proceedings of ION GPS-93, the 6th international technical meeting of the satellite division of The Institute of Navigation, Salt Lake City, UT, 22–24 September 1993, 1323–1332, 1993.
Mannucci, A., Wilson, B., Yuan, D., Ho, C., Lindqwister, U., and Runge, T.: Global mapping technique for GPS-derived ionospheric total electron content measurements, Radio Sci., 33, 565–582, 1998.
McCaffrey, A., Jayachandran, P., Themens, D., and Langley, R.: GPS receiver code bias estimation: A comparison of two methods,Elsevier, Adv. Space Res., 59, 1984–1991, 2017.
Orús, R., Hernández-Pajares, M., Juan, J., and Sanz, J.: Improvement of global ionospheric VTEC maps by using kriging interpolation technique, J. Atmos. Sol.-Terr. Phys., 67, 1598–1609, 2005.
Ray, J., and Griffiths, J.: Overview of IGS products and analysis center modeling. Paper preseted at the IGS Analysis Center Workshop 2008, Miami Beach, FL, 2–6 June, 2008.
Schaer, S.: Mapping and predicting the earth's ionosphere using global positioning system, Ph.D. dissertation, Astronomy Institute, University Bern, Switzerland, 205 pp., 1999.
Sedeek, A., Doma, M., Rabah, M., and Hamama, M.: Determination of zero difference GPS differential code biases for satellites and prominent receiver types, Arab. J. Geosci., 10, 7–9, https://doi.org/10.1007/s12517-017-2835-1, 2017.
SOPAC and CSRC: Garner GPS archive, ftp://garner.ucsd.edu/rinex, last acess: 8 August 2019.
Themens, D. R., Jayachandran, P. T., Langley, R. B., MacDougall, J. W., and Nicolls, M. J.: Determining receiver biases in GPS-derived total electron content in the auroral oval and polar cap region using ionosonde measurements, GPS Solut., 17, 357–369, https://doi.org/10.1007/s10291-012-0284-6, 2013.
Themens, D. R., Jayachandan, P. T., and Langley, R. B.: The nature of GPS differential receiver bias variability: An examination in the polar cap region, J. Geophys. Res.-Space, 120, 8155–8175, https://doi.org/10.1002/2015ja021639, 2015.
Zhang, B., Peter, J. G., Teunessen, Y., Hongxing, Z., and Min, L.: Joint estimation of vertical total electron content (VTEC) and satellite differential code biases (SDCBs) using low-cost receivers, J. Geodesy, 92, 401–413, 2018.


