the Creative Commons Attribution 4.0 License.
the Creative Commons Attribution 4.0 License.
 | 20 Jun 2018
Differentiating diffuse auroras based on phenomenology
Eric Donovan
There is mounting evidence which suggests that pulsating auroral patches often move with convection. This study is an initial step at identifying the differences between patches that move with convection and those that do not. While many properties of pulsating patches vary, here we outline criteria for separating pulsating auroral patches into three categories based on two properties: their structural stability and the spatial extent of their pulsations. Patchy aurora is characterized by stable structures whose pulsations are limited to small regions. Patchy pulsating aurora consists of stable patches whose pulsations are far less subtle and occur throughout much of their area. Amorphous pulsating auroral structures are unstable – very rapidly evolving – and can pulsate over their entire area. The speed with which amorphous pulsating aurora evolves makes their motion difficult to ascertain and seems unrelated to the E×B drifting of cold, equatorial plasma.
- Article
(12084 KB) - Full-text XML
- BibTeX
- EndNote


The immediate cause of aurora is the precipitation of electrons and protons into the atmosphere. These charged particles collide with atmospheric particles and energize them, whereupon they may spontaneously emit a photon. One basis upon which aurora can be categorized is the mechanism that drives electrons and protons to enter the atmosphere and produce aurora. Discrete aurora describes the loss of magnetically bounce-trapped particles into the atmosphere due to electric fields parallel to the magnetospheric magnetic field. Diffuse aurora is created through particle loss driven by the pitch-angle scattering of magnetically bounce-trapped electrons and protons.

Figure 1(a) An example of a stable pulsating auroral patch as described by Royrvik and Davis (1977). The images of this patch were captured during the minute of 13:26 UT on 28 December 2005 from Whitehorse THEMIS ASI. (b) An example of a streaming pulsating auroral patch as described by Royrvik and Davis (1977). The images of this patch were captured during the minute of 07:34 UT on 2 March 2011 from Athabasca THEMIS ASI. Streaming describes how the area of a patch can grow or shrink while switching between bright and dim states.
Pulsating aurora is a type of diffuse aurora which is characterized by quasi-periodic transitions between bright and dim states typically recurring on the order of 10 s whose precipitating electrons have energies ranging from a few keV to hundreds of keV (Johnstone, 1978). This type of aurora is widely believed to arise from cyclotron resonance between plasma waves and equatorial electrons (Coroniti and Kennel, 1970; Davidson, 1990; Miyoshi et al., 2010); however, the details of this process are currently an open area of research. Nishimura et al. (2010, 2011) presented simultaneous observations of auroral luminosity from all-sky imager (ASI) data and chorus wave amplitude measurements from spacecraft that demonstrated a nearly one-to-one correspondence. This work confirmed the long-held belief that electrons with energies on the order of 100 eV–10 keV are able to resonate with electron cyclotron harmonic (ECH) and whistler mode chorus waves.
Individual pulsating auroral structures can vary in shape, size, altitude, spatial stability, temporal modulation, lifespan, and velocity. An extensive survey of pulsating aurora by Royrvik and Davis (1977) established three general morphologies: east–west aligned arcs, quasi-linear elements, and patches. Pulsating auroral patches are the most common form of this aurora.
Pulsating aurora is most commonly seen in the morning sector auroral oval and persists for 1.5 h on average (Jones et al., 2011), but has been observed to last upwards of 15 h (Jones et al., 2013). The lifetime and size of pulsating auroral forms are known to vary substantially. Lifetimes can span a single pulse that lasts for only a few seconds or persist for tens of minutes. The pulsating auroral arc is on the order of 1–10 km wide and 1000 km long; the quasi-linear form has width on the same order as the arc but length on the order of 100 km. Pulsating patches tend to be 10–200 km across (Royrvik and Davis, 1977) and have a constantly evolving shape (Shiokawa et al., 2010).
Pulsating auroral patches appear to be controlled by structures in the near-equatorial cold plasma (Rae, 2014) whose motion is almost entirely determined by E×B drifting. Consequently, these patches appear to move with ionospheric convection and could be used to create automatically generated two-dimensional maps of convection (Grono et al., 2017; Yang et al., 2015).
At least two types of pulsating auroral patches have been discussed in the past: Royrvik and Davis (1977) subcategorized patches based on a property they referred to as “stability”. The stability of a pulsating auroral form is assessed based on whether the area of the pulsating aurora changes while switching between bright and dim states. Royrvik and Davis (1977) use the term stable to describe structures whose area remains constant while switching between states (Fig. 1a), and streaming to describe those whose area changes (Fig. 1b). This property is dependent on the cadence of the camera and it is likely that all patches exhibit some amount of streaming while pulsating.
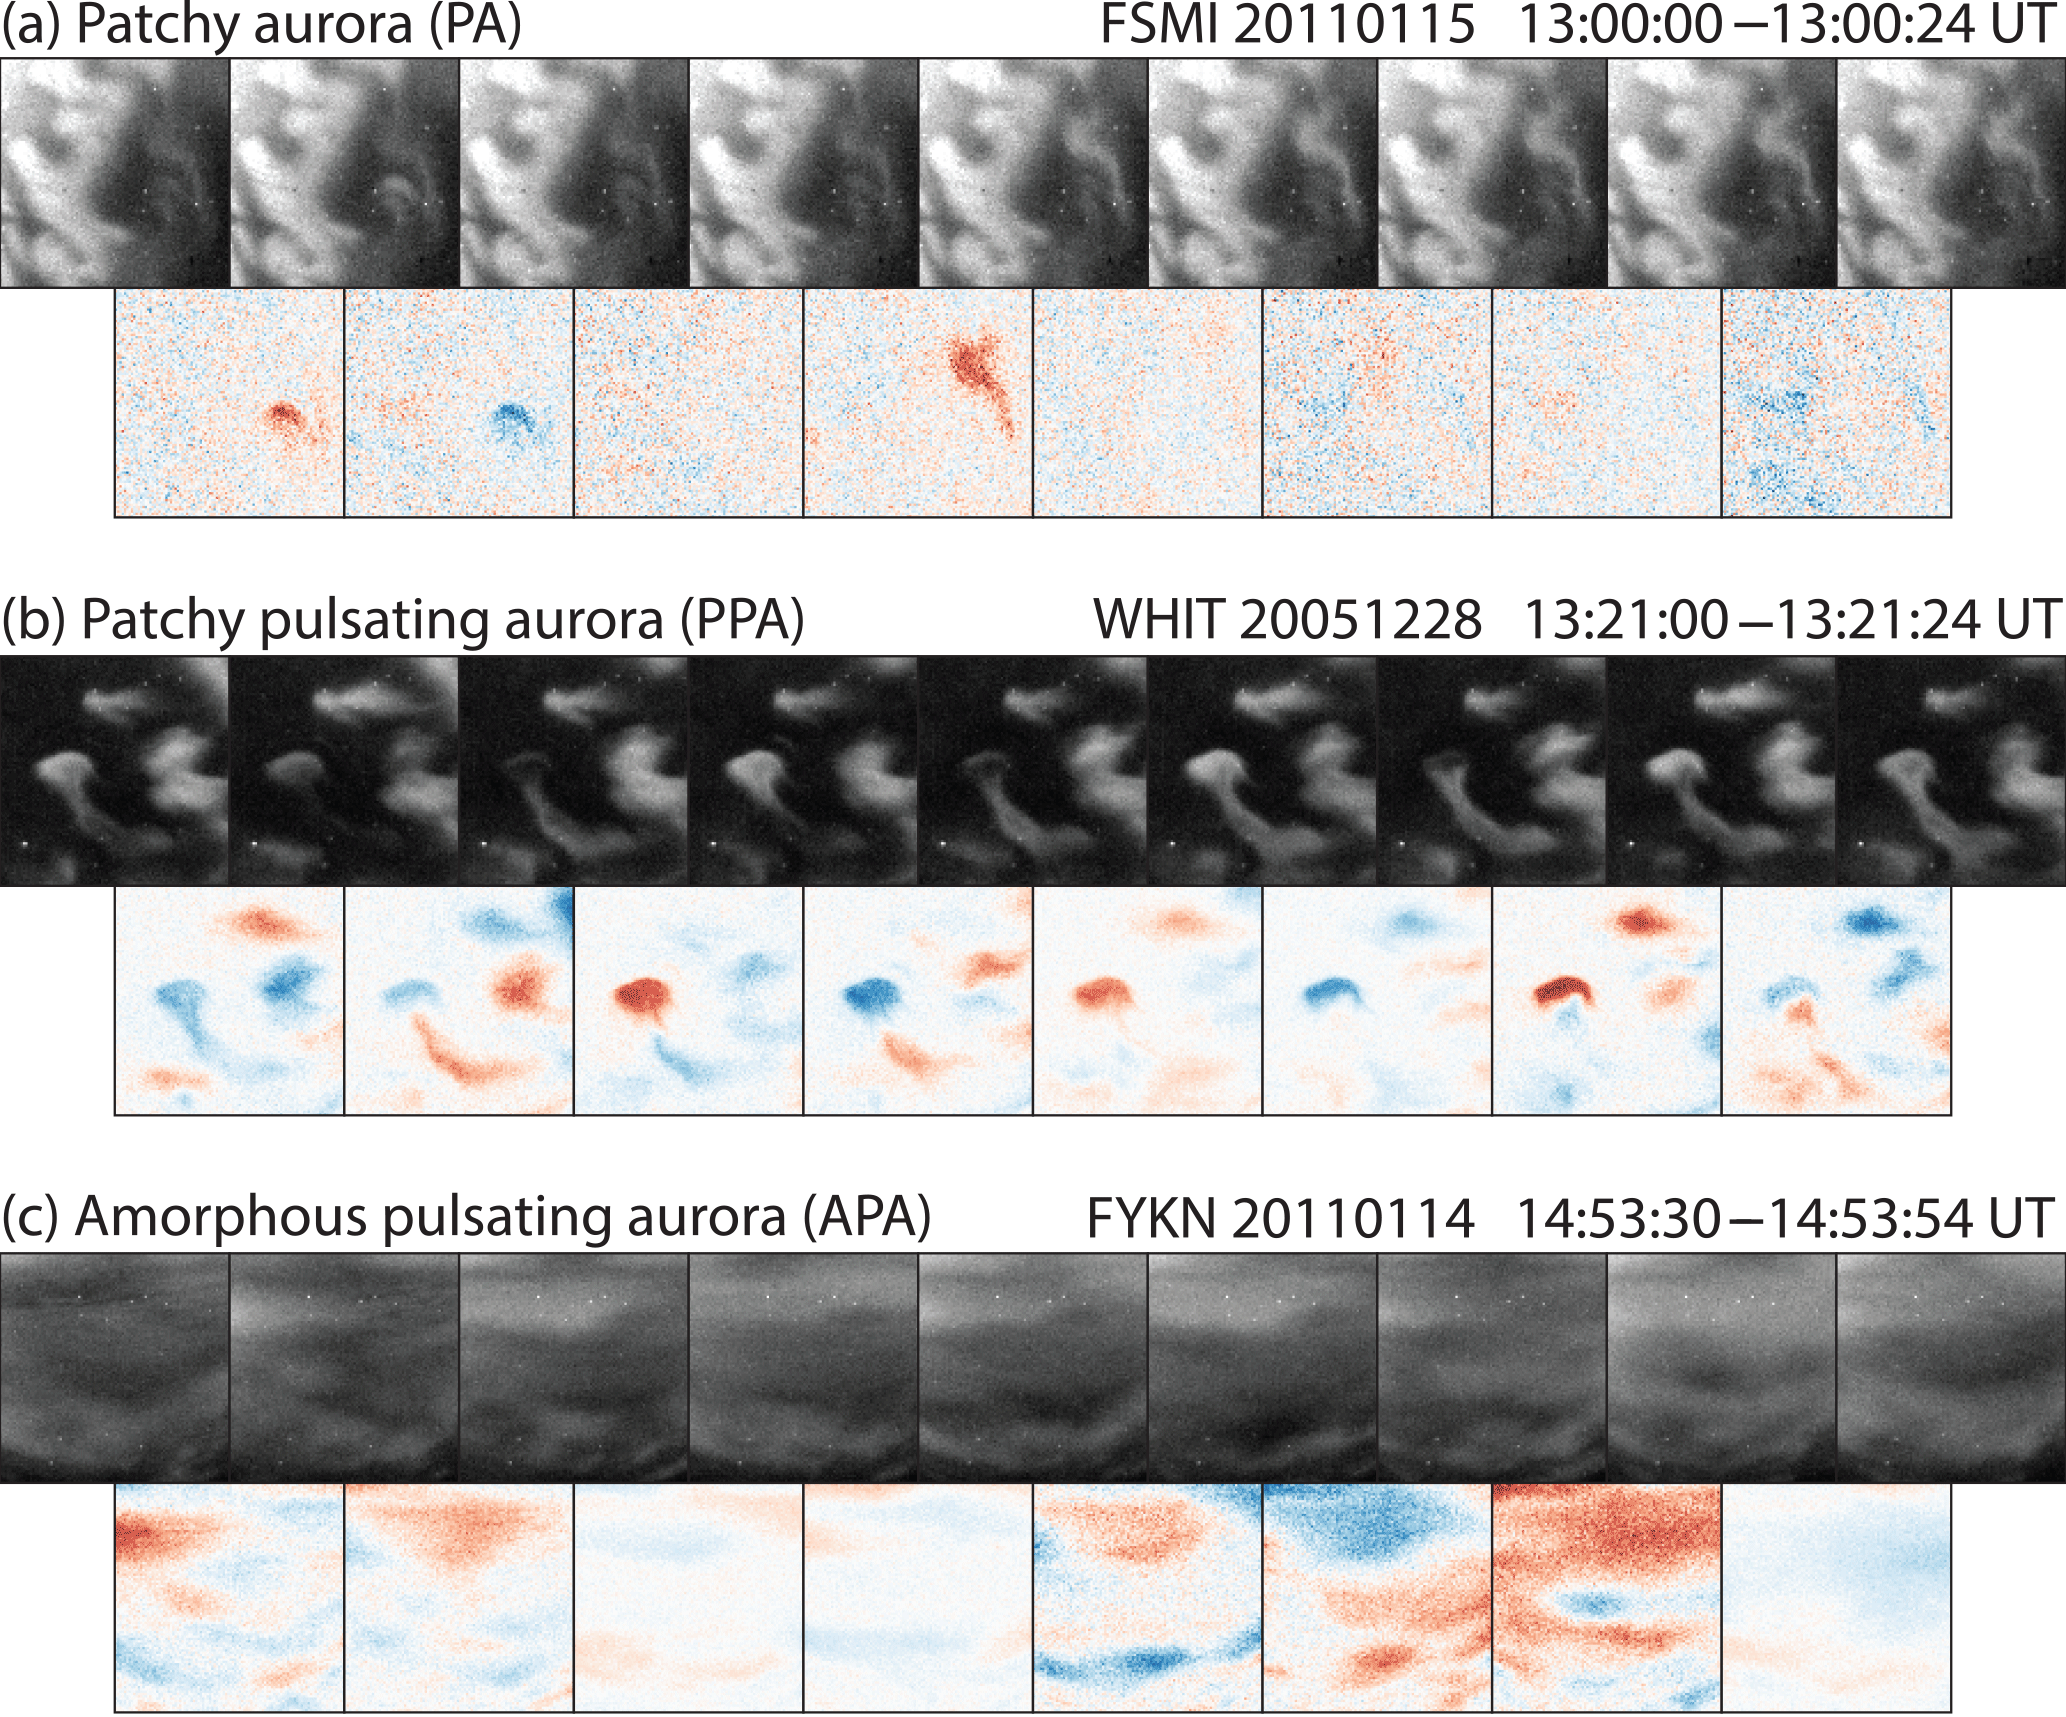
Figure 2Series of images containing (a) patchy aurora, (b) patchy pulsating aurora, and (c) amorphous pulsating aurora as well as difference images highlighting the intensity modulations between sequential frames. Red and blue pixels indicate brightening and dimming, respectively.
Grono et al. (2017) noted that all structures that would be considered to be a pulsating auroral patch did not move with convection. They identified a type of patch whose motion was more dynamic and whose morphology was visually distinct from those that followed convection. This study will describe the distinction between these structures and outline a scheme for separating pulsating auroral patches into at least three categories based on the spatial extent of their pulsations as well as the stability of their shape.
The pulsating aurora events featured in this paper were imaged by the Time History of Events and Macroscale Interactions during Substorms (THEMIS) all-sky imager (ASI) array (Donovan et al., 2006; Mende et al., 2008), the ground-based component of the NASA mission (Angelopoulos, 2008) focused on the study of aurora and substorms. The network currently consists of 21 ASIs stationed across northern North America which capture “white light” images of the aurora on a 256 × 256 pixel CCD with a 3 s cadence. This network has been operating for over 10 years and has amassed tens of millions of images. As demonstrated by Grono et al. (2017), it can be extrapolated from Jones et al. (2011) that on the order of 10 % of THEMIS ASI images contain pulsating aurora.
Pulsating auroral patches are easily identified in keograms (Jones et al., 2013; Partamies et al., 2017; Yang et al., 2017). These figures illustrate the spatial and temporal evolution of a north–south aligned column of pixels and are created by isolating a column of pixels in a sequence of images and arranging them in chronological order (Eather et al., 1976). Ewograms, or east–west keograms, are a variation of this figure made by extracting an east–west aligned row of pixels from a sequence of images. Within keograms and ewograms a pulsating aurora can appear as structures featuring quasi-periodic vertical striations which arise due to the aurora alternating between dim and bright states.
This study contains 32 keograms of pulsating aurora events which appeared across 27 nights between 1 January and 1 March 2011 and were imaged by ASIs stationed at Athabasca, Fort Simpson, Fort Smith, Fort Yukon, Gillam, and Sanikiluaq. These events were chosen because they were the first 32 pulsating aurora events in 2011 which persisted for at least 2 h and were clearly identifiable as pulsating aurora during a quick survey of keograms. Regions of each figure have been classified based on the type of pulsating auroral patch that appears most prevalent within the ASI field-of-view during a given period. These classifications are based on the type of structures that are visible within the keograms as well as the full images and do not imply that other types of patch or aurora are not simultaneously present within the field-of-view. The boundaries of each region are placed imprecisely as their primary purpose is to aid the reader in recognizing the distinct signatures of each type of patch as well as their relative frequency. Videos containing the full all-sky images that the keograms are constructed from are available in Grono (2017).
Pulsating auroral patches differ from each other in terms of shape, size, brightness, pulsation frequency and coherence, among other factors. It can be challenging to categorize patches since their characteristics often exhibit gradation between types. This study will establish criteria to classify pulsating auroral patches based on the spatial extent of their pulsations as well as the stability of their shape – not to be confused with the definition of stability utilized by Royrvik and Davis (1977).
The defining characteristic that separates stable and unstable pulsating patches is the ability to identify a singular patch across an extended period of time. To describe a patch as stable in this context means that its shape and intensity evolve slowly enough that it can be easily identified across many THEMIS all-sky images. The shape and intensity of an unstable patch evolve so rapidly that it is challenging – if not impossible – to uniquely identify a patch across multiple images. In addition, the region of a patch that pulsates can vary in spatial extent; pulsations can cover the entire area of a patch or be limited to a smaller region. These two properties, the stability and the spatial extent of pulsations, can be used to separate patches into three categories: patchy aurora, patchy pulsating aurora, and amorphous pulsating aurora.
Figure 2a–c include examples of the three types to illustrate the differences in stability and pulsation extent between these types of pulsating auroral patch. Each example consists of a series of all-sky images and corresponding difference images highlighting the intensity modulations between sequential frames. The difference images are created by subtracting an image from its predecessor and then shifting and byte-scaling the data values until 0 is represented by white pixels on a blue–white–red colour scale. Red pixels are brighter in the second image than the first and the opposite is true of blue pixels. The images composing Fig. 2 are each 100 pixels square and are off-centre from zenith.
Patchy aurora (Fig. 2a) consists of stable patches which have a slowly evolving structure that allows individual patches to be easily followed through their transit of the ASI field-of-view for tens of minutes. The pulsations visible within a patchy aurora event are often limited to small regions along the edge of the patch or constrained to smaller structures separate from the main body of the patch. In Fig. 2a the intensity of the large patch on the left side of the images remains quite constant, while the smaller structure on the right exhibits modulation. These pulsations are not referenced in the name of this type of patch since the larger non-pulsating structures are the defining characteristic of this form when considered in comparison to the other two types. Figures 3 and 4 contain approximately 10 h of patchy aurora.
Patchy pulsating aurora (Fig. 2b) also consists of stable patches which are easily trackable; however, in contrast to patchy aurora, these patches pulsate over a larger region – often their entire area. Patchy pulsating aurora can be easily identified within sequences of all-sky images for tens of minutes, similar to patchy aurora, but individual structures may not necessarily be visible in each image due to their larger pulsating area. Furthermore, the shape of patches that stream between their bright and dim states can differ between images and consequently increase the difficulty of identification. Figure 2a and b highlight the different pulsating areas of patchy aurora and patchy pulsating aurora; both sequences of images contain persistent, easily recognizable structures, but Fig. 2b pulsates over a significantly larger region. The approximately 19 h of patchy pulsating aurora in Figs. 3 and 4 is nearly double the amount of patchy aurora which is visible.
In contrast to the two patchy auroras, amorphous pulsating aurora (Fig. 2c) consists of transient, irregularly shaped structures which are often impossible to identify and track through sequences of images. Amorphous pulsating aurora generally pulsates over its entire area, exhibits noticeable streaming, and has a rapidly evolving shape demonstrated in Fig. 2c. In fact, it is common that amorphous patches are only uniquely identifiable within a single THEMIS all-sky image. Across the 32 pulsating aurora events in Figs. 3 and 4, approximately 67 h of amorphous pulsating aurora are visible, making these structures the most common type of pulsating patch. Furthermore, amorphous pulsating aurora appears during every pulsating aurora event in Figs. 3 and 4, and while it is possible that an event may exclusively feature amorphous pulsating aurora, this is not true of the two patchy auroras. Assuming visibility allows sufficient observations, amorphous pulsating aurora appears to always precede the onset of the other types and may also be seen later.
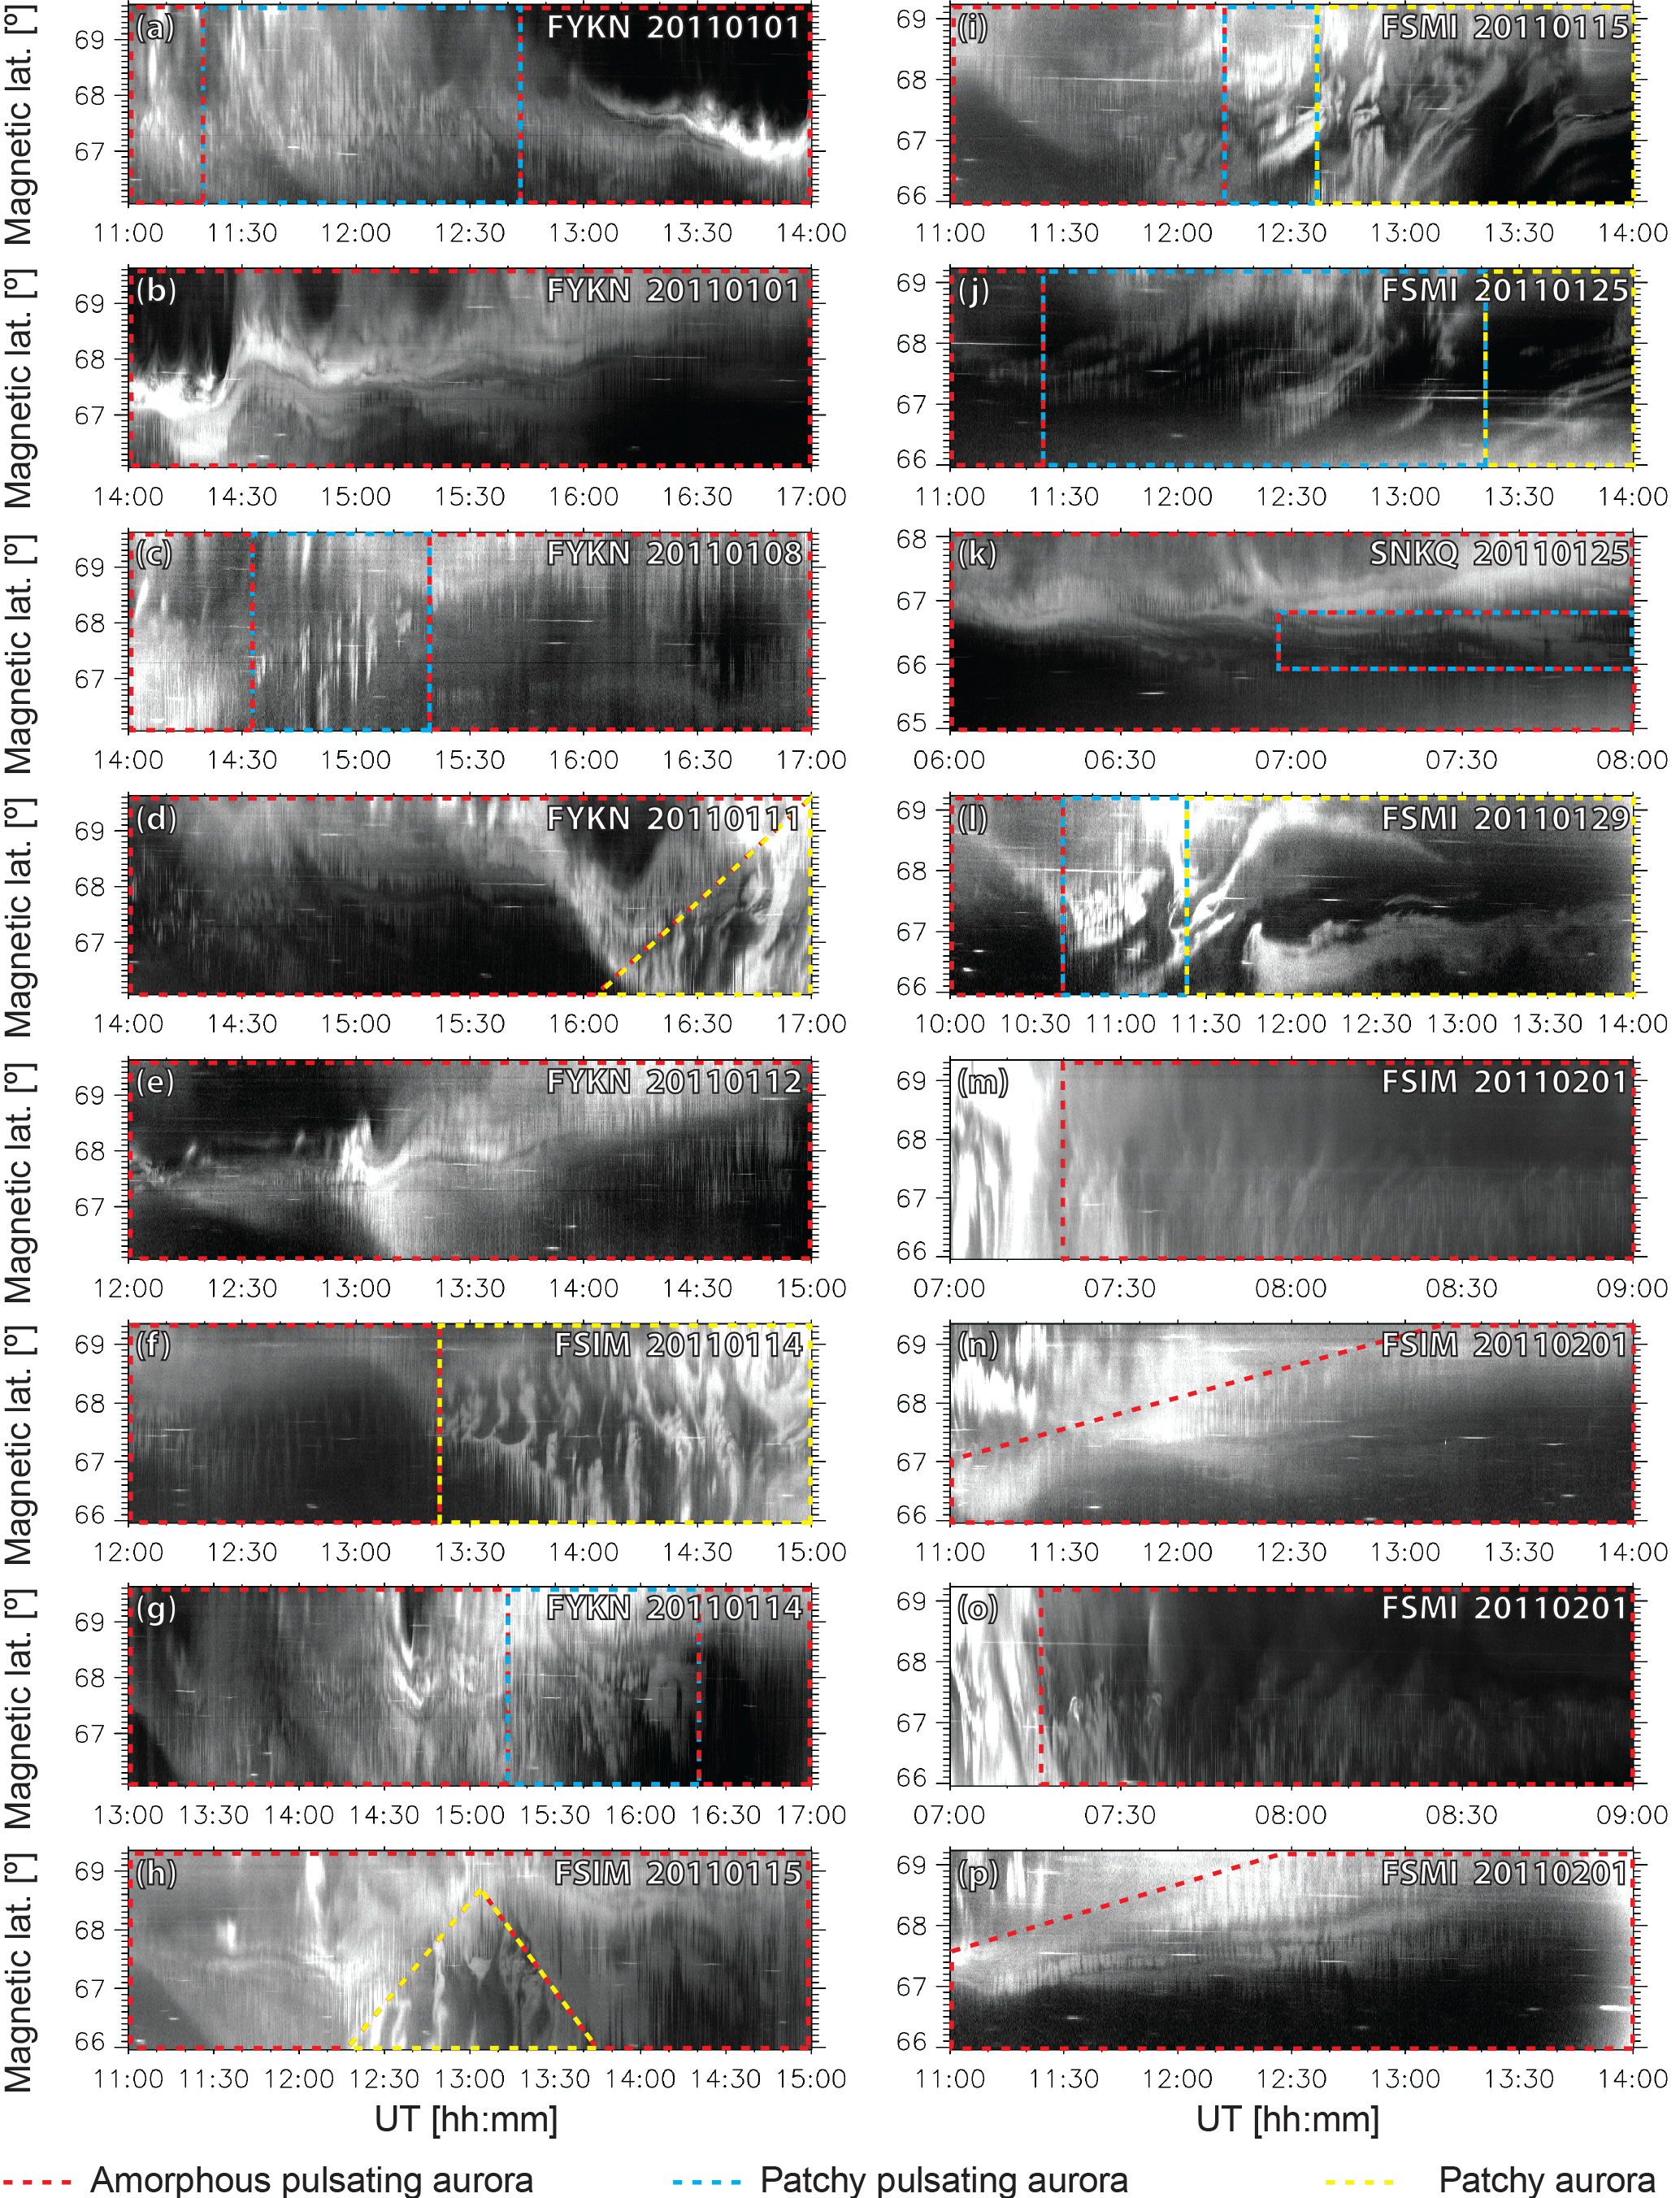
Figure 3Sixteen pulsating aurora events where regions of amorphous pulsating aurora, patchy pulsating aurora, and patchy aurora are approximately outlined in red, blue, and yellow, respectively. The outlined regions designate only the most prominent types in the keogram and do not imply that no other types are simultaneously present within the ASI field-of-view. Videos of the associated ASI data are included in Grono (2017).
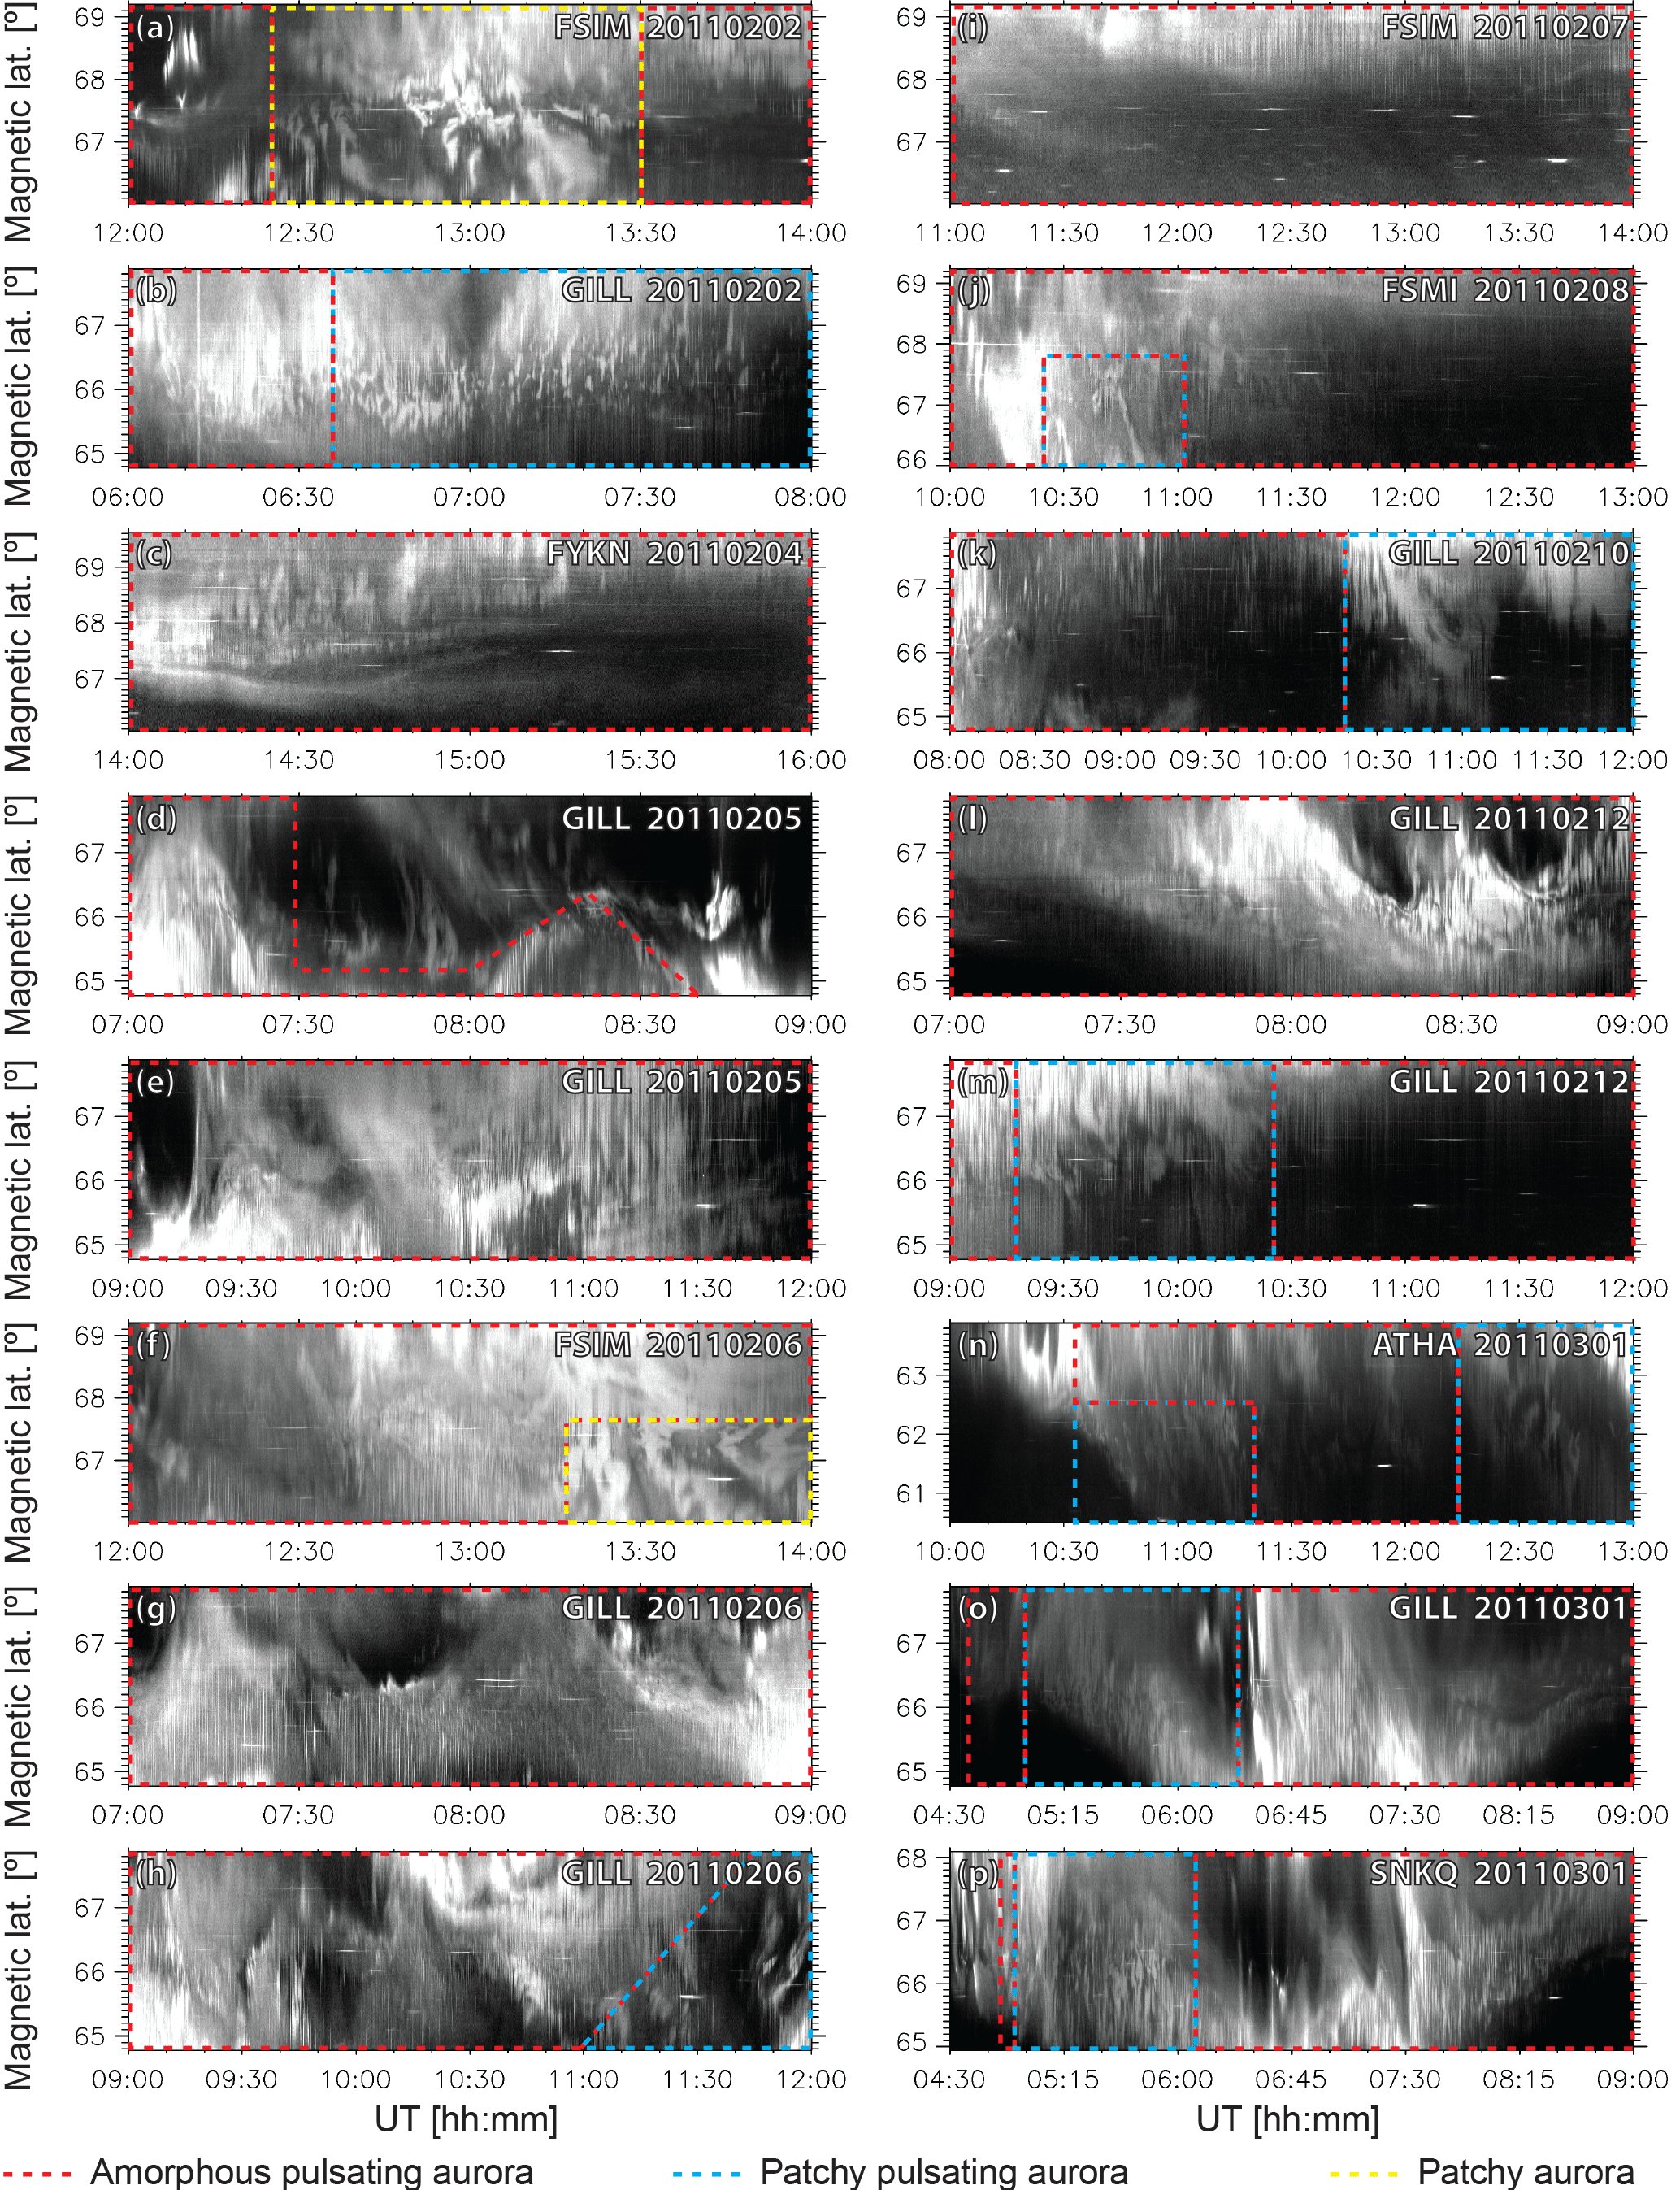
Figure 4Sixteen pulsating aurora events where regions of amorphous pulsating aurora, patchy pulsating aurora, and patchy aurora are approximately outlined in red, blue, and yellow, respectively. The outlined regions designate only the most prominent types in the keogram and do not imply that no other types are simultaneously present within the ASI field-of-view. Videos of the associated ASI data are included in Grono (2017).
Yang et al. (2015), the inspiration for Grono et al. (2017), compared five pulsating auroral patches to SuperDARN measurements and demonstrated that patches move with convection. Reconsidering these patches with the categorization scheme described above reveals them to be patchy aurora and patchy pulsating aurora, from which the conclusion can be drawn that the patchy auroras move with convection. In contrast to these, the motion of amorphous pulsating aurora is far more dynamic and challenging to ascertain – amorphous patches do not appear to drift, but instead may be transient structures which appear and disappear chaotically. Due to the difficulty of uniquely identifying an amorphous patch throughout a sequences of images, it is possible that they exist for only a single pulsation.
This differentiation of pulsating patches was initially noted by Grono et al. (2017), who, while developing an automated method of tracking patches, recognized that all structures that could be considered pulsating auroral patches did not move in a manner consistent with convection. Although these structures were not identified as such by Grono et al. (2017), similar to Yang et al. (2015) the patches that they studied were patchy aurora and patchy pulsating aurora and those that were noted to not follow convection were amorphous pulsating aurora. The original figures from these papers as well as the full all-sky images for these events – the latter of which are included in Grono (2017) as videos – provide sufficient information to classify these events.
The tracking algorithm of Grono et al. (2017) can be used to automatically separate the structures that move with convection from those that do not within series of images containing pulsating auroral patches. This technique functions by applying a wavelet filter to series of images to make auroral structures Gaussian-like and then following them between images to produce “tracks” under the assumption they behave like non-interacting Brownian particles. The tracks produced by this algorithm can then be used to classify structures within the images. The threshold that has been found empirically to separate the patchy auroras from other tracks is based on two criteria: track length and the standard deviation of patch velocity in the magnetic local time (MLT) frame of reference. A minimum track length of 60 images – corresponding to a minimum patch lifetime of 3 min at the 3 s cadence of THEMIS ASIs – combined with a maximum standard deviation of 1000 has been found to be an effective threshold for identifying patchy and patchy pulsating auroras within an event.
In its current state, separating patches with this technique requires pulsating aurora events to be manually identified before being processed by the tracking algorithm. It is computationally wasteful to track ASI data that do not feature pulsating aurora, and lacking an effective automatic image classification technique it is easiest to manually pre-identify periods featuring pulsating patches.
The luminosity of pulsating patches is frequently described as modulating between “on” and “off” states (Jones et al., 2013; Partamies et al., 2017; Yang et al., 2017). In many cases this is an appropriate description, but it does not fully describe the behaviours exhibited by the types of pulsating patches outlined in this paper. The different states of patchy aurora can be quite similar, while patchy pulsating aurora does not necessarily disappear during its off state, but can instead dim non-uniformly. Furthermore, it may be inappropriate to view the rapid evolution of amorphous pulsating aurora as a transition from one state to another and then back again. In consideration for this, it is more consistent with these classifications to view patches as transitioning between bright and dim states.
Pulsating auroral patches are typically characterized within keograms by the vertical striations that arise from their pulsations (Jones et al., 2013; Partamies et al., 2017; Yang et al., 2017). This accurately describes the appearance of amorphous pulsating aurora and – to a lesser extent – patchy pulsating aurora, the two types that pulsate over large portions of their area. However, the appearance of patchy aurora is not well described by this criterion because its pulsations are generally constrained to small regions and consequently any striations are subtle or absent altogether. Patchy aurora is more easily identified by the pathlines the non-pulsating patches create as they move across the field-of-view of the ASI. Patchy pulsating aurora (Fig. 2b) can exhibit both of these identifying features and are sometimes recognizable in keograms by pathlines that feature vertical striations.
While these observations are true in general, keograms can be insufficient to completely and accurately identify which types of patch are present during a pulsating auroral event. For these situations it is helpful to consult the all-sky images for the period in question. To this end, videos for each keogram in Figs. 3 and 4 are included in Grono (2017).
Due to gradation between the types of patches it can occasionally be difficult to categorize a pulsating auroral event. For example, some amorphous pulsating aurora events exhibit more structuring than others and begin to resemble patchy pulsating aurora. The red-outlined section of Fig. 3d between approximately 14:00 and 15:30 UT is one such instance where what appear to be pathlines with striations that would be created by patchy pulsating aurora actually depict what is better described as amorphous pulsating aurora.
In contrast to the results of Yang et al. (2015, 2017), Grono et al. (2017) observed that the motion of certain pulsating auroral patches was inconsistent with convection. This study is an initial step toward identifying the differences between patches that follow convection and those that do not. While many properties of pulsating auroral patches exhibit variation, it is the morphological differences that are highlighted here. In particular, the stability of patches and the spatial extent of their pulsations can be used to categorize pulsating auroral patches. The first criterion describes how rapidly the structure of a patch evolves. A stable patch is one whose shape evolves slowly enough that it can be easily identified throughout a sequence of images, while an unstable patch is difficult or impossible to follow. The second criterion refers to how the region over which a patch pulsates can range from its entire area to small regions near its edge. From these criteria three categories can be defined.
Patchy aurora consists of stable patches whose infrequent pulsations are limited to small regions near the edge of larger non-pulsating structures, as seen in Fig. 2a. These patches can persist for tens of minutes (Grono et al., 2017) and their motion is consistent with convection.
Patchy pulsating aurora includes stable patches that pulsate over most, if not all, of their area. Relative to patchy aurora, these structures are as long-lived and similarly follow convection; however, patchy pulsating aurora have more frequent and prominent pulsations.
Amorphous pulsating aurora describes unstable auroral patches that often pulsate over their entire area. In contrast to the patchy auroras, amorphous patches evolve rapidly and can be challenging to identify in subsequent THEMIS all-sky images. The motion of amorphous pulsating aurora is more dynamic than the patchy auroras and may arise due to a different mechanism unrelated to cold, equatorial plasma following convection. Despite these differences there appears to be a relationship between the mechanisms creating these patches since gradation is observed between the types and it can be difficult to categorize a patch with confidence on occasion.
Identifying where the differences between these types originate from is a key question moving forward. Possibilities include the type of plasma wave interacting with the particle precipitation, the source of the plasma wave modulation, and the source region of the particle precipitation. To these ends, the THEMIS spacecraft are well positioned to provide the necessary data, and in a future paper conjunctions between THEMIS ASIs and spacecrafts will be used to investigate these phenomena.
The THEMIS ASI data analyzed in this study were downloaded from http://data.phys.ucalgary.ca/sort_by_project/THEMIS/asi/stream0/. Videos of these data are available in Grono (2017).
EG designed and analyzed the work, and wrote the paper. ED is his supervisor and assisted with analysis.
This research was supported by grants from the Natural Science and
Engineering Research Council (NSERC) of Canada and Danish Technical
University (DTU). Thanks to Emma Spanswick, Harald Frey, and Stephen Mende
for all-sky data from the NASA Time History of Events and Macroscale
Interactions during Substorms (THEMIS) mission.
The topical editor, Yoshizumi Miyoshi, thanks two
anonymous referees for help in evaluating this paper.
Angelopoulos, V.: The THEMIS Mission, Space Sci. Rev., 141, 5–34, https://doi.org/10.1007/s11214-008-9336-1, 2008. a
Coroniti, F. V. and Kennel, C. F.: Electron precipitation pulsations, J. Geophys. Res., 75, 1279–1289, https://doi.org/10.1029/JA075i007p01279, 1970. a
Davidson, G. T.: Pitch-angle diffusion and the origin of temporal and spatial structures in morningside aurorae, Space Sci. Rev., 53, 45–82, https://doi.org/10.1007/BF00217428, 1990. a
Donovan, E., Mende, S., Jackel, B., Frey, H., Syrjäsuo, M., Voronkov, I., Trondsen, T., Peticolas, L., Angelopoulos, V., Harris, S., Greffen, M., and Connors, M.: The THEMIS all-sky imaging array – system design and initial results from the prototype imager, J. Atmos. Sol.-Terr. Phy., 68, 1472–1487, https://doi.org/10.1016/j.jastp.2005.03.027, 2006. a
Eather, R. H., Mende, S. B., and Judge, R. J. R.: Plasma injection at synchronous orbit and spatial and temporal auroral morphology, J. Geophys. Res., 81, 2805–2824, https://doi.org/10.1029/JA081i016p02805, 1976. a
Grono, E.: Supplemental Data for: Differentiating Diffuse Aurora Based on Phenomenology, Scholars Portal Dataverse, V2, https://doi.org/10.5683/SP/IPSEV2, 2017. a, b, c, d, e, f
Grono, E., Donovan, E., and Murphy, K. R.: Tracking patchy pulsating aurora through all-sky images, Ann. Geophys., 35, 777–784, https://doi.org/10.5194/angeo-35-777-2017, 2017. a, b, c, d, e, f, g, h, i
Johnstone, A. D.: Pulsating aurora, Nature, 274, 119–126, https://doi.org/10.1038/274119a0, 1978. a
Jones, S. L., Lessard, M. R., Rychert, K., Spanswick, E., and Donovan, E.: Large-scale aspects and temporal evolution of pulsating aurora, J. Geophys. Res., 116, A03214, https://doi.org/10.1029/2010ja015840, 2011. a, b
Jones, S. L., Lessard, M. R., Rychert, K., Spanswick, E., Donovan, E., and Jaynes, A. N.: Persistent, widespread pulsating aurora: A case study, J. Geophys. Res., 118, 2998–3006, https://doi.org/10.1002/jgra.50301, 2013. a, b, c, d
Mende, S. B., Harris, S. E., Frey, H. U., Angelopoulos, V., Russell, C. T., Donovan, E., Jackel, B., Greffen, M., and Peticolas, L. M.: The THEMIS Array of Ground-based Observatories for the Study of Auroral Substorms, Space Sci. Rev., 141, 357–387, https://doi.org/10.1007/s11214-008-9380-x, 2008. a
Miyoshi, Y., Katoh, Y., Nishiyama, T., Sakanoi, T., Asamura, K., and Hirahara, M.: Time of flight analysis of pulsating aurora electrons, considering wave-particle interactions with propagating whistler mode waves, J. Geophys. Res., 115, A10312, https://doi.org/10.1029/2009JA015127, 2010. a
Nishimura, Y., Bortnik, J., Li, W., Thorne, R. M., Lyons, L. R., Angelopoulos, V., Mende, S. B., Bonnell, J. W., Le Contel, O., Cully, C., Ergun, R., and Auster, U.: Identifying the Driver of Pulsating Aurora, Science, 330, 81–84, https://doi.org/10.1126/science.1193186, 2010. a
Nishimura, Y., Bortnik, J., Li, W., Thorne, R. M., Chen, L., Lyons, L. R., Angelopoulos, V., Mende, S. B., Bonnell, J., Le Contel, O., Cully, C., Ergun, R., and Auster, U.: Multievent study of the correlation between pulsating aurora and whistler mode chorus emissions, J. Geophys. Res., 116, A11221, https://doi.org/10.1029/2011JA016876, 2011. a
Partamies, N., Whiter, D., Kadokura, A., Kauristie, K., Nesse Tyssøy, H., Massetti, S., Stauning, P., and Raita, T.: Occurrence and average behavior of pulsating aurora, J. Geophys. Res., 122, 5606–5618, https://doi.org/10.1002/2017JA024039, 2017. a, b, c
Rae, K.: Patchy Pulsating Aurora and its Relationship to Cold Plasma in the Magnetospheric Equatorial Plane, Master's thesis, University of Calgary, https://doi.org/10.5072/PRISM/27269, 2014. a
Royrvik, O. and Davis, T. N.: Pulsating aurora – Local and global morphology, J. Geophys. Res., 82, 4720–4740, https://doi.org/10.1029/JA082i029p04720, 1977. a, b, c, d, e, f, g
Shiokawa, K., Nakajima, A., Ieda, A., Sakaguchi, K., Nomura, R., Aslaksen, T., Greffen, M., and Donovan, E.: Rayleigh-Taylor type instability in auroral patches, J. Geophys. Res., 115, A02211, https://doi.org/10.1029/2009JA014273, 2010. a
Yang, B., Donovan, E., Liang, J., Ruohoniemi, J. M., and Spanswick, E.: Using patchy pulsating aurora to remote sense magnetospheric convection, Geophys. Res. Lett., 42, 5083–5089, https://doi.org/10.1002/2015GL064700, 2015. a, b, c, d
Yang, B., Donovan, E., Liang, J., and Spanswick, E.: A statistical study of the motion of pulsating aurora patches: using the THEMIS All-Sky Imager, Ann. Geophys., 35, 217–225, https://doi.org/10.5194/angeo-35-217-2017, 2017. a, b, c, d