the Creative Commons Attribution 4.0 License.
the Creative Commons Attribution 4.0 License.
On the location of the Io plasma torus: Voyager 1 observations
The Voyager 1 outbound ultraviolet observations of the Io plasma torus are used to determine the location of the ansae, to obtain a third viewing angle of this structure in the Jovian magnetosphere. At an angle of with respect to the Sun–Jupiter line, or a Jovian local time of 04:30 LT, the Voyager 1 data deliver a distance of 5.74±0.10 RJ for the approaching and 5.83±0.15 RJ for the receding ansa. Various periodicities in the radial distance, brightness and width of the ansae are seen with respect to system III longitude and Io phase angle. The torus ribbon feature does not appear in all ansa scans.
Keywords. Magnetospheric physics (magnetosphere interactions with satellites and rings)
- Article
(703 KB) - Full-text XML
- BibTeX
- EndNote
The Io plasma torus is a gaseous cloud centred at Jupiter, basically located at Io's orbit. It consists mainly of sulfur and oxygen, which is created by Io's volcanic activity and has an input rate of approximately 1 tonne per second. The torus was first discovered by Kupo et al. (1976) and later many spacecraft (e.g. Pioneer 10, Voyager 1 and 2, Galileo and Cassini) and ground-based and space telescopes have observed this object.
The Io plasma torus is very energetic. Most easily observed are the “endpoints” of the torus, which we will call ansa, like is done in the investigations of Saturn's rings. In the Voyager 1 and 2 era, it was estimated to emit approximately 2–3×10¹² W, mainly in the UV. Also, the main emission region seemed to be very small, where an estimated 85 % of the UV emission appeared to come from a narrow ribbon-like structure in the torus (just inside of Io's orbit) not wider than 0.2 RJ (Dessler and Sandel, 1993).
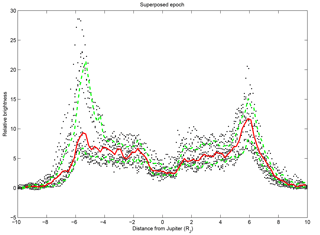
Figure 1The UVS scan 7101 from 12 March 1979 showing the relative brightness as a function of radial distance from Jupiter. The full scan runs over with a resolution of 0.1 RJ. Clearly visible are the bright ansae near .
More recent investigations, however, deduced a lower emission of ∼1–2×10¹² W (Steffl et al., 2004; Tsuchiya et al., 2015). Also there seems to be a lack of the ribbon feature that was observed by Voyager in, for example, the Cassini UVIS data (Steffl et al., 2004). Observations by the New Horizons and Rosetta missions showed again a factor of 2 less emission as compared with Cassini (Steffl et al., 2007).
Various periodicities have been noticed in the Io plasma torus. For a review on periodicities the authors would like to point the reader to Thomas and Winske (1993) and Brown (1995). The dominant ones up to now are (1) the Io phase effect (Sandel and Broadfoot, 1982b; Volwerk, 1997; Tsuchiya et al., 2015), a periodic brightening of the ansae as a function of Io's phase angle; (2) system III variations in apparent distance of the plasma torus from Jupiter (e.g. Dessler and Sandel, 1992; Schneider and Trauger, 1995; Steffl et al., 2008); (3) system IV variations (e.g. Sandel and Dessler, 1988; Yang et al., 1991; Volwerk, 1997); and (4) system III variations in optical brightness (Schneider and Trauger, 1995; Tsuchiya et al., 2015).
In this paper we will take a look at some specifics of the Io plasma torus, based on the Voyager 1 outbound UV observations. Our goal is to find the average distance of the ansa from Jupiter from Voyager 1's viewpoint and to investigate the presence of the ribbon feature. We will first introduce the data we use and the model to make a fit to the data. We then give a summary of our results and discuss our findings.
We use the Voyager 1 outbound 685 Å UVS (Broadfoot et al., 1977, 1981) data of day of year (DOY) 68, 70, 71, 72, and 74 (9, 11, 12, 13 and 15 March) of 1979, where the spacecraft moved from 66 RJ (day 68) to 166 RJ (day 74) from Jupiter. The data from the Voyager 1 outbound pass are valuable, because they give us a new viewing angle on the torus of −114∘ with respect to the ground-based observations, which corresponds to a Jovian local time of 04:30. This might help us to get a better understanding of the location of the Io plasma torus around Jupiter. The UVS slit aperture was aligned with Jupiter's rotation axis, making it a perfect set of observations to get information on the radial structure of the torus between −10 as shown in Fig. 1. These data consist of two scans of the torus for DOY 68, 70, and 71, one scan for DOY 72 and 5 scans for DOY 74. Figure 1 shows a superposed epoch study of all 12 torus scans, with the median (red) and upper and lower quartiles (green). Clearly visible are the two bright ansae near RJ.
The data are binned in 0.1 RJ wide bins and corrected for a distance of 750 RJ to make the scans, that are taken at different distances from Jupiter, comparable. Because of the difference in distance during the scans, the spatial resolution with the field of view of the UVS aperture of (Sandel and Broadfoot, 1982a) is varying from ∼ 0.07 to ∼ 0.17 RJ. The data are corrected for this by a triangular filter as described in Dessler and Sandel (1993).
The same analysis as in Dessler and Sandel (1993) is performed on the Voyager 1 outbound data, which allows for a direct comparison of the Voyager 2 and Voyager 1 results. We calculate the emission from a model described by Sandel and Broadfoot (1982a), a photon source centred at the torus at 6 RJ, falling linearly to zero at 4.9 RJ inward and parabolically to zero at 8.9 RJ outward. To this is added a bright, narrow Gaussian core to be able to get a better fit to the data. This core will be called a ribbon hereafter.
The radial emission profile of the torus in UV is calculated and has to be fitted to the Voyager 1 outbound observations. As the added core is of finite extent we first make sure that the inner region of the background torus is fitted well in amplitude in the region between 3 and 5 RJ. We then check if the ribbon is wide and intense enough to fit the data. If not, we change the values for the width and amplitude and calculate a new torus emission model. To show that the ribbonless model of the torus as proposed in Sandel and Broadfoot (1982a) is inadequate, we point the reader to Dessler and Sandel (1993), their Fig. 1. The ribbon is described in the model by a full width at half maximum (FWHM) and an intensity.
As the ansae and the ribbon are moving radially with system III and are not symmetrical with respect to Jupiter (e.g. see Dessler and Sandel, 1992; Schneider and Trauger, 1995; Smyth et al., 2011), we have to make a small correction in radial distance of the model ribbon, which has its location at 5.9 RJ. We use a Gaussfit (a Gaussian plus a second order polynomial) to find the radius of maximal brightness in the data and shift the torus UV model in such a way that its maximum agrees in radial distance with the observations.
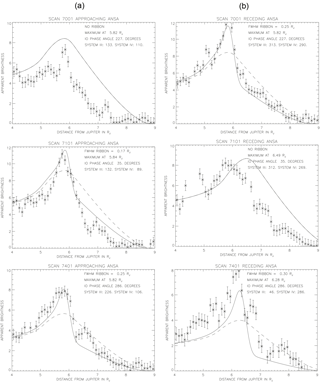
Figure 2Three scans of the Io plasma torus on DOY 70, 71, and 74, divided into approaching (a) and receding (b) ansa. The dashed lines in the figure represent the brightness model by Sandel and Broadfoot (1982a) and the solid lines are with the ribbon feature included by Dessler and Sandel (1993).
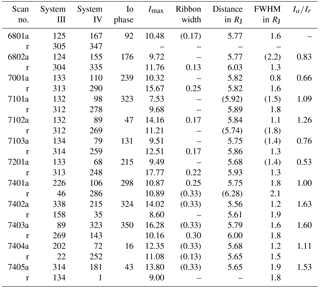
Table 1The Voyager 1 outbound data results in table form. For each scan of the torus the relevant information is given for the approaching (a) and receding (r) ansae. The values between brackets indicate poorly determined fits of the brightness. Whenever there is a dash in the ribbon width column, the data could not be fitted with a ribbon-included model. For scan 6801r there was a significant data gap, so no brightness fit.
We have taken the 12 scans of the torus, giving us 24 scans of an ansa and perform our fitting as discussed above. Three scans for DOY 70, 71, and 74 are shown in Fig. 2, split into approaching (left column) and receding (right column) ansa. Three different cases are shown where the receding ansa is brighter (DOY 70), the approaching ansa is brighter (DOY 71) and when both ansae are equally bright (DOY 74). It is clear that the simple brightness model including a ribbon feature fits some of the ansae rather well; however, there are clear cases in which the this model is inadequate.
The results of the fittings can be seen in Table 1, where all important quantities (system III and IV longitude, Io phase, maximum relative brightness, ribbon width, distance of maximum brightness from Jupiter and FWHM of the observed ansa) are listed. Whenever there is a dash in the ribbon width column, the data could not be fitted with the ribbon-included model. Values in brackets are not well determined. For the results shown in Table 1, the maximum relative brightness Imax and the FWHM of the ansa is determined from the data, not from the brightness model.
From the data set in Table 1, the behaviour of the Io plasma torus is investigated.
3.1 Longitudinal distance variation
Many studies have shown variations in the location of the Io plasma torus as a function of system III (Dessler and Sandel, 1992; Schneider and Trauger, 1995; Smyth et al., 2011; Steffl et al., 2008) and IV longitude (Sandel and Dessler, 1988; Yang et al., 1991; Volwerk, 1997). From this new viewing angle of the torus, a comparison can be made with the results of the previous observations. In Fig. 3 the Voyager 2 (Dessler and Sandel, 1992) ground-based observations (Schneider and Trauger, 1995) and average Voyager 1 and Galileo distances determined by Smyth et al. (2011) are shown, with the data from this current paper. It is clear that the approaching ansa distance from this study fits rather well with that of previous studies, whereas the location of the receding ansa is clearly standing apart from the previous determinations from other viewing directions.
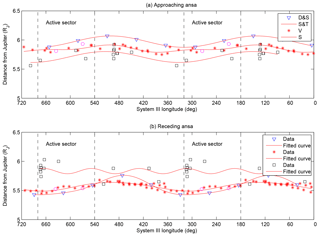
Figure 3The distance of the approaching (a) and receding (b) ansa as a function of system III longitude from different studies: Dessler and Sandel (1992) in blue triangles, Schneider and Trauger (1995) in red asterisks, Smyth et al. (2011) in magenta circles and this study in black squares. The red lines are second-order Fourier fits to the data.
3.2 Io phase effect
The Io phase effect, i.e. the brightening of the ansa when Io is approaching it (Sandel and Broadfoot, 1982b; Volwerk, 1997; Herbert and Sandel, 2000; Tsuchiya et al., 2015) is a well-known phenomenon. Although, interestingly, Gladstone and Hall (1998) did not see a noticeable correlation between the ansa brightness and the Io phase, using EUVE data. In Fig. 4a and b the maximum relative brightness of the ansae is plotted as a function of Io phase angle, with a second order Fourier fit to the data.
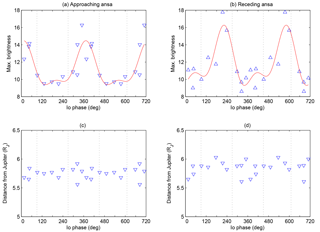
Figure 4(a, b) The maximum relative brightness of the approaching (a, c) and receding (b, d) ansa as a function of the Io phase angle, with a second order Fourier fit superposed. (c, d) The ansa distance from Jupiter as a function of Io phase angle.
For the approaching ansa the maximum brightness peaks near and for the receding at Io phase angle. Sandel and Broadfoot (1982b) found that the maximum brightness of the ansae occurred for for much greater statistics. The results from this study do agree with the result that when Io is approaching an ansa, the brightness will increase with a maximum brightness long before Io is at the ansa.
Figure 4c and d show the ansa distance from Jupiter as a function of Io phase angle. For the approaching ansa there is mainly a random spread around the average distance of 5.75±0.10 RJ. For the receding ansa there seems to be an indication of a maximum distance at .
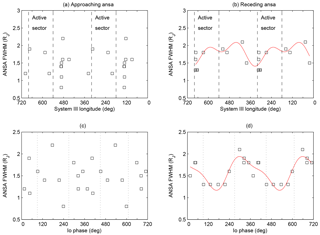
3.3 FWHM of ansa
The FWHM values of the ansa, determined from the data and listed in Table 1, are plotted as a function of system III and Io phase angle in Fig. 5. A second order Fourier fit is made to the data, which shows that there is a clear pattern in the receding ansa, whereas for the approaching ansa there seems to be no functionality with either ordinate.
3.4 Ansa brightness ratio
There is a difference in the brightness of the ansae (e.g. see Sandel and Broadfoot, 1982a; Dessler and Sandel, 1992; Schneider and Trauger, 1995; Herbert et al., 2001; Steffl et al., 2004), such that the approaching ansa is dimmer than the receding ansa. This is in contrast to the situation shown in Fig. 1 and the numbers in the last column of Table 1, where the approaching ansa is often brighter than the receding ansa. For some of the scans( 7101, 7404 and 7405), this could be related to the Io phase effect.
3.5 Relative brightness and ribbon existence
The ansa brightness model used in this paper (from Dessler and Sandel, 1993) cannot fit every ansa scan incorporating a ribbon feature. Looking at the information in Table 1 there seems to be a relationship between the maximum relative brightness of the ansa and the presence of a ribbon feature. For the scans where Imax is less than ∼ 11 this model does not seem to work. This could be explained if the ribbon feature only appears for very bright ansae. This could possibly be a reason why the ribbon feature is not present in the fainter torus during the Cassini and New Horizons/Rosetta age.
3.6 Average distance from Jupiter
Schneider and Trauger (1995)Table 2Averaged ansa locations from this paper and two of the largest continuous data sets of torus observations.

From the values in Table 1 the average distance of the ansae is determined: 5.74±0.10 RJ for the approaching and 5.83±0.15 RJ for the receding ansa. Table 2 shows these averaged values in context with two other results (Dessler and Sandel, 1992; Schneider and Trauger, 1995). In Fig. 6 the result is shown in graphical form, with the ansa angle (defined like the Io phase angle, i.e. the ansa at midnight has zero angle and the noon ansa has 180∘) as well as the ansa local time. A second order Fourier fit has been made to the points.
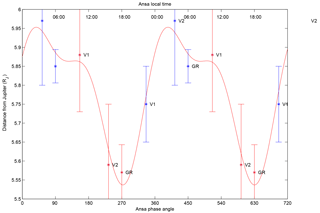
Figure 6Average location of the ansae as a function of ansa angle and local time. The ansa angle is defined similar to the Io phase angle, the ansa at midnight has zero and the ansa at noon has 180∘ angle. The approaching ansa are shown in blue and receding ansa in red. The solid red line is a second order Fourier fit to the data.
We have studied the Voyager 1 outbound UVS scans of the Io plasma torus, delivering a new viewing angle of this interesting structure from from the Sun–Jupiter line, or at 04:30 LT. The complete data set consists of only 12 scans of the torus so statistical results have to be looked at with care.
The brightness of the ansae behave differently from what is discussed in earlier papers. Although the superposed epoch study in Fig. 1 shows that the median brightness of the approaching ansa is dimmer than the receding anse, the upper quartile shows that the brightness ratio is reversed. In four scans , whereas for six scans . For three of the six scans this could be related to the Io phase effect. This, however, may not be surprising because of the large difference in viewing angle of the torus, i.e. about 90∘ with respect to the Voyager 2 inbound direction. This result can be interpreted as the observations being in the regions where the change from approaching to receding ansa is taking place, and thus possibly also the change in brightness.
The average distance of both ansae, as given in Table 2 and graphically displayed in Fig. 6, shows a clear offset torus towards dawn as described in Schneider and Trauger (1995) in their Fig. 10. The variations in the ansa location with respect to system III show that the approaching ansa for Voyager 1 fit well into the range of the previous observations, but the location and variation in the receding ansa differ from the previously determined values.
Although the statistics are small, there is a clear signature of the Io phase effect in the ansa brightness.
The prominent ribbon feature from the Voyager 2 observations is not as prominent in this data set. There is a tentative piece of evidence that this may be related to the relative brightness of the ansa, with all possible ribbon structures appearing when the relative brightness is greater than ∼ 11. The result that a ribbon can only be found if the apparent brightness is greater then some critical level is of importance. As the UV emission is mainly dependent on the electron temperature (exponential in temperature, quadratically in density) this finding means that there is a critical value for the electron temperature. In the model by Herbert (1996) for the formation of the ribbon, this result makes sense. A higher electron temperature means that the energy-loss time, τel, for hot ions to warm electrons increases. The timescale is proportional to the temperature, (Spitzer, 1956). In Herbert's ribbon formation model, this results in a higher pressure by the hot ions (pressure being proportional to the temperature of the hot ions), as they cannot loose as much energy as the electrons are cooler. Higher pressure by the hot ions leads to a thicker ribbon. Evidently the pressure has to reach a critical value, related to the critical apparent brightness, before the ribbon feature becomes visible in the UV. Although our data are marginal, they could be interpreted as being in agreement with a relation between ribbon width and brightness; the brighter the ansa, the thicker the ribbon (see Table 1). However, we will not consider this valid evidence of such a relationship. Naturally, we can also consider density variations in the torus to give rise to an increase in emission and thus the occurrence of the ribbon feature.
Voyager 1 outbound ultra-violet observations of the Io plasma torus have given a new viewpoint of this interesting structure in the Jovian magnetosphere. A third set of average distances for the ansae has been obtained: 5.74 ± 0.10 RJ for the approaching and 5.83 ± 0.15 RJ for the receding ansa. The ansa distance varies with system III longitude. Brightness variations in the ansae related to the Io phase effect are present, and the brightness asymmetry between the ansae with the approaching ansa being dimmer than the receding ansa being not as evident in this data set. The presence of a ribbon feature is not always clear, and its occurrence seems to be related to the brightness of the ansa.
The data for this paper can be obtained from http://www.iwf.oeaw.ac.at/user-site/martin-volwerk/ (Volwerk, 2018).
The author declares that he has no conflict of interest.
The author would like to thank Bill Sandel, Floyd Herbert, Alex Dessler and
Bill Smyth for useful discussions and Terry Forrester for processing the data
into a usable form.
The topical editor, Elias Roussos, thanks one anonymous
referee for help in evaluating this paper.
Broadfoot, A., Sandel, B., Shemansky, D., Atreya, S., Donahue, T., Moos, H., Bertaux, J.-L., Blamont, J., Ajello, J., Strobel, D., McConnell, J., Dalgarno, A., Goody, R., McElroy, M., and Yung, Y. L.: Ultraviolet spectrometer experiment for the Voyager mission, Space Sci. Rev., 21, 183–205, https://doi.org/10.1007/BF00200850, 1977. a
Broadfoot, A. L., Sandel, B., Shemansky, D., McConnell, J., Smith, G., Holberg, J., Atreya, S., Donahue, T., Strobel, D., and Bertaux, J.: Overview of the Voyager Ultraviolet Spectrometry Results Through Jupiter Encounter, J. Geophys. Res., 86, 8259–8284, https://doi.org/10.1029/JA086iA10p08259, 1981. a
Brown, M. E.: Periodicities in the Io plasma torus, J. Geophys. Res., 100, 21683–21695, 1995. a
Dessler, A. J. and Sandel, B. R.: System III variations in apparent distance of Io plasma torus from Jupiter, Geophys. Res. Lett., 19, 2099–2103, 1992. a, b, c, d, e, f, g
Dessler, A. J. and Sandel, B. R.: Reply to comment by Barbosa, Geophys. Res. Lett., 20, 2489–2490, 1993. a, b, c, d, e, f
Gladstone, G. R. and Hall, D. T.: Recent results from EUVE observations of the Io plasma torus and Jupiter, J. Geophys. Res., 103, 19927–19933, https://doi.org/10.1029/98JE00823, 1998. a
Herbert, F.: A simple transport model for the Io plasma torus “ribbon”, Geophys. Res. Lett., 23, 2875–2878, 1996. a, b
Herbert, F. and Sandel, B. R.: Azimuthal variation of ion density and electron temperature in the Io plasma torus, J. Geophys. Res., 105, 16035–16052, 2000. a
Herbert, F., Gladstone, G. R., and Ballester, G. E.: Extreme Ultraviolet Explorer spectra of the Io plasma torus: Improved spectral resolution and new results, J. Geophys. Res., 106, 26293–26309, https://doi.org/10.1029/2000JA002501, 2001. a
Kupo, I., Mekler, Y., and Eviatar, A.: Detection of ionized sulfur in the Jovian magnetosphere, Astrophys. J. Lett., 205, L51–L53, 1976. a
Sandel, B. R. and Broadfoot, A. L.: Io's hot plasma torus – a synoptic view from Voyager, J. Geophys. Res., 87, 212–218, 1982a. a, b, c, d, e
Sandel, B. R. and Broadfoot, A. L.: Discovery of an Io correlated energy source for Io's hot plasma torus, J. Geophys. Res., 87, 2231–2240, 1982b. a, b, c
Sandel, B. R. and Dessler, A. J.: Dual periodicity of the Jovian magnetosphere, J. Geophys. Res., 93, 5487–5504, 1988. a, b
Schneider, N. M. and Trauger, J. T.: The structure of the Io torus, Astrophys. J., 450, 450–462, 1995. a, b, c, d, e, f, g, h, i, j
Smyth, W. H., Peterson, C. A., and Marconi, M. L.: A consistent understanding of the ribbon structure for the Io plasma torus at the Voyager 1, 1991 ground-based, and Galileo J0 epochs, J. Geophys. Res., 116, A07205, https://doi.org/10.1029/2010JA016094, 2011. a, b, c, d
Spitzer, L.: Physics of fully ionized gases, Interscience Publishers Inc., New York, USA, 1956. a
Steffl, A. J., Stewart, A. I. F., and Bagenal, F.: Cassini UVIS observations of the Io plasma torus. I. Initial results, Icarus, 172, 78–90, 2004. a, b, c
Steffl, A. J., A'Hearn, M. F., Bertaux, J. L., Feldman, P. D., Gladstone, G. R., Parker, J. W., Retherford, K. D., Slater, D. C., Stern, S. A., Versteeg, M., and Weaver, H. A.: UV observations of the Io plasma torus from New Horizons and Rosetta, Bull Am. Astron. Soc., 39, p. 415, 2007. a
Steffl, A. J., Delamere, P. A., and Bagenal, F.: Cassini UVIS observations of the Io plasma torus. IV. Modeling of temporal and azimuthal variability, Icarus, 194, 153–165, 2008. a, b
Thomas, V. A. and Winske, D.: Kinetic simulations of the Kelvin-Helmholtz instability at the magnetopause, J. Geophys. Res., 98, 11425–11438, 1993. a
Tsuchiya, R., Kagitani, M., Yoshioka, K., Kimura, T., Murakami, G., Yamezaki, A., Nozawa, H., Kasaba, Y., Sakanoi, T., Uemizu, K., and Yoshikawa, I.: Local electron heating in the Io plasma torus associated with Io from HISAKI satellite observation, J. Geophys. Res., 120, 10317–10333, https://doi.org/10.1002/2015JA021420, 2015. a, b, c, d
Volwerk, M.: System III and IV modulation of the Io phase effect in the Io plasma torus, J. Geophys. Res., 102, 24403–24410, 1997. a, b, c, d
Volwerk, M.: Voyager 1 UVS data for 12 scans of the Io plasma torus, available at: http://www.iwf.oeaw.ac.at/user-site/martin-volwerk/, last access: 5 June 2018. a
Yang, Y. S., Dessler, A. J., and Sandel, B. R.: Is system IV independent of system III?, J. Geophys. Res., 96, 3819–3824, 1991. a, b


