the Creative Commons Attribution 4.0 License.
the Creative Commons Attribution 4.0 License.
Araucaria growth response to solar and climate variability in South Brazil
Alan Prestes
Virginia Klausner
Iuri Rojahn da Silva
Arian Ojeda-González
Caren Lorensi
In this work, the Sun–Earth–climate relationship is studied using tree growth rings of Araucaria angustifolia (Bertol.) O. Kuntze collected in the city of Passo Fundo, located in the state of Rio Grande do Sul (RS), Brazil. These samples were previously studied by Rigozo et al. (2008); however, their main interest was to search for the solar periodicities in the tree-ring width mean time series without interpreting the rest of the periodicities found. The question arises as to what are the drivers related to those periodicities. For this reason, the classical method of spectral analysis by iterative regression and wavelet methods are applied to find periodicities and trends present in each tree-ring growth, in Southern Oscillation Index (SOI), and in annual mean temperature anomaly between the 24 and 44∘ S. In order to address the aforementioned question, this paper discusses the correlation between the growth rate of the tree rings with temperature and SOI. In each tree-ring growth series, periods between 2 and 7 years were found, possibly related to the El Niño/La Niña phenomena, and a ∼ 23-year period was found, which may be related to temperature variation. These novel results might represent the tree-ring growth response to local climate conditions during its lifetime, and to nonlinear coupling between the Sun and the local climate variability responsible to the regional climate variations.
Keywords. History of geophysics (solar–planetary relationships) – meteorology and atmospheric dynamics (climatology; palaeoclimatology)
- Article
(2442 KB) - Full-text XML
- BibTeX
- EndNote
In Brazil, dendrochronological/dendroclimatic studies are still incipient (Fritts, 1976; Schöngart et al., 2002, 2004; Rigozo et al., 2007a, b, 2008; Lisi et al., 2008; Oliveira et al., 2009; Prestes et al., 2011, 2014; Andreacci et al., 2013; Pagotto et al., 2015; Lorensi and Prestes, 2016; Lorensi, 2016; Perone et al., 2016), considering the great biodiversity and continental dimension of Brazil when compared to South American countries such as Chile and Argentina. However, these kinds of studies have become more numerous in the recent years (Rigozo et al., 2007a, b, 2008; Lisi et al., 2008; Oliveira et al., 2009; Prestes et al., 2011, 2014; Andreacci et al., 2013; Pagotto et al., 2015; Lorensi and Prestes, 2016; Lorensi, 2016; Perone et al., 2016).
However, the study of solar variations related to the energy flux entering the Earth's atmosphere is predominantly observational, and it has also only recently been undertaken. This fact limits understanding their effects on climate, and the possibility of long-term climate prediction. For these reasons, it is necessary to understand the solar variations, and other geophysical phenomena in the distant past to try to predict the future.
Tree-ring time series are witnesses of the environment and climate that influenced their growth in the past (Fritts, 1976; Kononov et al., 2009; Muraki et al., 2015); therefore they can be used for climate studies in local regions and for particular time periods without instrumental measurements. Tree growth lasts from germination to death, and it is influenced by several simultaneous environmental factors. Temperature, precipitation, and solar radiation play an important role, especially for species located in regions with highly contrasted season conditions. These environmental factors induce different growth rate causing different cell size over time, which allows direct visual identification, i.e., the tree growth rings. The thickness variation of yearly tree rings reflects the specimen sensitivity to the environmental factors of where it grows. Depending of the conditions and the species, some of these environmental factors may prevail over others.
Tree-ring data have been used to reconstruct the climate (e.g., Case and MacDonald, 1995; Jacoby et al., 2003; D'Arrigo et al., 2001; Salzer and Kipfmueller, 2005; Shao et al., 2005; Therrell et al., 2006; Lorensi and Prestes, 2016), and there is evidence of solar influence on these data in timescales of decades to centuries. In addition, there is evidence of solar cycles in living and fossil tree-ring time series (Mori, 1981; Ammons et al., 1983; Nordemann et al., 2005; Raspopov et al., 2011; Prestes et al., 2011, 2014; Dorotovič et al., 2014; Perone et al., 2016).
Rigozo et al. (2008) used 12 tree-ring thickness time series from Passo Fundo (Brazil) to search for solar activity periodicities; however they did not present a study about the rest of the periodicities found in the Passo Fundo records. The goal of this article is to confirm the nonlinear character of the solar activity and their correlation (if any) with the variability of climate conditions using the same records previous studied by Rigozo et al. (2008). This article will focus on the rest of the periodicities found by Rigozo et al. (2008), but it will also re-analyze the periodicities of 11, 22, 54, 80, and 208 years through iterative regression analysis in order to obtain a deeper understanding of the effects of solar activity, climate, and geophysical phenomena in South Brazil.
2.1 Passo Fundo, Rio Grande do Sul, Brazil
In the city of Passo Fundo located in South Brazil (52∘11′ W, 28∘16′ S; altitude of 740 m), the climate can be classified as humid subtropical (Cfa in the Köppen climate classification), where the coldest month is on average above 0 ∘C (32 ∘F) and the highest average temperature is above 22 ∘C (71.6 ∘F). There is no significant precipitation difference between seasons, with annual rainfall reaching 1746 mm. However, there is excessive rainfall during El Niño years (an increase in rainfall of 30–40 %) and drought during the La Niña years (an decrease in rainfall of 10–30 %). In Rio Grande do Sul, the excessive rainfall during El Niño years is more pronounced due to a higher frequency of cold fronts during the warm phase of El Niño–Southern Oscillation (ENSO); see Gelcer et al. (2013) for more details. These persistent climate anomalies can last from 6 months up to 1.5 years as discussed by Berlato and Fontana (2003).
2.2 Dendrochronological series
The dendrochronological series are used in the present work for study the Sun–Earth-climate relationship. These series are obtained from trees located in the region of South Brazil. The tree samples from Araucaria angustifolia species are collected in Passo Fundo, RS, Brazil. These samples were previous used by Rigozo et al. (2008) to identify solar maximum epoch imprints in the tree rings.
All the Araucaria angustifolia samples were collected in 2005 in Passo Fundo, in the environs of the Passo Fundo National Forest (PFNF). The PFNF is a Brazilian conservation site, which is the best-preserved Araucaria forest area in Brazil. The forest coverage is higher in the PFNF than the grassland due to the Protected Area Management Plan. The samples were collected from 12 different trees, and from each tree, four different radius samples were chosen. Then, these data were averaged. The comprehensive procedure of tree-ring sample preparation mandated that (i) the samples should be dried under shady/enclosure conditions; (ii) the samples should be sanded with 50–600 grit sandpaper in order to highlight ring growth; (iii) the best sample radius based on growth-ring morphology should be selected; (iv) the growth rings should be labeled; and finally (v) the growth-rings should be measured.
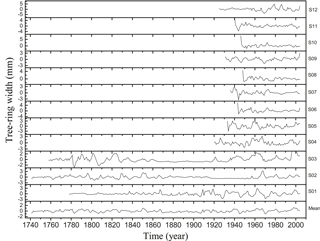
Figure 1Mean time series of growth ring thickness of trees from Passo Fundo, Rio Grande do Sul, after removing their long trend curves.
The time series were obtained using a tree-ring measuring table (Lintab III) with an accuracy of 0.01 mm. In the first step, the growth-rings were identified and demarcated. In this part of the laboratory procedure, the tree rings were properly indicated, i.e., without any false or missing rings being considered. In the second step as previously explained by Rigozo et al. (2008), the tree-ring thickness chronology was obtained averaging the 12 chosen different tree-ring samples, and each sample was averaged using the different radii of four individual tree-ring samples. The mathematical function that represents its individual growth trend was subtracted from each tree series sample, in order to determine the individual residual dendrochronology (see Fig. 1 in Rigozo et al., 2008). For more information about the sample methodology preparation and the sample correlations; see Rigozo et al. (2008). The 12 dendrochronological series are shown in Fig. 1. However, it only presents the residual tree-ring thickness time series, which are a modified version of the Fig. 1 in Rigozo et al. (2008), i.e., without the long trends.
Moreover, the tree-sample ages were determined by the ring-counting. As the samples were collected from live trees in 2005, the last year of ring formation is 2004. In samples of Araucaria angustifolia, the counting of growth rings is usually used to provide an estimation of tree age (Oliveira et al., 2009; Santos et al., 2015; Lorensi and Prestes, 2016).
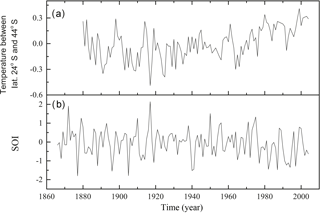
We also used the most recent continuous series from climate drivers. In Fig. 2, these series are shown as follows: (a) the annual mean temperature anomaly between 24 and 44∘ S in the interval 1880–2004 (obtained from Goddard Institute for Space Studies, NASA, https://data.giss.nasa.gov/, last access: January 2017) and (b) Southern Oscillation Index (SOI) in the interval 1866–2004 (obtained from https://crudata.uea.ac.uk/cru/data/soi/, last access: January 2017). The SOI is an index used to represent the ENSO phenomena.
3.1 Iterative regression method (ARIST)
An iterative regression method (ARIST) is used to search for periodicities embedded in tree growth ring time series, and it was used successfully by Rigozo et al. (2008) for identify solar maximum epoch imprints in these tree rings as mentioned before. This method is an iterative least square fit, and it uses a simple sine function with three unknown parameters, a0 = amplitude, a1 = angular frequency and a2 = phase (Wolberg, 1967; Rigozo and Nordemann, 1998; Rigozo et al., 2005). The starting point of this method is the so-called conditional function , where Y is the observed signal, t is the time, and a0, a1, and a2 are the three unknown parameters described above; see Rigozo et al. (2005) for more details on how to determine the initial values of a0, a1, and a2.
Every periodicity embedded in the time series corresponds to a set of three parameter values, where the periodicity is determined by applying the iterative process to the original time series with the limiting condition of maintaining the angular frequency a1 inside a restricted domain of the allowed interval of angular frequencies. Moreover, this method provides the standard deviation for each parameter obtained by the iterative least square fit of the time series. Rigozzo et al. (2005) describe this methodology in detail and compare it to other classical spectral analyses.
The advantage of this method over the Fourier method is that it is able to find periodicities associated with long trends. In other words, it fits senoidal functions in the signal. In addition, if only a segment of a sine function fits the original signal, it is possible to determine the period of this trend using ARIST. On the other hand, in the Fourier method, long trends are bounded by the finite length of the time series.
3.2 Wavelet method
The wavelet transform is an useful tool for non-stationary signal analysis. It permits the local identification of spectral content of a certain time series in time and in space (Kumar and Foufoula-Georgiou, 1997; Torrence and Compo, 1998; Percival and Walden, 2000).
The continuous wavelet transform (CWT) of a time series is defined as the convolution between the series and the scaled and translated version of the chosen wavelet function. By varying the wavelet timescale and translating the scaled versions of the wavelet mother, it is possible to build a two-dimensional spectrogram showing the time versus frequency (period), and how they vary with time.
The CWT of a time series f is defined by the integral transform,
where * represents the complex conjugate and the pre-factor |a|½ is introduced in order to guarantee that all the scaled functions have the same energy in the 𝕃2(ℝ) sense. This function W(a,b) represents the wavelet coefficients that is a function of both time and frequency (time b and scale a).
In this work, we used an updated version of the CWT algorithm of Torrence and Compo (1998). The Morlet wavelet function is chosen because it represents the best compromise between time and frequency concentration as established by Heisenberg's uncertainty principle; see Kumar and Foufoula-Georgiou (1997) for more details. It is important to mention that due to the limitation of the signal length, the border effects are treated here using the symmetrization method; see chapter 8 of Strang and Nguyen (1996) for more details. This method assumes that signals can be recovered outside their original support by symmetric boundary value replication. This method has the disadvantage of introducing discontinues at the borders; however, it works well in general. Moreover, there is no loss of response due to wavelet truncation, and the cone of influence is not needed.
The wavelet cross-correlation is also used because the wavelet cross power indicates the scale of high correlation between two time series with indices 1 and 2 (see Torrence and Compo, 1998; Percival and Walden, 2000, for more details). Therefore, the wavelet cross-correlation to study the correlation between a pair of data sets as a function of scale a and time t is given by
where , Wi are the wavelet coefficients, and is the arithmetic mean in time for i=1 or 2.
The wavelet cross-correlation will allow us to check the interaction between two sets of dendrochronological data for each considered timescale.
The Sun is both an element and a climate forcing. Therefore, solar cycles presented in the dendrochronological series will be re-analyzed because many periods found in these series may be possibly due to a combination of solar cycle harmonics. As for example, the periods of ∼ 17 to ∼ 18 years (Saros cycle) and ∼ 30 to ∼ 35 years (Brückner cycle) can also be found in the climatological series. Moreover, Gusev (2011) discussed that the climatic variations are forced oscillations driven by solar forcing, and consequently, it implies the existence of intrinsic climatic oscillations related to solar activity. As aforementioned, the main focus of this paper is to study the nonlinear behavior of the solar activity and their correlation with the variability of climate conditions. Due to this fact, we will divide Sect. 4 into two subsections: solar influences and climate influences.
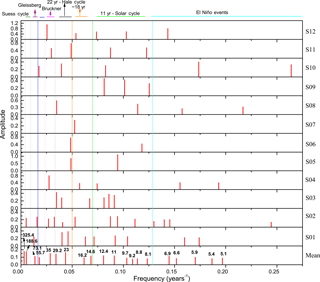
Figure 3Amplitude spectra for each tree-ring thickness sample at a confidence of 95 % from S01 to S12 (top 12 panels) and the average of them (bottom panel).
4.1 Solar influences
The amplitude spectra for each tree-ring thickness time series using the ARIST at a confidence level of 95 % are shown in Fig. 3. These spectra are related to the tree-ring thickness time series shown in Fig. 1.
It is possible to see the presence of some well-known periodicities related to the solar activity. The solar activity presents several sub-intervals including the Schwabe cycle which corresponds to a period bandwidth of 8–13 years, the cycle of ∼ 11 years related to the sunspot number variability, and the Hale cycle of 20–29 years related to the magnetic solar cycle of 22 years. The Gleissberg cycle of 70–90 years can also been seen (Kivelson and Russell, 1995; Hoyt and Schatten, 1997). This spectral analysis of each tree individual sample related to the solar activity was not done by Rigozo et al. (2008).
Several authors (e.g., Currie, 1973; Radoski et al., 1975; Courtillot et al., 1977; Clúa de Gonzalez et al., 1993; Juckett, 2001; Prestes et al., 2006, 2011) applied different analysis techniques (Fourier analysis, maximum entropy, and multitaper method) to determine the spectral content of the sunspot number time series. Their main results include a low period cycle of 5.5 years; a variable solar cycle of 11 years, which may appear with lower or higher periods between ∼ 8 and ∼ 13 years depending upon on the decadal time interval used in the analysis; and a cycle of ∼ 90 years, which is also frequently present in the sunspot number series (Herman and Goldberg, 1978). Considering the solar cycles from 11 to 22, an average period of 9.67 years can be found; therefore, it explains why the period may vary between 9 and 11 years (Kivelson and Russell, 1995).
In dendrochronological series, similar results were found by many authors (Murphy, 1990, 1991; Rigozo et al., 2004; Nordemann et al., 2005; Vincent et al., 2007; Muraki et al., 2011; Wang and Zhang, 2011; Lorensi, 2016). Murphy (1990, 1991) analyzed tree-ring time series obtained in Australia and Taiwan and found periods related to the solar cycle of 11 years between 9.3 and 13.3 years, and between 11.1 and 13.6 years, respectively. In the South Brazil region, Rigozo et al. (2004) studied tree rings collected in Concórdia, and they found periods of 10.6 and 83.4 years, which corresponds to the solar cycle of 11 years and the Gleissberg cycle of ∼ 80 years, respectively. Nordemann et al. (2005) performed a study using tree-ring chronology obtained in Brazil and Chile. The Brazilian tree samples showed periodicities of 79, 51.3, 23.7, and 10.5 years relating to solar activity, while the tree-ring samples collected in Chile showed periodicities of 197, 89.6, 50.3, 11.8, and 10.5 years. Another study using Araucaria angustifolia samples collected in General Carneiro, Irani, and Fazenda Rio Grande in South Brazil was performed by Lorensi (2016). In this study, periodicities related to solar cycle of 11 years, 22 years, and longer periods such as the Gleissberg cycle were found. Muraki et al. (2011) studied tree-ring growth using 391-year-old cedar samples collected in Japan, and they found periodicities of 25 and 12 years. These authors concluded that tree growth rate can be influenced by solar activity. Periodicities between 20 and 28 years were also found by Muraki et al. (2011) in Araucaria columnaris samples from New Caledonia. Wang and Zhang (2011) found periodicities around 204, 73, 20.5, 11.2–11.1, and 5.3–5.1 years performing spectral analysis using samples from the mountains of Tibet, which correspond to Suess, Gleissberg, Hale cycle and second harmonic of the Schwabe cycle, respectively.
In Rigozo et al. (2008), the periodicities found in the tree rings collected in Passo Fundo were also mainly attributed to the solar variability. The periods between 8.1 and 12.4 years were related to solar cycle of 11 years, while the period of 23.0 year was related to the Hale cycle. They suggested that the period of 55.7 years might be related to the fourth harmonic of the Suess cycle as discussed by Damon et al. (1997). On the other hand, they suggested that the period of 73.1 years was attributed to the Gleissberg cycle, and the period of 188.6 years was attributed to the Suess cycle of 200 years. In the bottom panel of Fig. 3, all the aforementioned periodicities related to solar activity can be observed, in addition to each of the 12 dendrochronological series obtained in Passo Fundo, although they are not so evident as in their average series.
For a paleoclimatic study, Raspopov et al. (2011) used fossil trees of ∼ 70 000 years old (380 rings) and ∼ 12 000 years old (120 rings). Using the fossil of ∼ 70 000 years old, the researchers found periodicities of 8–10, 20–22, and 100–120 years that correspond to Schwabe, Hale, and Gleissberg cycles, respectively. Using a ∼ 12 000-year-old fossil, periodicities of 4, 9–12 (Schwabe cycle), 17 (lunar cycle), and 31–34 years (Brückner cycle) were found.
Fossil trees of ∼ 50 000 years and living trees obtained in Chile were analyzed by Roig et al. (2001). They found similar spectral periodicities between these two data sets, such as 136–153, 81–94, and 47–53 years and periods of 35, 24, 17.8, 11.8, 6.6, 5.1, 4.58, 4.3, 3.7, 3.2, and 2.77 years. This indicates that similar factors may affect the radial growth of these trees since the end of the Pleistocene. These authors related the periods of 81–94, 24, and 11.8 years to the solar modulation.
However, the cycles of 7 and 8 years found in the tree-ring chronological series could be related to two beating solar/climatic cycles as discussed by Hoyt and Schatten (1997). It is well known that a combination of wave oscillation patterns between various forcing frequencies can be obtained as a response of the nonlinearity interactions as discussed by Le Treut and Ghil (1983). The nonlinearity wave oscillation patterns are the response to additive and multiplicative periodic forcing fo, so they are composed of the harmonic of the forcing fh and their combination, for example fo+fh, fo−fh, and fo+2fh, among many others.
For Raspopov et al. (2000, 2001), the Brückner cycle is a result of solar activity nonlinear effects in the terrestrial environment. They found that the combination of the Gleissberg cycle (∼ 90 years) and the Hale cycle (22 years) may result in the Brückner cycle () or in the Saros lunar cycle (). Therefore, Raspopov et al. (2000, 2001) concluded that the periods of between ∼ 17 and ∼ 18 and ∼ 30 and ∼ 35 years might also be a result of solar activity nonlinear effect in atmospheric processes. Kurths et al. (1993) showed that the combinations of two periods of 12.6 and 17.1 year could generate periods of 7.3 and 47.9 years as mathematical described by the following equations: , and .
Once more, in the average chronology obtained in Passo Fundo (bottom panel of Fig. 3), we observe that the period of 6.6 and 35 years may be the beat period (the rate of alternation between constructive and destructive wave interference) results from the periods of 11 and 16.2 years, [] and [], respectively, as discussed by Raspopov et al. (2000, 2001). In the same way, the periods of 17.5 and 33.5 years may also be a result from the beat period of 23 and 73.1 years, [] and [], respectively.
Moreover, Gusev (2011) analyzed the natural climatic oscillations driven by solar activity. The author verified that variations in climatic parameters do not always occur synchronously with the corresponding 11- and 22-year solar cycles. Based on this analysis, we apply a period bandwidth filter of 8–13 years in the tree-ring width average and in the sunspot number series, as shown in Fig. 4. We observe that the phase shift between tree rings and sunspot variations is variable, and it changes with time from 0 to 180∘. The phase shift occurs when there is a significant change in the sunspot number amplitude, as can be observed in Dalton minimum (1794–1824). Therefore, our result of tree-ring width and solar variation analysis behaves in the same way as reported by Gusev (2011).
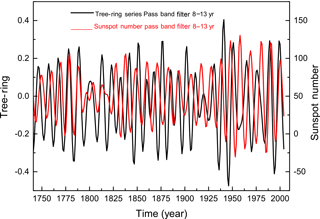
Figure 4Signals filtered of the mean width of tree-ring series and sunspot number between 8 and 13 years.
In addition, Gusev (2011) and Gusev and Martin (2012) showed that the profile features between climatic parameters and sunspot number can be reproduced by a forced oscillation equation using a driving force term that describes the variation of the sunspot number with a period varying from 16 to 70 years. This forced oscillation equation also describes the presence of natural climatic oscillations with periods above 30 years, which possibly correspond to the Brückner cycle usually observed in the variations of some climatic parameters such as precipitation and temperature.
It is also possible that the correlation and the phase shift between tree-ring width and the sunspot number series can be due to the modulation of the cloudiness (Dengel et al., 2009). This modulation can be caused by the cosmic ray ionization, which increases the diffuse radiation, and consequently, makes the photosynthetic production more efficient (see Urban et al., 2007; Dengel et al., 2009, and references therein). Inoue et al. (1979) showed that the tree growth is greater when it is not under extremely shady conditions compared to full daylight conditions. Their study was based on the daily photosynthetic production of each plant using Araucaria angustifolia specimen in the juvenile stage. However, the ratio of the strength between the effect of cosmic rays and the climate (UV light) may be about 1 : 10, and therefore the effect of cosmic rays is minor.
4.2 Climate influences
Other period intervals observed in Fig. 3 may also be related to the climate influences, such as the El Niño and La Niña phenomena, which correspond to a period bandwidth of 2–7 years in each tree-ring amplitude spectrum. This phenomenon modifies global climate activity; however it does not have well-defined regularity (Oliveira, 1999).
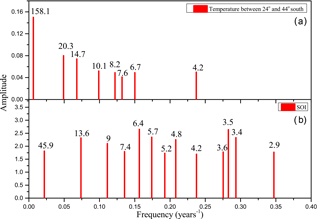
For this reason, spectral analysis using the ARIST is performed, in order to verify a possible cause–effect relationship between the periods found in the annual mean temperature and the SOI series, as shown in Fig. 5. The periods between 8.2 and 10.1 years in the temperature data may be related to solar cycle of 11 years, while the period of 20.3 years may be related to the Hale cycle. The period of 158.1 years may be related to the second harmonic of the 328 years found by Rigozo et al. (2008) in the sunspot number data. The lower periods of 4.2, 6.7, and 7.6 years in the temperature data can be attributed to the effects of the El Niño events because they are related to the periods of 4.2, 6.4, and 7.4 years in the SOI data. These results agree with the El Niño model discussed by Guilyardi (2006). In that paper, the El Niño model is assessed in terms of the two modes: first – the sea surface temperature mode, which implies low-amplitude El Niño events with a frequency of 2–3 years; second – the thermocline mode, which involves the western Pacific circulation, and consequently, implies large-amplitude El Niño events with a frequency of 4–5 years.
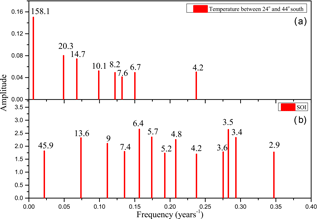
Figure 6Morlet cross-wavelet map between the annual mean temperature anomaly, between 24 and 44∘ S, and the tree-ring average chronology. The contour plot represents the significance levels for 95 %. Panel (b) presents the global wavelet spectrum, which is defined as the wavelet coefficients power average for each scale, i.e., it corresponds to a Fourier spectrum.
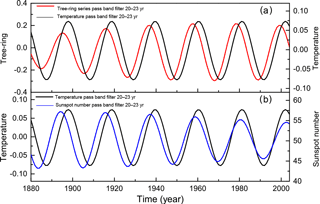
Figure 7(a) Signals filtered of the mean width of tree-ring series and annual mean temperature anomaly (from 24 to 44∘ S); (b) annual mean temperature anomaly (from 24 to 44∘ S) and sunspot number, between 20 and 23 years.
As discussed by Rigozo et al. (2008), it is possible to quantify every frequency detected (Pi) in the signal by obtaining a power fraction (fP, where ) of this frequency related to the total spectrum (sum of all powers found). Therefore, Table 1 presents the power fraction of every frequency signal found in relation to the total signal spectrum for both the annual mean temperature and the SOI presented in Fig. 5. We observe that 25 % of the fP of the annual mean temperature (between 4.2 and 7.6 years) is related to the SOI periodicities (between 2.9 and 7.4 years). In other words, the El Niño phenomenon represents a total of 25 % of the spectral temperature signal. This result is consistent with the study on trees 391-year-old trees in Japan of Muraki et al. (2011), who found lower periods than the solar cycles and related them to ENSO events.
Table 1Power fraction of the frequency found in the mean width of tree-ring series and annual mean temperature anomaly and SOI signals.
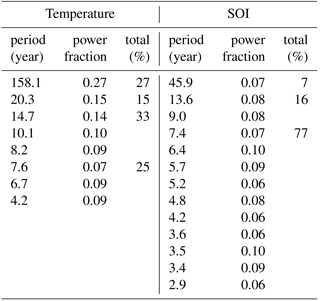
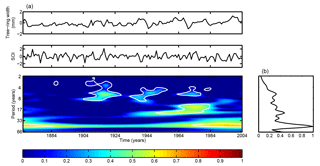
Figure 8Morlet cross-wavelet map between tree-ring average chronology collected in Passo Fundo and the SOI. The contour plot represents the significance levels for 95 %. Panel (b) presents the global wavelet spectrum, which is defined as the wavelet coefficients power average for each scale, i.e., it corresponds to a Fourier spectrum.
In order to correlate the influence of the temperature on the tree-ring width growth, the Morlet cross-wavelet transform was performed in the annual mean temperature anomaly (from 24 to 44∘ S) and tree-ring average chronology was collected in Passo Fundo (Fig. 6). The results show lower periods, between 4 and 8 years, occurring during 1910–1935, and the period of ∼ 12 years appears between 1944 and 1974, while the period of ∼ 22 years is present during the entire data interval. Some studies showed that the periodicities of 11, 22, and 90 years found in temperature time series are related to the solar activity (Raspopov et al., 2004; Gusev, 2011; Gusev and Martin, 2012). Moreover, we observe the strong relationship between the temperature and tree-ring growth in ∼ 1917, when the lowest temperature value is observed. This decrease in temperature is also followed by a decrease of the tree-ring growth.
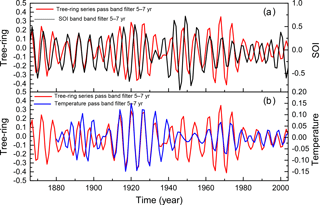
Figure 9(a) Signals filtered of the mean width of tree-ring series and annual mean temperature anomaly (from 24 to 44∘ S); (b) annual mean temperature anomaly (from 24 to 44∘ S) and sunspot number, between 5 and 7 years.
Similar to the analysis done in Fig. 4, Fig. 7 shows the tree-ring time series, the annual mean temperature anomaly (from 24 to 44∘ S) series, and the sunspot number series filtered using a period bandwidth of 20 to 23 years. A lag of 3 years between the tree-ring growth and the temperature during 1880 to 2004 is observed, whereas between the temperature and the sunspot, the phase variably shifts with time, changing from 4 years to 0 along the interval studied. The reverse behavior is observed between the tree rings and the sunspot number which corresponds to the red line and blue line in Fig. 7, respectively. We can see that the phase shifts with time from 0 to 4 years. The results of the Morlet cross-wavelet scalogram of SOI and tree-ring chronology obtained in Passo Fundo are shown in Fig. 8. These results indicate mainly a presence of periods between 4 and 8 years during the time interval of ∼ 1910 to ∼ 1925, ∼ 1930 to ∼ 1955, and ∼ 1965 to ∼ 1975; and a period of ∼ 17 years during ∼ 1945 to ∼ 1985. The same kind of result was found by Rigozo et al. (2003) using wavelet techniques. They studied the periodicities of ENSO presented in the tree rings in the region of South Brazil, and they found periods between 2 and 8 years in their data showing non-stationary behavior.
The time series of tree-ring growth from Passo Fundo, the SOI, and the temperature anomaly (from 24 to 44∘ S) are usually filtered in the interval of 5–7 years, in order to find better correlations in their global wavelet spectrum and cross-wavelet analysis. This interval is chosen because it may be related to the El Niño/La Niña events. It is well known that during the occurrence of El Niño events, an excess of precipitation occurs in the South Brazil region, and the northern parts of Argentina and Uruguay. In contrast, the lowest level of precipitation takes place during the occurrence of La Niña (Rao and Hada, 1990; Grimm et al., 1998).
Figure 9a shows the tree-ring and the SOI series filtered between 5 and 7 years, while Fig. 9b shows the tree-ring and the temperature anomaly series filtered by the same bandwidth filter. The series of tree-ring growth and SOI show a phase and anti-phase shift throughout the years of 1866 and 2004. In the intervals of 1866–1900 and 1959–1982, these series are in phase, whereas in the intervals of 1900–1930 and 1982–2004, they are in anti-phase. In the interval of 1930–1959, there is a lag of one year between these two series. Similar behavior is observed between the series of tree-ring growth and temperature anomaly. These series of tree-ring growth and temperature anomaly are in anti-phase during the intervals of 1880–1906 and 1937–1950, and in phase during the intervals of 1906–1937 and 1950–2004.
Comparing the SOI to the temperature anomaly (black and blue curve in Fig. 9a and b, respectively), we observe that in the interval 1880–1930, both series are in anti-phase. This fact indicates that during the El Niño events (SOI negative) there is an increasing temperature tendency due to the highest precipitation levels. Rampelotto et al. (2012) showed that the rainfall and the temperature variability in Santa Maria, RS (29∘41′ S, 53∘48′ W) is related to the SOI variation, especially during El Niño events. Souza Echer et al. (2008) also found that the precipitation at Pelotas, RS (31∘46′19′′ S, 52∘20′33′′ W) is strongly influenced by the ENSO phenomenon. In summary, analyzing both graphs in Fig. 9, we observe that both the SOI and the temperature have strong influence on the araucaria growth in this region of Brazil, mainly when the temperature anomaly presents its greatest amplitude as shown in the interval of 1906–1937.
In this paper, 12 araucaria dendrochronological series from Passo Fundo are analyzed using the ARIST. Also, the global wavelet spectrum and the cross-wavelet analyses are performed in order to identify the non-stationary characteristics in tree-ring, temperature and SOI data. The principal results may be summarized as follows:
- i.
There is evidence of the solar cycle influence related to the cycles of Schwabe (∼ 11 years), Hale (∼ 22 years), and Gleissberg (∼ 70 to ∼ 90 years) in each dendrochronological series, and also in the dendrochronological average series.
- ii.
The cycles of ∼ 18 years (Saros lunar cycle) and of ∼ 30 to ∼ 35 years (Brückner climatic cycle) may be a combination between the Gleissberg cycle and the Hale cycle; they may be a result of the nonlinear effects of the solar activity in the terrestrial environment.
- iii.
There is evidence in the temperature and in the SOI analysis that some of their natural climatic oscillation may be driven by solar activity.
- iv.
In total, 25 % of the temperature spectral content is related to the periodicities between ∼ 4 and ∼ 7 years, which are related to the El Niño/La Niña phenomena.
- v.
A 20–23-year bandwidth period is found in the dendrochronological series, and it is well correlated with the temperature anomaly (from 24 to 44∘ S), but it has a phase lag of ∼ 3 years.
- vi.
In addition, the rainfall and the temperature variability in Passo Fundo seem to also be related to the SOI variation (sometimes in phase or in anti-phase) for the bandwidth corresponding to the El Niño/La Niña phenomena.
In summary, these results indicate that the variability in tree-ring growth of Araucaria angustifolia is closely related to the variation of temperature and precipitation. This fact is possibly due to the nonlinear effects of Sun variability, and to the El Niño–Southern Oscillation in the climate system over South Brazil. Therefore, it should be further investigated.
The annual mean temperature was obtained from Goddard Institute for Space Studies (GISS), NASA, https://data.giss.nasa.gov/ (last access: January 2017). The SOI index was obtained from Climatic Research Unit (CRU), https://crudata.uea.ac.uk/cru/data/soi/ (last access: January 2017). The dendrochronological series can be obtained under request to Alan Prestes (aprestes@gmail.com).
The authors declare that they have no conflict of interest.
This article is part of the special issue “Space weather connections to near-Earth space and the atmosphere”. It is a result of the 6∘ Simpósio Brasileiro de Geofísica Espacial e Aeronomia (SBGEA), Jataí, Brazil, 26–30 September 2016.
A. Prestes was supported by FAPESP (2009/02907-8) and CNPq (301441/2013-8).
Virginia Klausner wishes to thank CNPq for the financial support for her
postdoctoral research (grant 165873/2015-9). The authors express their
appreciation to the late Nivaor Rodolfo Rigozo and the late
Daniel Jean Roger Nordemann, whose contributions to this work were of great
significance. Furthermore, the authors would like to thank GISS and CRU for the data sets used in
this work.
The topical editor, Alisson
Dal Lago, thanks Maurício Bolzan and one anonymous referee for help in
evaluating this paper.
Ammons, R., Ammons, A., and Ammons, R. B.: Solar Activity Related Quasi-Cycles in Tertiary Tree-Ring Records: Evidence and Methodological Studies, in: Weather and Climate Responses to Solar Variations, edited by: McCormac, B. M., p. 535, Colorado Associated University Press, 1983. a
Andreacci, F., Botosso, P., and Galvão, F.: Sinais climáticos em anéis de crescimento de Cedrela Fissilis em diferentes tipologias de Florestas Ombrófilas do Sul do Brasil, Floresta, 44, 323–332, https://doi.org/10.5380/rf.v44i2.27316, 2013. a, b
Berlato, M. and Fontana, D.: El Niño e La Niña: impactos no clima, na vegetação e na agricultura do Rio Grande do Sul: aplicações de previsões climáticas na agricultura, Editora da UFRGS, 2003. a
Case, R. A. and MacDonald, G. M.: A dendroclimatic reconstruction of annual precipitation on the western Canadian prairies since AD 1505 from Pinus flexilis James, Quaternary Res., 44, 267–275, https://doi.org/10.1006/qres.1995.1071, 1995. a
Clúa de Gonzalez, A. L., Gonzalez, W. D., Dutra, S. L. G., and Tsurutani, B. T.: Periodic variation in the geomagnetic activity: A study based on the Ap index, J. Geophys. Res.-Space, 98, 9215–9231, https://doi.org/10.1029/92JA02200, 1993. a
Courtillot, V., Le Mouel, J. L., and Mayaud, P. N.: Maximum entropy spectral analysis of the geomagnetic activity index aa over a 107-year interval, J. Geophys. Res., 82, 2641–2649, https://doi.org/10.1029/JA082i019p02641, 1977. a
Currie, R. G.: Geomagnetic line spectra – 2 to 70 years, Astrophys. Space Sci., 21, 425–438, https://doi.org/10.1007/BF00643106, 1973. a
Damon, P. E., Eastoe, C. J., Hughes, M. K., Kalin, R. M., Long, A., and Peristykh, A. N.: Secular Variation of Δ14C During the Medieval Solar Maximum: A Progress Report, Radiocarbon, 40, 343–350, https://doi.org/10.1017/S003382220001821X, 1997. a
D'Arrigo, R., Jacoby, G., Frank, D., Pederson, N., Cook, E., Buckley, B., Nachin, B., Mijiddorj, R., and Dugarjav, C.: 1738 years of Mongolian temperature variability inferred from a tree-ring width chronology of Siberian pine, Geophys. Res. Lett., 28, 543–546, https://doi.org/10.1029/2000GL011845, 2001. a
Dengel, S., Aeby, D., and Grace, J.: A Relationship between Galactic Cosmic Radiation and Tree Rings, New Phytol., 184, 545–551, https://doi.org/10.1111/j.1469-8137.2009.03026.x, 2009. a, b
Dorotovič, I., Louzada, J. L., Rodrigues, J. C., and Karlovský, V.: Impact of solar activity on the growth of pine trees: case study, Eur. J. For. Res., 133, 639–648, https://doi.org/10.1007/s10342-014-0792-8, 2014. a
Fritts, H. (Ed.): Chapter 9 – Reconstructing Spatial Variations in Climate, in: Tree Rings and Climate, 434–505, Academic Press London, New York, 1976. a, b
Gelcer, E., Fraisse, C., Dzotsi, K., Hu, Z., Mendes, R., and Zotarelli, L.: Effects of El Niño Southern Oscillation on the space-time variability of Agricultural Reference Index for Drought in midlatitudes, Agr. Forest Meteorol., 174–175, 110–128, https://doi.org/10.1016/j.agrformet.2013.02.006, 2013. a
Grimm, A. M., Ferraz, S. E. T., and Gomes, J.: Precipitation Anomalies in Southern Brazil Associated with El Niño and La Niña Events, J. Climate, 11, 2863–2880, https://doi.org/10.1175/1520-0442(1998)011<2863:PAISBA>2.0.CO;2, 1998. a
Guilyardi, E.: El Niño–mean state–seasonal cycle interactions in a multi-model ensemble, Clim. Dynam., 26, 329–348, https://doi.org/10.1007/s00382-005-0084-6, 2006. a
Gusev, A. A.: Natural climatic oscillations driven by solar activity, Geomagn. Aeronomy, 51, 131–138, 2011. a, b, c, d, e
Gusev, A. A. and Martin, I. M.: Possible evidence of the resonant influence of solar forcing on the climate system, J. Atmos. Sol.-Terr. Phy., 80, 173–178, https://doi.org/10.1016/j.jastp.2012.01.008, 2012. a, b
Herman, J. R. and Goldberg, R. A.: Sun, Weather, and Climate, Scientific and Technical Information Branch, NASA SP-426, University Press of the Pacific, USA, 1978. a
Hoyt, D. V. and Schatten, K. H.: The Role of the Sun in Climate Change, Oxford University Press, 288 pp., 1997. a, b
Inoue, M. T., Galvão, F., and Torres, D. V.: Estudo ecofisiológico sobre Araucaria angustifolia (Bert.) O. Ktze.: Fotossíntese em dependência à luz no estágio juvenil, Revista Floresta, 10, 5–9, https://doi.org/10.5380/rf.v10i1.6239, 1979. a
Jacoby, G., Pederson, N., and D'Arrigo, R.: Temperature and Precipitation in Mongolla Based on Dendroclimatic Investigations, Chinese Sci. Bull., 48, 1474, https://doi.org/10.1360/02wd0390, 2003. a
Juckett, D. A.: Period and phase comparisons of near-decadal oscillations in solar, geomagnetic, and cosmic ray time series, J. Geophys. Res.-Space, 106, 18651–18665, https://doi.org/10.1029/2000JA000367, 2001. a
Kivelson, M. G. and Russell, C. T.: Introduction to Space Physics, Cambridge University Press, 588 pp., 1995. a, b
Kononov, Y. M., Friedrich, M., and Boettger, T.: Regional Summer Temperature Reconstruction in the Khibiny Low Mountains (Kola Peninsula, NW Russia) by Means of Tree-ring Width during the Last Four Centuries, Arct. Antarct. Alp. Res., 41, 460–468, https://doi.org/10.1657/1938-4246-41.4.460, 2009. a
Kumar, P. and Foufoula-Georgiou, E.: Wavelet analysis for geophysical applications, Rev. Geophys., 35, 385–412, https://doi.org/10.1029/97RG00427, 1997. a, b
Kurths, J., Spiering, C., Müller-Stoll, W., and Striegler, U.: Search for solar periodicities in Miocene tree ring widths, Terra Nova, 5, 359–363, https://doi.org/10.1111/j.1365-3121.1993.tb00269.x, 1993. a
Le Treut, H. and Ghil, M.: Orbital forcing, climatic interactions, and glaciation cycles, J. Geophys. Res.-Oceans, 88, 5167–5190, 1983. a
Lisi, C. S., Roig, F. A., Voigt, A. R. A., Maria, V. R. B., Fo, M. T., Ferreira-Fedele, L., and Botosso, P. C.: Tree-Ring Formation, Radial Increment Periodicity, and Phenology of Tree Species from a Seasonal Semi-Deciduous Forest in Southeast Brazil, IAWA J., 29, 189–207, 2008. a, b
Lorensi, C.: Resposta dos anéis de crescimento de Araucaria angustifolia(Bertol.) O. Kuntze da região sul do Brasil aos forçantes geofísicos e climáticos, PhD thesis, Universidade do Vale do Paraíba – UNIVAP, Instituto de Pesquisa e Desenvolvimento Programa de Pós-Graduação em Física e Astronomia, 2016. a, b, c, d
Lorensi, C. and Prestes, A.: Dendroclimatological reconstruction of spring-summer precipitation for Fazenda Rio Grande, PR, with samples of Araucaria angustifolia (Bertol.) Kuntze, Revista Árvore, 40, 347–354, 2016. a, b, c, d
Mori, Y.: Evidence of an 11-year periodicity in tree-ring series from formosa related to the sunspot cycle, J. Climatol., 1, 345–353, https://doi.org/10.1002/joc.3370010407, 1981. a
Muraki, Y., Masuda, K., Nagaya, K., Wada, K., and Miyahara, H.: Solar variability and width of tree ring, Astrophys. Space Sci. Trans., 7, 395–401, https://doi.org/10.5194/astra-7-395-2011, 2011. a, b, c, d
Muraki, Y., Mitsutani, T., Shibata, S., Kuramata, S., Masuda, K., and Nagaya, K.: Regional climate pattern during two millennia estimated from annual tree rings of Yaku cedar trees: a hint for solar variability?, Earth Planets Space, 67, 31, https://doi.org/10.1186/s40623-015-0198-y, 2015. a
Murphy, J. O.: Australian tree ring chronologies as proxy data for solar variability, Proceedings of the Astronomical Society of Australia, 8, 292–297, https://doi.org/10.1017/S1323358000023560, 1990. a, b
Murphy, J. O.: The Downturn in Solar Activity during Solar Cycles 5 and 6, Publ. Astron. Soc. Aust., 9, 330–331, https://doi.org/10.1017/S1323358000024425, 1991. a, b
Nordemann, D., Rigozo, N., and de Faria, H.: Solar activity and El-Niño signals observed in Brazil and Chile tree ring records, Adv. Space Res., 35, 891–896, https://doi.org/10.1016/j.asr.2005.03.151, 2005. a, b, c
Oliveira, G. S.: O El Niño e você: o fenômeno climático, Transtec Editorial, São José dos Campos, SP, Brazil, 1999. a
Oliveira, J. M., Santarosa, E., Pillar, V. D., and Roig, F. A.: Seasonal cambium activity in the subtropical rain forest tree Araucaria angustifolia, Trees, 23, 107–115, https://doi.org/10.1007/s00468-008-0259-y, 2009. a, b, c
Pagotto, M. A., Roig, F. A., de Souza Ribeiro, A., and Lisi, C. S.: Influence of regional rainfall and Atlantic sea surface temperature on tree-ring growth of Poincianella pyramidalis, semiarid forest from Brazil, Dendrochronologia, 35, 14–23, https://doi.org/10.1016/j.dendro.2015.05.007, 2015. a, b
Percival, D. B. and Walden, A. T.: Wavelet Methods for Time Series Analysis, Cambridge Series in Statistical and Probabilistic Mathematics, Cambridge University Press, 2000. a, b
Perone, A., Lombardi, F., Marchetti, M., Tognetti, R., and Lasserre, B.: Evidence of solar activity and El Niño signals in tree rings of Araucaria araucana and A. angustifolia in South America, Global Planet. Change, 145, 1–10, https://doi.org/10.1016/j.gloplacha.2016.08.004, 2016. a, b, c
Prestes, A., Rigozo, N., Echer, E., and Vieira, L.: Spectral analysis of sunspot number and geomagnetic indices (1868–2001), J. Atmos. Sol.-Terr. Phy., 68, 182–190, https://doi.org/10.1016/j.jastp.2005.10.010, 2006. a
Prestes, A., Rigozo, N. R., Nordemann, D. J. R., Wrasse, C. M., Souza Echer, M. P., Echer, E., da Rosa, M. B., and Rampelotto, P. H.: Sun-earth relationship inferred by tree growth rings in conifers from Severiano De Almeida, Southern Brazil, J. Atmos. Sol.-Terr. Phy., 73, 1587–1593, https://doi.org/10.1016/j.jastp.2010.12.014, 2011. a, b, c, d
Prestes, A., Rigozo, N. R., Nordemann, D. J. R., Echer, E., Vieira, L. E. A., Souza Echer, M. P., Wrasse, C. M., and Guarnieri, F. L.: Imprint of Climate Variability on Mesozoic Fossil Tree Rings: Evidences of Solar Activity Signals on Environmental Records Around 200 Million Years Ago?, Pure Appl. Geophys., 171, 1983–1991, https://doi.org/10.1007/s00024-013-0726-2, 2014. a, b, c
Radoski, H. R., Fougere, P. F., and Zawalick, E. J.: A comparison of power spectral estimates and applications of the maximum entropy method, J. Geophys. Res., 80, 619–625, https://doi.org/10.1029/JA080i004p00619, 1975. a
Rampelotto, P., Rigozo, N., da Rosa, M., Prestes, A., Frigo, E., Echer, M. S., and Nordemann, D.: Variability of rainfall and temperature (1912–2008) parameters measured from Santa Maria (29∘41′ S, 53∘48′ W) and their connections with ENSO and solar activity, J. Atmos. Sol.-Terr. Phy., 77, 152–160, https://doi.org/10.1016/j.jastp.2011.12.012, 2012. a
Rao, V. B. and Hada, K.: Characteristics of rainfall over Brazil: Annual variations and connections with the Southern Oscillation, Theor. Appl. Climatol., 42, 81–91, https://doi.org/10.1007/BF00868215, 1990. a
Raspopov, O., Dergachev, V., Shumilov, O., Kolstrom, T., Lindholm, M., Merilainen, J., Eggertsson, O., Vasiliev, S. S., Kuzmin, A., Yu Kirtsidely, I., and Kasatkina, E.: Dendrochonological evidence of long-term variations in solar activity and climate, in: International Conference Tree Rrings and People – Abstracts, edited by: Kaennel, D. M. and Bräker, O. U., Swiss Federal Research Institute WSL, Davos, 22–26, 2001. a, b, c
Raspopov, O., Dergachev, V., and Kolström, T.: Periodicity of climate conditions and solar variability derived from dendrochronological and other palaeoclimatic data in high latitudes, Palaeogeogr. Palaeocl., 209, 127–139, https://doi.org/10.1016/j.palaeo.2004.02.022, 2004. a
Raspopov, O., Dergachev, V., Ogurtsov, M., Kolström, T., Jungner, H., and Dmitriev, P.: Variations in climate parameters at time intervals from hundreds to tens of millions of years in the past and its relation to solar activity, J. Atmos. Sol.-Terr. Phy., 73, 388–399, https://doi.org/10.1016/j.jastp.2010.02.012, 2011. a, b
Raspopov, O. M., Shumilov, O., Kasatkina, E. A., Turunen, E., and Lindholm, M.: 35-year Climatic Bruckner Cycle – Solar Control of Climate Variability?, in: The Solar Cycle and Terrestrial Climate, Solar and Space weather, edited by: Wilson, A., Vol. 463 of ESA Special Publication, p. 517, 2000. a, b, c
Rigozo, N. R., Prestes, A., Nordemann, D. J. R., da Silva, H. E., Souza Echer, M. P., and Echer, E.: Solar maximum epoch imprints in tree-ring width from Passo Fundo, Brazil (1741–2004), J. Atmos. Sol.-Terr. Phy., 70, 1025–1033, 2008. a, b, c, d, e, f, g, h, i, j, k, l, m, n, o, p
Rigozo, N. R. and Nordemann, D. J. R.: Iterative regression analysis of periodicities in geophysical record time series, Revista Brasileira de Geofísica, 16, 149–158, https://doi.org/10.1590/S0102-261X1998000200004, 1998. a
Rigozo, N. R., Vieira, L. E. A., Echer, E., and Nordemann, D. J. R.: Wavelet Analysis of Solar-ENSO Imprints in Tree Ring Data from Southern Brazil in the Last Century, Climatic Change, 60, 329–340, https://doi.org/10.1023/A:1026048124353, 2003. a
Rigozo, N. R., Nordemann, D. J. R., Echer, E., and Vieira, L. E. A.: Search for Solar Periodicities in Tree-ring Widths from Concórdia (S.C., Brazil), Pure Appl. Geophys., 161, 221–233, https://doi.org/10.1007/s00024-003-2427-8, 2004. a, b
Rigozo, N. R., Echer, E., Nordemann, D. J. R., Vieira, L. E. A., and de Faria, H. H.: Comparative study between four classical spectral analysis methods, Appl. Math. Comput., 168, 411–430, https://doi.org/10.1016/j.amc.2004.09.031, 2005. a, b
Rigozo, N. R., Jean Roger Nordemann, D., Echer, E., Evangelista da Silva, H., Pereira de Souza Echer, M., and Prestes, A.: Solar and climate imprint differences in tree ring width from Brazil and Chile, J. Atmos. Sol.-Terr. Phy., 69, 449–458, https://doi.org/10.1016/j.jastp.2006.10.013, 2007a. a, b
Rigozo, N. R., Nordemann, D. J. R., Souza Echer, M. P., Echer, E., da Silva, H. E., Prestes, A., and Guarnieri, F. L.: Solar activity imprints in tree ring width from Chile (1610–1991), J. Atmos. Sol.-Terr. Phy., 69, 1049–1056, https://doi.org/10.1016/j.jastp.2007.03.010, 2007b. a, b
Roig, F. A., Le-Quesne, C., Boninsegna, J. A., Briffa, K. R., Lara, A., Grudd, H., Jones, P. D., and Villagrán, C.: Climate variability 50,000 years ago in mid-latitude Chile as reconstructed from tree rings, Nature, 410, 567–570, https://doi.org/10.1038/35069040, 2001. a
Salzer, M. W. and Kipfmueller, K. F.: Reconstructed temperature and precipitation on a millennial timescale from tree-rings in the southern Colorado Plateau, USA, Climatic Change, 70, 465–487, https://doi.org/10.1007/s10584-005-5922-3, 2005. a
Santos, G. M., Linares, R., Lisi, C. S., and Filho, M. T.: Annual growth rings in a sample of Paraná pine (Araucaria angustifolia): Toward improving the 14C calibration curve for the Southern Hemisphere, Quat. Geochronol., 25, 96–103, https://doi.org/10.1016/j.quageo.2014.10.004, 2015. a
Schöngart, J., Piedade, M. T. F., Ludwigshausen, S., Horna, V., and Worbes, M.: Phenology and stem-growth periodicity of tree species in Amazonian floodplain forests, J. Trop. Ecol., 18, 581–597, 2002. a
Schöngart, J., Junk, W. J., Piedade, M. T. F., Ayres, J. M., Hüttermann, A., and Worbes, M.: Teleconnection between tree growth in the Amazonian floodplains and the El Niño–Southern Oscillation effect, Glob. Change Biol., 10, 683–692, https://doi.org/10.1017/S0266467402002389, 2004. a
Shao, X., Huang, L., Liu, H., Liang, E., Fang, X., and Wang, L.: Reconstruction of precipitation variation from tree rings in recent 1000 years in Delingha, Qinghai, Sci. China Ser. D, 48, 939, https://doi.org/10.1360/03yd0146, 2005. a
Souza Echer, M. P., Echer, E., Nordemann, D. J., Rigozo, N. R., and Prestes, A.: Wavelet analysis of a centennial (1895–1994) southern Brazil rainfall series (Pelotas, 31∘46′19′′ S 52∘20′33′′ W), Climatic Change, 87, 489–497, https://doi.org/10.1007/s10584-007-9296-6, 2008. a
Strang, G. and Nguyen, T.: Wavelets and Filter Banks, 490 pp., Wellesley-Cambridge Press, USA, 1996. a
Therrell, M. D., Stahle, D. W., Ries, L. P., and Shugart, H. H.: Tree-ring reconstructed rainfall variability in Zimbabwe, Clim. Dynam., 26, 677, https://doi.org/10.1007/s00382-005-0108-2, 2006. a
Torrence, C. and Compo, G. P.: A Practical Guide to Wavelet Analysis, B. Am. Meteorol. Soc., 79, 61–78, https://doi.org/10.1175/1520-0477(1998)079<0061:APGTWA>2.0.CO;2, 1998. a, b, c
Urban, O., Janouš, D., Acosta, M., Czerný, R., Marková, I., Navrátil, M., Pavelka, M., Pokorný, R., Šprtová, M., Zhang, R., Špunda, V., Grace, J., and Marek, M.: Ecophysiological controls over the net ecosystem exchange of mountain spruce stand. Comparison of the response in direct vs. diffuse solar radiation, Glob. Change Biol., 13, 157–168, https://doi.org/10.1111/j.1365-2486.2006.01265.x, 2007. a
Vincent, L., Pierre, G., Michel, S., Robert, N., and Masson-Delmotte, V.: Tree-rings and the climate of New Caledonia (SW Pacific): Preliminary results from Araucariacae, Palaeogeogr. Palaeocl., 253, 477–489, https://doi.org/10.1016/j.palaeo.2007.06.019, 2007. a
Wang, X. and Zhang, Q.-B.: Evidence of solar signals in tree rings of Smith fir from Sygera Mountain in southeast Tibet, J. Atmos. Sol.-Terr. Phy., 73, 1959–1966, https://doi.org/10.1016/j.jastp.2011.06.001, 2011. a, b
Wolberg, J. R.: Prediction analysis, D. van Nostrand Company, Princeton, NJ, 304 pp., 1967. a


