the Creative Commons Attribution 4.0 License.
the Creative Commons Attribution 4.0 License.
 | 03 Apr 2018
Study of sporadic E layers based on GPS radio occultation measurements and digisonde data over the Brazilian region
Laysa C. A. Resende
Christina Arras
Inez S. Batista
Clezio M. Denardini
Thainá O. Bertollotto
Juliano Moro
This work presents new results about sporadic E-layers (Es layers) using GPS (global positioning system) radio occultation (RO) measurements obtained from the FORMOSAT-3/COSMIC satellites and digisonde data. The RO profiles are used to study the Es layer occurrence as well as its intensity of the signal-to-noise ratio (SNR) of the 50 Hz GPS L1 signal. The methodology was applied to identify the Es layer on RO measurements over Cachoeira Paulista, a low-latitude station in the Brazilian region, in which the Es layer development is not driven tidal winds only as it is at middle latitudes. The coincident events were analyzed using the RO technique and ionosonde observations during the year 2014 to 2016. We used the electron density obtained using the blanketing frequency parameter (fbEs) and the Es layer height (h'Es) acquired from the ionograms to validate the satellite measurements. The comparative results show that the Es layer characteristics extracted from the RO measurements are in good agreement with the Es layer parameters from the digisonde.
Keywords. Ionosphere (ionosphere–atmosphere interactions)
- Article
(1276 KB) - Full-text XML
- BibTeX
- EndNote


Sporadic layers (Es) are electron density enhancements which appear in the lower ionospheric E region at heights between 90 and 130 km with a typical thickness of less than 5 km. The layers consist mainly of metallic ions (Fe+, Mg+, Ca+ and Na+) deposited by meteoric ablation (Whitehead, 1961; Layzer, 1972). The metallic ions have longer lifetimes than the nonmetallic ionized air constituents (O+, NO+, O2+), which allow the formation of long-lasting sporadic E layers (Kopp, 1997). In the Brazilian low-latitude region, which is under the influence of the South American Magnetic Anomaly, the Es layer occurrence and its characteristics are highly variable is due to their formation mechanism, tidal winds, electric fields or particle precipitation (Batista and Abdu, 1977; Resende et al., 2013). Therefore, they are classified into several types designated by letters (“a”, “l”, “h”, “q”, “s”, “c”) according to their characteristics in the ionograms (Piggot and Rawer, 1972).
At middle latitudes, the well-accepted theory for Es layer formation is the wind shear process. According to this theory, Es layers consist mainly of metallic ions that are merged into thin sheets by vertical shears in the zonal wind with moderate inclination of magnetic field lines (Axford, 1963; Haldoupis, 2011). The largest wind shears are produced by atmospheric tides, mainly by diurnal and semidiurnal components (Pancheva et al., 2003; Arras et al., 2009). At low latitudes, although the electric field has influence in the Es layer formation (Dagar et al., 1977; Abdu et al., 2003, 2014; Carrasco et al., 2007), the wind shear mechanism produces Es layers around 100–130 km high. In fact, the Es layer in the Brazilian sector has similar features to the Es layer at middle latitudes, such as the downward movement following the tidal phases, which is observed in both ionograms and simulation results. Resende et al. (2017a, b) verified from sporadic E formation simulations that the diurnal tide provides the most effective wind shears in the Es layer formation process at low latitudes. This agrees with the results in Pancheva et al. (2003), in which the authors demonstrated that the largest amplitudes of semidiurnal tide are found at middle and high latitudes, whereas the diurnal tide is dominating the wind field at low latitudes.
Recently, the GPS radio occultation (RO) technique has been used to detect Es layers on a global scale (Arras et al., 2008, 2009; Wickert et al., 2009). In fact, a constellation of LEO (low Earth orbit) satellites is required to observe Earth's atmosphere by the RO technique in a high spatial and temporal resolution. The main LEO satellite missions that provide GPS RO data are CHAMP (Challenging Minisatellite Payload), GRACE (Gravity Recovery and Climate Experiment) and FORMOSAT-3/COSMIC (FORMOsa SATellite mission-3/Constellation Observing System for Meteorology, Ionosphere and Climate). These missions have accumulated an extensive database to study the Es layers between 2001 and 2016, in which there are about 6.7 million RO profiles available. Some relevant sporadic E characteristics were observed such as the strong summer occurrence at midlatitudes and the absence of the Es layers along Earth's magnetic Equator (Arras et al., 2009).
Additionally, Arras and Wickert (2017) introduced a new method to analyze the intensity of the Es layers from GPS RO measurements. They found that the Es layer intensity as measured by the RO technique is closely related to the fbEs (blanketing frequency) parameter provided by a digisonde at middle latitudes. Furthermore, the Es layer virtual height (h′Es) measured by the ionosonde had a good agreement with the geometric heights obtained from the radio occultation measurements.
In this study, we compared Es layer parameters from GPS RO profiles with coinciding digisonde sounding provided by the low-latitude station at Cachoeira Paulista (22.70∘ S, 45.01∘ W, dip: −36.43∘), Brazil. We will demonstrate that it is possible to obtain reliable sporadic E layer properties from radio occultation profiles at low latitudes, although the formation, the shape and the properties of the sporadic E layer may differ substantially from those at middle latitudes. We used data from the FORMOSAT-3/COSMIC satellites to extract the Es layer parameters between 2014 and 2016. The results show a generally high correlation between the altitudes and the intensity parameters. Some outliers can be linked to the electric field influence in the Es layer formation in this region.
The study is based on data collected by the digisonde located in Cachoeira Paulista and coinciding GPS radio occultation measurements provided by the FORMOSAT-3/COSMIC mission between 2014 and 2016. In the following, we briefly describe both measurement techniques and give some details on the data acquisition.
2.1 Es layer detection by the GPS RO technique
One possibility for sporadic E layer detection from the GPS RO measurements is analyzing the GPS L1 50 Hz signal-to-noise ratio (SNR) profiles. The SNR is sensitive to vertical changes in the electron density in the ionosphere and shows strong fluctuations when passing a sporadic E layer (Wu et al., 2005; Arras, 2008). These fluctuations are detected numerically by applying a band pass filtering technique. First, all the SNR profiles are normalized since the SNR free-space value (SNR0) varies distinctly from occultation to occultation which depends on the viewing angle of the GPS satellite with respect to the occultation antenna. Subsequently, the standard deviation (SD) is calculated for the whole profile in a 2.0 km running window. If the profiles contain a fluctuation where the SD exceeds a numerically defined threshold, the profiles contain a disturbance. If this disturbance covers an altitude range lower than 10 km, the profile is considered to contain a sporadic E. The maximum deviation from the mean profile represents approximately the altitude of the Es layer (Arras et al., 2008; Yue et al., 2015; Arras and Wickert, 2017). Figure 1 shows an example of the SNR measured during a COSMIC occultation located slightly south of South Africa on 1 January 2009. The profile contains strong fluctuations around 103 km altitude, which are attributed to an Es layer. The SNR profiles are cut at 70 km altitude to avoid influences from lower atmospheric water vapor content on our filtering routine.
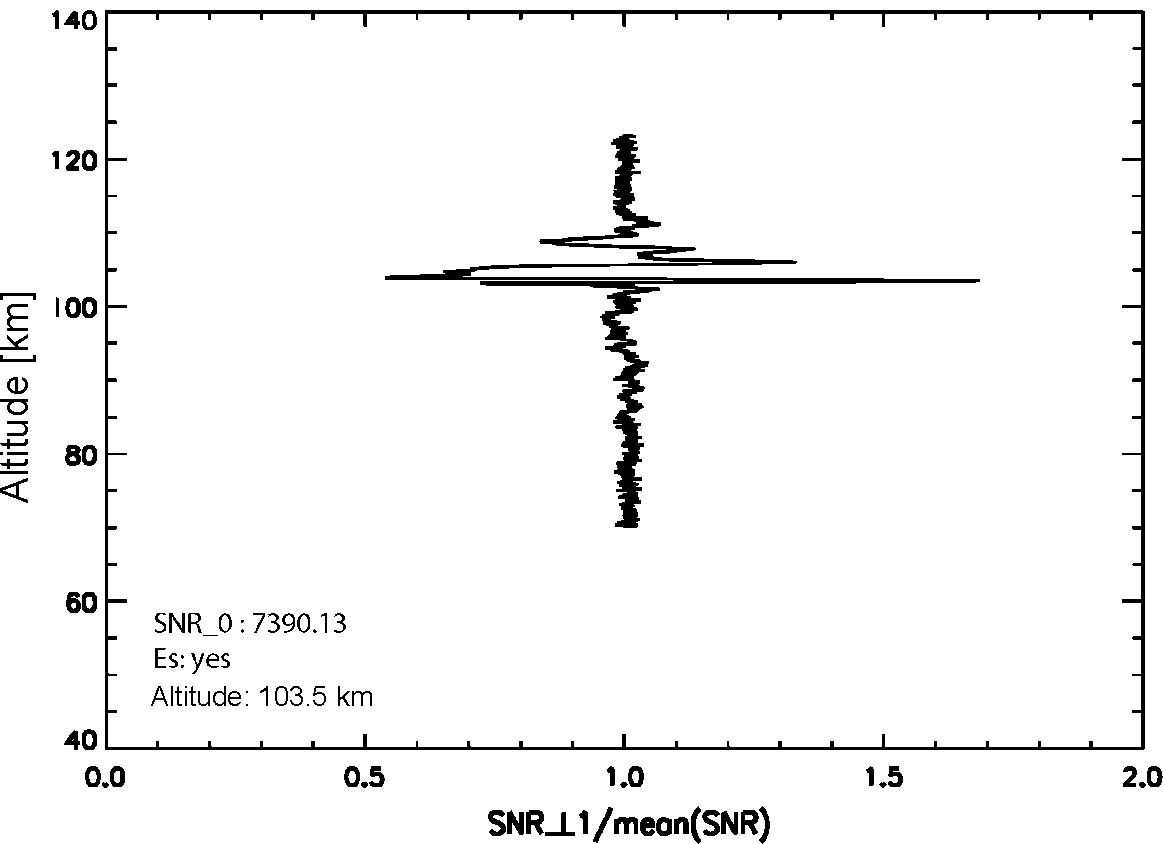
Figure 1SNR profile of the GPS L1 signal showing strong fluctuations at 103 km altitude caused by a sporadic E layer.
The upper boundary of the 50 Hz RO profiles is located at about 120 km altitude. During a GPS radio occultation the Earth's atmosphere is scanned between the LEO orbit altitude and the Earth's surface. This is currently performed in two different modes: an ionospheric and a neutral atmospheric mode. The ionosphere, between the orbit and about 50 km above Earth's surface, is scanned with a data rate of 1 Hz. At around 120 km altitude the second mode is switched on where the atmosphere is scanned with a 50 Hz rate down to the surface. In this study, we used the 50 Hz GPS L1 occultation link. Due to its higher vertical resolution, the 50 Hz profiles are much better suited to analyzing thin structures in the ionosphere as Es layers. The disadvantage of this data mode is that we do not get information above ∼ 120 km. Therefore, it is not possible to observe sporadic E layers at higher altitudes where its formation might be influenced by the meridional wind or the descending intermediate layers (Arras et al., 2009).
The GPS radio occultation techniques enable Es layer observations on a global scale. The FOSMOSAT-3/COSMIC satellites, or COSMIC for short, was launched in 2006. Since that time, the satellites provide about 2500 RO globally distributed profiles of atmospheric and ionospheric parameters per day. Figure 2 shows the RO profile distribution between 2014 and 2016. The numbers of profiles are summed up in the 5∘ × 5∘ latitude–longitude grid. Figure 2 reveals that the profiles are not equally distributed on the globe. The location of an occultation is defined by the tangent point which is determined by the relative positions between the GPS and LEO (COSMIC) satellites. The COSMIC satellites fly in a circular orbit with high inclination around 55∘. This provides a global data coverage, even close to the poles, but a smaller data rate at low latitudes. Therefore, maximum occultation numbers are observed at middle latitudes whereas the low and equatorial latitudes are underrepresented. The distribution results from the viewing angle of the LEO satellites with respect to the GPS orbits.
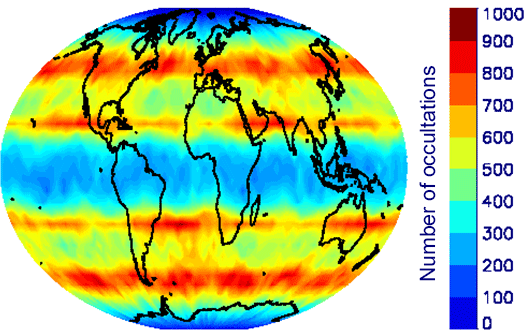
Figure 2Global distribution of GPS radio occultation profiles provided by the COSMIC satellites between 2014 and 2016. The number of occultation refers to a 5∘ × 5∘ latitude–longitude grid.
Arras and Wickert (2017) introduced a new method to estimate the layer's intensity using the sampling point, which is assumed to be the altitude of the Es layer. Starting from these points, 25 values towards the top of the occultation and 25 values towards the ground are deployed to calculate the S4 (scintillation) index. In fact, the S4 index provides information on the degree of disturbance of the SNR profile. High S4 values indicate strong fluctuations in the GPS signal's amplitude that are induced by vertical gradients in the electron density.
We analyzed in total 1 302 703 RO profiles provided by COSMIC in the years 2014–2016. Only 90 of them coincide, in which the “h” types of Es layers are excluded, with the location of the digisonde at Cachoeira Paulista, Brazil, considering a 1∘ × 1∘ grid in latitude and longitude. In the following we use the coinciding events to compare the Es altitudes and the scintillation degree with the Es virtual heights (h′Es) and the corresponding intensity parameter fbEs measured by the ionosonde, in order to get information on the correlation between both measurement techniques at low latitudes.
2.2 Es layer detection by digisonde
In this work we use the electron density profiles known as ionograms provided by a DPS4D (4D digital portable sounder), which is a high-frequency radar with variable operational frequency that consists of transmitter, receiver and antennae installed at Cachoeira Paulista, Brazil, to collect the Es parameters. Ionograms are taken every 10–15 min. The parameters considered in our study are the virtual heights (h′Es) and the blanketing frequency (fbEs). The former parameter refers to the height of the Es layer calculated from the signal's travel time. The latter is defined as the frequency at which the sporadic E layers become transparent in the ionograms or, in other words, the frequency at which reflections from a layer at greater heights may be observed. The fbEs parameter corresponds to the electron density of the Es layers, based on the plasma frequency relationship, (Reddy and Rao, 1968).
The ionograms in Fig. 3 are obtained at Cachoeira Paulista on 2 January 2016. They illustrate an example of the sporadic E layer appearance (red arrows). It is possible to see that the Esb (blanketing type Es) layer blocks the electromagnetic wave reflection from the upper ionospheric region. This feature is typical for Es layers formed by the wind shear process, which is usually the case at middle latitudes. This point is indicated in the ionograms by a black vertical line that represents the fbEs parameter. The top of the blue vertical line denotes the virtual height of the Es layer (h′Es).

Figure 3Ionograms over Cachoeira Paulista from 11:00 to 11:20 UT on 2 January 2016. The red arrows indicate the presence of Es layers. The black vertical line represents the fbEs parameter, and the top of the blue vertical line marks the virtual height of the Es layer. In the ionograms, the overhead reflections for ordinary and extraordinary waves are red and green, respectively.
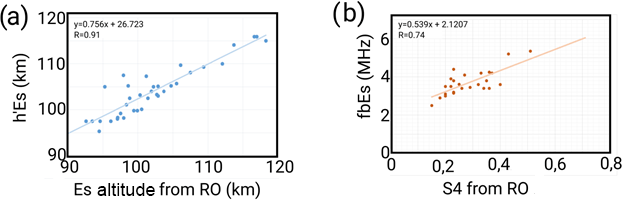
Figure 4Comparison of sporadic E heights (a) and their intensity (b) obtained by radio occultation and ionosonde measurements.
In this section, we will demonstrate that ionosonde and RO measurements provide similar results at low latitudes with respect to sporadic E parameters such as its heights and intensities. Therefore, we compared Es parameters from the ionosonde at Cachoeira Paulista with results from co-located RO measurements. We found 90 RO events, which are located close to the Cachoeira Paulista station (maximum distance of 1∘ in latitude–longitude) and compared with the Es layer altitudes and corresponding intensities obtained from both measurement techniques. The “h” types of Es layers are excluded in this study. The results of the comparison are shown in Fig. 4, for height (Fig. 4a) and for frequency (Fig. 4b). Notice that we found high correlations of 0.91 for the Es height measurements and of 0.74 for frequency or intensity measurements.
Despite the fact that the “h” type Es layer (Esh) being observed almost every day in Cachoeira Paulista ionograms at high altitudes, around 120–130 km (Resende et al., 2017a), they were excluded from the present analysis due to the upper limit limitation of the Ro technique to detect Es (Arras et al., 2009).
Figure 5 shows sequences of ionograms that provide examples of “h” and “l” types of Es layers. Panel 1a of Fig. 5 shows an ionogram acquired at 16:10 UT on 27 January 2016, where it is possible to identify the Esh layer. In the next ionogram, obtained after 10 min, the Esh layer becomes evident. This characteristic persisted in the next ionogram (16:30 UT). In fact, the Esh layer often descends with time, and it can merge with other Es layer types, such as “c” or “l”. Figure 5a–c show an Esl layer observed on 2 January 2016, from 10:30 to 10:50 UT, in which the F region was blocked due to its presence. The “c” and “l” types are formed by the zonal wind component, mainly the diurnal tide (Haldoupis, 2011; Resende et al., 2017a). Therefore, as in the RO data, it is possible to study only Es layers of “c” or “l” types.
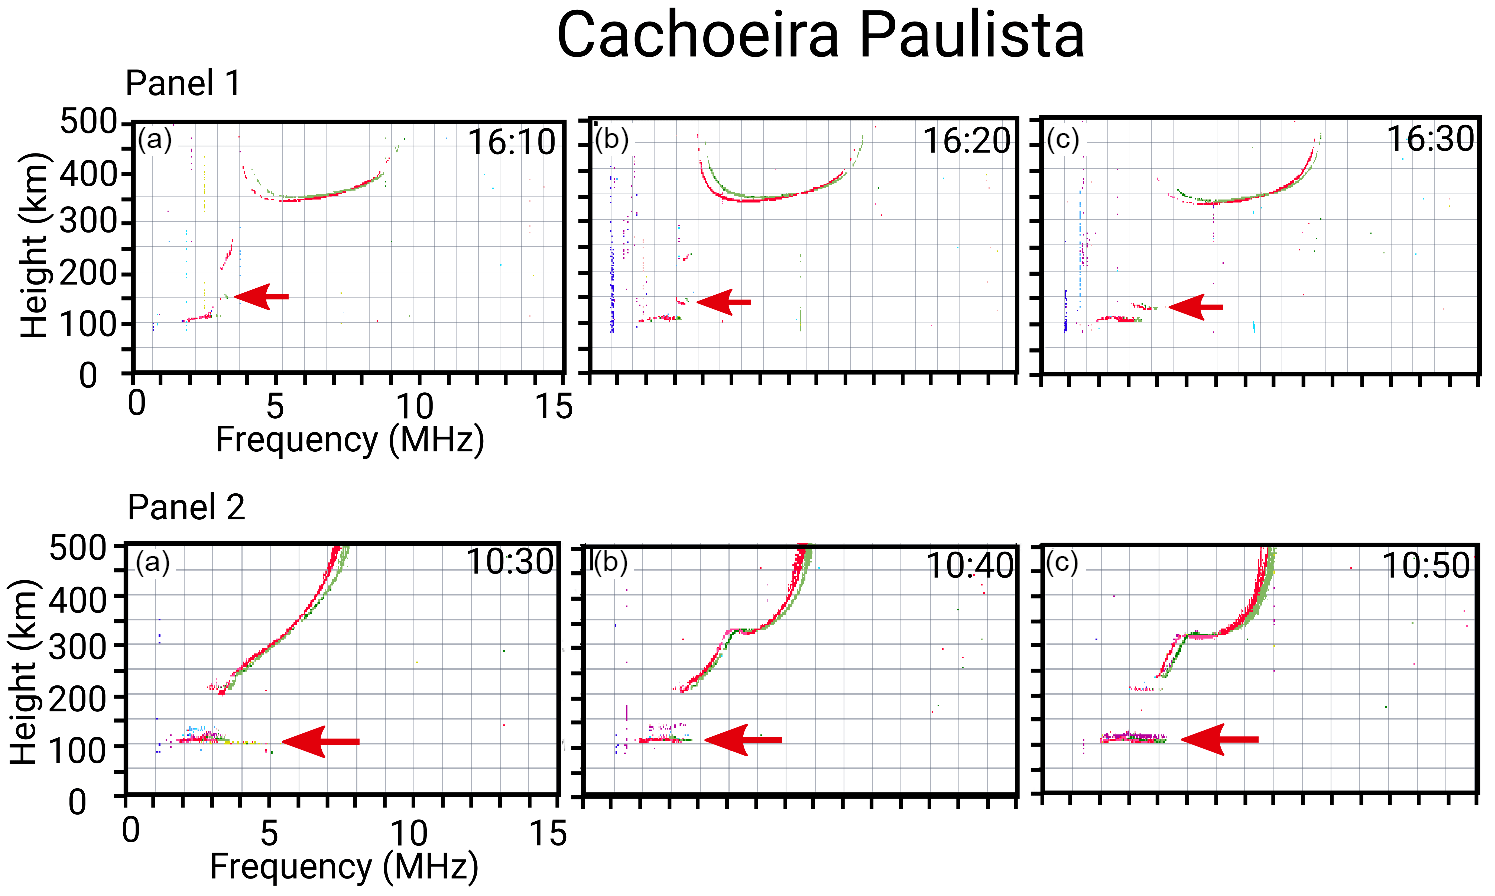
Figure 5Sequence of ionograms where it is possible to identify the different types of Es: “h” (panel 1) and “l” (panel 2).

Figure 6Distribution of sporadic E intensity in the South American region divided by season between 2014 and 2016.
A high correlation of 0.74 was obtained for the intensity parameter, which reveals that the S4 value calculated from RO measurements is suitable to estimate the Es layer intensity at low latitudes. However, the correlation is not as expressive as that of the height, which may be a result of the completely different approaches used for sporadic E intensity estimation.
Finally, a similar study about the correlation between RO and ionosonde data was performed by Arras and Wickert (2017) at middle latitudes. They used the same criteria with 17 coinciding measurements available during the summer, which provided a good correlation. Hence, it was concluded that S4 value calculated from RO measurements is indeed suitable to estimate the intensity of the Es layers formed by tidal winds. Moreover, they found correlation parameters very close to the ones computed in this work for Cachoeira Paulista, 0.81 for height and 0.79 for density. Therefore, it is possible to confirm that the low-latitude Es layers can have a significant influence on the tidal winds, confirming the results obtained by Resende et al. (2017a).
The RO techniques enable, for the first time, global overview of sporadic E layer characteristics at a high spatial resolution. Figure 6 shows maps of the S4 scintillation index acquired from the SNR intensity fluctuations of the GPS RO data for the autumn (March, April and May), winter (June, July and August), spring (September, October and November) and summer (December, January and February) seasons in Brazil for the years 2014–2016. The black triangle marks the location of the ionosonde at Cachoeira Paulista. The color bars show the S4 index varying between 0 and 0.5. As mentioned before, the S4 index is a measure of the degree of disturbance of the SNR and is related to the intensity of the Es layer (Arras and Wickert, 2017).
It is possible to observe some typical characteristics in Fig. 6, such as the absence of Es layers along the dip Equator, where the wind shear mechanism is not effective. In the equatorial region the occurrence of Esq layers is closely related to the equatorial electrojet (EEJ) plasma instabilities, which are associated with the gradient-drift instability driven by the vertical polarization Hall electric field as well as by the vertical density gradient (Matsushita, 1951; Cohen et al., 1962; Knecht and McDuffie, 1962; Abdu et al., 2002; Resende et al., 2016). In other words, the layers in the equatorial region are irregularity layers, whose detection using the RO technique is not possible.
Furthermore, Es layers preferably occur at low to middle latitudes of the summer hemisphere, while the rates in winter are distinctly lower. In general, around the Brazilian sector, we observe the strongest Es layers in autumn and summer. However, in the region close to Cachoeira Paulista (black triangle in Fig. 6), the strongest Es layers were observed in summer and spring. This fact agrees with the observational data from the digisonde and with the simulation results for Cachoeira Paulista (Resende et al., 2017a). The Es layer enhancement in summer can be explained by the higher meteor flux rates (Haldoupis, 2011), which is consistent with the results presented in Arras et al. (2009).
In this paper, we presented new results on the Es layers using GPS RO measurements obtained from the FORMOSAT-3/COSMIC satellites. We compared these results with digisonde data from the Cachoeira Paulista station, Brazil. The RO measurements provide a very valuable database for investigating the lower ionosphere, mainly the properties of sporadic E layers on a global scale. The SNR profiles have a very high vertical resolution of ∼ 50 Hz that enables the identification of sporadic E signatures as well as their intensity.
The comparison of Es altitudes and intensities from RO profiles with those from coinciding ground-based digisonde data revealed that there is a large correspondence between both measurement techniques. The high correlation in the heights is explained by the exclusion of the “h” Es layer type in this analysis. Therefore, we used only the Esl layers that occur due to the strong presence of the zonal wind. However, the correlation obtained for the intensity parameter was found to be lower. We believe that this difference results from the very different measurement techniques and we will focus in future studies on this feature in order to investigate the reason for these discrepancies in the correlation values.
The Es intensity maps presented here shows a seasonal variation of the S4 index. The results reveal that the Es layers are more intense in summer, agreeing with the accepted theory for these layers and the simulations over Cachoeira Paulista. The Es layer enhancement in summer can be explained by the higher meteor flux rates, which is consistent with the results presented in Arras et al. (2009).
Finally, we found that the agreement between the observations obtained from both analyzed techniques was satisfactory at low latitudes. Therefore, we concluded that the RO technique provide reliable data on Es characteristics also at low latitudes.
The COSMIC data were downloaded from UCAR CDAAC (http://www.cosmic.ucar.edu) (Anthes et al., 2008). The data used in this study may be available by contacting the Responsible Coordinators in DAE/INPE (Inez S. Batista, email: inez.batista@inpe.br).
The authors declare that they have no conflict of interest.
This article is part of the special issue “Space weather connections to near-Earth space and the atmosphere”. It is a result of the 6o Simpósio Brasileiro de Geofísica Espacial e Aeronomia (SBGEA), Jataí, Brazil, 26–30 September 2016.
Laysa C. A. Resende would like to acknowledge the financial support from FAPESP
process number 2014/11198-9 and 2017/01332-8 and CNPq support under grant
405334/2017-6. Christina Arras likes to acknowledge the support of this study by
the German Research Foundation (DFG) within the Priority Program SPP1788
“Dynamic Earth”. Inez S. Batista acknowledges CNPq support under grants
302920/2014-5 and 474351/2013-0. Clezio M. Denardini thanks CNPq/MCTI (grant
03121/2014-9) and FAPESP (grant 2012/08445-9). Juliano Moro would like to thank
the China–Brazil Joint Laboratory for Space Weather (CBJLSW) for supporting
his postdoctoral fellowship. The authors thank DAE/INPE for kindly providing
the ionospheric data. Thainá O. Bertollotto would like to acknowledge the
financial support from CNPq process number 144040/2017-4. We would like to
acknowledge the University Corporation of Atmospheric Research (UCAR) for
providing the FORMOSAT-3/COSMIC data. The authors thank DAE/INPE for kindly
providing the ionospheric data.
The topical editor, Dalia Buresova, thanks three anonymous referees for help in evaluating this paper.
Abdu, M. A, Denardini, C. M., Sobral, J. H. A., Batista, I. S., Muralikrishna, P., and De Paula, E. R.: Equatorial Electrojet Irregularities Investigations Using a 50 MHz Back-Scatter Radar and a Digisonde at São Luís: Some Initial Results, J. Atmos. Sol.-Terr. Phy., 64, 1425–1434, https://doi.org/10.1016/j.jastp.2003.08.011, 2002.
Abdu, M. A., MacDougall, J., Batista, I. S., Sobral, J. H. A., and Jayachandran, P. T.: Equatorial evening prereversal electric field enhancement and sporadic E layer disruption: A manifestation of E and F region coupling, J. Geophys. Res., 108, 12–54, https://doi.org/10.1029/2002JA009285, 2003.
Abdu, M. A., Souza, J. R., Batista, I. S., Santos, M. A., Sobral, J. H. A., Rastogi, R. G., and Chandra, H.: The role of electric fields in sporadic E layer formation over low latitudes under quiet and magnetic storm conditions, J. Atmos. Sol.-Terr. Phy., 115, 95–105, https://doi.org/10.1016/j.jastp.2013.12.003, 2014.
Anthes, R. A., Bernhardt, P. A., Chen, Y., Cucurull, L., Dymond, K. F., Ector, D., Healy, S. B., Ho, S.-P.,Hunt, D. C., Kuo, Y.-H., Liu, H., Manning, K., McCormick, C., Meehan, T. K., Randel, W. J., Rocken, C., Schreiner, W. S., Sokolovskiy, S. V., Syndergaard, S., Thompson, D. C., Trenberth, K. E., Wee, T.-K., Yen, N. L., and Zeng, Z.: The COSMIC/FORMOSAT-3 Mission: Early Results, BAMS, 89, 313–333, https://doi.org/10.1175/BAMS-89-3-313, 2008 (data available at: http://www.cosmic.ucar.edu, last access: 28 March 2018).
Arras, C. and Wickert, J.: Estimation of ionospheric sporadic E intensities from GPS radio occultation measurements, J. Atmos. Sol.-Terr. Phy., in press, 2017.
Arras, C., Wickert, J., Beyerle, G., Heise, S., Schmidt, T., and Jacobi, C.: A global climatology of ionospheric irregularities derived from GPS radio occultation, Geophys. Res. Lett., 35, L14809, https://doi.org/10.1029/2008GL034158, 2008.
Arras, C., Jacobi, C., and Wickert, J.: Semidiurnal tidal signature in sporadic E occurrence rates derived from GPS radio occultation measurements at higher midlatitudes, Ann. Geophys., 27, 2555–2563, https://doi.org/10.5194/angeo-27-2555-2009, 2009.
Axford, W. I.: The formation and vertical movement of dense ionized layers in the ionosphere due to neutral wind shears, J. Geophys. Res., 68, 769–779, https://doi.org/10.1029/JZ068i003p00769, 1963.
Batista, I. and Abdu, M. A.: Magnetic storm delayed sporadic E enhancements in the Brazilian geomagnetic anomaly, J. Geophys. Res., 82, 4777–4783, https://doi.org/10.1029/JA082i029p04777, 1977.
Carrasco, A. J., Batista, I. S., and Abdu, M. A.: Simulation of the sporadic E layer response to pre-reversal associated evening vertical electric field enhancement near dip equator, J. Geophys. Res., 112, 324–335, doi:10.10292006JA01243, 2007.
Cohen, R., Bowles, K. L., and Calvert, W.: On the nature of equatorial slant sporadic E, J. Geophys. Res., 67, 965–972, https://doi.org/10.1029/JZ067i003p00965, 1962.
Dagar, R., Verma, P, Napgal, O., and Setty, C. S. G. K.: The relative effects of the electric fields and neutral winds on the formation of the equatorial sporadic layers, Ann. Geophys. 33, 333–340, 1977.
Haldoupis, C.: A tutorial review on Sporadic E layers, Aeronomy of the Earth's Atmosphere-Ionosphere, IAGA Book Series, 29, 381–394, https://doi.org/10.1007/978-94-007-0326-1_29, 2011.
Knecht, R. W. and McDuffie, R. E.: On the Width of the Equatorial Es Belt, Ionospheric sporadic E, International Series of Monographs on Electromagnetic Waves (book), 215–218, https://doi.org/10.1016/B978-0-08-009744-2.50022-9, 1962.
Kopp, E.: On the abundance of metal ions in the lower ionosphere, J. Geophys. Res., 102, 9667–9674, doi:0148-0227/97/97JA-003845, 1997.
Layzer, D.: Theory of midlatitude sporadic E, Radio Sci., 7, 385–395, https://doi.org/10.1029/RS007i003p00385, 1972.
Matsushita, S.: Intense Es ionization near the geomagnetic equator, Geomagn. Geoelectr., 3, 44–46, https://doi.org/10.5636/jgg.3.44, 1951.
Pancheva, D., Haldoupis, C., Meek, C. E., Manson, A. H., and Mitchell, N. J.: Evidence of a role for modulated atmospheric tides in the dependence of sporadic E on planetary waves, J. Geophys. Res., 108, 1176, https://doi.org/10.1029/2002JA009788, 2003.
Piggot, W. and Rawer, K.: Handbook of ionogram interpretation and reduction, US Department of Commerce, Asheville, NC, California, 352 pp., 1972.
Reddy, C. A. and Rao, M. M.: On the Physical Significance of the Es Parameters fbEs,fEs, and foEs, J. Geophys. Res., 73, 215–224, https://doi.org/10.1029/JA073i001p00215, 1968.
Resende, L. C. A., Denardini, C. M., and Batista, I. S.: Abnormal fbEs enhancements in equatorial Es layers during magnetic storms of solar cycle 23, J. Atmos. Sol.-Terr. Phy.., 102, 228–234, https://doi.org/10.1016/j.jastp.2013.05.020, 2013
Resende, L. C. A., Batista, I. S., Denardini, C. M., Batista, P. P., Carrasco, J. A., Andrioli, V. F., Moro, J., Chen, S. S.: Competition between winds and electric fields in the formation of blanketing sporadic E layers at equatorial regions, Earth Planets Space, 68, 1–14, https://doi.org/10.1186/s40623-016-0577-z, 2016.
Resende, L. C. A., Batista, I. S., Denardini, C. M., Batista, P. P., Carrasco, J. A., Andrioli, V. F., and Moro, J.: Simulations of blanketing sporadic E-layer over the Brazilian sector driven by tidal winds, J. Atmos. Sol.-Terr. Phy., 154, 104–114, https://doi.org/10.1016/j.jastp.2016.12.012, 2017a.
Resende, L. C. A., Batista, I. S., Denardini, C. M., Batista, P. P., Carrasco, J. A., Andrioli, V. F., and Moro, J.: The influence of tidal winds in the formation of blanketing sporadic E-layer over equatorial Brazilian region. J. Atmos. Sol.-Terr. Phy., 1–8, https://doi.org/10.1016/j.jastp.2017.06.009, in press, 2017b.
Whitehead, J.: The formation of the sporadic-E in the temperate zones, J. Atmos. Sol.-Terr. Phy., 20, 1155–1167, https://doi.org/10.1016/0021-9169(61)90097-6, 1961.
Wickert, J., Michalak, G., Schmidt, T., Beyerle, G., Cheng, C. Z., Healy, S. B., Heise, S., Huang, C. Y., Jakowski, N., Kohler, W., Mayer, C., Offiler, D., Ozawa, E., Pavelyev, A. G., Rothacher, M., Tapley, B., and Arras, C.: GPS radio occultation: Results from CHAMP, GRACE and FORMOSAT-3/COSMIC, Terr. Atmos. Ocean. Sci., 20, 35–50, https://doi.org/10.3319/TAO.2007.12.26.01(F3C), 2009.
Wu, D. L., Ao, C. O., Hajj, G. A., de la Torre Juarez, M., and Mannucci, A. J.: Sporadic E morphology from GPS CHAMP radio occultation, J. Geophys. Res., 110, A01306, https://doi.org/10.1029/2004JA010701, 2005.
Yue, X., Schreiner, W. S., Zeng, Z., Kuo, Y.-H., and Xue, X.: Case study on complex sporadic E layers observed by GPS radio occultations, Atmos. Meas. Tech., 8, 225–236, https://doi.org/10.5194/amt-8-225-2015, 2015.