the Creative Commons Attribution 4.0 License.
the Creative Commons Attribution 4.0 License.
 | 03 Apr 2018
Climatology of the scintillation onset over southern Brazil
Jonas Sousasantos
Alison de Oliveira Moraes
José H. A. Sobral
Marcio T. A. H. Muella
Eurico R. de Paula
Rafael S. Paolini
This work presents an analysis of the climatology of the onset time of ionospheric scintillations at low latitude over the southern Brazilian territory near the peak of the equatorial ionization anomaly (EIA). Data from L1 frequency GPS receiver located in Cachoeira Paulista (22.4∘ S, 45.0∘ W; dip latitude 16.9∘ S), from September 1998 to November 2014, covering a period between solar cycles 23 and 24, were used in the present analysis of the scintillation onset time. The results show that the start time of the ionospheric scintillation follows a pattern, starting about 40 min earlier, in the months of November and December, when compared to January and February. The analyses presented here show that such temporal behavior seems to be associated with the ionospheric prereversal vertical drift (PRVD) magnitude and time. The influence of solar activity in the percentage of GPS links affected is also addressed together with the respective ionospheric prereversal vertical drift behavior. Based on this climatological study a set of empirical equations is proposed to be used for a GNSS alert about the scintillation prediction. The identification of this kind of pattern may support GNSS applications for aviation and oil extraction maritime stations positioning.
Keywords. Ionosphere (ionospheric irregularities; modeling and forecasting) – radio science (space and satellite communication)
- Article
(1267 KB) - Full-text XML
- BibTeX
- EndNote


The ionospheric scintillations considered here consist of rapid time variations in the amplitude and phase of the satellite radio signal passing through the ionosphere. The scintillations are more frequently observed at equatorial and low-latitude regions after sunset. In the South American sector this phenomenon is very common during summer solstice and equinoctial periods. Scintillations are responsible for a significant reduction in GPS positioning accuracy, and in severe scintillation scenarios, the receiver may completely lose the capacity of providing positioning, time and velocity because of a full disruption (Basu and Basu, 1981; Kintner et al., 2007; Moraes et al., 2014a).
The need for a better characterization of scintillation onset emerged recently during studies to evaluate the possible use of a GBAS (ground-based augmentation system), a precision approach aviation landing system, in Brazil. In the last decade GPS constellation has been modernized with the improvement of new codes and frequencies, L2C and L5, for higher accuracy operation. The major focus of this modernization is the use of GPS for civil aviation in the near future. Since scintillation degrades navigation performance, the research of climatology, morphology and dynamics of irregularities (spanning from hundreds of meters to a few kilometers) for estimation and prediction of equatorial and low-latitude scintillation is a major concern in the radio science and space weather field. Motivated by these aspects, this work pursues the characterizations of scintillation onset time and its possible relation with the ionospheric prereversal vertical drift and the peak height of the F2 layer over the Brazilian region. In the equatorial nighttime ionosphere, the plasma may be elevated to higher altitudes where the critical parameters such as the collision frequency between ions and neutrals are altered. In addition, the density gradient, antiparallel to the gravity, usually becomes steeper, and this unstable configuration may lead to the generation of Rayleigh–Taylor instability (RTI) that implies the formation of large regions of density irregularities called equatorial plasma bubbles (EPBs). These EPB structures are responsible for severe scintillation scenario and registers of EPB activities over the Brazilian region have been made since 1978 (Sobral et al., 1980). The role of the PRVD in the development of irregularities has been widely discussed and the necessity of its existence as a requirement for subsequent EPB development is already well established. Abdu et al. (2009), using measurements from a network of instruments during COPEX campaign (Conjugate Point Equatorial Experiment), argued that in the Brazilian longitudinal sector a threshold value around 22 m s−1 of prereversal vertical drift peak (Vpk) is needed for the development of the EPB structures. However, slightly smaller values of Vpk may provide an ambient where spread F at the bottom side may occur, although it does not evolve into EPB structures. Another preconditioning unstable situation may occur when hmF2 is located at higher altitudes before or during the PRVD, in such a way that even more modest values of Vpk are enough to trigger EPB structures and consequently the presence of severe scintillation (Jayachandran et al., 1993; Abdu, 2001; Oyekola, 2009). Investigation of ionospheric parameters related to EPB structures and scintillation has been performed with both observations and simulations (Priyadarshi, 2015, and reference therein).
Huba et al. (2000) presented a versatile model of equatorial and low-latitude ionosphere named the SAMI2 model (acronym for Another Model of Ionosphere) which is capable of providing a large amount of information about the ionosphere by solving equations for density, momentum and temperature and by incorporating some empirical models such as the vertical drift model (Scherliess and Fejer, 1999). For the purposes of the present work some implementations were made in SAMI2 including a day-to-day loop in order to use real data for daily F10.7 values and a subroutine for calculation of the hmF2 parameter. SAMI2 results for the prereversal vertical drift were compared to the amplitude scintillation measurements made by a scintillation monitor deployed under the southern crest of the equatorial ionization anomaly (EIA) in the Brazilian sector. The next section briefly describes the methodology to obtain the scintillation data and the geophysical conditions. In Sect. 3, we present and discuss the existence of some clear patterns in the onset time of scintillation occurrence that seems to be seasonally dependent. In Sect. 4, we present the model results (SAMI2) for some critical parameters of the scintillation onset. In Sect. 5 we discuss the results and propose some empirical equations to forecast the percentage of links affected (L.A.) by scintillation. Finally, in Sect. 6 we present the conclusions.
The data used in this study were recorded by a GPS-L1 (1575.42 MHz) receiver located in Cachoeira Paulista (22.4∘ S, 45.0∘ W; dip latitude 16.9∘ S). The amplitude data samples were acquired at 50 samples s−1 for each channel. The period of analysis comprises from September 1998 to December 2014 and was based on the climatological statistics recently reported by Muella et al. (2017). This period includes the maximum of the solar cycle 23, the deep solar minimum period between cycles 23–24 and the ascending phase of the solar cycle 24. Furthermore, only geomagnetically quiet days (Kp < 4) were considered and over storm time conditions the results may change significantly. The index used for data amplitude scintillation analysis was the S4, which is the normalized root-mean-square (RMS) deviation of received intensity, given by the following:
where I is the intensity of the received signal and the brackets 〈 〉 denote the ensemble average of intensity during the computational interval of 60 s. The receiver records I at 50 Hz for all tracked GPS signals and also provides the respective S4 index every minute. In this work we consider noticeable scintillation cases where S4>0.2. The first Fresnel zone scale sizes of the irregularities that are responsible for scintillation are around 400 m at the GPS L1 frequency. The scintillation monitor used in this work is named SCINTMON and was developed by the GPS Laboratory at Cornell University (Beach and Kintner, 2001). More details about the S4 computation using this receiver can be found in Moraes et al. (2011). Figure 1 shows two examples of amplitude scintillation data with S4=0.51 and S4=0.99, respectively. These examples give an idea on how scintillation varies as S4 increases. By comparing the case of S4=0.51 with the case of S4=0.99, it is possible to note that the increase in S4 implies more and deeper fades in the received signal. In Moraes et al. (2012) and Moraes et al. (2014a, b) a complete statistical characterization of how those fades may change are modeled and discussed.
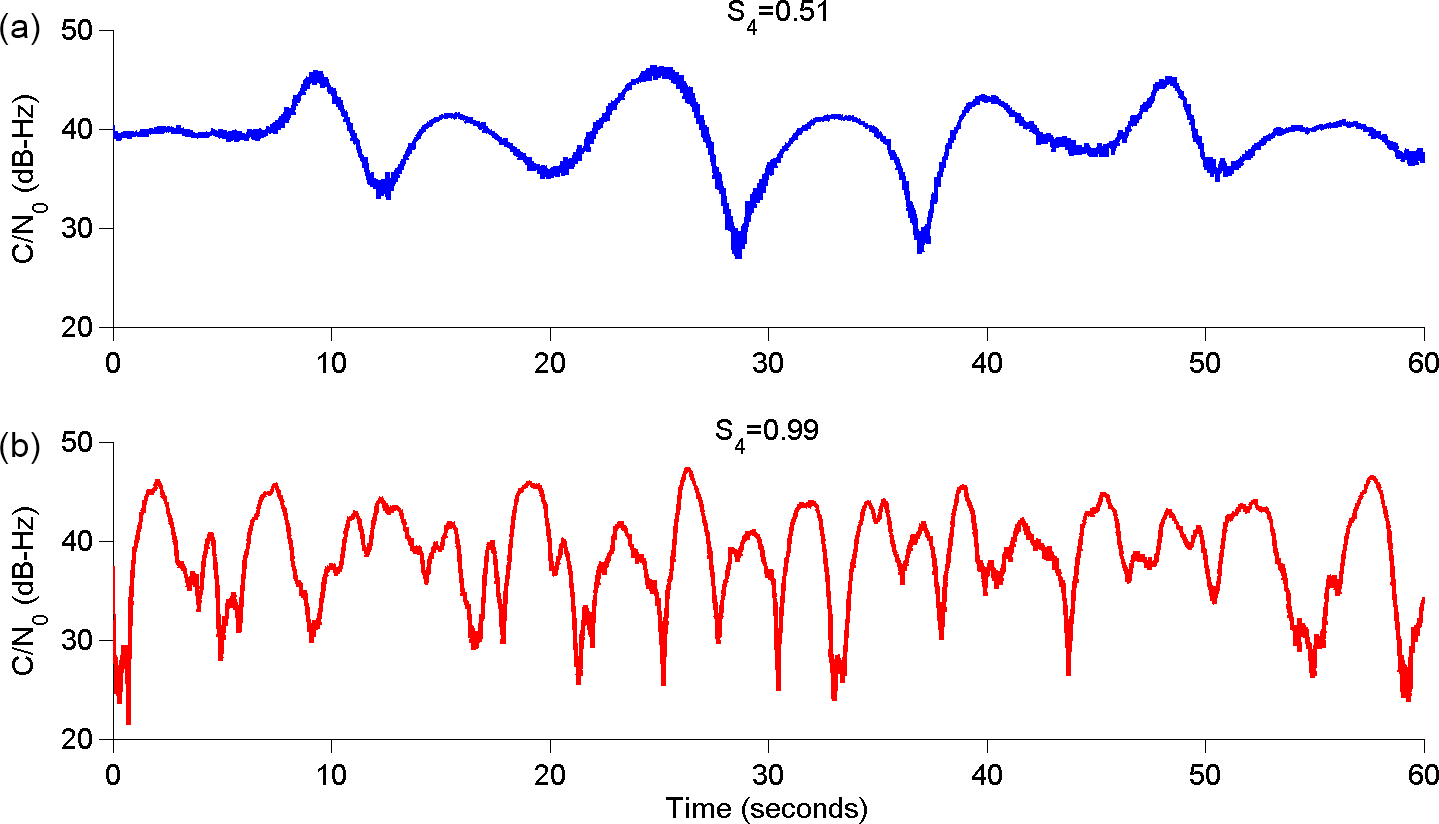
Figure 1Two examples of observations measurements with S4=0.51 (a) and S4=0.99 (b) made in Cachoeira Paulista, illustrating the variability in the fading strength.
Figure 2 shows an example from 21 November 2014, during the peak of current solar cycle. Figure 2a presents the total number of satellites in view, considering a 30∘ elevation mask. Additionally, this plot displays (with the red line) the number of satellites affected by S4>0.2. From 20:00 to 22:40 LT is the period with more links affected simultaneously, typically three satellites, but in some moments up to six satellites are affected by scintillation with S4>0.2. Figure 2b shows the S4 values for all the satellites visible during the night. Analyzing Fig. 2b it is possible to observe that scintillation with S4>0.2 starts at 20:02 LT and remains up to 23:00 LT. Then near 23:35 LT and 00:40 LT there is scintillation activity again, but it is not so intense. Figure 2c shows the ratio between the satellites links available for elevation > 30∘ and the ones affected by scintillation with S4>0.2. This ratio is presented in percentage and it is computed for the time window of 10 min. Therefore, for each 10 min period it is computed the total of cases with S4>0.2 divided by the total of satellites available for this period. For example, in the period between 20:50–21:00 LT, the signals received from all the satellites were affected by scintillation with S4>0.2. Figure 2d is a complementary illustration that shows the sky plot with all satellite passages for this night. In this plot the red dots represent the case with S4>0.2.
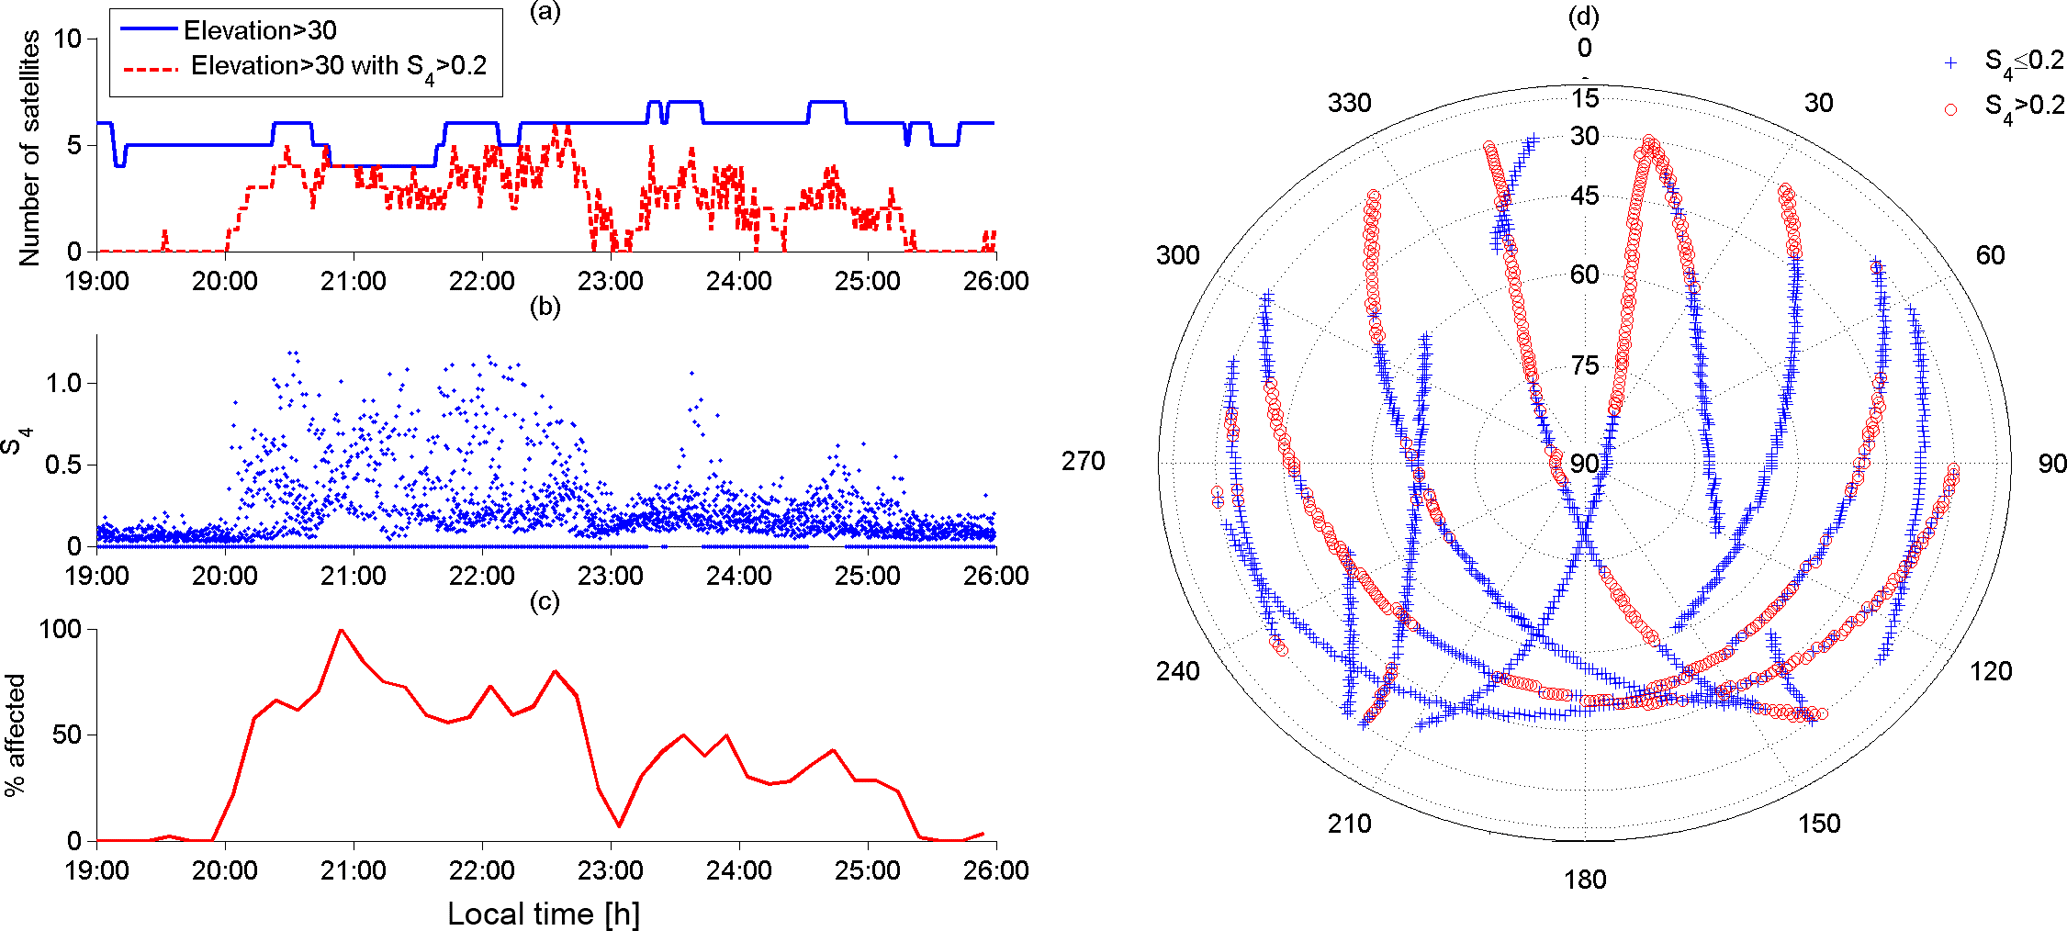
Figure 2Example from 21 November 2014. (a) Total number of satellites visible for elevation > 30∘ and the number of satellites affected by scintillation with S4>0.2. (b) All the S4 occurrences detected for all satellites from (a). (c) Average 10 min percentage of satellites visible for elevation > 30∘ affected by scintillation with S4>0.2. (d) Sky plot for the night showing the satellite passages; the red dots represent the cases with S4>0.2.
Plasma irregularities are usually developed in the post-sunset equatorial F region, when a rapid increase in the vertical drift velocities causes an uplift of the ionosphere, known as prereversal enhancement (PRVD). Large PRVD favors the growth rate of the RTI, considered the main mechanism responsible for the generation of plasma density irregularities. The lower-density EPB structures rising from the equator may spread along the geomagnetic field lines extending to low-latitude regions. Between 10 and 20∘ geomagnetic latitude north and south, the background plasma density is larger due to the equatorial ionization anomaly. Once these depleted structures move to these latitudes, the verified level of depletion is enhanced. Additionally, polarization electric fields mapped from the geomagnetic equator may generate instabilities in these low-latitude regions (i.e., in situ) if proper conditions are found. When EPB structures achieve low latitudes scintillation is experienced there (Moraes et al., 2017a, b, and references therein). In this section analyses are carried out when this phenomenon is detected by GPS users in low latitudes.
Based on the experimental measurements, it was possible to evaluate the monthly onset time for the occurrences of the scintillation phenomenon, and this evaluation revealed a clear pattern for the onset of scintillation activity. The onset time has been computed by taking all the cases with scintillation index S4>0.2 for the respective month of analysis. The time when the first 5 % of the scintillation cases were detected is considered the onset time in this work. The scintillation analysis was performed between 18:00 and 06:00 LT (in each month) throughout the period from September 1998 to December 2014. The amplitude scintillation data were collected during approximately 6000 geomagnetically quiet nights, where Σ (Kp) index < 24. The S4 threshold of 0.2 and the 40∘ elevation mask was adopted to reduce multipath effects. Figure 3a presents the scintillation onset times between September and March (equinox–summer solstice), from 1998 to 2014. These months were selected because over the Brazilian region from March to August the presence of EPB structures or scintillation is negligible, since this is a period of winter solstice (Sobral et al., 2002). Due to deep minimum solar activity, the occurrence of scintillation phenomena was rare between 2006 and 2010. For the different years considered in Fig. 3a, it is possible to observe a clear pattern. Taking September as reference, the scintillation onset occurs on average 10 min earlier in the months of October and November, as shown in Fig. 3b and Table 1. From December to February the opposite occurs, i.e., scintillation starts around 25 min later, compared to September whereas in March scintillation starts 10 min later in comparison to September. It should be pointed out that, in some years, the receivers were not operational in the month of February.
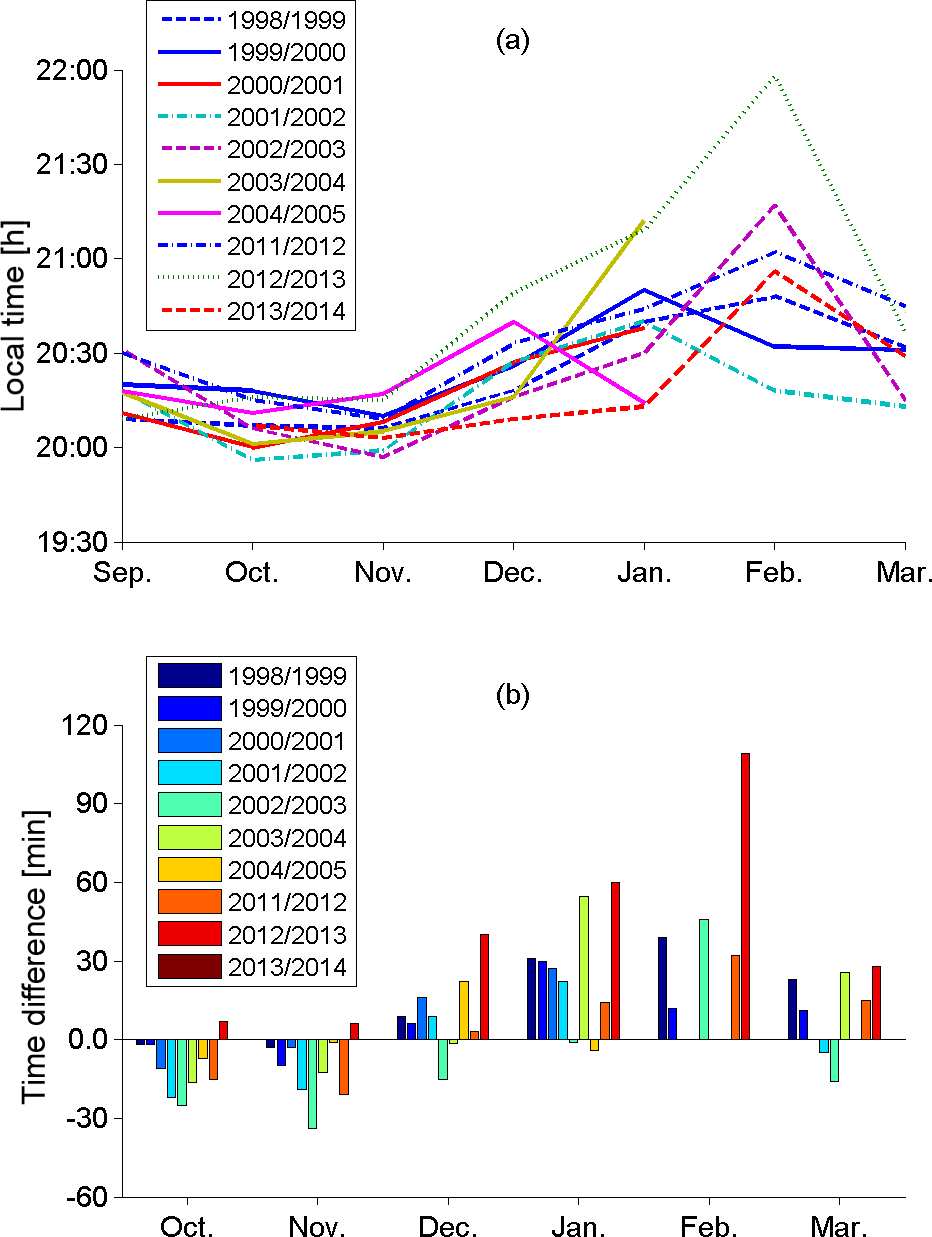
Figure 3(a) Monthly average of scintillation onset time from September to March during equinoxes–summer solstice for Cachoeira Paulista. (b) Monthly average time difference in relation to September of the respective equinox–solstice.
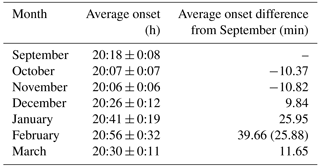
Table 1 lists the average onset times of scintillation detected in Cachoeira Paulista for the period of September–March from 1998 to 2014 presented in Fig. 3 as well as the standard deviation of the dataset (column 2). Taking again the month of September as reference, Table 1 shows in its third column the average onset differences for the months in which scintillation was observed. The average value of 39 min in February is exaggerated due to a peak observed in this month during the summer solstice period of 2012–2013. Therefore there is a mean variation in onset scintillation time that varies roughly 35–40 min between November and February.
Table 1Averaged scintillation onset time for Cachoeira Paulista and the time difference, taking as reference the September onset time.
The SAMI2 model (Huba et al., 2000) is an ionospheric model that deals with the plasma dynamics and chemical processes of seven ionic species (H+ He+, N+, O+, , NO+ and ). By solving equations of ion continuity, and ion and electron momentum, ion and electron temperature and incorporating some external models such as the empirical vertical drift model by Scherliess and Fejer (Scherliess and Fejer, 1999), the SAMI2 model may provide a large number of ionospheric parameters for equatorial and low-latitude positions. The vertical drift model is based on large radar (located at Jicamarca) and satellite (Atmospheric Explorer E satellite) datasets, and a detailed description on this may be found in Scherliess and Fejer (1999).
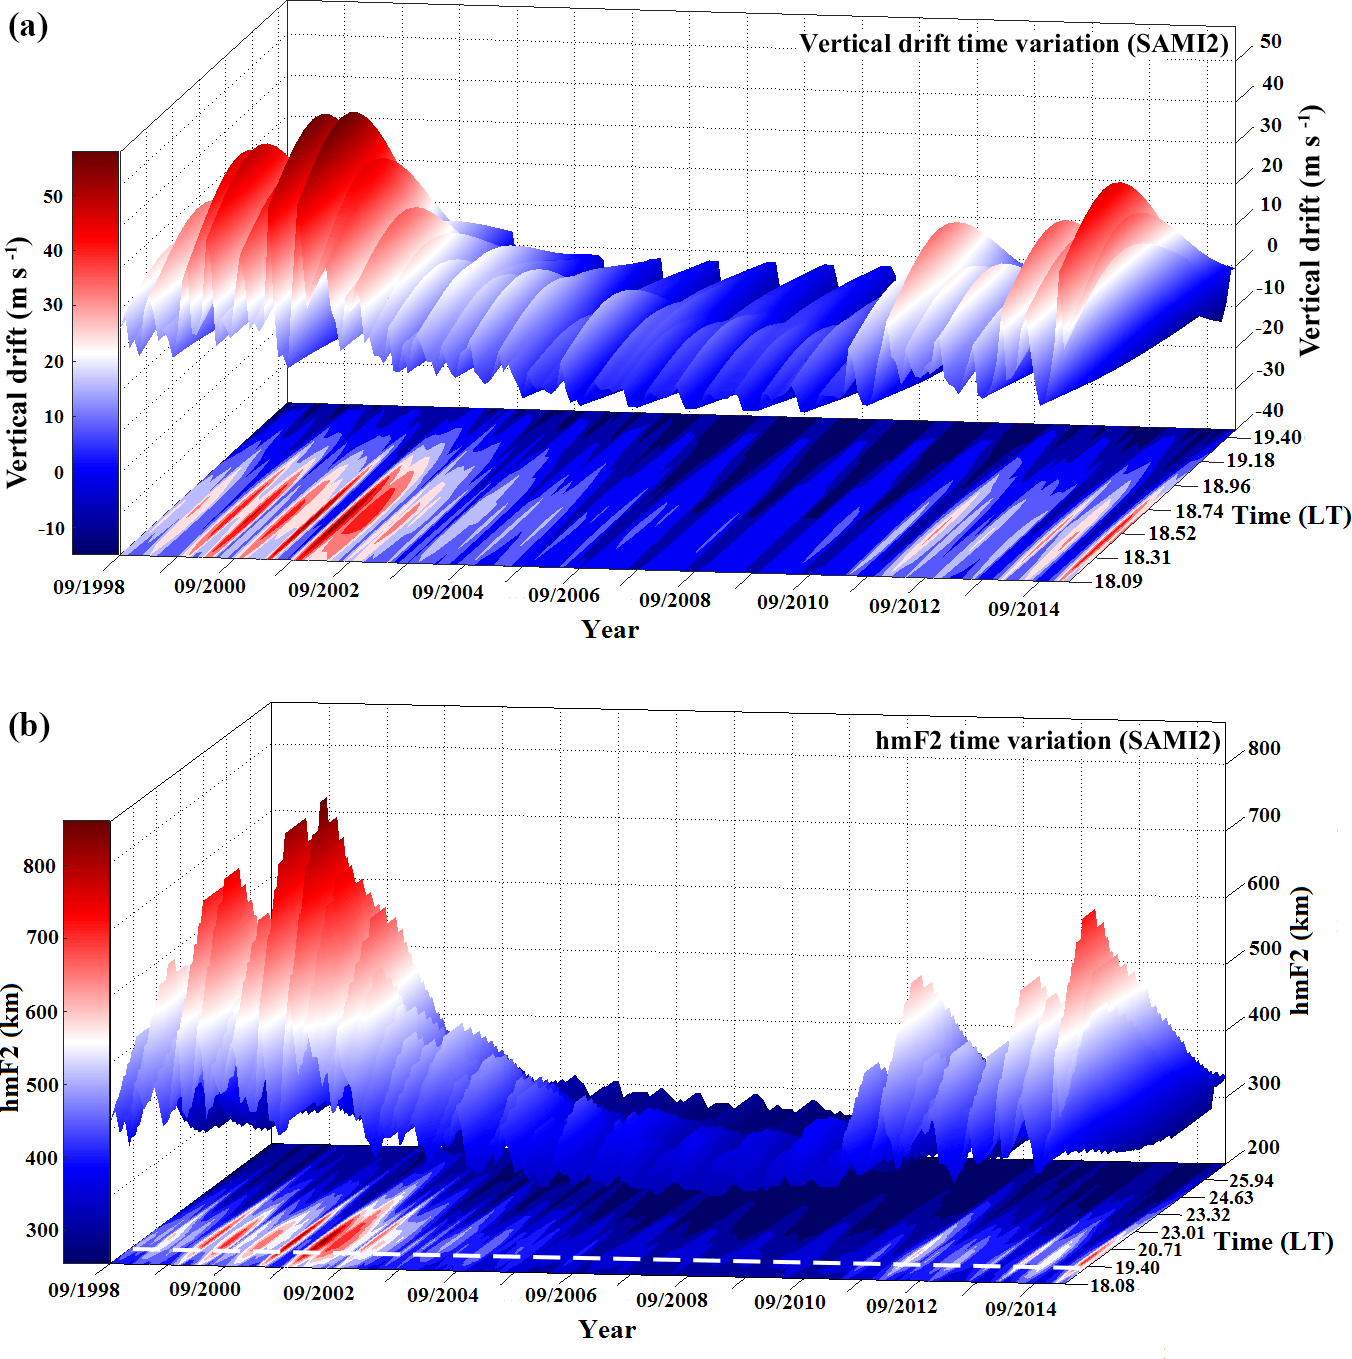
Figure 4(a) Monthly averaged values of vertical drift as obtained from SAMI2 model for the period of September 1998–December 2014 in the time interval in which PRVD takes place. (b) Monthly averaged values of hmF2 as obtained from SAMI2 model for the period of September 1998–December 2014, starting before PRVD.
For the purposes of the present work several changes were implemented inside the SAMI2 model in order to verify the long-term behavior of the parameters of interest, e.g., the ionospheric vertical drift and peak height of the F2 layer (hmF2). The calculation of the hmF2 parameter was inserted as a subroutine inside SAMI2; furthermore, a daily loop was included in order to introduce real day-to-day data of F10.7 solar index. The calculation of hmF2 is performed through an algorithm of critical value search in the density profiles for each time step and latitude. Once the index of the vertical density array is localized, the altitude of this peak may be determined. The values of F10.7 were obtained from SPDF OMNIWEB database (https://omniweb.gsfc.nasa.gov/, last access: 23 August 2017), and more realistic continuous profiles of vertical drift and hmF2 were achieved.
A run of SAMI2 covering September 1998–December 2014 was performed over an equatorial latitude, and monthly average values considering geomagnetic equatorial latitude were calculated for both parameters, i.e., the vertical drift and hmF2. These averaged values were obtained by considering , where χ is the parameter considered (vertical drift or hmF2) and “ndays” the number of the days in each month.
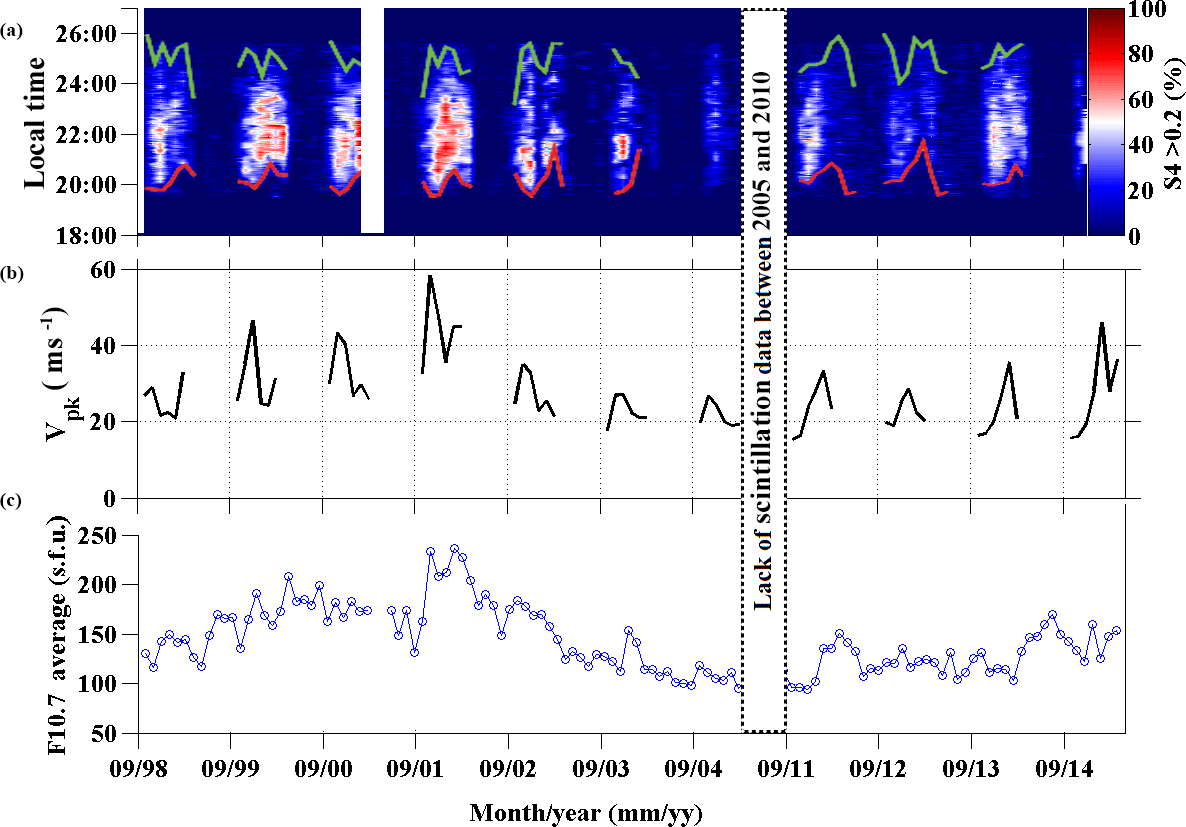
Figure 5(a) Percentage of links affected by scintillation during September 1998–December 2014). (b) Vpk values as calculated through monthly average given by SAMI2 model. (c) Solar F10.7 index average values for the period under consideration.
Figure 4 shows the profiles of the vertical drift and hmF2 for the entire period (September 1998–December 2014) as obtained from SAMI2. The profile for each month provides one value resulting from the average calculation. In Fig. 4a the plot exhibits the vertical drift in the time interval where PRVD takes place. It shows a clear pattern which starts to increase from September to October and from November to February (also in Fig. 5b). Then it starts to decrease from March onwards. Such a pattern is stronger around the maximum phase of the solar cycle 23 (e.g., 1999–2003), but becoming considerably modest around the solar maximum years of cycle 24 (e.g., 2011–2014). This seasonal variability may be explained in terms of the effects of the geomagnetic declination angle (Abdu et al., 1981, 1992; Batista et al., 1986) and in the variations of the solar cycle. Figure 4b exhibits a surface plot which shows that the hmF2 values (from 18:00 LT onwards) follow the same trend, with increasing values in the periods of September–October and November–February, and descending values after March. One may notice that the time at which hmF2 starts to maximize in each month (∼ 19:15 LT, denoted by the dashed white line) is usually later than the PRVD onset time (∼ 18:30 LT for the region of interest). These results indicate that some of the major rulers of the irregularity phenomenology in the ionosphere are seasonally dependent, suggesting an intensification or mitigation of the scintillation occurrence according to their seasonal distribution. While the prereversal vertical drift is largely accepted as the major contribution to the presence or absence of density irregularities, the hmF2 parameter may indicate a more unstable ionosphere placed in more elevated altitudes where the critical parameter for the RTI, i.e., the collision frequency, decreases significantly. However, the hmF2 contribution will not be discussed in detail since the results obtained suggest usual values and a later maximum (white dashed line on Fig. 4b) and in this initial approach the main interest is in the onset times; thus PRVD is a more decisive parameter. Such additional implications must be investigated in the near future.
In this section a comparison between S4 data (September 1998–December 2014) and long-term SAMI2 simulation results (PRVD and Vpk) is presented. Figure 5a is shown the monthly averaged percentage of satellite links affected (S4>0.2) by scintillations. The colors (from blue to red) indicate increasing values of scintillating satellite signals, as described by the colored bar on the right side of the panel. The coral curve and the green curve in the plot denote, respectively, the onset and the ending of the S4 activity. As discussed in Sect. 3, a clear pattern is shown in every year, revealing that the onset time always occurs earlier during October–November than during December–February. Figure 5b shows the result of the peak of PRVD (Vpk) as obtained from SAMI2 for the same period presented in Fig. 5a. One may notice from Fig. 5a and b that larger Vpk values imply earlier onset of scintillation (S4) activity and vice versa. A complementary panel (Fig. 5c) is offered showing the average F10.7 during the period. A dependency of the S4 percentage with the solar index F10.7 is clearly present, as well as a relation between F10.7 activity and Vpk values. A break in the axis exists due to the gap in S4 data between 2006 and 2010 as already mentioned in Sect. 3.

Figure 6Temporal variation of Vpk and S4 activity onset. The red circles denote the local time of Vpk occurrence, and the coral curves represent the pattern of S4 activity onset. The dashed blue line shows the clear phase correspondence between Vpk time and S4 activity onset.
Figure 6 shows the monthly averaged time of occurrence of Vpk obtained from SAMI2. Additionally, for comparison purposes, this plot shows in the coral curves the scintillation onset pattern across the months (September–March) for each year. It should be pointed out that this is an illustrative comparison to show the similarity in the behavior of the patterns in terms of monthly distribution (x axis); however, the S4 onset time pattern has no relation to the y axis in Fig. 6. One may notice that the time of Vpk and the time of scintillation onset activity follow exactly the same trend (blue dashed line elucidates the phase alignment). It must be said, however, that the temporal shift is different, i.e., the phase of the temporal occurrence is aligned, although the magnitude of temporal deviation is different: while S4 may vary ∼ 40 min from November–February, Vpk varies at most ∼ 18 min. Once more, there is a gap between 2006–2010 due to the absence of S4 data.
The role of the PRVD on the onset of RTI leading to the formation of EPB structures and, consequently, to the presence of the irregularities producing scintillation is already known either in the form of preconditioning (e.g., Abdu, 2001; Abdu et al., 2009) or in the form of seeder (Woodman, 1994; Sousasantos et al., 2013). The PRVD is responsible for altering some critical parameters of the equatorial ionospheric plasma, such as the collision frequency between ions and neutrals and the density gradient. Under the action of PRVD the instability RTI may find adequate ambient to grow. Results from Fig. 6 show that in addition to these known features, there is an apparent dominant trend which must be considered, especially for the forecasting of S4 scintillation, which is related to the variation of the time of Vpk occurrence throughout the months. The coincident trend between both the time of Vpk and the time of scintillation onset, considering a large number of observational data, is noticeable and may offer some appreciable information for a forecasting tool. Two elucidative examples of such a dependent pattern are the curves in Fig. 6 representing the years of 2002–2003 and 2012–2013. In the case of 2002–2003, a more pronounced minimum may be clearly noticed in both the time of Vpk occurrence and the time of S4 onset activity, i.e., both started earlier for a longer time than normally expected. In the case of 2012–2013, the opposite happened, i.e., the time of Vpk occurrence and the time of S4 onset activity started later than the usual behavior, following exactly the same trend.
The RTI instability usually takes some tens of minutes to grow into a mature EPB structure that reaches altitudes where it may efficiently be mapped to off-equatorial latitudes. However, a more severe scintillation scenario probably corresponds to the presence of multiple EPB structures covering a broad region in the low-latitude skies. Secondary EPB structures usually appear westward from the primary structure and may occur for a long time after the primary EPB rising (Tsunoda, 2015). Furthermore, EPB structures are frequently found in clusters and rarely as a single structure manifestation, and thus the time delay between the Vpk occurrence and the register of severe scintillation in low-latitude regions are in good agreement with the expectations. Moreover, earlier rising of the F layer associated with increasing magnitudes of Vpk, as is the case, may compose a more convenient scenario for larger growth rates of the instability leading to the presence of scintillation during earlier hours in the evening.
Recently, some efforts have been made in the attempt to predict EPB structures and/or scintillation (e.g., Retterer et al., 2005; Retterer, 2005; Kelley and Retterer, 2008; Rezende et al., 2010; Redmon et al., 2010; Carter et al., 2014a, b; Sousasantos et al., 2017). These works essentially deal only with the existence (or nonexistence) of EPB structures and/or scintillation; however, according to the results presented in Fig. 6, a more complete scenario about EPB and/or scintillation generation must include the variation of time of Vpk occurrence, especially in the case of use for technological and aeronautic applications where temporal location is highly desirable.
Abdu et al. (2010) presented observational data and model results showing that Vpk is highly dependent on the F10.7 index and may vary considerably over the Brazilian region under different solar flux conditions. Figure 7a shows the values of Vpk obtained from SAMI2 model plotted against the solar flux F10.7 data for the period under consideration. A linear correspondence may be verified and the red line elucidates this trend, which may be described in terms of the following linear approximation:
This approximation based in the dataset presented here is considerably close to the approximation proposed by Fejer et al. (1991) (summer panel in Fig. 3 in their paper); however, there are few differences since their equation was describing the Vpk over Jicamarca using radar data.
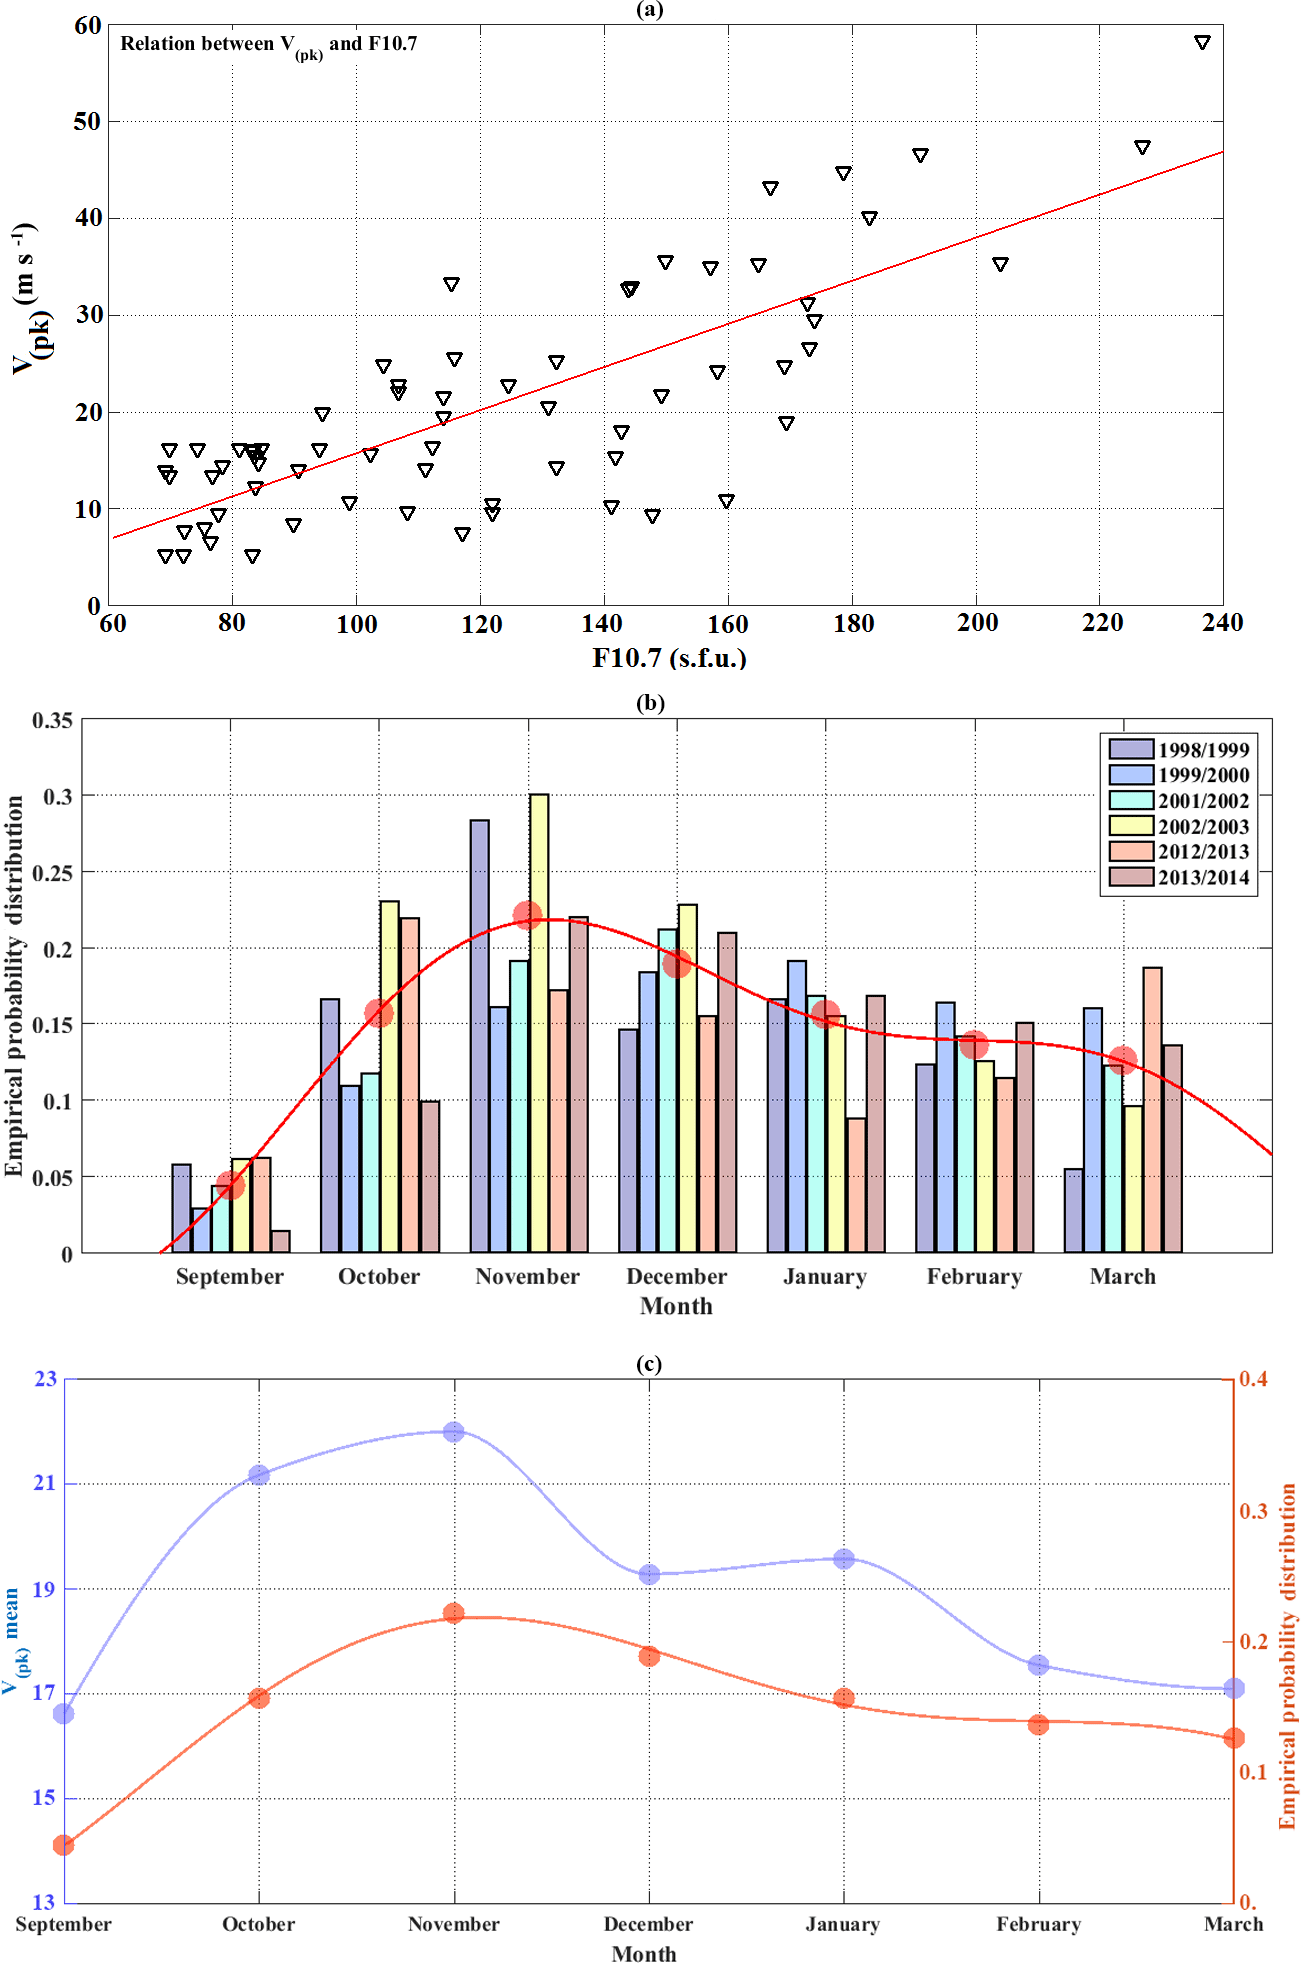
Figure 7(a) Vpk values obtained from SAMI2 model plotted against the solar flux F10.7. (b) Empirical probability distribution of scintillation occurrences during the season from September to March. (c) Comparison between the average patterns of the empirical distribution of scintillation occurrences and the Vpk values.
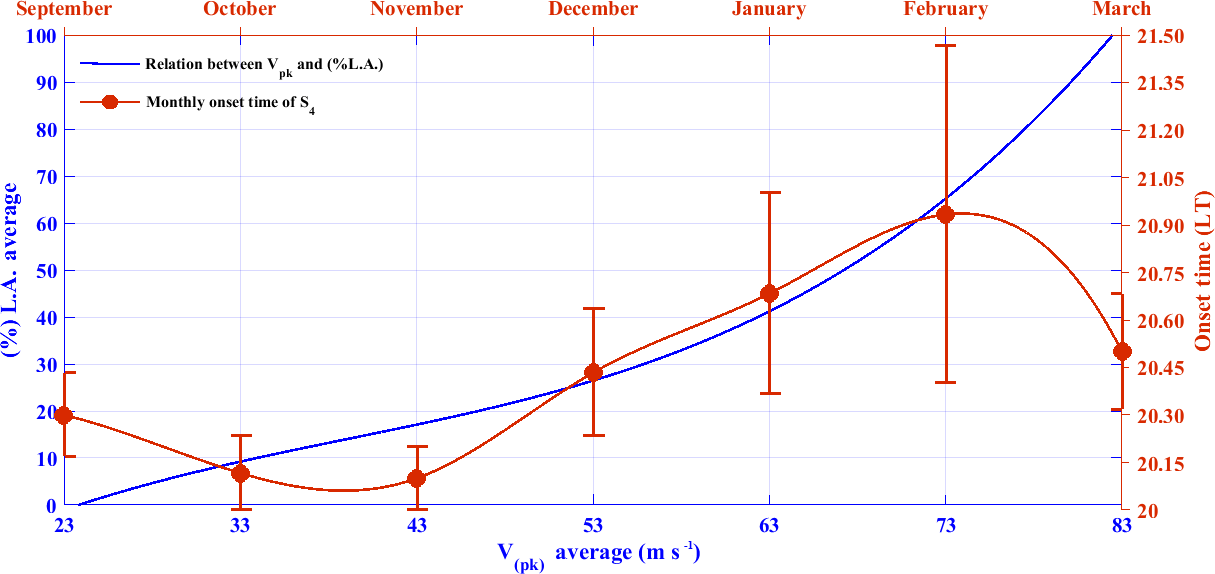
Figure 8Approximation proposed for maximum percentage of links affected according to Vpk values (blue line) and the monthly time variability of the S4 activity onset (red curve).
Following this, Fig. 7b shows an analysis of the empirical probability distribution of scintillation occurrences throughout the months (colored bars) of the years where the data from the sequence of 7 months from September to March were available. For the periods of 2000–2001, 2003–2004, 2004–2005 and 2011–2012, eventually there were gaps in the receiver acquisition for some months; therefore for those years no empirical distributions were computed and consequently they are not exhibited in Fig. 7b. In red filled circles the average value for each month is depicted. A pattern may be noticed (red solid line) and it starts increasing from September, reaching its maximum in November, presenting a gradual decrease during December to March. The presence of EPB structures or scintillation is very rare over the Brazilian region during April–August, and then this scintillation activity through the months is in agreement with Sobral et al. (2002) and Moraes et al. (2017b). Figure 7c shows a comparison between the averaged empirical probability distribution and the average trend of the Vpk values. The correspondence throughout the months may be noticed and seems to indicate a good agreement between the magnitude of Vpk and the subsequent occurrence of the scintillation across the months of the year.
For practical purposes, it is desirable to obtain some expression for estimation of the percentage of links affected in terms of F10.7 mainly because these data are, often, of easy access and daily values may be obtained and used for a forecast attempt. However, once S4 activity magnitude and onset time depends greatly on the Vpk profile (magnitude and time of occurrence), an approximation using this parameter seems to be the most adequate approach. Furthermore, Vpk is a parameter with more direct implications in the phenomenology under study and it is also related with F10.7. Based on the Vpk values from the simulations performed and on the field measurements on percentage of links affected, the following approximation may be adopted (with coefficient of determination = 94.2 %):
Since the real percentage of links affected depends on many factors (the number of available links, geomagnetic conditions, winds circulation, etc.), Eq. (3) is one of the possible approximations and is valid strictly for similar conditions. This initial approach must be improved by introducing more parameters and real vertical drift data. In the meantime this equation may help users of GPS systems to estimate the scenario once information of Vpk is obtained.
Finally, Fig. 8 shows the results of the approximation given by Eq. (3) (blue curve related with the blue axis) as well as the time onset of S4 activity (red curve related with the red axis) calculated from the dataset and already listed in the Table 1. It is possible to realize that values of Vpk>22 m s−1 may provide a favorable scenario to the generation of EPB structures and/or scintillation (blue curve) as pointed out by Abdu et al. (2009); moreover, values from such orders of magnitude usually correspond to F10.7 > 80 (Abdu et al., 2010), where s.f.u. stands for solar flux units. Furthermore, one may notice that values of Vpk≥80 m s−1 impose extreme conditions, causing a large amount of links degradation (90–100 % of L.A.). These values of Vpk are usually verified over the Brazilian region during severe solar cycles with strong solar flux (Abdu et al., 2010). Thus, it is reasonable that they correspond to the worst scenario for the satellite communication.
The red curve (related to the red axis) provides information about the trend of the onset time variation of S4 activity found in the dataset. As mentioned before, there is a clear pattern in the scintillation (S4) activity, which shows onset times starting earlier (September–November) and gradually later (December–February), with a decrease in March. The usage of the information contained in this figure may support technological applications and civil aviation users for augmentation systems like GBAS, since it may offer a preliminary tool to predict scintillation severity and both parameters are given, i.e., the percentage of links affected (blue curve) and the onset time according with the month under consideration (red curve). It should be mentioned that this result has been obtained during geomagnetic quiet conditions and may be significantly altered during storm time periods.
In cases where Vpk information is not available, assuming the linear relation between Vpk and F10.7 given in the Eq. (2), after a few algebra steps a simplified equation may be found in terms of F10.7:
This simplified relation presents a more saturated behavior, reaching ∼ 70 % of links affected for the higher values of solar flux usually registered (∼ 250 ). However, the usage of F10.7 parameter may be of easy access and may supply the absence of Vpk information, even though the Eq. (3) is recommended and Eq. (4) may be assumed as a lower bound approximation.
For a more realistic result, the approaches presented here may be improved by including a long-term Vpk data calculated through data obtained from digital ionosonde measurements.
The ionosonde data could express more realistically the ionospheric dynamics over Brazilian region where some unique features take place. Moreover, other controlling factors, which may play an important role in the generation of the scintillation-producing irregularities, could be addressed, such as the base and peak heights of the equatorial F layer after sunset (Manju et al., 2007), the time duration of the post-sunset upward drift associated with PRVD and its time reversal to downward (Carrasco et al., 2005), the thermospheric meridional wind effects (Abdu et al., 2006), and the spatial gradients of the ambient electron density (Muella et al., 2010). Furthermore, some models, such as the latest version of IRI, offer some additional hmF2 calculations which may present improvements to the results. A more detailed analysis by considering other important features of the scintillation activity is planned for a future work.
This work presented and discussed the climatology of the scintillation onset over southern Brazil, in a station located in Cachoeira Paulista, a place under the southern crest of the equatorial ionization anomaly. This study showed that GNSS L band amplitude fluctuations present a pattern in the onset time of scintillation detection. During the months of October and November scintillation starts around 20:00 LT, whereas for the months of January and February there is a delay in comparison with those months and scintillation starts around 20:40 LT. This feature was observed recurrently during the periods of high-scintillation activity that occurred throughout the months of September–March from 1998 to 2014. The signature pattern at the scintillation onset time observed here in this work is for GPS-L1 signals. However, as shown in Moraes et al. (2017a), the average scintillation onset time value for GPS L2C (1227 MHz) and L5 (1176 MHz) signals are very similar to those for L1. Therefore it is reasonable to expect, by analogy, the same pattern in the scintillation onset time observed for these new civil GPS signals.
Using SAMI2 model long-term profiles of the prereversal vertical drift were obtained and monthly averaged values of its peak were calculated. The comparison of the Vpk magnitudes with the scintillation data shows a close relation, and the onset time of the scintillation activity was found to vary inversely to the increasing values of Vpk. Moreover, profiles of the time of Vpk occurrence shows a tight correspondence with the onset time of scintillation activity during the whole dataset results from 2002–2003 and 2012–2013 are remarkable examples of this relation.
An approximation for the scintillation activity forecast based on the Vpk values and our dataset was proposed (Eq. 3), and afterwards a simplified expression in terms of F10.7 (Eq. 4) is presented by assuming a linear relation between F10.7 and Vpk as given by the Eq. (2).
Finally, the temporal characterization of the ionospheric irregularities presented in this work may aid, for example, GBAS services in the supply of navigation and precision approach services in the immediate vicinity of the airport, experiencing more precisely the time at which the service may be affected. Additionally, the empirical equations proposed here may also help in the forecast (based on the Vpk information and/or solar flux data) of the ratio of satellite links that may be vulnerable to the effects of scintillation simultaneously, watching over unavailability issues. The analysis and approximations proposed may also be used for oil extraction maritime stations positioning or precision agriculture since simplifications were performed to make the equations and parameters more accessible.
The variation of Vpk magnitude in the Brazilian region, whose declination is large in comparison with other regions of the globe, is directly related with the alignment of the solar terminator with the magnetic field lines (Batista et al., 1986); thus, the subsequent phenomenology (e.g., EPB structures and the presence of scintillation) is dependent on this geometry. Highly aligned conditions favor the maintenance of larger electric fields during the nighttime which in turn imply larger Vpk values and faster evolution of EPB structures and scintillation spread along field lines. In future work, additional data from digital ionosonde and more physical parameters must be incorporated into this approach, in order to provide an improvement to the description of these peculiarities over the Brazilian region and advances in the prognostic equations.
The OMNI data were obtained from the GSFC/SPDF OMNIWeb interface at https://omniweb.gsfc.nasa.gov (Goddard Space Flight Center, 2017). Scintillation data used in this study may be available by contacting the author (Alison de Oliveira Moraes, e-mail: alisonaom@iae.cta.br).
JS, AdOM, JHAS and RSP analyzed the data, proposed the empirical models and plotted the graphs. MTAHM and ERdP designed the experiments and carried them out. JS, AdOM and MTAHM prepared the paper with the contributions of all other co-authors.
The authors declare that they have no conflict of interest.
This article is part of the special issue “Space weather connections to near-Earth space and the atmosphere”. It is a result of the 6∘ Simpósio Brasileiro de Geofísica Espacial e Aeronomia (SBGEA), Jataí, Brazil, 26–30 September 2016.
This work uses the SAMI2 ionosphere model written
and developed by the Naval Research Laboratory. Jonas Sousasantos
acknowledges
Joseph D. Huba and NRL for SAMI2 distribution. Alison de Oliveira Moraes, José H. A. Sobral,
Eurico R. de Paula and Marcio T. A. H. Muella
are grateful to the support from Conselho Nacional de
Desenvolvimento Científico e Tecnológico (CNPq) through grants
465648/2014-2 (INCT), 303741/2014-7, 310802/2015-6 and 304674/2014-1 &
429885/2016-4, respectively. This work is supported by São Paulo
Research Foundation (FAPESP) under award number (INCT) 17/50115-0. We acknowledge the teams who created and
provided the wind and ACE magnetic field and plasma data used in this
analysis, including R. P. Lepping, A. Szabo, A. J. Lazarus, J. C. Kasper, N. F. Ness, C. W. Smith,
D. J. McComas and R. Skoug.
The topical editor, Dalia Buresova, thanks Sergio Magdaleno and one anonymous referee for help in evaluating this paper.
Abdu, M. A.: Outstanding problems in the equatorial ionosphere-thermosphere electrodynamics relevant to spread F, J. Sol.-Terr. Phys., 63, 869–884, https://doi.org/10.1016/S1364-6826(00)00201-7, 2001.
Abdu, M. A., Bittencourt, J. A., and Batista, I. S.: Magnetic declination control of the equatorial F region dynamo field development and spread-F, J. Geophys. Res., 86, 11443–11446, 1981.
Abdu, M. A., Batista, I. S., and Sobral, J. H. A.: A new aspect of magnetic declination control on equatorial spread-F and F region dynamo, J. Geophys. Res., 97, 14897–14904, 1992.
Abdu, M. A., Iyer, K. N., de Medeiros, R. T., Batista, I. S., and Sobral, J. H. A.: Thermospheric meridional wind control of equatorial spread-F and evening prereversal electric field, Geophys. Res. Lett., 33, L07106, https://doi.org/10.1029/2005GL024835, 2006.
Abdu, M. A., Batista, I. S., Reinisch, B. W., de Souza, J. R., Sobral, J. H. A., Pedersen, T. R., Medeiros, A. F., Schuch, N. J., de Paula, E. R., and Groves, K. M.: Conjugate Point Equatorial Experiment (COPEX) campaign in Brazil: Electrodynamics highlights on spread F development conditions and day-to-day variability, J. Geophys. Res., 114, A04308, https://doi.org/10.1029/2008JA013749, 2009.
Abdu, M. A., Batista, I. S., Brum, C. G. M., MacDougall, J. W., Santos, A. M., de Souza, J. R., and Sobral, J. H. A.: Solar flux effects on the equatorial evening vertical drift and meridional winds over Brazil: A comparison between observational data and IRI model and the HWM representations, Adv. Space Res., 46, 1078–1085, https://doi.org/10.1016/j.asr.2010.06.009, 2010.
Basu, S. and Basu, Su.: Equatorial scintillations – a review, J. Atmos. Terr. Phys., 43, 473–489, https://doi.org/10.1016/0021-9169(81)90110-0, 1981.
Batista, I. S., Abdu, M. A., and Bittencourt, J. A.: Equatorial F region vertical plasma drifts: seasonal and longitudinal asymmetries in the American sector, J. Geophys. Res., 91, 12055–12064, https://doi.org/10.1029/JA091iA11p12055, 1986.
Beach, T. L. and Kintner, P. M.: Development and use of a GPS ionospheric scintillation monitor, IEEE T. Geosci. Remote, 39, 918–928, https://doi.org/10.1109/36.921409, 2001.
Carrasco, A. J., Batista, I. S., and Abdu, M. A.: The prereversal enhancement in the vertical drift for Fortaleza and the sporadic E layer, J. Atmos. Sol.-Terr. Phys., 67, 1610–1617, https://doi.org/10.1016/j.jastp.2005.07.015, 2005.
Carter, B. A., Retterer, J. M., Yizengaw, E., Groves, K., Caton, R., McNamara, L., Bridgwood, C., Francis, M., Terkildsen, M., Norman, R., and Zhang, K.: Geomagnetic control of equatorial plasma bubble activity modeled by the TIEGCM with Kp, Geophys. Res. Lett., 41, 5331–5339, https://doi.org/10.1002/2014GL060953, 2014a.
Carter, B. A., Retterer, J. M., Yizengaw, E., Wiens, K., Wing, S., Groves, K., Caton, R., Bridgwood, C., Francis, M., Terkildsen, M., Norman, R., and Zhang, K.: Using solar wind data to predict daily GPS scintillation occurrence in the African and Asian low-latitude regions, Geophys. Res. Lett., 41, 8176–8184, https://doi.org/10.1002/2014GL062203, 2014b.
Fejer, B. G., de Paula, E. R., González, S. A., and Woodman, R. F.: Average vertical and zonal F region plasma drifts over Jicamarca, J. Geophys. Res., 96, 13901–13906, https://doi.org/10.1029/91JA01171, 1991.
Goddard Space Flight Center: Space Physics Data Facility, available at: https://omniweb.gsfc.nasa.gov/, last access: 23 August 2017.
Huba, J. D., Joyce, D., and Fedder, J. A.: Sami2 is Another Model of the Ionosphere (SAMI2): A new low-latitude ionosphere model, J. Geophys. Res., 105, 23035–23053, https://doi.org/10.1029/2000JA000035, 2000.
Jayachandran, B., Balan, N., Rao, P. B., Sastri, J. H., and Bailey, G. J.: HF Doppler and Ionosonde observations on the onset conditions of equatorial spread F, J. Geophys. Res., 98, 13741–13750, https://doi.org/10.1029/93JA00302, 1993.
Kelley, M. C. and Retterer, J.: First successful prediction of a convective equatorial ionospheric storm using solar wind parameters, Space Weather, 6, S08003, https://doi.org/10.1029/2007SW000381, 2008.
Kintner, P. M., Ledvina, B. M., and de Paula, E. R.: GPS and ionospheric scintillations, Space Weather, 5, S09003, https://doi.org/10.1029/2006SW000260, 2007.
Manju, G., Devasia, C. V., and Sridharan, R.: On the seasonal variations of the threshold height for the occurrence of equatorial spread F during solar minimum and maximum years, Ann. Geophys., 25, 855–861, https://doi.org/10.5194/angeo-25-855-2007, 2007.
Moraes, A. O., Rodrigues, F. S., Perrella, W. J., and de Paula, E. R.: Analysis of the characteristics of low-latitude GPS amplitude scintillation measured during solar maximum conditions and implications for receiver performance, Surv. Geophys., 33, 1107–1131, https://doi.org/10.1007/s10712-011-9161-z, 2011.
Moraes, A. O., de Paula, E. R., and Perrella, W. J.: On the distribution of GPS signal amplitudes during the low-latitude ionospheric scintillation, GPS Solutions, 17, 499–510, https://doi.org/10.1007/s10291-012-0295-3, 2012.
Moraes, A. O., Costa, E., and de Paula, E. R.: Extended ionospheric amplitude scintillation model for GPS receivers, Radio Sci., 49, 315–329, https://doi.org/10.1002/2013RS005307, 2014a.
Moraes, A. O., de Paula, E. R., and Muella, M. T. A. H.: On the second order statistics for GPS ionospheric scintillation modelling, Radio Sci., 49, 94–105, https://doi.org/10.1002/2013RS005270, 2014b.
Moraes, A. O., Costa, E., Abdu, M. A., Rodrigues, F. S., de Paula, E. R., Kelias, O., and Perella, W. J.: The variability of low-latitude ionospheric amplitude and phase scintillation detected by a triple-frequency GPS receiver, Radio Sci., 52, 439–460, https://doi.org/10.1002/2016RS006165, 2017a.
Moraes, A. O., Muella, M. T. A. H., de Paula, E. R., de Oliveira, C. B. A., Terra, W. P., Perrella, W. J., and Meinbach-Rosa, P. R. P.: Statistical evaluation of GLONASS amplitude scintillation over low latitudes in the Brazilian territory, Adv. Space Res., 2017, 1776–1789, https://doi.org/10.1016/j.asr.2017.09.032, 2017b.
Muella, M. T. A. H., de Paula, E. R., Fagundes, P. R., Bittencourt, J. A., and Sahai, Y.: Thermospheric meridional wind control on equatorial scintillations and the role of the evening F-region height rise, E×B drift velocities and F2-peak density gradientes, Surv. Geophys., 31, 509–530, https://doi.org/10.1007/s10712-010-9101-3, 2010.
Muella, M. T. A. H., Duarte-Silva, M. H., Moraes, A. O., de Paula, E. R., de Rezende, L. F. C., Alfonsi, L., and Affonso, B. J.: Climatology and modeling of ionospheric scintillations and irregularity zonal drifts at the equatorial anomaly crest region, Ann. Geophys., 35, 1201–1218, https://doi.org/10.5194/angeo-35-1201-2017, 2017.
Oyekola, O. S.: A study of evolution/suppression parameters of equatorial postsunset plasma instability, Ann. Geophys., 27, 297–301, https://doi.org/10.5194/angeo-27-297-2009, 2009.
Priyadarshi, S.: A review of ionospheric scintillation models, Surv. Geophys., 36, 295–324, https://doi.org/10.1007/s10712-015-9319-1, 2015.
Redmon, R. J., Anderson, D., Caton, R., and Bullett, T.: A Forecasting Ionospheric Real-time Scintillation Tool (FIRST), Space Weather, 8, S12003, https://doi.org/10.1029/2010SW000582, 2010.
Retterer, J. M.: Physics-based forecasts of equatorial radio scintillation for the Communication and Navigation Outage Forecasting System (C/NOFS), Space Weather, 3, S12C03, https://doi.org/10.1029/2005SW000146, 2005.
Retterer, J. M., Decker, D. T., Borer, W. S., Daniell Jr., R. E., and Fejer, B. G.: Assimilative modeling of the equatorial ionosphere for scintillation forecasting: Modeling with vertical drifts, J. Geophys. Res., 110, A11307, https://doi.org/10.1029/2002JA009613, 2005.
Rezende, L. F. C., de Paula, E. R., Stephany, S., Kantor, I. J., Muella, M. T. A. H., Siqueira, P. M., and Correa, K. S.: Survey and prediction of the ionospheric scintillation using data mining techniques, Space Weather, 8, S06D09, https://doi.org/10.1029/2009SW000532, 2010.
Scherliess, L. and Fejer, B. G.: Radar and satellite global equatorial F region vertical drift model, J. Geophys. Res., 104, 6829–6842, https://doi.org/10.1029/1999JA900025, 1999.
Sobral, J. H. A., Abdu, M. A., Zamlutti, C. J., and Batista, I. S.: Association between plasma bubble irregularities and airglow disturbances over Brazilian low latitudes, Geophys. Res. Lett., 7, 980–982, https://doi.org/10.1029/GL007i011p00980, 1980.
Sobral, J. H. A., Abdu, M. A., Takahashi, H., Taylor, M. J., de Paula, E. R., Zamlutti, C. J., de Aquino, M. G., and Borba, G. L.: Ionospheric plasma bubble climatology over Brazil based on 22 years (1977–1998) of 630 nm airglow observations, J. Atmos. Sol.-Terr. Phys., 64, 1517–1524, https://doi.org/10.1016/S1364-6826(02)00089-5, 2002.
Sousasantos, J., Kherani, E. A., and Sobral, J. H. A.: A numerical simulation study of the collisional-interchange instability seeded by the pre-reversal vertical drift, J. Geophys. Res., 118, 7438–7449, https://doi.org/10.1002/2013JA018803, 2013.
Sousasantos, J., Kherani, E. A., and Sobral, J. H. A.: An alternative possibility to equatorial plasma bubble forecast through mathematical modeling and Digisonde data, J. Geophys. Res., 122, 2079–2088, https://doi.org/10.1002/2016JA023241, 2017.
Tsunoda, R. T.: Upwelling: a unit of disturbance in equatorial spread F, Prog. Earth Planet. Sci., 2, 9, https://doi.org/10.1186/s40645-015-0038-5, 2015.
Woodman, R. F.: Equatorial ionospheric irregularities as observed by the Jicamarca radar, in: Low-Latitude Ionospheric Physics, edited by: Kuo, F. S., p. 85, Pergamon Press, New York, 1994.