the Creative Commons Attribution 4.0 License.
the Creative Commons Attribution 4.0 License.
Case study of ozone anomalies over northern Russia in the 2015/2016 winter: measurements and numerical modelling
Yury M. Timofeyev
Yana A. Virolainen
Alexander S. Garkusha
Alexander V. Polyakov
Maxim A. Motsakov
Ole Kirner
Episodes of extremely low ozone columns were observed over the territory of Russia in the Arctic winter of 2015/2016 and the beginning of spring 2016. We compare total ozone columns (TOCs) from different remote sensing techniques (satellite and ground-based observations) with results of numerical modelling over the territory of the Urals and Siberia for this period. We demonstrate that the provided monitoring systems (including the new Russian Infrared Fourier Spectrometer IKFS-2) and modern three-dimensional atmospheric models can capture the observed TOC anomalies. However, the results of observations and modelling show differences of up to 20 %–30 % in TOC measurements. Analysis of the role of chemical and dynamical processes demonstrates that the observed short-term TOC variability is not a result of local photochemical loss initiated by heterogeneous halogen activation on particles of polar stratospheric clouds that formed under low temperatures in the mid-winter.
- Article
(5003 KB) - Full-text XML
- BibTeX
- EndNote
Extremely low values of total ozone columns (TOCs) were recorded in January–February 2016 in the polar region of the Northern Hemisphere (Zvyagintsev et al., 2016; Manney and Lawrence, 2016). Observed low values were recorded long before the beginning of spring, when chemical destruction of ozone occurs periodically in the Northern Hemisphere as a result of a strong vortex and the long existence of polar stratospheric clouds (PSCs) (Manney et al., 2011). Early TOC anomalies during the winter of 2015/2016 lead to the question of whether chemical ozone destruction, for which a long existence of PSCs is necessary, is completely responsible for the observed anomalies, or whether other factors, especially dynamic ones, have an important effect on the observed features. The analysis of the meteorological conditions during the winter of 2015/2016 showed that during this period the lower polar stratosphere was extremely cold, which created a potential for a record ozone depletion in the spring of 2016, but a strong sudden stratospheric warming in early March 2016 destroyed the polar vortex and prevented formation of a spring ozone anomaly (Manney and Lawrence, 2016). Nevertheless, during the entire winter of 2015/2016 in the northern part of Russia, the ozone content was lower than in previous years, and the depth of short-term ozone anomalies in January and February 2016 was comparable to the depth of the ozone mini-holes of the spring of 2011.
Over recent decades, investigation of total ozone timescale variations demonstrated regular occurrence of a strong ozone depletion over the Antarctic region in spring. This phenomenon is called the “ozone hole”. In the Northern Hemisphere, similar to the Southern Hemisphere, the ozone loss in polar spring usually has been observed on smaller spatial scales as well as over shorter time intervals (Manney et al., 2011; Balis, 2011). For episodes with extremely low TOCs (less than 220 Dobson units) such as in the spring of 2011 this phenomenon was called an “ozone mini-hole” (Millan and Manney, 2017). Observation and prediction of the occurrence of episodes with extremely low ozone columns close to “mini-holes” are crucial for both the investigation of its nature and for the prediction of potential increase in UV radiation on the Earth's surface. Unusually sharp and repetitive TOC loss was observed over the territory of the Urals and Siberia in the first quarter of 2016. In some cases, the TOC loss reached 40 %–50 % in comparison with climatic values (Zvyagintsev et al., 2016).
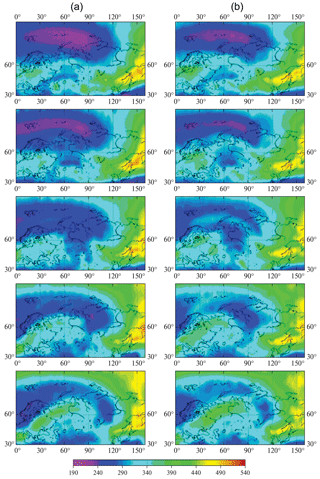
Figure 1Spatial distributions of total ozone columns on 23–27 February 2016, based on measurements of two instruments of the same type – IKFS-2 (column a) and IASI (column b) (Garkusha et al., 2018).
In this paper, we study the episodes of low TOCs over some Russian stations in January and February 2016 based on remote sensing observations and results of numerical modelling.
Monitoring of the total ozone level is provided by various ground-based remote sensing systems (Brewer and Dobson spectrophotometers, M-124 filter ozonometers, DOAS, microwave and IR methods, lidar measurements) and by various satellite systems (World Ozone and Ultraviolet Radiation Data Centre, 2018; Goddard Space Flight Center, 2018; Earth Observation portal, 2018; Timofeyev and Vasiliev, 2008; Staehelin et al., 2001). According to regular extensive validation programs (Balis et al., 2007; Boynard et al., 2016; Garkusha et al., 2017), total ozone measurement errors can be from 1 %–2 % to 10 %, depending on the method, device, time, and place of the measurements.
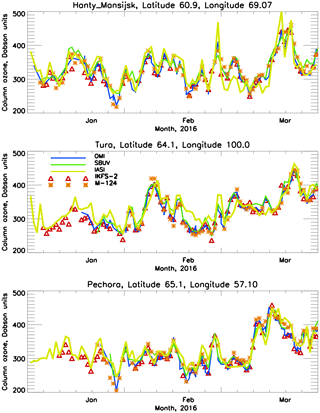
Figure 2Total ozone measurements provided by OMI, M-124, IKFS-2, IASI, and SBUV for the stations Khanty-Mansiysk, Tura, and Pechora.
We analysed total ozone data of the first quarter of 2016, obtained by the basic Russian ground-based ozonometer M-124 and the satellite instruments OMI and SBUV (recording outgoing solar reflected and scattered spectra of UV radiation), IASI, and a new Russian instrument, IKFS-2 (recording outgoing atmospheric thermal IR radiation). The features of satellite instruments such as OMI, SBUV, and IASI or the Russian ground-based ozonometer M-124 are well known (Balis et al., 2007; Bhartia et al., 2013; Kroon et al., 2008; Viatte et al., 2011; Boynard et al., 2016). Independent assessments of TOC measurement errors showed values of 3.3 %–4.1 % for IASI, 2.0 %–3.5 % for M-124, and 1.9 %–2.1 % for OMI instruments (Virolainen et al., 2017). The infrared Fourier-transform spectrometer IKFS-2 onboard the satellite Meteor-M N2 was launched in July 2014. IKFS-2 was preeminently designed for temperature–humidity sounding of the atmosphere and for measurement of climate-relevant gases, including ozone. A detailed description of the characteristics of IKFS-2 is given by Golovin et al. (2014). The advantage of the IKFS-2 and IASI instruments is its ability to conduct measurements in the absence of sunlight, which is especially important in polar regions, where during polar night solar radiation measurements are impossible.
The description of the IKFS-2 measurement interpretation methodology, as well as an estimation of the errors of TOC measurements for cloudless and cloudy atmospheres, are given in Garkusha et al. (2017) and Garkusha et al. (2018). The technique of interpretation, based on the method of artificial neural networks (ANNs), is described in detail in Garkusha et al. (2017). The approximation of the solving operator of the inverse problem by a three-layer perceptron is used. The activation function of the neurons of the hidden layer is the hyperbolic tangent, and is linear. The main feature of this technique is the use as predictors of principle components (PC) of the spectra measured by IKFS-2. The set of predictors consists of 25 PC of the entire measured spectrum (660–2000 cm−1) and 50 PC only for the ozone absorption band and the measurement zenith angle. For ANN training, the results of TOC measurements of the OMI instrument on the AURA satellite were used (McPeters et al., 2015). Estimates of the error in determining the TOCs with IKFS-2 are on average in the range of 2 %–6 %. The largest differences (up to 10 %) are observed in the southern polar latitudes in the presence of an ozone hole over Antarctica.
In the first quarter of 2016, three short-term periods with significantly lower daily TOCs, compared to the climatologically averaged values for the period from 1979 to 2017, were observed over the territory of Russia. TOC decreases reached 39 %–52 % (on 26 January–1 February 2016 over the northern regions of the Urals and Siberia), 30 %–50 % (on 20 February–3 March 2016 over northern Siberia), and 27 %–39 % (on 9–19 March 2016 over central Siberia) of daily averaged values of ozone column (191–257, 227–321, and 257–321 DU for these three periods) (Zvyagintsev et al., 2016). Extremely low winter TOC values (episodically less than the mini-hole threshold) were observed over the northern regions of the Urals and Siberia for the first time. During 27–31 January 2016 TOCs smaller than 220 DU were recorded at Russian ozonometric network stations using M-124 measurements (Pechora, 65∘ N, 57∘ E; Khanty-Mansiysk, 61∘ N, 69∘ E; Turukhansk, 66∘ N, 88∘ E; Round, 64∘ N, 100∘ E) and by OMI onboard the Aura satellite.
Figure 1 taken from Garkusha et al. (2018) depicts the spatial distribution of TOCs on 23–27 February 2016, based on measurements of the two instruments of the same type IKFS-2 and IASI. The figure shows good agreement between these two independent satellite measurements.
Figure 2 presents the evolution of TOCs measured at three ground-based observational stations: Khanty-Mansyisk (61∘ N, 69∘ E), Tura (64∘ N, 100∘ E), and Pechora (65∘ N, 57∘ E). The comparison allows us to draw the following conclusions.
All instruments and measurement methods generally provide a good description of the main features of TOC time variations, including observed short-term ozone loss. For the complete period the averaged differences between the different types of measurements are about 1 %–5 %, with standard deviations of 3 %–8 %.
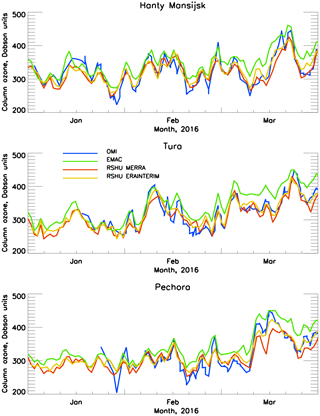
Figure 3Total ozone measurements provided by OMI and simulation results from EMAC and the RSHU for the stations Khanty-Mansiysk, Tura, and Pechora.
The only exceptions are the IASI measurements in Khanty-Mansiysk and Tura, for which the standard deviations of the differences with ground-based measurements of M-124 reach 12 % in the first quarter of 2016. In addition, IASI data overestimate the M-124 measurements by 11 % on average at the Tura station.
All satellite data overestimate the values of TOC in comparison with ground-based measurements of M-124 during the short-term periods of ozone loss. This is probably because the optimal retrieved solution is not constructed only from the atmospheric radiation spectra that have been measured, but also applies a priori information for the calculation of TOCs. This a priori information does not account for a particular ozone profile and may cause distortions in the estimation of the local TOC. To exclude this effect, it is necessary to improve the a priori information by making it dependent on the type of ozone profile, characteristic for the season and the region and observations.
In order to evaluate the observational data, we compare them with results of numerical modelling. Values of TOC were calculated by two three-dimensional atmospheric chemistry models, which take into account observed variations of meteorological parameters by using reanalysis for the prognostic variables temperature, vorticity, divergence, and surface pressure, in two different ways. We performed simulations with chemistry-climate model (CCM) ECHAM/MESSy Atmospheric Chemistry (EMAC, Jöckel et al., 2006), applying a nudging technique using the ERA-Interim reanalysis (Dee et al., 2011), and with the Russian State Hydrometeorological University chemistry-transport model (RSHU CTM) using directly the meteorological fields of the ERA-Interim or MERRA reanalysis (Smyshlyaev et al., 2017). The motivation for using two different models is to assess on the one hand the impact of the interactive coupling between dynamical and chemical processes available in the CCM, and on the other hand the impact of the given offline meteorological reanalysis fields linked to chemical and transport processes used in the CTM. In addition, the models have different spatial resolutions, which makes it possible to estimate the effect of model resolution on the comparison with the observations related to the local points.
The EMAC model is a numerical chemistry and climate simulation system that includes tropospheric and middle atmosphere processes (Jöckel et al., 2010). It uses the second version of the Modular Earth Submodel System (MESSy2). The core atmospheric model is the 5th generation European Centre Hamburg general circulation model (ECHAM5, Roeckner et al., 2006). The core model ECHAM5 uses a spectral transform technique, the so-called T-value indicating the degree of triangular spectral truncation. For the present study, we applied EMAC (ECHAM5 version 5.3.02, MESSy version 2.52) in T42 resolution, i.e. with a spherical truncation of T42 (corresponding to a quadratic grid of 2.8×2.8∘, respectively, in latitude and longitude). Vertically, the model resolves the troposphere, stratosphere, and lower mesosphere (39 hybrid levels from the surface up to 0.01 hPa, about 80 km). As mentioned we applied a Newtonian relaxation technique (nudging) to our model simulation with the help of the ERA-Interim reanalysis data set (Dee et al., 2011) to improve consistency between the simulated and observed temperature and wind fields responsible for the dynamical impact on ozone distribution. A detailed description of the EMAC model and its applications can be found in Jöckel et al. (2010), Righi et al. (2015), or Virolainen et al. (2016).
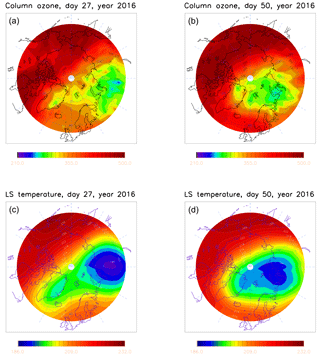
Figure 4Column ozone (DU) for the days with minimum local registered values (27 January, a, c, and 19 February, b, d), simulated with the RSHU model (a, b) and temperature of the lower stratosphere (K) from MERRA reanalysis (c, d).
The global RSHU CTM is based on the Institute of Numerical Mathematics and Russian State Hydrometeorological University (INM RAS – RSHU) CCM (Galin et al., 2007), but meteorological fields are not calculated but specified from the ERA-Interim or Modern-Era Retrospective Analysis for Research and Applications (MERRA) (Rienecker et al., 2011) reanalyses. The use of different reanalysis data made it possible to compare their effect on the observed short-period variability of the ozone content at the observation stations in this study. The RSHU CTM has a 5×4∘ horizontal resolution in longitude by latitude and 31 vertical sigma levels from the surface up to approximately 60 km. The distributions of the oxygen, hydrogen, nitrogen, chlorine, bromine, and carbon gases are calculated in the manner described by Smyshlyaev et al. (1998). PSC formation and evolution are taken into account according to Smyshlyaev et al. (2010).
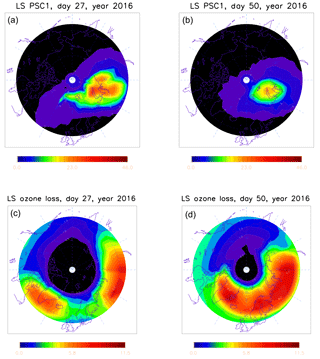
Figure 5Polar stratospheric cloud surface area (108 cm2 cm−3) for days with minimum local registered column ozone values (27 January, a, c, and 19 February, b, d), simulated with the RSHU model (a, b) and averaged ozone loss coefficient (108 s−1) of the lower stratosphere for the same days (c, d).
In Fig. 3 the comparison between OMI measurements (version TOMS) with the simulation results of EMAC and RSHU (the first simulation uses the MERRA, the second simulation the ERA-Interim reanalysis) is illustrated. The following conclusions can be drawn.
-
Both models sufficiently describe time variations of the total ozone content. On average, the RSHU model provides 1 %–2 % smaller values of the TOC than those observed by OMI. EMAC, conversely, overestimates the OMI measurements by 7 %–9 %. The standard deviations for both models are 6 %–7 %. This approaches the standard deviations between different types of measurements of the total ozone content during the examined period.
-
EMAC better describes the TOC variations during some ozone loss periods than the RSHU CTM model. For example, at the Khanty-Mansiysk station the standard deviation stands at 4 %–5 % for EMAC, whereas the RSHU model ranges between 6 % and 8 %. At the Tura station during the January minima, on the contrary, the RSHU model is in better agreement with OMI measurements (3 % vs. 7 %). Neither of the both models describes the observed January mini-holes at the Pechora station (standard deviations reach 12 %–15 %).
-
On certain days, the differences between measurements and modelling can be up to 20 %–30 %. Both models often overestimate the total ozone content measured by the OMI instrument (especially the EMAC model).
In general, the comparison of the EMAC and RSHU simulations, which both use the ERA-Interim reanalysis, and OMI, demonstrate that the interactive coupling between dynamical and chemical processes as well as the different spatial resolutions do not have a principal influence on the quality of the representation of the short-term column ozone variability at local points. Both models show a good qualitative agreement with the OMI satellite observations, while for some local points and time periods the best agreement is shown by the EMAC CCM, and for others by the RSHU CTM. Comparison of the results of both RSHU CTM simulations, using different re-analysis data sets, show that for MERRA data, the column ozone is systematically lower than for ERA-Interim data.
The role of chemical and dynamic processes in the observed TOC variability over Russia is assessed based on the RSHU CTM calculations. Two days with the lowermost TOCs registered at all stations were selected for an extended analysis. These days are 27 January (day 27) and 19 February 2016 (day 50) (Fig. 3). Results of RSHU CTM simulations for these days are presented in Fig. 4 for column ozone together with the MERRA temperature data averaged for the lower stratosphere (14–25 km). The regions with low TOCs are consistent with the low stratospheric temperatures. This is a result of dynamical isolation, which leads to stratospheric cooling and may cause ozone depletion due to heterogeneous chemical reactions on PSCs particles leading to chlorine activation.
The surface areas of the PSCs for the days with low stratospheric temperature and low column ozone episodes are presented in Fig. 5. Enhanced PSC surface area is located in the same regions where low stratospheric temperatures are registered. This is an obvious consequence of stratospheric cooling and may lead to heterogeneous chlorine and bromine activation followed by ozone depletion similar to the Antarctic ozone hole formation (Solomon, 1999). In order to evaluate local ozone destruction significance for the observed TOC loss, the photochemical ozone loss coefficient (s−1) (rate of ozone loss divided by the ozone concentration: , where is photochemical ozone loss (mol s−1 cm−3) and is ozone concentration (mol cm−3), Jacobson, 2005), calculated with the RSHU CTM, is presented in Fig. 5.
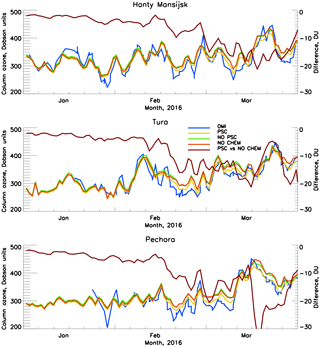
Figure 6Column ozone variability simulated with the RSHU CTM for different scenarios for the stations Khanty-Mansiysk, Tura, and Pechora and the difference between scenarios with no polar chemistry and full PSC processing included.
The locations of regions with enhanced ozone destruction are close to the regions with estimated low TOC on 27 January and 19 February, but are not fully consistent. In addition, the minimum local photochemical ozone lifetime, estimated as a reciprocal of the ozone destruction coefficient, is about 200 days under these days' conditions. Such a long photochemical lifetime of ozone can be treated as a sign of the unlikelihood that the observed short-term ozone variability is a result of local photochemical destruction initiated by heterogeneous chlorine and bromine activation on the particles of PSCs that formed in these regions. On the other hand, simultaneous low stratospheric cooling and low column ozone at the same locations may be caused by dynamic divergence that leads to heat and mass deficit, similar to polar vortex isolation (Solomon, 1999). Another confirmation of the prevalent dynamical nature of the observed episodes with low ozone concentration is their formation during polar night recorded during December 2015 and the first part of January 2016 when photochemical destruction is negligible.
In order to check this conclusion about the dominant role of the dynamical processes in the observed short-term ozone loss, two additional numerical experiments were carried out with the RSHU CTM: the first simulation did not take into account the formation of polar stratospheric clouds in the Arctic region, and the second simulation did not take into account the chemical destruction of ozone to the north of the northern polar circle. A comparison of the three model experiments for the three stations considered in this study is shown in Fig. 6. The results of model experiments have shown that the main features of the short-term ozone loss are reproduced even without considering chemical destruction within the polar region. At the same time, the difference between results of the model experiments with and without polar chemical ozone destruction shows that the influence of chemical processes becomes noticeable at the end of February, especially for Pechora station.
Data analysis and numerical model experiments have been used to analyse the low TOCs observed over Russia during the winter of 2015/2016. Ozone anomalies were observed over the territory of the Urals and Siberia in winter and the beginning of spring 2016. In this study, we compare TOCs obtained by different measuring methods (satellite and ground-based observations) with results of numerical modelling (for the stations Khanty-Mansiysk, Tura, and Pechora) for the mentioned period. It is shown that current monitoring systems (including the new Russian Infrared Fourier Spectrometer IKFS-2) and modern three-dimensional atmospheric models provide a good representation of the occurrence of the observed TOC anomalies. However, results of observations and simulations diverge on certain days by up to 20 %–30 %. Analysis of the role of chemical and dynamical processes in the observed ozone variability over the Russian Federation was based on the RSHU CTM calculations. This analysis demonstrated that it is unlikely that local photochemical ozone destruction, initiated by heterogeneous halogen activation on the particles of PSCs that formed under the observed low temperatures, is responsible for the short-term local minimum ozone values. The prevalent reason for the observed low TOCs may be dynamical flux divergence out of regions with observed low ozone content (Smyshlyaev et al., 2017).
Both the simulation data and measurement results necessary to reproduce the comparison are available from the authors upon request (smyshl@rshu.ru; yana.virolainen@spbu.ru). SBUV satellite data used in the study can be found at https://acd-ext.gsfc.nasa.gov/anonftp/toms/sbuv/NOAA19/overpass/o3du_n19/, last access: 26 October 2018 (Goddard Space Flight Center, 2018), IASI satellite data at https://eoportal.eumetsat.int/userMgmt/login.faces (Earth Observation Portal, 2018), OMI satellite data at https://avdc.gsfc.nasa.gov/index.php?site=1593048672&id=28, last access: 26 October 2018 (Goddard Space Flight Center, 2018), and data from the Russian ground-based ozone network at https://woudc.org/archive/Archive-NewFormat/TotalOzone_1.0_1/, last access: 26 October 2018 (World Ozone and Ultraviolet Radiation Data Centre, 2018) web sites. The IKFS-2 satellite ozone column data are provided by Saint Petersburg State University. RSHU CTM numerical data are provided by the Russian State Hydrometeorological University. EMAC numerical data are provided by the Steinbuch Centre for Computing of the Karlsruhe Institute of Technology.
YMT formulated the goal and tasks of the research and collaboration, and supervised the research team. SPS carried out numerical experiments with RSHU CTM and analyzed its results. YAV collected all data and prepared the presentation of the results. ASG and AVP developed the software for IKFS-2 ozone retrieval. MAM had prepared MERRA and ERA-Interim data for assimilation by RSHU CTM. OK was responsible for EMAC numerical simulation results. All authors took part in the discussion about obtained results and prepared the manuscript for publication.
The authors declare that they have no conflict of interest.
The comparison and analysis of different experimental and simulated total
ozone column data were supported by the Russian Science Foundation (grant no.
14-17-00096). The RSHU CTM was developed with the Russian Ministry of
Education and Science support (project 5.6493.2017/8.9). The modelling of
Arctic processes with the RSHU CTM was supported by the Russian Foundation
for Basic Research (grant no. 17-05-01277). The interpretation of Russian
Infrared Fourier Spectrometer IKFS-2 spectra was supported by the Russian
Foundation for Basic Research (grant no. 17-05-00768). The discussions of the
results and the retrieval of EMAC model data were supported by Saint
Petersburg University (grant no. 11.42.690.2017). The authors thank
Anatoly M. Zvyagintsev from the Central Aerological Observatory (Dolgoprudny,
Russia) for providing the ozone measurements from the ground-based network.
Both the simulation data and measurement results necessary to reproduce the
comparison are available from the authors upon request
(yana.virolainen@spbu.ru).
Edited by: Margit
Haberreiter
Reviewed by: two anonymous referees
Balis, D., Kroon, M., Koukouli, M. E., Brinksma, E. J., Labow, G., Veefkind, J. P., and McPeters, R. D.: Validation of Ozone Monitoring Instrument total ozone column measurements using Brewer and Dobson spectrophotometer groundbased observations, J. Geophys. Res., 112, D24S46, https://doi.org/10.1029/2007JD008796, 2007.
Balis, D. S.: An update on the dynamically induced episodes of extreme low ozone values over the northern middle latitudes, Int. J. Remote Sens., 32, 9197–9205, 2011.
Bhartia, P. K., McPeters, R. D., Flynn, L. E., Taylor, S., Kramarova, N. A., Frith, S., Fisher, B., and DeLand, M.: Solar Backscatter UV (SBUV) total ozone and profile algorithm, Atmos. Meas. Tech., 6, 2533–2548, https://doi.org/10.5194/amt-6-2533-2013, 2013.
Boynard, A., Hurtmans, D., Koukouli, M. E., Goutail, F., Bureau, J., Safieddine, S., Lerot, C., Hadji-Lazaro, J., Wespes, C., Pommereau, J.-P., Pazmino, A., Zyrichidou, I., Balis, D., Barbe, A., Mikhailenko, S. N., Loyola, D., Valks, P., Van Roozendael, M., Coheur, P.-F., and Clerbaux, C.: Seven years of IASI ozone retrievals from FORLI: validation with independent total column and vertical profile measurements, Atmos. Meas. Tech., 9, 4327–4353, https://doi.org/10.5194/amt-9-4327-2016, 2016.
Dee, D. P., Uppala, S. M., Simmons, A. J., Berrisford, P., Poli, P., Kobayashi, S., Andrae, U., Balmaseda, M. A., Balsamo, G., Bauer, P., Bechtold, P., Beljaars, A. C. M., van de Berg, L., Bidlot, J., Bormann, N., Delsol, C., Dragani, R., Fuentes, M., Geer, A. J., Haimberger, L., Healy, S. B., Hersbach, H., Hólm, E. V., Isaksen, L., Kållberg, P., Köhler, M., Matricardi, M., McNally, A. P., Monge-Sanz, B. M., Morcrette, J.-J., Park, B.-K., Peubey, C., deRosnay, P., Tavolato, C., Thépaut, J.-N., and Vitart, F.: The ERA-Interim reanalysis: configuration and performance of the data assimilation system, Q. J. Roy. Meteor. Soc., 137, 553–597, 2011.
Earth Observation Portal: Monitoring Weather and Climate from Space, available at: https://eoportal.eumetsat.int/userMgmt/login.faces, last access: 26 October 2018.
Galin, V. Ya., Smyshlyaev, S. P., and Volodin, E. M.: Combined chemistry–climate model of the atmosphere, Izv. Atmos. Ocean. Phy., 43, 399–412, 2007.
Garkusha, A. S., Polyakov, A. V., Timofeev, Yu. M., and Virolainen, Ya. A.: Determination of the total ozone content from data of IRFS-2 spectral measurements onboard “Meteor-M” No. 2, Izv. Atmos. Ocean. Phy., 53, 433–440, 2017.
Garkusha, A. S., Polyakov, A. V., Timofeev, Yu. M., Virolainen, Ya. A., and Kuharsky, A. V.: Determination of the total ozone content from measurements of the IRFS-2 satellite IR spectrometer in a cloudy atmosphere (Meteor-M No. 2), Issledovanie Zemli iz Kosmosa, 2, 58–64, 2018 (in Russian).
Goddard Space Flight Center: Total Ozone and Air Quality Data, available at: https://acd-ext.gsfc.nasa.gov/, last access: 26 October 2018.
Golovin, Y. M., Zavelevich, F. S., Nikulin, A. G., Kozlov, D. A., Monakhov, D. O., Kozlov, I. A., Arkhipov, S. A., Tselikov, V. A., and Romanovskii, A. S.: Spaceborne infrared Fourier-transform spectrometers for temperature and humidity sounding of the Earth's atmosphere, Izv. Atmos. Ocean. Phy., 50, 1004–1015, https://doi.org/10.1134/S0001433814090096, 2014.
Jacobson, M. Z.: Fundamental of atmospheric modeling, Cambridge University Press, Cambridge, UK, 2005.
Jöckel, P., Tost, H., Pozzer, A., Brühl, C., Buchholz, J., Ganzeveld, L., Hoor, P., Kerkweg, A., Lawrence, M. G., Sander, R., Steil, B., Stiller, G., Tanarhte, M., Taraborrelli, D., van Aardenne, J., and Lelieveld, J.: The atmospheric chemistry general circulation model ECHAM5/MESSy1: consistent simulation of ozone from the surface to the mesosphere, Atmos. Chem. Phys., 6, 5067–5104, https://doi.org/10.5194/acp-6-5067-2006, 2006.
Jöckel, P., Kerkweg, A., Pozzer, A., Sander, R., Tost, H., Riede, H., Baumgaertner, A., Gromov, S., and Kern, B.: Development cycle 2 of the Modular Earth Submodel System (MESSy2), Geosci. Model Dev., 3, 717–752, https://doi.org/10.5194/gmd-3-717-2010, 2010.
Kroon, M., Petropavlovskikh, I., Shetter, R., Hall, S. Ullmann, K., Veefkind, J. P., McPeters, R. D., Browell, E. V., and Levelt P. F.: OMI total ozone column validation with Aura-AVE CAFS observations, J. Geophys. Res., 113, D15S13, https://doi.org/10.1029/2007JD008795, 2008.
Manney, G. L. and Lawrence, Z. D.: The major stratospheric final warming in 2016: dispersal of vortex air and termination of Arctic chemical ozone loss, Atmos. Chem. Phys., 16, 15371–15396, https://doi.org/10.5194/acp-16-15371-2016, 2016.
Manney, G. L., Santee, M. L., Rex, M., Livesey, N. J., Pitts, M. C., Veefkind, P., Nash, E. R., Wohltmann, I., Lehmann, R., Froidevaux, L., Poole, L. R., Schoeberl, M. R., Haffner, D. P., Davies, J., Dorokhov, V., Gernandt, H., Johnson, B., Kivi, R., Kyrö, E., Larsen, N., Levelt, P. F., Makshtas, A., McElroy, C. T., Nakajima, H., Parrondo, M. C., Tarasick, D. W., von der Gathen, P., Walker, K. A., and Zinoviev, N. S.: Unprecedented Arctic ozone loss in 2011, Nature, 478, 469–475, https://doi.org/10.1038/nature10556, 2011.
McPeters, R. D., Frith, S., and Labow, G. J.: OMI total column ozone: extending the long-term data record, Atmos. Meas. Tech., 8, 4845–4850, https://doi.org/10.5194/amt-8-4845-2015, 2015.
Millán, L. F. and Manney, G. L.: An assessment of ozone mini-hole representation in reanalyses over the Northern Hemisphere, Atmos. Chem. Phys., 17, 9277–9289, https://doi.org/10.5194/acp-17-9277-2017, 2017.
Rienecker, M. M., Suarez, M. J., Gelaro, R., Todling, R., Bacmeister, J., Liu, E., Bosilovich, M. G., Schubert, S. D., Takacs, L., Kim, G., Bloom, S., Chen, J., Collins, D., Conaty, A., da Silva, A., Gu, W., Joiner, J., Koster, R. D., Lucchesi, R., Molod, A., Owens, T., Pawson, S., Pegion, P., Redder, C. R., Reichle, R., Robertson, F. R., Ruddick, A. G., Sienkiewicz, M., and Woollen, J.: MERRA: NASA's Modern-Era Retrospective Analysis for Research and Applications, J. Climate, 24, 3624–3648, https://doi.org/10.1175/JCLI-D-11-00015.1, 2011.
Righi, M., Eyring, V., Gottschaldt, K.-D., Klinger, C., Frank, F., Jöckel, P., and Cionni, I.: Quantitative evaluation of ozone and selected climate parameters in a set of EMAC simulations, Geosci. Model Dev., 8, 733–768, https://doi.org/10.5194/gmd-8-733-2015, 2015.
Roeckner, E., Brokopf, R., Esch, M., Giorgetta, M., Hagemann, S., Kornblueh, L., Manzini, E., Schlese, U., and Schulzweida, U.: Sensitivity of simulated climate to horizontal and vertical resolution in the ECHAM5 atmosphere model, J. Climate, 19, 3771–3791, 2006.
Smyshlyaev, S. P., Dvortsov, V. L., Geller, M. A., and Yudin, V. A.: A two dimensional model with input parameters from a GCM: Ozone sensitivity to different formulation for the longitudinal temperature variation, J. Geophys. Res., 103, 28373–28387, https://doi.org/10.1029/98jD02354, 1998.
Smyshlyaev, S. P., Galin, V. Ya., Shaariibuu, G., and Motsakov, M. A.: Modelling the variability of gas and aerosol components in the stratosphere of polar regions, Izv. Atmos. Ocean. Phy., 46, 265–280, 2010.
Smyshlyaev, S. P., Virolainen, Y. A., Timofeev, Y. M., Poberovsky, A. V., and Polyakov, A. V.: Interannual and seasonal ozone variability in the several altitude regions near Saint-Petersburg based on the observations and numerical modelling, Izv. Atmos. Ocean. Phy., 53, 301–315, https://doi.org/10.7868/S0002351517030154, 2017.
Solomon, S.: Stratospheric ozone depletion: A review of concepts and history, Rev. Geophys., 37, 275–316, 1999.
Staehelin, J., Harris, N. R. P., Appenzeller, C., and Eberhard, J.: Ozone trends a review, Rev. Geophys., 39, 231–290, https://doi.org/10.1029/1999RG000059, 2001.
Timofeyev, Yu. M. and Vasil'ev, A. V.: Theoretical Fundamentals of Atmospheric optics, CIPS Cambridge International Science Publishing, Cambridge, UK, 2008.
Viatte, C., Schneider, M., Redondas, A., Hase, F., Eremenko, M., Chelin, P., Flaud, J.-M., Blumenstock, T., and Orphal, J.: Comparison of ground-based FTIR and Brewer O3 total column with data from two different IASI algorithms and from OMI and GOME-2 satellite instruments, Atmos. Meas. Tech., 4, 535–546, https://doi.org/10.5194/amt-4-535-2011, 2011.
Virolainen, Ya. A., Timofeyev, Yu. M., Polyakov, A. V., Ionov, D. V., Kirner, O., Poberovskii, A. V., and Imhasin, H.: Comparing data obtained from ground-based measurements of the total contents of O3, HNO3, HCl, and NO2 and from their numerical simulation, Izv. Atmos. Ocean. Phy., 52, 57–65, 2016.
Virolainen, Ya. A., Timofeyev, Yu. M., Poberovskii, A. V., Polyakov, A. V., and Shalamyanskii, A. M.: Empirical assessment of errors in total ozone measurements with different instruments and methods, Atmos. Ocean. Opt., 30, 382–388, 2017.
World Ozone and Ultraviolet Radiation Data Centre: Total Column Ozone Data Archive, available at: https://woudc.org/archive/Archive-NewFormat/TotalOzone_1.0_1/, last access: 26 October 2018.
Zvyagintsev, A. M., Ivanova, N. S., Nikiforova, M. P., Kuznetsova, I. N., and Vargin P. N.: Ozone content over the Russian Federation in the first quarter of 2016, Russian Meterorology and Hydrology, 41, 373–378, https://doi.org/10.3103/S1068373916050095, 2016.
- Abstract
- Introduction
- Total ozone column measurements over Russia during winter 2016
- Comparison of total ozone column measurements and numerical modelling
- Analysis of the processes responsible for the observed ozone variability over Russia during the Arctic winter of 2015/2016
- Summary
- Data availability
- Author contributions
- Competing interests
- Acknowledgements
- References


