the Creative Commons Attribution 4.0 License.
the Creative Commons Attribution 4.0 License.
Variations of the 630.0 nm airglow emission with meridional neutral wind and neutral temperature around midnight
Chih-Yu Chiang
Sunny Wing-Yee Tam
Tzu-Fang Chang
The ISUAL payload onboard the FORMOSAT-2 satellite has often observed airglow bright spots around midnight at equatorial latitudes. Such features had been suggested as the signature of the thermospheric midnight temperature maximum (MTM) effect, which was associated with temperature and meridional neutral winds. This study investigates the influence of neutral temperature and meridional neutral wind on the volume emission rates of the 630.0 nm nightglow. We utilize the SAMI2 model to simulate the charged and neutral species at the 630.0 nm nightglow emission layer under different temperatures with and without the effect of neutral wind. The results show that the neutral wind is more efficient than temperature variation in affecting the nightglow emission rates. For example, based on our estimation, it would require a temperature change of 145 K to produce a change in the integrated emission rate by 9.8 km-photons cm−3 s−1, while it only needs the neutral wind velocity to change by 1.85 m−1 s−1 to cause the same change in the integrated emission rate. However, the emission rate features a local maximum in its variation with the temperature. Two kinds of tendencies can be seen regarding the temperature that corresponds to the turning point, which is named the turning temperature (Tt) in this study: firstly, Tt decreases with the emission rate for the same altitude; secondly, for approximately the same emission rate, Tt increases with the altitude.
- Article
(2902 KB) - Full-text XML
-
Supplement
(125 KB) - BibTeX
- EndNote
The atomic oxygen red line at 630.0 nm is the most prominent emission in the nighttime ionosphere. It usually forms an emission layer in the F region at altitudes of ∼200–300 km and can be easily observed from ground-based observatories or satellites (Nelson and Cogger, 1971; Kelley et al., 2002; Thuillier et al., 2002). The emission is related to O(1D), whose production in the nighttime is mainly via the charge exchange and dissociative chemical processes listed as follows:
Based on the [O+] ∼ Ne (electron density) approximation (Peterson et al., 1966; Link and Cogger, 1988) in the F2 region, the intensity of the OI(1D) 630.0 nm spectral line is usually used to identify the ionospheric electron density variations. From a rich history in the literature, the intensity of OI(1D) 630.0 nm airglow emissions is known as midnight brightness wave (MBW) (Herrero and Meriwether, 1980; Herrero et al., 1993; Colerico et al., 1996; Colerico and Mendillo, 2002).
During occurrences of the MBW, increases in temperature are usually observed around local midnight, which are termed the midnight temperature maximum (MTM) effect. Harper (1973) and Spencer et al. (1979) reported the MTM phenomenon first. The cases in their studies were observed by the incoherent scatter radar from Arecibo and the NATE experiment aboard the Atmospheric Explorer E (AE-E) satellite, respectively. The amplitude of the temperature bulge was found to range from 20 to 200 K (Spencer et al., 1979; Burnside et al., 1981; Colerico and Mendillo, 2002; Meriwether et al., 2008). In addition, a number of studies about midnight brightness have reported the relation between in situ temperature and neutral wind measurements (e.g., Herrero and Meriwether, 1980; Sastri et al., 1994, Colerico et al., 1996; Colerico and Mendillo, 2002; Otsuka et al., 2003; Mukherjee et al., 2006). Rajesh et al. (2009) showed the first results of the limb image of 630.0 nm airglow using Imager of Sprites and Upper Atmospheric Lightning (ISUAL) (Chang et al., 2012; Chiang et al., 2013; Frey et al., 2016) onboard the FORMOSAT-2 satellite. Adachi et al. (2010) also showed a 14-day time span of airglow observations obtained from the Asian sector by ISUAL. On the basis of the observation time and location, they suggested that the equatorial airglow probably corresponded to the MBW which is in association with the occurrence of MTM. Furthermore, Chiang et al. (2013) statistically investigated the global midnight brightness according to seasons and found that the global midnight brightness near the equatorial regions was controlled by different mechanisms. In the study, the features and behavior of the 630.0 nm midnight intensity were investigated by analyzing the optical images obtained by ISUAL. Cases of enhancement of global midnight brightness were successfully categorized into three types that were mainly due to the influence of temperature changes, neutral wind and ionospheric anomaly.
Based on the previous studies, it is known that temperature and meridional neutral wind are correlated and associated with manifestations of MTM. Thus, we want to discuss these two effects at the same time. In this study, we calculate the volume emission rates to understand the influence of neutral temperature and meridional neutral wind on the 630.0 nm nightglow. We shall discuss the sensitivities of the emission rates to the temperature and the densities of several neutral and charged species. Moreover, some new features will also be shown in the discussion section. And we also provide ISUAL observation results to show that our calculation results are reasonable and realistic.
Temperature changes and meridional neutral wind can influence the O(1D) nightglow intensity through particle densities. The volume emission rate of the 630.0 nm nightglow in the F2 region (Sobral et al., 1993) can be derived from the chemical process of 630.0 nm nightglow (Supplement Sect. SI). It is shown as follows:
where μD is the quantum yield of O(1D), which is about 1–1.3 (Torr and Torr, 1982); γ is the rate coefficient of Reaction (R1) (St.-Maurice and Torr, 1978); k1, k2 and k3 are the rate coefficients of O(1D) quenched by N2, O2 and O, respectively (Langford et al., 1986; Streit et al., 1976; Sun and Dalgarno, 1992); and A1D and A2D are the transition coefficients (Froese-Fischer and Saha, 1983). The formulas for the rate coefficients (Vlasov et al., 2005) are listed in Table 1. The production rate of O(1D) is contributed by the oxygen ion density [O+] and the molecular oxygen density [O2] through the linked Reactions (R1) and (R2). The major loss rates of O(1D) are associated with the densities of molecular oxygen [O2], molecular nitrogen [N2], and atomic oxygen [O], as reflected in Eq. (1). The densities [O+], [O2], [N2] and [O] and the rate coefficients γ, k1, k2 and k3 all depend on temperature. In addition, [O+] may change with the neutral wind conditions. In order to determine I630 under different temperatures and neutral wind conditions, one must first determine the densities of the relevant species. In this study, [O+] and plasma temperatures under various conditions are found by the SAMI2 model of the Naval Research Lab (Huba et al., 2000). SAMI2 is a two-dimensional, first-principle model of the comprehensive low- to mid-latitude ionosphere. SAMI2 code includes most of the mechanisms that should be considered in the ionosphere. There are photoionizations, chemical process, effects by the magnetic and electric fields, plasma dynamics and the influence from the neutral atmosphere. The input variables, neutral species, are specified using the empirical codes, the Mass Spectrometer Incoherent Scatter model (NRLMSISE-00) (Picone et al., 2002) for neutral densities and the Horizontal Wind Model (HWM-93) (Hedin et al., 1996) for neutral wind. The continuity and momentum equations of seven ion species (H+, He+, N+, O+, , NO+, and ) are solved in the code.
Table 1Reactions and rate coefficients related to the volume emission rate of the 630.0 nm airglow.

Note: (Teff: effective temperature, Ti: ion temperature, Tn: neutral temperature) (St.-Maurice and Torr, 1978).
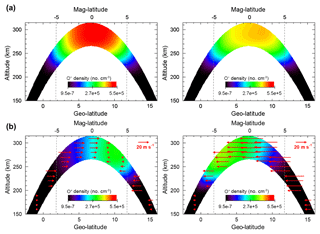
Figure 1Oxygen ion density plotted in the latitude–altitude plane at 23:00 LT on 1 February (left panels) and 1 August 2007 (right panels) in the Asian region (100∘ E longitude) from the SAMI-2 model: (a) without neutral wind; (b) with the effect of normal neutral wind, whose strength and directions are indicated by the arrows.
In order to understand the differences due to the meridional neutral wind, we apply the SAMI2 model with and without neutral wind by changing the multiplicative factor of neutral wind (tvn0) to see the differences between two solstices. Thus, we simulate the cases of 1 February 2007 (northern winter) and 1 August 2007 (northern summer). In the simulations, we suppose that the solar and geomagnetic activities are in quiet conditions (F10.7 index = 60, Ap index = 7). The simulations are run for the altitude range between 150 and 1000 km from −30 to +30∘ geomagnetic latitudes. Inside this region, we use 100 geomagnetic field lines and 201 grid points along each field line. Our report of the results will focus on the locations at −5 and +5∘ geomagnetic latitude (+2 and +12∘ geographic latitude, respectively) along the 100∘ E geographic longitude, which intersects these latitudes in the Asian region. Figure 1 shows the O+ density along the magnetic lines with altitudes between 150 and 315 km in the latitude–altitude plane at the time and longitude described above. Figure 1a shows the results under the condition that lacks neutral wind, and Fig. 1b shows the results with the effect of normal neutral wind. The two left panels are for 1 February 2007 and the two right panels are for 1 August 2007. The arrows plotted in Fig. 1b indicate the strength and directions of the meridional neutral wind. Comparison of Fig. 1a and b clearly shows that meridional winds transport the plasma along the magnetic field line and change the plasma density distribution. And this change in the plasma profile could directly modify the emission rate in Eq. (1). The dashed lines, which correspond to ±5∘ geomagnetic latitude, indicate the locations where the intensity of the 630.0 nm nightglow is examined in detail in this study.
Based on Eq. (1), I630 under different temperatures and different neutral wind conditions is plotted in Fig. 2. The neutral wind conditions for the results in Fig. 2 are the same as those for Fig. 1. The strength and directions of the neutral winds are indicated by the arrows shown in Fig. 1. The simulation results shown in the figure are for (a) 1 February and (b) 1 August 2007, with the left and right panels, respectively, corresponding to −5 and +5∘ geomagnetic latitude. The letters A, B, C, D and E indicate the altitudes of 220, 230, 240, 250 and 260 km, respectively. The dotted lines indicate the results with a normal neutral wind effect; the solid lines indicate the results without a neutral wind effect. Note that the temperatures of around 650 K, corresponding to the leftmost points of the lines in the figure, were the initial neutral temperatures obtained from the NRLMSISE-00 model at the various altitudes. These neutral temperatures are input into the SAMI2 model, and we set up the 48 h data as a running loop to obtain the plasma data. In order to explore the effects of temperature change, we modify the codes of SAMI2 by increasing 50 K per run as the inputs, and perform the simulations to calculate the emission intensity values associated with different temperature conditions.
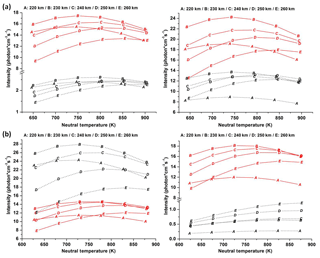
Figure 2The results of the 630.0 nm emission rate at 23:00 LT at different temperatures and under different neutral wind conditions for (a) 1 February and (b) 1 August 2007: left and right panels, respectively, for −5 and +5∘ geomagnetic latitude; the letters A, B, C, D and E, for the altitudes of 220, 230, 240, 250 and 260 km, respectively; for normal neutral wind effect (black dotted lines) and windless conditions (red solid lines). The neutral wind conditions of Fig. 2 are the same as those shown in Fig. 1.
From Fig. 2, we can see the influence of temperature and neutral wind on the nightglow emission. Note that the neutral wind conditions are as in Fig. 1: Fig. 1a for zero wind condition and Fig. 1b for normal wind condition. The influence of the temperature variations on I630 is usually less than 3 photons−1 cm−3 s−1 at the heights of 220 to 260 km. The variation of I630 with temperature, however, is not monotonic; there is a maximum in the intensity as the temperature changes. In terms of height, as I630 depends on the local neutral and charged particle densities in accordance with Eq. (1), the emission is the strongest at 230 km, except for the condition of very weak emission (<1 photons−1 cm−3 s−1) that occurs at +5∘ geomagnetic latitude in August with normal wind effect (right panel of Fig. 2b).
As for the influence of the neutral wind on 1 February 2007 (Fig. 2a), both locations (±5∘ geomagnetic latitude) clearly feature significantly smaller I630 under this effect. We suggest that this is due to the meridional neutral wind blowing equatorward in both hemispheres (see Fig. 1) and pushing the plasma upward along the field lines, reducing the local charged particle densities and consequently the emission rates as well. On 1 August 2007, as shown in Fig. 2b, the neutral wind causes the intensity at +5∘ geomagnetic latitude to decrease significantly for the same reason as the wind direction is locally southward (equatorward). This southward neutral wind, however, has an opposite effect on the intensity at −5∘ geomagnetic latitude; being locally poleward, the wind pushes the plasma downward along the field lines, increasing the local charged particle densities and consequently the emission rates as well.
From Eq. (1), we can see that I630 is related to the densities of several neutral species as well. In order to find out how the temperature affects the overall chemical process that leads to the 630.0 nm emission, a few relevant parameters are shown as functions of temperature in Fig. 3, based on the condition at 230 km altitude and −5∘ geomagnetic latitude on 1 February 2007. In Fig. 3a, we plot [O], [N2] and [O2] in dotted, dashed and solid lines, respectively. Then the corresponding loss rates of these neutral species are shown in Fig. 3b. In Fig. 3c, [O+] with and without neutral wind effect are plotted with dotted line and solid line, respectively. The values of γ[O+][O2], which are related to the production rate and in the numerator of Eq. (1), are plotted in Fig. 3d. The dotted line represents the normal neutral wind condition, and the solid line the windless condition.
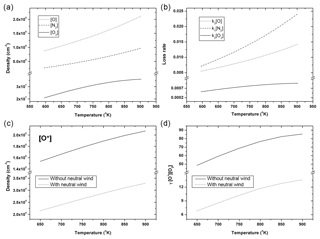
Figure 3The profiles of neutral and charged species versus temperature which are involved in Eq. (1) at 230 km altitudes and −5∘ geomagnetic latitudes on 1 February 2007. (a) [O], [N2] and [O2] versus temperature. (b) The loss rate terms of k1[O], k2 [N2] and k3 [O2] versus temperature. (c) [O+] versus temperature with/without the neutral wind effect. (d) The production-rate-associated term of γ[O+][O2] versus temperature with/without the neutral wind effect.
When the neutral temperature increases from 600 to 900 K, the rate coefficients k1 and k2 decrease by 5.8 % and 3.7 %, respectively, and k3 increases by 7.4 % as calculated from Table 1. The rate coefficients k1, k2 and k3 do not change significantly. However, in the same temperature range, [O], [N2] and [O2] show prominent increases of 253 %, 363 % and 171 %, respectively, as shown in Fig. 3a. Therefore, the atomic and molecular densities dominate the changes in the loss rates (Fig. 3b).
From Fig. 1a, we can see that along the field lines, the O+ density is maximum around the geomagnetic equator when there is no neutral wind, whether it is in the summer or winter season. But the [O+] maxima tilt to the winter hemisphere in the presence of summer-to-winter neutral wind at the geomagnetic equator, as shown in Fig. 1b. Therefore, we suggest that the low-latitude emission enhancement in the winter hemisphere be achieved by plasma accumulation brought about by the summer-to-winter neutral wind.
From the results that include the normal wind effect as shown in Fig. 2, the intensities on opposite sides of the geomagnetic equator are very different. The weaker emission is in the summer hemisphere, and brightness of higher intensity appears in the winter hemisphere. In previous studies, Rishbeth and Setty (1961) found that NmF2 was larger in winter than in summer, and they first suggested the possibility of composition change being the cause of the winter anomaly. Rishbeth (1972) and Torr and Torr (1973) suggested that the anomaly might be due to transequatorial neutral wind blowing from the summer hemisphere to the winter hemisphere. Therefore, the enhancement of the emission at the low latitudes of the winter hemisphere should be the results of plasma accumulation caused by the neutral wind effect.
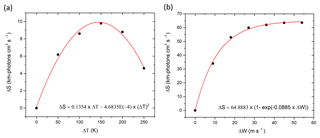
Figure 4Quantitative results for how (a) the neutral temperature and (b) the neutral wind affect the 630 nm airglow intensity.
Figure 2 shows the influence of temperature and neutral wind on the nightglow emission rates. We estimate the intensity change under different neutral wind conditions based on the location at 230 km altitude and −5∘ geomagnetic latitude on 1 February 2007. In this situation, the emission would be reduced by the wind flow, and the average change is about 0.690 photons−1 cm−3 s−1 for every m−1 s−1 of the wind speed. In comparison, the change due to temperature variation is just 0.015 photons−1 cm−3 s−1 for every K. The ratio of the two numbers is 46. Consideration of other conditions, such as those cases shown in Fig. 2, may reduce the corresponding ratio, but it should still be at least 20. According to earlier studies, the neutral wind speed is generally 0–300 m−1 s−1 in the F region (Dyson et al., 1997), while the amplitude of the temperature bulge due to the MTM effect has been found to range from 20 to 200 K (Burnside et al., 1981; Colerico and Mendillo, 2002). Even if one assumes the maximum wind speed is just 60 m−1 s−1 as in the simulations in this study, it would require a temperature change of 1200 K to match the same change in emission intensity caused by the neutral wind. Such a large temperature change is not realistic in comparison with the maximum observed difference of 200 K. Thus, the emission rate of nightglow, realistically, is influenced more by the neutral wind than temperature change when the former mechanism is clearly present.
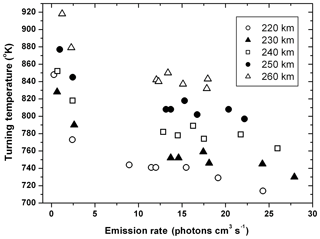
Figure 5Plots of the emission rates against the turning temperature between 220 and 260 km altitudes.
The densities and some of the rate coefficients are temperature dependent, as given in Eq. (1). We analyze the change with temperature of the individual terms in Eq. (1). In Fig. 3b and d, we plot the terms in the numerator and denominator on the right-hand side of Eq. (1) and find that all these terms increase with temperature. However, if we consider the derivative of the terms with respect to temperature, which characterizes how sensitive the terms are to temperature change, we notice that the derivatives for k1[N2] and k3[O] increase with temperature, while those for k2[O2] and γ[O+][O2] decrease, as shown in Fig. 3b and d. How the variations of these terms affect the dependence of I630 on temperature can now be understood from the right-hand side of Eq. (1). In particular, the numerator, which characterizes the production rate of O(1D) and is proportional to γ[O+][O2], increases with temperature while featuring a relatively large increase at lower temperatures (less than ∼750 K). On the other hand, the denominator, which characterizes the total loss rate of O(1D) and is dominated by k1[N2] as Fig. 3b indicates, features a relatively large increase at higher temperatures (larger than ∼750 K). Upon division of the numerator by the denominator, the plot of I630 versus temperature is thus characterized by quasi-parabolic lines with the presence of a local maximum – or a turning point in the curve – as shown in Fig. 2. We refer to the temperature that corresponds to such a local maximum as the turning temperature (Tt). Below Tt, I630 increases with temperature, meaning that the increase in the production of O(1D) associated with a rise in the temperature is more efficient than the increase in its loss. In contrast, I630 decreases with temperature above Tt, meaning that the increase in the production of O(1D) associated with a rise in the temperature is less efficient than the increase in its loss. Thus, Tt has the significance of being the temperature at which the production and loss rates of O(1D) are equally sensitive to a temperature change.
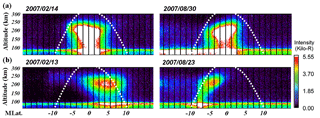
Figure 6Four observation cases by ISUAL in February and August 2007 (the same periods as shown in Fig. 1).
In order to quantitatively describe the effects of neutral temperature and meridional neutral winds, we calculate the 630 nm airglow intensity by integrating the volume emission rate along the altitude. Thus, the change in the integrated emission rate (ΔST) over a fixed altitude range h1 to h2 due to a change in temperature from T1 to T2 can be written as
where S is the integrated emission rate from height h1 to h2 as a function of temperature and neutral wind speed W. Similarly, the change in the integrated emission rate (ΔSW) over a fixed altitude range h1 to h2 due to a change in the neutral wind speed from W1 to W2 can be obtained as
Combining the changes in both temperature and neutral wind, one may express the change in the integrated emission rate over the altitude range as
One can show that to the leading order, the above equation reduces to
with ΔST in Eq. (2) evaluated at W=W1 and ΔSW in Eq. (3) evaluated at T=T1. Based on Eq. (4), we calculated I630 for different temperatures and neutral wind conditions, and then, according to the integrals in Eqs. (2) and (3), integrated the emission rates over the major altitudes of the 630.0 nm nightglow emission layer, ranging from 150 to 315 km altitude. Figure 4a and b show how the integrated emission rates vary with the increases in the neutral temperature and neutral wind speed, respectively. Figure 4a shows the result regarding the integrated emission rate as affected by neutral temperature (at −5∘ geomagnetic latitude on 1 February 2007). The curve in red is fitted as a second-order polynomial:
where ΔST (km-photons−1 cm−3 s−1) is the change in integrated emission rate and ΔT (K) is the increase in neutral temperature, compared with the standard conditions of 650 K neutral temperature and zero neutral wind. Figure 4b shows the result regarding the integrated emission rate as affected by neutral wind. The results are obtained based on the same standard conditions as those considered in Fig. 4a. The curve in red fits an exponential function:
where ΔSW (km-photons−1 cm−3 s−1) is the change in integrated emission rate and ΔW (m−1 s−1) is the change in neutral wind velocity. Therefore, according to Eq. (4), we combine the results of the two fitting functions to approximate the overall change in the integrated emission rate due to the two effects:
Based on the function, we can quantitatively compare the neutral temperature effect with the neutral wind effect. From Fig. 4a, increasing the neutral temperature by about 145 K leads to the maximum change in the integrated emission rate of 9.7859 km-photons−1 cm−3 s−1. In contrast, to get the same change in the emission rate by varying the neutral wind, it just requires a change in neutral wind velocity by 1.85 m−1 s−1 (Fig. 4b). With the above estimation, the neutral wind effect would certainly be larger than that of the neutral temperature for this case.
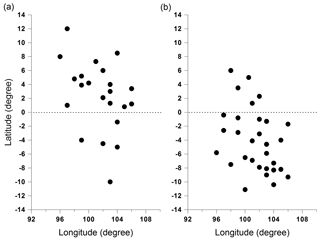
Figure 7ISUAL data in the specific regions and seasons considered in the simulations: the nightglow bright spots on valid observation days during (a) January–February and (b) July–August.
Figure 5 shows a plot of Tt versus the emission rate I630 at specific altitudes. The results include all the cases shown in Fig. 2, with different symbols indicating different altitudes. Two kinds of tendencies can be seen from the plot: firstly, Tt decreases with I630 for the same altitude; secondly, for approximately the same emission rate, Tt increases with the altitude. This is the first result to show these tendencies of the turning temperature.
Observations have found cases that are consistent with our simulation results regarding the influence of the neutral wind. Figure 6 shows four cases observed by ISUAL in the Asian region at 23:00 local time during the two months considered in our studies: two cases in February shown on the left side and two cases in August shown on the right side. Figure 6a would be for the condition of no wind or weak wind, while Fig. 6b would correspond to the normal wind condition. We can see from Fig. 6a that a bright spot of nightglow was observed at the geomagnetic equator during both months. As the volume emission rate, according to Eq. (1), is proportional to the O+ density, the observations were supportive of the simulation results of density variations in Fig. 1a. Similarly, the two cases in Fig. 6b, which featured nightglow bright spots in the winter hemisphere, suggested that the density variations shown in Fig. 1b are realistic.
Previously, Chiang et al. (2013) examined the occurrence rates of global midnight brightness observed by ISUAL. In order to verify the enhancement of the emission intensity in the winter hemisphere by the neutral wind, we examined the ISUAL data that correspond to the specific regions and seasons considered in our simulations, and the results are shown in Fig. 7a and b. We found that among the 22 valid observation days during January and February, ∼77 % of the days featured the appearance of nightglow bright spots in the low-latitude region of the winter hemisphere (Fig. 7a). Furthermore, ∼83 % of the 30 valid observation days during July–August also featured nightglow bright spots at low latitudes in the corresponding winter hemisphere (Fig. 7b). Thus, statistical results regarding the location of nightglow bright spots agree with the simulation results that demonstrate the crucial role of the neutral wind in affecting the location of high-intensity nightglow regions.
Rajesh et al. (2014) showed their simulation results and claimed that using merely the background meridional winds could reproduce the observed brightness. They selected a few cases of ISUAL image data and compared those data with the simulation results by the SAMI2 model. Nevertheless, using such a method by Rajesh et al. (2014), one should be very careful about the details when it comes to physical insights or conclusions drawn from the study. This is because ISUAL only provided optical data and there was not any instrument on the satellite to directly observe the relevant conditions (temperature, wind field, etc.) in the environment. Without such observations to provide constraints for modeling, one can easily reproduce similar-looking results of selected short-period data by adjusting modeling parameters in simulations. However, images seemingly similar to that of an ISUAL observation could be produced from simulation results using considerably different parameter values, which may correspond to different dominant mechanisms. Thus, when there are few constraints for the parameter values, roughly comparing a short-period case of ISUAL image data with simulation results without paying attention to details may lead to an interpretation of brightness production mechanisms that is different from the real situation.
Observations of the movement of MTM temperature bulge and that of nightglow have led to postulations of an association between pressure bulge and nightglow intensity (Colerico et al., 1996; Colerico and Mendillo, 2002; Meriwether et al., 2008). However, the high intensities of the observed nightglow have not been successfully reproduced using existing models incorporating the MTM effect, such as the NCAR thermosphere–ionosphere–electrodynamic general circulation model (TIEGCM), as pointed out by Colerico and Mendillo (2002) and Meriwether et al. (2008). Note that temperature was not included as a varying quantity in traditional ionospheric models. Thus the simulation study of temperature effect upon nightglow intensity is lacking. Our simulation results have demonstrated the unexpectedly non-monotonic dependence of the intensity of nightglow on the neutral temperature, with the turning temperature Tt that arises from the dependence implying a limitation for the growth of the emission rates. As the temperature increases above Tt, the emission rates do not continue to grow. In fact, temperature change such as in the case of heat transfer is affected by the density, which controls the heat capacity. At the same time, temperature change may generate pressure difference and lead to transport that changes density profiles. As nightglow intensity depends also on particle densities, its non-monotonic variations with temperature are in fact due to the combination of temperature and density. While our study suggests that neutral wind is the dominant driver of the I630 variation, its influence, however, is via transportation of plasma and neutral particles, in which case consideration of the effect of temperature on the density is essential. Moreover, it has not been established that MTM is affected by the wind primarily. The combination of temperature and density, which has been shown to cause non-monotonic results in this study, may very well be an important factor in the study of MTM. Thus, if one wants to fully reproduce the observation results, we suggest other extra factors associated with temperature variations should also be considered, such as different tidal modes from the lower atmosphere (Akmaev et al., 2009). Our findings of the turning temperature tendencies can help as a guide for choosing the background temperature in future modeling attempts to obtain intensities of nightglow brightness comparable to those observed from ground or from space.
Shepherd (2016) investigates the possible extent of the MTM at ∼20–40∘ N, considering O(1D) airglow volume emission rates, Doppler temperatures, and neutral wind (zonal and meridional) observations by the Wind Imaging Interferometer (WINDII) experiment onboard the Upper Atmosphere Research Satellite (UARS). Their results provide us with the relations of the zonal wind to the O(1D) emission rate and of the meridional wind to the temperature. Such relations potentially guide us to design a more extensive future study in simulation so as to reproduce the observation and statistical results by Shepherd (2016).
Previous studies of the MTM effect have pointed out that the temperature anomaly influences the nighttime behavior of the thermosphere. And the neutral wind also plays a key role in causing the intensity variations in the nighttime ionosphere. Based on our simulation results, both temperature change and meridional neutral wind could cause the 630.0 nm nightglow intensity to vary, while the latter is more effective. A temperature change of 145 K is shown to result in an integrated emission rate change of 9.8 km-photons−1 cm−3 s−1. However, it only requires a neutral wind velocity change of 1.85 m−1 s−1 to produce the same change in the integrated emission rate. And the simulation results may successfully explain most of the observational results by ISUAL. An unexpected aspect of the results is the non-monotonic dependence of the emission rate on temperature, featuring a turning point as the temperature changes. The temperature Tt at which the turning point occurs corresponds to a balanced condition between the production and loss of O(1D). Thus, our results help understand how the overall chemical process of nightglow is affected by the variations of neutral temperature and neutral wind. Two kinds of tendencies can be seen regarding the turning temperature Tt. One is the higher Tt corresponding to higher altitude at the same emission rate; the other is the higher Tt corresponding to a lower emission rate at the same altitude. Our findings of these turning temperature tendencies can guide future modeling attempts to match the observed nightglow brightness intensities.
The ISUAL image data are provided by the NCKU ISUAL team (http://sprite.phys.ncku.edu.tw/joomla3/index.php?option=com_content&view=article&id=235&Itemid=441, last access: 24 October 2018). The SAMI2 model can be downloaded from the U.S. Naval Research Laboratory website (https://www.nrl.navy.mil/ppd/branches/6790/sami2, last access: 24 October 2018).
The supplement related to this article is available online at: https://doi.org/10.5194/angeo-36-1471-2018-supplement.
CYC took the lead in writing the manuscript. SWYT contributed to the research plan and to the manuscript. TFC carried out data collection and data analysis. All authors read and approved the final manuscript.
The authors declare that they have no conflict of interest.
The authors acknowledge the FORMOSAT-2/ISUAL science and operator team for
providing image data
(http://sprite.phys.ncku.edu.tw/joomla3/index.php?option=com_content&view=article&id=235&Itemid=441,
last access: 24 October 2018). The work by Chih-Yu Chiang and Sunny Wing-Yee
Tam is supported by Taiwan Ministry of Science and Technology grant MOST
107-2111-M006-003. Tzu-Fang Chang acknowledges support by the Ministry of
Education, Taiwan R.O.C., from the Aim for the Top University Project to
National Cheng Kung University.
Edited by:
Keisuke Hosokawa
Reviewed by: Yuichi Otsuka and one anonymous referee
Adachi, T., Yamaoka, M., Yamamoto, M., Otsuka, Y., Liu, H., Hsiao, C.-C., Chen, A. B., and Hsu, R.-R.: Midnight latitude-altitude distribution of 630-nm airglow in the Asian sector measured with FORMOSAT-2/ISUAL, J. Geophys. Res., 115, A09315, https://doi.org/10.1029/2009JA015147, 2010.
Akmaev, R. A., Wu, F., Fuller-Rowell, T. J., and Wang, H.: Midnight temperature maximum (MTM) in Whole Atmosphere Model (WAM) simulations, Geophys. Res. Lett., 36, L07108, https://doi.org/10.1029/2009GL037759, 2009.
Burnside, R. G., Herrero, F. A., Meriwether Jr., J. W., and Walker, J. C. G.: Optical observations of thermospheric dynamics at Arecibo, J. Geophys. Res., 86, 5532, https://doi.org/10.1029/JA086iA07p05532, 1981.
Chang, T. F., Cheng, C. Z., Chiang, C. Y., and Chen, A. B.: Behavior of substorm auroral arcs and Pi2 waves: implication for the kinetic ballooning instability, Ann. Geophys., 30, 911–926, https://doi.org/10.5194/angeo-30-911-2012, 2012.
Chiang, C. Y., Chang, T. F., Tam, S. W.-Y., Huang, T. Y., Chen, A. B.-C., Su, H. T., and Hsu, R. R.: Global observations of the 630-nm nightglow and patterns of brightness measured by ISUAL, Terr. Atmos. Ocean. Sci., 24, 283–293, https://doi.org/10.3319/TAO.2012.12.13.01(SEC), 2013.
Colerico, M., Mendillo, M., Nottingham, D., Baumgardner, J., Meriwether, J., Mirick, J., Reinisch, B. W., Scali, J. L., Fesen, C. G., and Biondi, M. A.: Coordinated measurements of F region dynamic related to the thermospheric midnight temperature maximum, J. Geophys. Res., 101, 26783–26793, https://doi.org/10.1029/96JA02337, 1996.
Colerico, M. J. and Mendillo, M.: The current state of investigations regarding the thermospheric midnight temperature maximum (MTM), J. Atmos. Sol.-Terr. Phy., 64, 1361–1369, 2002.
Dyson, P. L., Davies, T. P., Parkinson, M. L., Reeves, A. J., Richards, P. G., and Fairchild, C. E.: Thermospheric neutral winds at southern mid-latitudes: A comparison of optical and ionosonde hmF2 methods, J. Geophys. Res., 102, 27189–27196, https://doi.org/10.1029/97JA02138, 1997.
Frey, H. U., Mende, S. B., Harris, S. E., Heetderks, H., Takahashi, Y., Su, H.-T., Hsu, R.-R., Chen, A. B., Fukunishi, H., Chang, Y.-S., and Lee, L.-C.: The Imager for Sprites and Upper Atmospheric Lightning (ISUAL), J. Geophys. Res.-Space, 121, 8134–8145, https://doi.org/10.1002/2016JA022616, 2016.
Froese-Fischer, C. and Saha, H. P.: Multiconfiguration Hartree-Fock results with Breit-Pauli corrections for forbidden transitions in the 2p4 configuration, Phys. Rev. A, 28, 3169–3178, https://doi.org/10.1103/PhysRevA.28.3169, 1983.
Harper, R. M.: Nighttime meridional neutral winds near 350 km at low to mid-latitudes, J. Atmos. Terr. Phys., 35, 2023–2034, https://doi.org/10.1016/0021-9169(73)90116-5, 1973.
Hedin, A. E., Fleming, E. L., Manson, A. H., Schmidlin, F. J., Avery, S. K., Clark, R. R., Franke, S. J., Fraser, G. J., Tsuda, T., Vial, F., and Vincent, R. A.: Empirical wind model for the upper, middle, and lower atmosphere, J. Atmos. Terr. Phys., 58, 1421–1447, https://doi.org/10.1016/0021-9169(95)00122-0, 1996.
Herrero, F. A. and Meriwether Jr., J. W.: 6300 airglow meridional intensity gradients, J. Geophys. Res., 85, 4191, https://doi.org/10.1029/JA085iA08p04191, 1980.
Herrero, F. A., Spencer, N. W., and Mayr, H. G.: Thermosphere and F-region plasma dynamics in the equatorial region, Adv. Space Res., 13, 201–220, https://doi.org/10.1016/0273-1177(93)90019-8, 1993.
Huba, J. D., Joyce, G., and Fedder, J. A.: Sami2 is another model of the ionosphere (SAMI2): A new low-latitude ionosphere model, J. Geophys. Res., 105, 23035–23053, https://doi.org/10.1029/2000JA000035, 2000.
Kelley, M. C., Makela, J. J., Ledvina, B. M., and Kintner, P. M.: Observations of equatorial spread F from Haleakala, Hawaii, Geophys. Res. Lett., 29, 2003, https://doi.org/10.1029/2002GL015509, 2002.
Langford, A. O., Bierbaum, V. M., and Leone, S. R.: Branching ratios for electronically excited oxygen atoms formed in the reaction of N+ with O2 at 300 K, J. Chem. Phys., 84, 2158–2166, https://doi.org/10.1063/1.450377, 1986.
Link, R. and Cogger, L. L.: A reexamination of the OI 6300 Å nightglow, J. Geophys. Res., 93, 9883–9892, https://doi.org/10.1029/JA093iA09p09883, 1988.
Meriwether, J., Faivre, M., Fesen, C., Sherwood, P., and Veliz, O.: New results on equatorial thermospheric winds and the midnight temperature maximum, Ann. Geophys., 26, 447–466, https://doi.org/10.5194/angeo-26-447-2008, 2008.
Mukherjee, G. K., Parihar, N., Niranjan, K., and Manju, G.: Signature of midnight temperature maximum (MTM) using OI 630 nm airglow, Indian J. Radio Space Phys., 35, 14–21, 2006.
Nelson, G. J. and Cogger, L. L.: Dynamical behavior of the nighttime ionosphere at Arecibo, J. Atmos. Terr. Phys., 33, 1711–1726, https://doi.org/10.1016/0021-9169(71)90219-4, 1971.
Otsuka, Y., Kadota, T., Shiokawa, K., Ogawa, T., Kawamura, S., Fukao, S., and Zhang, S.-R.: Optical and radio measurements of a 630-nm airglow enhancement over Japan on 9 September 1999, J. Geophys. Res., 108, 1252, https://doi.org/10.1029/2002JA009594, 2003.
Peterson, V. L., Van Zandt, T. E., and Norton, R. B.: F-region nightglow emissions of atomic oxygen, 1. Theory, J. Geophys. Res., 71, 2255–2265, https://doi.org/10.1029/JZ071i009p02255, 1996.
Picone, J. M., Hedin, A. E., Drob, D. P., and Aikin, A. C.: NRLMSISE-00 empirical model of the atmosphere: Statistical comparisons and scientific issues, J. Geophys. Res., 107, 1468, https://doi.org/10.1029/2002JA009430, 2002.
Rajesh, P. K., Liu, J. Y., Chiang, C. Y., Chen, A. B., Chen, W. S., Su, H. T., Hsu, R. R., Lin, C. H., Hsu, M.-L., Yee, J. H., and Nee, J. B.: First results of the limb imaging of 630.0 nm airglow using FORMOSAT-2/Imager of Sprites and Upper Atmospheric Lightnings, J. Geophys. Res., 114, A10302, https://doi.org/10.1029/2009JA014087, 2009.
Rajesh, P. K., Chen, C. H., Lin, C. H., Liu, J. Y., Huba, J. D., Chen, A. B., Hsu, R. R., and Chen, Y. T.: Low-latitude midnight brightness in 630.0 nm limb observations by FORMOSAT-2/ISUAL, J. Geophys. Res.-Space, 119, 4894–4904, https://doi.org/10.1002/2014JA019927, 2014.
Rishbeth, H.: Thermospheric winds and the F-region: A review, J. Atmos. Terr. Phys., 34, 1, https://doi.org/10.1016/0021-9169(72)90003-7, 1972.
Rishbeth, H. and Setty, C. S. G. K.: The F layer at sunrise, J. Atmos. Terr. Phys., 20, 263–267, https://doi.org/10.1016/0021-9169(61)90205-7, 1961.
Sastri, J. H., Rao, H. N. R., Somayajulu, V. V., and Chandra, H.: Thermospheric winds associated with equatorial midnight temperature maximum (MTM), Geophys. Res. Lett, 21, 825, https://doi.org/10.1029/93GL03009, 1994.
Shepherd, M. G.: WINDII observations of thermospheric O(1D) nightglow emission rates, temperature, and wind: 1. The northern hemisphere midnight temperature maximum and the wave 4, J. Geophys. Res.-Space, 121, 11450–11473, https://doi.org/10.1002/2016JA022703, 2016.
Sobral, J. H. A., Takahashi, H., Abdu, M. A., Muralikrishna, P., Sahai, Y., Zamlutti, C. J., de Paula, E. R., and Batista, P. P.: Determination of the quenching rate of the O(1D) by O(3D) from rocket-borne optical (630 nm) and electron density data, J. Geophys. Res., 98, 7791–7798, https://doi.org/10.1029/92JA01839, 1993.
Spencer, N. W., Carignan, C. R., Mayr, H. G., Niemann, H. B., Theis, R. F., and Wharton, L. E.: The midnight temperature maximum in the Earth's equatorial thermosphere, Geophys. Res. Lett., 6, 444, https://doi.org/10.1029/GL006i006p00444, 1979.
St.-Maurice, J. P. and Torr, D. G.: Nonthermal rate coefficients in the ionosphere: The reactions of with N2, O2, and NO, J. Geophys. Res., 83, 969, https://doi.org/10.1029/JA083iA03p00969, 1978.
Streit, G. E., Howard, C. J., Schmeltekopf, A. L., Davidson, J. J. A., and Schiff, H. I.: Temperature dependence of O(1D) rate constants for reactions with O2, N2, CO2, O3 and H2O, J. Chem. Phys., 65, 4761–4764, https://doi.org/10.1063/1.432930, 1976.
Sun, Y. and Dalgarno, A.: Collisional excitation of metastable O(1D) atoms, J. Chem. Phys., 96, 5017–5019, https://doi.org/10.1063/1.462744, 1992.
Thuillier, G., Wiens, R. H., Shepherd, G. G., and Roble, R. G.: Photochemistry and dynamics in thermospheric intertropical arcs measured by the WIND Imaging Interferometer on board UARS: A comparison with TIE-GCM simulations, J. Atmos. Sol. Terr. Phys., 64, 405–415, https://doi.org/10.1016/S1364-6826(01)00109-2, 2002.
Torr, M. R. and Torr, D. G.: The seasonal behaviour of the F2-layer of the ionosphere, J. Atmos. Terr. Phys., 35, 2237, https://doi.org/10.1016/0021-9169(73)90140-2, 1973.
Torr, M. R. and Torr, D. G.: The role of metastable species in the thermosphere, Rev. Geophys. Space Phys., 20, 91–144, https://doi.org/10.1029/RG020i001p00091, 1982.
Vlasov, M. N., Nicolls, M. J., Kelley, M. C., Smith, S. M., Aponte, N., and Gonzalez, S. A.: Modeling of airglow and ionospheric parameters at Arecibo during quiet and disturbed periods in October, 2002, J. Geophys. Res., 110, A07303, https://doi.org/10.1029/2005JA011074, 2005.


