the Creative Commons Attribution 4.0 License.
the Creative Commons Attribution 4.0 License.
Revisiting sunspot number as an extreme ultraviolet (EUV) proxy for ionospheric F2 critical frequency
Franco D. Medina
Trinidad Duran
Blas F. de Haro Barbas
Ana G. Elias
This study reconsiders sunspot number (Sn) as a solar extreme ultraviolet (EUV) proxy for modeling the ionospheric F2 layer's critical frequency (foF2) over the period 1960–2023. We compare the performance of Sn with F10.7 and F30 solar radio fluxes, focusing on their ability to model the Ionospheric Global index (IG). Our results reveal that while F30 has shown a better correlation in recent solar cycles, Sn is the most stable and reliable over the entire dataset, obtaining the highest correlation. In addition, if we remove the saturation effects from considering a maximum value of Sn, the correlation increases, outperforming all other proxies and correctly predicting the long-term trend estimated by general circulation models.
- Article
(1593 KB) - Full-text XML
- BibTeX
- EndNote
-
Sunspot number (Sn) outperforms F30 and F10.7 solar proxies in long-term ionospheric datasets, especially before 1980 and during recent solar cycles.
-
Removing the saturation effect from the Sn dataset further enhances its correlation with the Ionospheric Global index (IG), improving long-term trend predictions.
-
The study emphasizes the variable performance of solar proxies over time, with Sn showing the greatest stability for modeling ionospheric conditions across 6 decades.
The understanding of atmospheric trends became a critical area of study in the last century. Besides the troposphere, the upper atmosphere is also affected by human activities. Many modern technologies, such as long-distance telecommunications, global positioning systems (GPS), and satellite communications, rely on space and near-Earth physics (Zolesi and Cander, 2014). One important part of the upper atmosphere is the ionosphere, defined as the zone where the presence of free charges is high enough to affect the propagation of electromagnetic waves. Long-term trends in this region arise primarily from the greenhouse effect but are also influenced by long-term solar periodicities and the secular variation of Earth's magnetic field (Laštovička, 2023).
This ionized area is mainly affected by solar extreme ultraviolet (EUV) radiation, which is absorbed by the neutral components, heating and ionizing them. To model this atmospheric layer, direct measurements of EUV radiation are needed. However, such data have only been available since the satellite era; therefore, several models were developed using EUV proxies or different measurements that are closely linked to the needed variable (Bilitza et al., 2022; Liu et al., 2010). Modern proxies measure solar irradiance at specific wavelengths on satellites, avoiding the interaction with the atmosphere. The most common are magnesium II wing-to-core ratio, helium II, and Lyman-alpha, among others.
The ionospheric structure has been measured since the 1930s after the development of the ionosonde. This instrument operates by emitting a vertical electromagnetic wave from the ground and waiting for the reflection of the wave. The internal layers are reached using different frequencies. The ionosphere is mainly studied through ionosonde databases, mainly due to their long time period and the reliability of the available data. The main data produced by ionosondes are the critical frequencies and the peak height of each layer.
Over the past decades, various solar indices have been employed as proxies for estimating ionospheric parameters. Among these, sunspot number (Sn) has historically been one of the most reliable proxies due to its long record and strong correlation with solar EUV radiation, which directly affects the ionosphere. However, newer solar indices, such as the F10.7 cm solar radio flux (Laštovička et al., 2006; Mielich and Bremer, 2013; Jakowski et al., 2024) and the more recent F30 (Laštovička, 2021; Dudok de Wit and Bruinsma, 2017; Zossi et al., 2024), as well as MgII (de Haro Barbás et al., 2021), have been introduced as alternatives that may offer better correlations under specific conditions or periods.
Recent studies have debated the effectiveness of these proxies, particularly in representing ionospheric trends during periods of low solar activity, such as the deep minima of solar cycles 24 and 25. These discussions have highlighted the need for continuous evaluation of solar proxies to ensure accurate long-term trend predictions, which are crucial for both scientific understanding and practical applications in space weather forecasting.
In recent years, some articles studied the changes in the relationship between sunspot number and solar radio fluxes, identifying a trend associated with the Sun that affects this relationship (Clette, 2021; Mursula et al., 2022, 2024). The solar radio fluxes trend to increase compared to sunspot number; this trend may introduce an error in models, which rely on these indices.
In this study, we assess the performance of Sn, F10.7, and F30 as proxies for modeling ionospheric foF2 for the period 1960–2023, particularly focusing on their ability to model the ionospheric index IG, a key indicator of global ionospheric conditions. We examine the stability and correlation of these proxies over different solar cycles and discuss the implications of choosing one proxy over another for long-term ionospheric studies. This procedure results in a better performance of Sn over F10.7 and F30 to reproduce the complete IG dataset, mainly during the complicated solar cycles of 20, 23, and 24.
The foF2 monthly median time series used in this work are from the following 10 stations: Wakkanai (45.2° N, 141.4° E), Kokubunji (35.7° N, 139.5° E), Okinawa (26.3° N, 127.6° E), Hobart (42.5° S, 147.2° E), Canberra (35.2° S, 149.1° E), Townsville (19.2° S, 146.5° E), Sodankylä (67.3° N, 26.3° E), Boulder (40.1° N, 105.2° W), Juliusruh (54.6° N, 13.4° E), and Rome (41.5° N, 12.3° E). The selected stations have long records, covering, in some cases, more than 60 years. Due to the uncertainties and bad reading, some data were discarded. The criteria used to calculate the monthly medians for each hour required at least 15 d available with measurements in every month, as well as checking outliers in every case. Most of the datasets were extracted from the Damboldt and Suessmann database (Damboldt and Suessmann, 2012). The data were updated until 2022 using records from the Lowell GIRO Data Center (LGDC) (Reinisch and Galkin, 2011); foF2 data from the Digital Ionogram Data Base (DIDBase) at LGDC have a frequency of 5 to 15 min. To obtain the monthly medians, data with autoscaling confidence score (CS) greater than 60 % were first selected, and then the hourly median for each month was estimated. We checked that the last 2 years available from the Damboldt and Suessmann database had a reasonable coincidence (within 5 %) with the data obtained from GIRO.
In this work, the Ionospheric Global index (IG) is used to analyze the solar proxies. IG was originally computed using 13 globally distributed ionosonde stations. The distribution of these stations was a compromise between good global coverage and reliable long-operating-period ionosonde stations. However, due to station closures and data unavailability, the number of stations used in IG has decreased to four (Brown et al., 2018). Therefore, since IG is derived from ionospheric measurements, it captures foF2 variations that are not solely driven by solar activity, such as those caused by increased greenhouse gases.
In this work, we use linear regressions between the annual-averaged IG index, which represents ionospheric foF2, and solar proxies. The linear regression is a simple statistical method that models the relation between two variables using a linear equation,
where α parameters are the regression coefficients, usually estimated using least squares, and x and y are the independent and dependent variables, respectively.
This regression is widely used for systems highly sensitive to a given variable or parameter. For example, many upper-atmosphere parameters, when dealing with annual means, respond to the solar flux almost linearly. We also extend to a second-order regression, which is the same procedure but adding a squared term for variable x.
To compare the performance of each proxy, we use the squared correlation coefficient, R2, which provides a measure of the variance of y predicted by the model using the independent variables.
Using the IG index as a global mean ionospheric condition, IG values are scaled to sunspot number; this represents foF2 from different stations around the world. Figure 1 shows the yearly averaged values of foF2 for the stations used in this work and the IG index; the correlation between both is also plotted. With an R2 of 99.6 %, we can say that the IG index is a reliable representation of ionospheric conditions. Therefore, we will use it to compare with the solar EUV proxies.
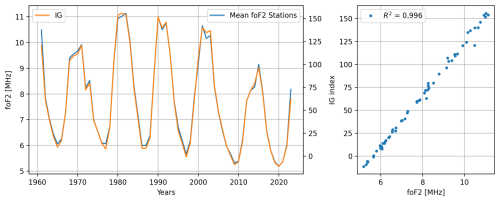
Figure 1Yearly noon mean (12:00 LT) foF2 for the 10 stations used in this work (blue) and in the IG index (orange). The right panel shows the linear correlation between IG and foF2, and the explained variance R2=0.996.
The variability of ionospheric foF2, at the interannual scale, is mainly driven by solar activity. For this reason, many (practically any) EUV proxies result in an excellent correlation with annual-averaged foF2.
As we mentioned, in the last years, many articles have been published trying to find the correct proxy for long-term trend estimation. Historically, the more used were the oldest, i.e., sunspot number, and the solar fluxes at radio wavelengths, having measured datasets of 70 years and more. However, such long datasets for ionospheric conditions are uncommon, just a few measuring stations have reliable data in this period.
The criteria from Laštovička (2021) for selecting the best solar proxy include high correlation, temporal stability, and the trend estimation having a consistent sign throughout the entire period. Based on these factors, the study concluded that F30 is the most suitable EUV proxy for ionospheric long-term trend estimation. The trend estimation is compared to general circulation models (Solomon et al., 2018), where the solar activity remains constant while greenhouse gases increase, resulting in a trend of % per decade for foF2.
As the main issue is to find long ionospheric datasets, in many articles the trends are often assessed using data up to 2008, avoiding the deep solar minimum, or from 1985 to the present. The important historical issues were the correlation decreasing in some periods and the change in the estimated trend after filtering the solar activity. These problems turn into the necessity of looking for other solar EUV proxies, particularly given the unique characteristics of the last solar cycles (24 and 25), which featured two deep minima with prolonged periods of zero sunspot numbers. During these deep minima, the ionospheric foF2 drops below historical minimum values; this fact can be easily noted since the IG index takes the highest quantity of negative values in the last two cycles.
The stability of the correlation between proxies and data results in a slight average correlation of F30 over Sn and F10.7. This can be seen in Fig. 2, where an 11-year centered moving correlation was calculated between IG and the three proxies. F10.7 shows two periods of lower correlation; this is a key reason for the need to use another proxy. On average, F30 has a higher correlation using this comparative analysis, especially in the last cycle, where correlations for the other proxies decrease. Sn has a step down for this last cycle but is the best from 1990 to 2008 approximately, where solar fluxes have a noticeable correlation decrease.
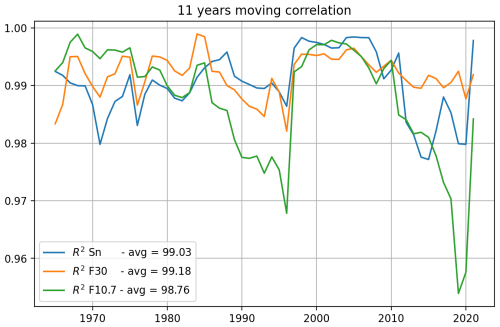
Figure 2The 11-year moving squared linear correlation between IG and solar EUV proxies: Sn (blue), F30 (orange), and F10.7 (green).
The linear correlation analysis indicates that Sn and F30 are better reproducing the variability of foF2, through the IG index. Figure 3 shows the IG values modeled linearly using both proxies along with the original dataset. This figure helps to contextualize the moving correlation seen in Fig. 2. In all maxima after 1980, F30 is closer to IG values; however, in the complete previous solar cycle, Sn models the ionospheric index better. On the other hand, during minimum solar periods, Sn outperforms F30, even during the last two deep minimum cycles. Taking into account that Sn has a minimum possible value of zero, it is expected to fail to reproduce these last two cycles; however, F30 does not reproduce the IG index decrease.
There is a clear trend between Sn and F30; note in Fig. 3 how F30 (green line) is under Sn (blue line) up to ∼ 1990, where two lines cross, and after this time F30 models higher values of IG at almost every point. This behavior is closely linked to the analysis made by Mursula et al. (2024); they compare the solar flux indices with sunspot number, identifying this increasing trend.
At this point, an important problem arises: if solar fluxes increase compared to IG, which represents ionospheric foF2 level, we can anticipate a decreasing trend in the residuals if we subtract IG modeled with F30 from the original data. Perhaps, looking for a proxy with a decreasing trend led us to a mistake with F30, mainly taking into account that F30 does not obtain the highest correlation before ∼ 1980.
This can be noted in Fig. 4, where we perform an endpoint moving correlation, fixing the first year to 1960, changing the last year, and calculating the linear correlation of IG and the three proxies. Additionally, the same analysis is performed in reverse, fixing the final year to 2023, changing the first year, and estimating the linear correlation. In Fig. 4, the superior performance of Sn to predict IG is clear; the left panel shows that when starting the analysis in 1960, Sn is the best for almost the complete period, except for F10.7 at the beginning. On the other hand, the right panel explains why F30 is sometimes considered the best, fixing the last year and adding years backward in time; it can be noted that if the correlation analysis begins in the period 1980–1990, F30 is the best, but looking at the complete panel, it is clear that it is just for that period. This is clearer when comparing with Fig. 3, where we noted that F30 fails to model the beginning and end of the IG dataset. Moreover, Sn has a clearly higher stability for this kind of analysis; therefore, the question is, why are we discarding Sn as a solar EUV proxy?
Note that the analysis in Fig. 4 is completely different from the result in Fig. 2, due to the variation in the initial and end years; the result of the best correlation using F30 can be obtained by reducing the period used in the correlation. This discrepancy is associated with the inclusion, or not, of solar cycle 20 (1964–1976), where F30 does not properly represent the IG index variability.
An important ionospheric feature is the saturation (Balan et al., 1994; Liu et al., 2003). During the daytime, there is a maximum possible value of foF2, even if solar flux continues increasing. This problem is more evident at shorter timescales. Many authors deal with this by performing a quadratic or even cubic regression between proxies and foF2 (Liu et al., 2006; Ma et al., 2009; Danilov and Berbeneva, 2023). However, this effect is not that clear when analyzing annual means. Figure 5 shows the linear and quadratic regressions between proxies and IG separately for periods 1960–1997 and 1985–2023 to have the same number of years in each regression. Again, we can mention the higher performance of Sn in the first cycles, and F10.7 is the second best proxy. In contrast, F30 obtains a higher correlation in the second period. There is a weak improvement using quadratic regression at the annual scale; this can be noticed in each panel. F10.7 exhibits a more significant increase in the correlation.
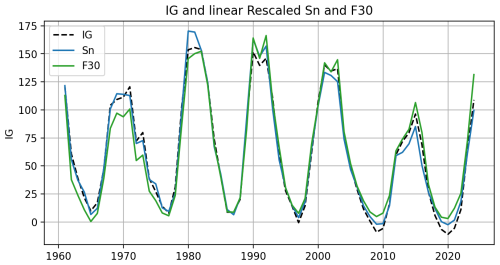
Figure 3Linear modeling of the ionospheric IG index using F30 (green) and Sn (blue), with the observed IG index (dashed black line).
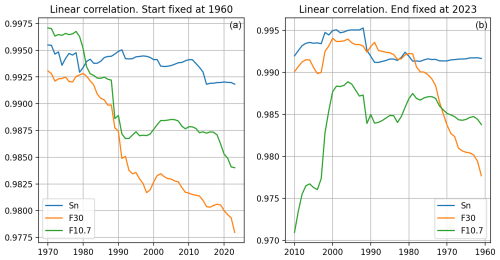
Figure 4Squared linear correlation between IG and Sn, F30, and F10.7 with a moving end year in (a) and the inverse, a moving start year, in (b).
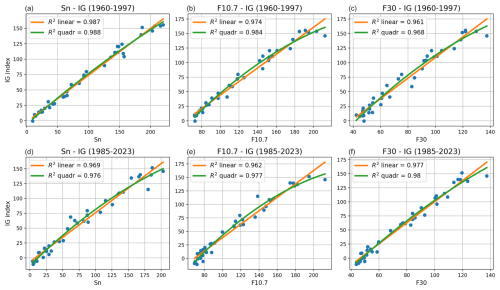
Figure 5Linear and quadratic regressions between proxies and IG separately for periods 1960–1997 (a, b, c) and 1985–2023 (d, e, f).
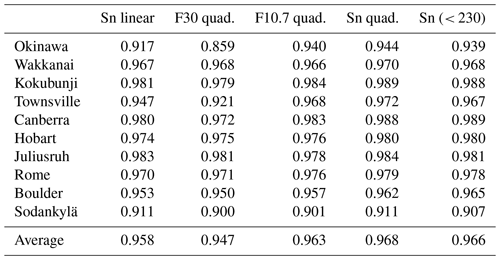
Is then sunspot number the best EUV proxy to model foF2? The evidence up to this point suggests that it is more stable when considering longer datasets. The saturation effect could be affecting the correlation; therefore, when subtracting Sn values higher than 230 (∼ 5 % of data) from the daily dataset and calculating the annual mean, we obtain an excellent improvement in the linear correlation between Sn and IG. This method can also be used with F30 and F10.7, but the improvement is not as good as with sunspot number (see Table 1). In addition, we model the annual IG using a quadratic regression; both results can be seen in Fig. 6. Since Sn is the only proxy that shows the step down between cycle 23 and 24 minima, like IG and most ionospheric stations, it obtains the highest correlation using the complete period.
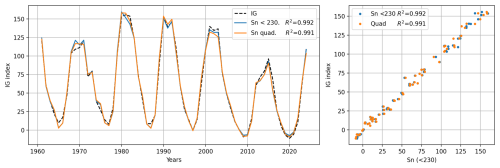
Figure 6The IG index (dashed black) and the IG index modeled using quadratic regression (orange) and de-saturated Sn (< 230, blue). The right panel shows IG vs. IG modeled.
The correlation using a de-saturated Sn and quadratic regression shows a significant improvement over the original dataset compared to Sn in Fig. 3. The maxima of all cycles after 1970 are close to IG values. Moreover, the last two minima are much better represented using the quadratic regression and de-saturating the Sn dataset. The squared correlations between indices and stations using the quadratic regression can be seen in Table 1, comparing to linear and de-saturated Sn. Table 1 shows that the quadratic regression using Sn is, on average, the most effective to predict the ionospheric foF2, followed by de-saturated Sn and quadratic F10.7.
Table 1Squared correlation (R2) between stations and indices using a quadratic (quad.) regression over the complete period (1960–2023), comparing with linear and de-saturated Sn.
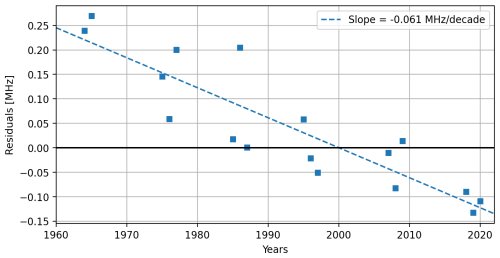
The only remaining task is the estimation of the long-term trend using a highly reliable proxy. From Fig. 6, we can expect a nearly zero trend for the complete period. This is confirmed by filtering the solar activity from the IG dataset using de-saturated Sn and calculating the residuals, which yield a trend of −0.008 % per decade. However, if we take a close look at the minimum's solar times in Fig. 6, a clear trend can be noted: IG is higher than Sn in 1965 but lower in 2020. Considering that the CO2 cooling effect over the thermosphere is more pronounced during minimum solar activity conditions (Emmert et al., 2008; Brown et al., 2024), we could assume a more noticeable effect over the ionospheric parameters as well during lower solar activity conditions. The theoretical trend estimated using a general circulation model (WACCM-X) is −0.6 % per decade for foF2 (Solomon et al., 2018). Therefore, by focusing on the minimum solar years (1963–1965, 1975–1977, 1985–1987, 1995–1997, 2007–2009, 2018–2020), the trend results in −0.79 % per decade, which is really close to the theoretical value. The residuals from this procedure are shown in Fig. 7, where a clear and constant trend is noticed. It is important to note that the experimental trend using a similar approach on ionospheric station data results in much higher values, between 0.04 and 0.21 MHz per decade (Laštovička, 2024; Zossi et al., 2024). Mikhailov et al. (2017) also found a better correlation using sunspot number over F10.7 in the long-term trend of the critical frequency of the E layer.
In this work, we found that sunspot number is the most reliable solar EUV proxy for predicting the ionospheric index IG over the period 1960–2023. This index is a good indicator of the global ionospheric foF2, as is shown in Fig. 1 and supported by the R2 value.
While many recent articles claim F30 as the superior solar EUV proxy, F30 fails at representing the step down during the last two solar minima – a decline that is evident in the Sn dataset. Some of these studies analyze shorter periods in order to use more stations. In Fig. 2, we show that F30 is the proxy with better stability to represent each cycle separately. However, when analyzing the period 1960–2023, Sn outperforms the F30 correlation, as shown in Fig. 3.
The main issue with F10.7 and F30 is the last two solar cycle minima, where the ionospheric foF2 decreases more than expected and where a linear model cannot reproduce this decrease using the solar radio fluxes. Sunspot number, on the other hand, effectively handles this issue. When applying a quadratic regression or neglecting saturation effects from the daily database, Sn obtains the highest correlation, reliably reproducing the last two cycles.
The only problem with this methodology is that if we calculate the long-term trend filtering the solar activity, we do not obtain the trend predicted by the global circulation models. Nevertheless, as we point out in Fig. 6, minimum solar activity periods have a noticeable trend that results in good agreement with the theoretical trend.
All data used in this work are in the public domain. For ionospheric foF2 data, see (1) National Institute of Information and Communications Technology, 2025; (2) Australian Bureau of Meteorology, 2025; and (3) Lowell GIRO Data Center, 2025. F10.7 available at Space Weather Canada, 2025. Sn data are from the revised Sn database available at Sunspot Index and Long-term Solar Observations, 2025. F30 data are available from the National Astronomical Observatory of Japan, 2025. The IG index is at the UK Solar System Data Centre, 2025.
BSZ, FM: conceptualization, investigation, formal analysis, methodology, and writing; TD and FdHB: investigation, methodology, validation, review, and editing; AGE: original draft preparation, investigation, formal analysis, review, and editing.
At least one of the (co-)authors is a member of the editorial board of Annales Geophysicae. The peer-review process was guided by an independent editor, and the authors also have no other competing interests to declare.
Publisher’s note: Copernicus Publications remains neutral with regard to jurisdictional claims made in the text, published maps, institutional affiliations, or any other geographical representation in this paper. While Copernicus Publications makes every effort to include appropriate place names, the final responsibility lies with the authors.
This article is part of the special issue “Long-term trends in the stratosphere–mesosphere–thermosphere–ionosphere system”. It is a result of the 12th International Workshop on Long-Term Changes and Trends in the Atmosphere (TRENDS 2024), Ourense, Spain, 6–10 May 2024.
Bruno S. Zossi, Franco D. Medina, and Ana G. Elias acknowledge research projects PIP 2957 and PIUNT E756. Trinidad Duran acknowledges research projects PICT 2019-03491 and PGI 24/F083.
This paper was edited by Dalia Buresova and reviewed by two anonymous referees.
Australian Bureau of Meteorology: Index of /wdc/iondata/au, Australian Bureau of Meteorology [data set], https://downloads.sws.bom.gov.au/wdc/iondata/au/ (last access: 16 January 2025), 2025.
Balan, N., Bailey, G. J., and Moffett, R. J.: Modeling studies of ionospheric variations during an intense solar cycle, J. Geophys. Res.-Space, 99, 17467–17475, https://doi.org/10.1029/94JA01262, 1994.
Bilitza, D., Pezzopane, M., Truhlik, V., Altadill, D., Reinisch, B. W., and Pignalberi, A.: The International Reference Ionosphere Model: A Review and Description of an Ionospheric Benchmark, Rev. Geophys., 60, e2022RG000792, https://doi.org/10.1029/2022RG000792, 2022.
Brown, M. K., Lewis, H. G., Kavanagh, A. J., Cnossen, I., and Elvidge, S.: Future Climate Change in the Thermosphere Under Varying Solar Activity Conditions, J. Geophys. Res.-Space, 129, e2024JA032659, https://doi.org/10.1029/2024JA032659, 2024.
Clette, F.: Is the F10.7 cm – Sunspot Number relation linear and stable?, J. Space Weather Spac., 11, 25 pp., https://doi.org/10.1051/SWSC/2020071, 2021.
Damboldt, T. and Suessmann, P.: Consolidated Database of Worldwide Measured Monthly Medians of Ionospheric Characteristics foF2 and M(3000)F2, INAG (Ionosonde Network Advisory Group) Bull., 19 pp., https://www.ursi.org/files/CommissionWebsites/INAG/web-73/2012/damboldt_consolidated_database.pdf (last access: 16 January 2025), 2012.
Danilov, A. and Berbeneva, N.: Statistical analysis of the critical frequency foF2 dependence on various solar activity indices, Adv. Space Res., 73, 685–689, https://doi.org/10.1016/J.ASR.2023.09.047, 2023.
de Haro Barbás, B. F., Elias, A. G., Venchiarutti, J. V., Fagre, M., Zossi, B. S., Tan Jun, G., and Medina, F. D.: MgII as a Solar Proxy to Filter F2-Region Ionospheric Parameters, Pure Appl. Geophys., 178, 4605–4618, https://doi.org/10.1007/S00024-021-02884-Y, 2021.
Dudok de Wit, T. and Bruinsma, S.: The 30 cm radio flux as a solar proxy for thermosphere density modelling, J. Space Weather Spac., 7, 11 pp., https://doi.org/10.1051/SWSC/2017008, 2017.
Emmert, J. T., Picone, J. M., and Meier, R. R.: Thermospheric global average density trends, 1967–2007, derived from orbits of 5000 near-Earth objects, Geophys. Res. Lett., 35, 5101, https://doi.org/10.1029/2007GL032809, 2008.
Jakowski, N., Hoque, M. M., and Mielich, J.: Long-term relationships of ionospheric electron density with solar activity, J. Space Weather Spac., 14, 16 pp., https://doi.org/10.1051/SWSC/2024023, 2024.
Laštovička, J., Mikhailov, A. V., Ulich, T., Bremer, J., Elias, A. G., Ortiz de Adler, N., Jara, V., Abarca del Rio, R., Foppiano, A. J., Ovalle, E., and Danilov, A. D.: Long-term trends in foF2: A comparison of various methods, J. Atmos. Sol.-Terr. Phys., 68, 1854–1870, https://doi.org/10.1016/J.JASTP.2006.02.009, 2006.
Laštovička, J.: The best solar activity proxy for long-term ionospheric investigations, Adv. Space Res., 68, 2354–2360, https://doi.org/10.1016/J.ASR.2021.06.032, 2021.
Laštovička, J.: Progress in investigating long-term trends in the mesosphere, thermosphere, and ionosphere, Atmos. Chem. Phys., 23, 5783–5800, https://doi.org/10.5194/ACP-23-5783-2023, 2023.
Laštovička, J.: Dependence of long-term trends in foF2 at middle latitudes on different solar activity proxies, Adv. Space Res., 73, 685–689, https://doi.org/10.1016/J.ASR.2023.09.047, 2024.
Liu, L., Wan, W., Ning, B., Pirog, O., and Kurkin, V.: Solar activity variations of the ionospheric peak electron density, J. Geophys. Res.-Space, 111, A08304, https://doi.org/10.1029/2006JA011598, 2006.
Liu, H. L., Foster, B. T., Hagan, M. E., McInerney, J. M., Maute, A., Qian, L., Richmond, A. D., Roble, R. G., Solomon, S. C., Garcia, R. R., Kinnison, D., Marsh, D. R., Smith, A. K., Richter, J., Sassi, F., and Oberheide, J.: Thermosphere extension of the Whole Atmosphere Community Climate Model, J. Geophys. Res.-Space, 115, 12302, https://doi.org/10.1029/2010JA015586, 2010.
Liu, J. Y., Chen, V. I., and Lin, J. S.: Statistical investigation of the saturation effect in the ionospheric foF2 versus sunspot, solar radio noise, and solar EUV radiation, J. Geophys. Res.-Space, 108, 1067, https://doi.org/10.1029/2001JA007543, 2003.
Lowell GIRO Data Center: Digital Ionogram Data Base (DIDBase), Lowell GIRO Data Center [data set], https://giro.uml.edu/didbase/scaled.php (last access: 16 January 2025), 2025.
Ma, R., Xu, J., Wang, W., and Yuan, W.: Seasonal and latitudinal differences of the saturation effect between ionospheric NmF2 and solar activity indices, J. Geophys. Res.-Space, 114, 10303, https://doi.org/10.1029/2009JA014353, 2009.
Mielich, J. and Bremer, J.: Long-term trends in the ionospheric F2 region with different solar activity indices, Ann. Geophys., 31, 291–303, https://doi.org/10.5194/angeo-31-291-2013, 2013.
Mikhailov, A. V., Perrone, L., and Nusinov, A. A.: A mechanism of midlatitude noon-time foE long-term variations inferred from European observations, J. Geophys. Res.-Space, 122, 4466–4473, https://doi.org/10.1002/2017JA023909, 2017.
Mursula, K., Qvick, T., Holappa, L., and Asikainen, T.: Magnetic Storms During the Space Age: Occurrence and Relation to Varying Solar Activity, J. Geophys. Res.-Space, 127, e2022JA030830, https://doi.org/10.1029/2022JA030830, 2022.
Mursula, K., Pevtsov, A. A., Asikainen, T., Tähtinen, I., and Yeates, A. R.: Transition to a weaker Sun: Changes in the solar atmosphere during the decay of the Modern Maximum, Astron. Astrophys., 685, A170, https://doi.org/10.1051/0004-6361/202449231, 2024.
National Astronomical Observatory of Japan: Nobeyama Radio Polarimeters, National Astronomical Observatory of Japan [data set], https://solar.nro.nao.ac.jp/norp/index.html (last access: 16 January 2025), 2025.
National Institute of Information and Communications Technology: Manually scaled parameters, National Institute of Information and Communications Technology [data set], https://wdc.nict.go.jp/Ionosphere/en/archive/isdj_manual_txt.html (last access: 16 January 2025), 2025.
Reinisch, B. W. and Galkin, I. A.: Global Ionospheric Radio Observatory (GIRO), Earth Planet. Sci., 63, 377–381, https://doi.org/10.5047/eps.2011.03.001, 2011.
Solomon, S. C., Liu, H. L., Marsh, D. R., McInerney, J. M., Qian, L., and Vitt, F. M.: Whole Atmosphere Simulation of Anthropogenic Climate Change, Geophys. Res. Lett., 45, 1567–1576, https://doi.org/10.1002/2017GL076950, 2018.
Space Weather Canada: Solar radio flux – solar monitoring program, Space Weather Canada [data set], https://spaceweather.gc.ca/forecast-prevision/solar-solaire/solarflux/sx-en.php (last access: 16 January 2025), 2025.
Sunspot Index and Long-term Solar Observations: Sunspot Number, Sunspot Index and Long-term Solar Observations [data set], https://www.sidc.be/SILSO/datafiles (last access: 16 January 2025), 2025.
UK Solar System Data Centre: https://www.ukssdc.ac.uk/cgi-bin/wdcc1/secure/geophysical_parameters.pl (last access: 16 January 2025), 2025.
Zolesi, B. and Cander, L. R.: Ionospheric prediction and forecasting, Ionospheric Prediction and Forecasting, 1–240, https://doi.org/10.1007/978-3-642-38430-1, 2014.
Zossi, B. S., Medina, F. D., Duran, T., and Elias, A. G.: Selecting the best solar EUV proxy for long-term timescale applications, Adv. Space Res., 75, 856–863, https://doi.org/10.1016/J.ASR.2024.07.023, 2024.


