the Creative Commons Attribution 4.0 License.
the Creative Commons Attribution 4.0 License.
Effects of supernova-induced soft X-rays on middle- and upper-atmospheric nitric oxide and stratospheric ozone
McArthur Jones Jr.
Jeffrey W. Reep
We provide a quantitative test of the recent suggestion (Brunton et al., 2023) that supernovae could significantly disrupt ozone layers of Earth-like planets through a multi-month flux of soft X-rays that produce ozone-destroying odd nitrogen (e.g., NO and NO2). Since soft X-rays do not directly penetrate down to the ozone layer, this effect would be indirect and require downward transport of NOx from the mesosphere. Mirroring previous studies of the indirect effects of energetic particle precipitation (EPP-IE), we call this the X-ray indirect effect (Xray-IE). We use the NCAR Thermosphere–Ionosphere–Mesosphere–Electrodynamics General Circulation Model (TIME-GCM) to simulate the production of NO and its transport into the stratosphere. We model the soft X-ray flux as if it were a multi-month-long solar flare and use our previously developed solar flare model to simulate the soft X-ray enhancement. Our results yield significant enhancement in stratospheric odd nitrogen, most dramatically in the Southern Hemisphere. The strongest global effects are seen in the upper stratosphere at pressure surfaces between 1–3 hPa (about 42–48 km), consistent with previous observations of the EPP-IE. We then use a detailed stratospheric photochemistry model to quantify the effects of this NOx enhancement on ozone. Widespread ozone reductions of 8 %–15 % are indicated; however, because these are limited to the upper edges of the ozone layer, the effects on the ozone column are limited to 1 %–2 %. We thus conclude that the effects of a multi-month X-ray event on biologically damaging UV radiation at the surface are also likely to be small.
- Article
(1646 KB) - Full-text XML
- BibTeX
- EndNote
As discussed by Airapetian et al. (2020) and summarized by Garcia-Sage et al. (2023), the explosion of new discoveries of exoplanets and the search for life in the universe have led to increased recent interest in how space weather can influence the climate and habitability of the Earth and possible life-bearing exoplanets. As the above articles discuss (see also Kahler and Ling, 2023), extreme space weather events can include solar and stellar flares, coronal mass ejections, solar and stellar energetic particles (SEPs), and/or cosmic rays. There is, however, a parallel line of inquiry that has long considered the effects of supernovae on planetary biospheres (Gehrels et al., 2003). As we will discuss, there is significant conceptual overlap in the specific mechanisms, which is a motivation for our present study.
Recently, Brunton et al. (2023) proposed a new mechanism by which supernovae could threaten the existence of planetary biospheres. The classical mechanisms have traditionally invoked ozone depletion either due to gamma-ray emission, which would occur promptly (within 100 d) with the event, or from cosmic-ray fluxes which could be emitted over a period on the order of 10–100 years (Gehrels et al., 2003). Brunton et al. (2023) suggest a third mechanism from enhanced X-ray emissions that might result from interactions between the supernova blast wave and the local interstellar medium. They present observed light curves showing X-ray emissions occurring over periods ranging from 6 months to several years after the initial eruption. They suggest that these emissions might represent a heretofore unexplored mechanism for planetary ozone destruction.
An important consideration for understanding the effect of enhanced X-rays on the ozone layer, which Brunton et al. (2023) discuss, is the fact that X-rays with energies less than 10–20 keV are absorbed in the mesosphere, above the ozone layer. While Brunton et al. recognize that there may be X-ray emission from a supernova with greater energies, much of their data are limited to these softer X-rays. As a result, they suggest that the effect of X-rays would be more indirect and they quote some aeronomic studies (Solomon et al., 1982; Randall et al., 2006) of how perturbations to nitric oxide in the mesosphere and lower thermosphere could be transported down to the middle atmosphere where they would catalytically lead to ozone loss. Conventionally this coupling mechanism is due the production of nitric oxide (NO) in the auroral zones near 100 km altitude by energetic electron impact on N2 followed by descent through the mesosphere into the stratosphere under the cover of polar night, which limits the dissociation of the enhanced NO by UV sunlight. Randall et al. (2007) labeled this as the energetic particle precipitation indirect effect (EPP-IE). Here, motivated the by Brunton et al. (2023) hypothesis, we consider an analogous indirect effect on stratospheric odd nitrogen and ozone from continual soft X-ray influx, which we dub the “X-ray IE”.
Brunton et al. (2023) provide estimates for the total amount of X-ray energy that might threaten planetary ozone layers and compare them to the integrated energy emitted by a multiyear solar flare. Specifically, they argue that a so-called Carrington flare (X45; i.e., 4.5 × 10⁻³ W m−2), near the upper limit of flare energy release by the Sun (see, e.g., Cliver et al., 2022), would have to persist for 2.8 years to provide the requisite energy. Using this analogy, we will use an existing solar flare model (Siskind et al., 2022) and consider the consequences of previously considered solar flares extending for over a year. We will show how the X-ray IE can lead to a significant influx of nitric oxide entering the stratosphere and quantitatively model to what extent this influx could reduce ozone abundances. Ultimately, we conclude that due to the specifics of how NO is transported in the middle atmosphere, while significant effects are probable, the global destruction of the Earth's ozone layer is less likely.
The general outline of the paper is as follows. In Sect. 2, we introduce the solar flares that form the basis of our study, look at the initial response of lower-thermospheric NO, and compare our calculations with previously published observations of the nitric oxide response to a solar flare. In Sect. 3 we document the descent of this flare-produced NO down through the mesosphere using a three-dimensional model of chemistry and transport of the middle and upper atmosphere (the NCAR Thermosphere–Ionosphere–Mesosphere–Electrodynamics General Circulation Model – TIME-GCM). To validate the X-ray IE we will put it into the context of our calculated EPP-IE, which can be compared with the extensive literature on that topic. Finally, in Sect. 4, we perform photochemical modeling of the sensitivity of stratospheric ozone to the various enhancements in middle-atmospheric nitric oxide suggested by the TIME-GCM. One limitation that we will discuss is that the 30 km bottom boundary of the TIME-GCM is right at the peak of the ozone layer. Thus, photochemical simulations are required to be able to extrapolate down to encompass the entire ozone column.
2.1 Solar flare modeling
Our approach follows the suggestion of Brunton et al. (2023), namely to model the multi-month soft X-ray flux as if it were a solar flare that lasted for months rather than the 30–60 min which is typical (see Rodgers et al., 2010; Table 3; also Reep et al., 2022). The advantage of this approach is that it allows us to utilize existing flare spectra (Siskind et al., 2022). These spectra were developed with the NRLFLARE model, a physical model of solar flare irradiance, which uses a series of flaring loop simulations to reconstruct the soft X-ray light curves of both GOES and XRS channels and, from those loop simulations, synthesizes full spectra from approximately 0.01 to 200 nm (Reep et al., 2020, 2022). The ratio of the two GOES and XRS channels is commonly used as a proxy for temperature, which the model uses to derive heating rates to drive those simulations (see, e.g., Garcia, 1994). The loop simulations are run with the open-source radiative hydrodynamics code HYDRAD (Bradshaw and Cargill, 2013; Reep et al., 2019, https://github.com/rice-solar-physics/HYDRAD, last access: 18 March 2025), which solves the Navier–Stokes equations for plasma constrained to travel along a magnetic flux tube. The full model and spectral synthesis are described in detail in Reep et al. (2022).
NRLFLARE was designed to reproduce X-ray spectra from solar flares, so it is important to discuss the differences from and similarities to supernova X-ray spectra. In both cases, the spectra in soft X-rays (around 1 to 20 keV or so) are dominated by optically thin thermal bremsstrahlung emission with a power-law shape, with notable line emissions from hot ions such as Fe XXV (a prominent line at 6.7 keV appears in spectra of both). There are two important differences. First, the elemental abundances are not the same, which will cause the relative strength of the emission (particularly line emission) to differ. Second, solar flares are expected to be in collisional equilibrium, while supernova remnants have low enough densities that the collisional timescale is long, so they are typically not in equilibrium. See the reviews by Vink (2012) for X-ray emissions in supernovae and Fletcher et al. (2011) for solar flares (Sect. 6 of both reviews). For the purposes of calculating NO production, the exact spectral shape is less important than the total soft X-ray energy input driving the atmospheric response. A key assumption is that we are essentially ignoring wavelengths less than 0.05 nm. As discussed by Brunton et al. (2023) these wavelengths would be absorbed much more directly into the stratospheric ozone layer. Older studies (see Ejzak et al., 2007) did include these wavelengths, and this inclusion, as noted by Brunton, “complicates any direct extrapolation” of those results when considering a purely soft X-ray event, as we do here. Our work is the first to use a model of the stratosphere, mesosphere, and thermosphere to explicitly consider how the indirect effects of enhanced soft X-rays could affect global ozone.
One of the main subjects of the Siskind et al. (2022) paper was the 10 September 2017 X8.3 flare, and a spectrum at the flare peak was presented in that paper. We will use that as our primary case. Table 1 summarizes key aspects of that flare that are relevant for this paper. First, it is important to note that in 2020, NOAA removed a 0.7 recalibration that had historically been applied to GOES 13–15 data (see https://ngdc.noaa.gov/stp/satellite/goes/doc/GOES_XRS_readme.pdf, last access: 18 March 2025; also Reep et al., 2022).
Thus, the true X-ray irradiance for older flares is brighter. This means that the 2017 flare, originally labeled as 8.3 in Siskind et al. (2022) and earlier works (Qian et al., 2019; Redmon et al., 2018), should be re-classified as X11.8. Table 1 shows the calculated peak energy by the NRLFLARE model as being about 12 % greater than observed by GOES, thus effectively making this flare an X13.3 event. We will thus use the label “X13” to describe this event as we discuss our atmospheric simulations.
Table 1 also shows the integrated energy in several energy bins. The division into 0.1–1.0 and 1–2 nm bins is to compare with the calculations of Rodgers et al. (2010), discussed below. The final column extrapolates our flare duration to a year. In particular, it shows that if we assumed the X13 flare persisted for an entire year, it would deliver 64.4 kJ m−2 to the atmosphere. This is less than the 400 kJ m−2 that Brunton et al. (2023) use as a critical threshold for ecologically destructive X-ray energy input. We will therefore also consider the energy input from a spectrum calculated for 28 October 2003, the so-called Halloween event. The effects of this flare on thermospheric nitric oxide were first discussed by Rodgers et al. (2010), and we will compare our calculations to theirs. Again, due to the NOAA recalibration, this flare, which was originally classified as X18, should really be classified as X25. As seen in Table 1, our calculated energy at the flare peak was about 8 % higher than measured by GOES, and thus we label this as an X27. If this flare were to persist at peak level for a year, Table 1 indicates it would deliver about 171 kJ m−2 to the atmosphere. As shown by Brunton et al. (2023, their Fig. 3), it is not uncommon for supernova X-ray events to persist for over a year. Table 1 shows that if our calculated X27 event were to last about 2.3 years it would deliver about 400 kJ m−2, which is the energy input postulated by Brunton et al. (2023) as being biospherically destructive. Unfortunately, the problem with the X27 simulation is that when this spectrum was input continuously into the atmospheric model (TIME-GCM, discussed below), the model crashed after 8 d of the simulation. Thus, in our discussion of ozone chemistry effects, we will discuss extrapolations based upon comparisons of the nitric oxide response from the first 8 d of each simulation.
Figure 1 compares the spectra from our X13 and X27 calculations at their respective peak minutes. The figure shows the calculated spectrum at the native spectral resolution of NRLFLARE (0.5 Å) and then integrated in 1 nm bins so that it can be compared to that derived by Rodgers et al. (2010; see their Fig. 3). Like Rodgers et al. (2010), NRLFLARE shows a significant increase in the flare spectrum from 1–2 nm relative to the shorter wavelengths less than 1 nm. As discussed by Siskind et al. (2022) this seems consistent with Orbiting Solar Observatory (OSO) data presented by Neupert et al. (1967), although this spectral region is not well covered with modern spectra. Comparing our results in detail with Rodgers et al. (2010) suggests that our calculated 0.1–1 nm flux of 0.004 W m−2 is in good agreement. Our 1–2 nm integrated energy is about 20 % lower than Rodgers et al. (2010) at the flare peak. For the purposes of this paper, this difference is not significant; when we compare our calculated nitric oxide variation to Rodgers et al. (2010), we can account for this difference by using integrated energy as the independent variable to normalize both our calculations. This will be discussed further in Sect. 4.
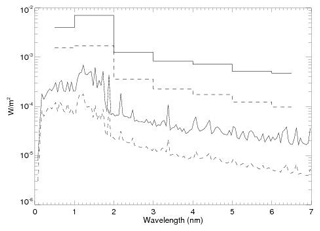
Figure 1Calculated spectra for the peak of the X27 event of 28 October 2003 (solid lines) and the X13 event of 10 September 2017. The rationale for the classifications is discussed in the text. The bottom two curves are at 0.5 Å resolution. The histogram format for the top two curves is the integrated energy over 1 nm bins.
2.2 Atmospheric modeling with the TIME-GCM
The solar spectra shown in Fig. 1 were used as inputs into the photoelectron ionization model presented by Siskind et al. (2022) and incorporated into the NCAR TIME-GCM. The NCAR TIME-GCM is a hydrostatic general circulation of the middle and upper atmosphere that solves the continuity, electrodynamic, energy, and momentum equations from first principles on a regular longitude and latitude and log-pressure grid in the vertical (Roble and Ridley, 1994). The model resolution is 2.5° × 2.5° (longitude × latitude) with four grid points per vertical scale height extending from 12 to 4.6 × 10⁻⁶ hPa (or roughly 30 to 450–600 km depending on solar activity).
The photoelectron ionization model presented by Siskind et al. (2022) defines 12 new wavelength bins for the soft X-ray energy range to give better spectral resolution (and hence better altitude resolution of energy deposition) than the original NCAR spectral model presented by Solomon and Qian (2005). Note that there is a typographical error in Table 3 of Siskind et al. (2022): bin no. 7 for the O2 cross section. It should read , not . It is correctly implemented in the model.
One difference in how we used the TIME-GCM from the short-term (<1 d) simulations of Siskind et al. (2022) concerns the dynamics of the mesosphere. In the standard version of the TIME-GCM (i.e., the model setup used in Siskind et al., 2022) climatological background horizontal winds, temperatures, and geopotential are used at the model lower boundary in combination with monthly mean diurnal and semidiurnal tides from the Global Scale Wave Model (GSWM; Zhang et al., 2010a, b). However, this standard model configuration does not properly simulate the downward transport of NOx from the mesosphere into the stratosphere. In order to do so, we constrained TIME-GCM upper-stratospheric and mesospheric horizontal winds and temperatures between the model lower boundary (∼ 30 km) and ∼ 75 km with Modern Era Retrospective-analysis for Research and Applications – version 2 (MERRA-2; Gelaro et al., 2017) using four-dimensional tendency nudging (originally termed 4D data assimilation by Stauffer and Seaman, 1990, 1994). This nudging procedure is described in great detail by Jones et al. (2018) and involves adding an additional acceleration and energy tendency term to the conversation equations that is proportional to the modeled and MERRA-2 horizonal wind and temperature differences up to ∼ 75 km.
In previous studies (e.g., Jones et al., 2020, 2023), TIME-GCM was constrained using a high-altitude version of the Navy Global Environmental Model (NAVGEM-HA; Eckermann et al., 2018; McCormack et al., 2017), which provides dynamical fields up to ∼ 97 km. Note that the MERRA-2 reanalysis product used herein does not extend as high as NAVGEM-HA, and therefore we had to make a small modification to Eq. (5) of Jones et al. (2018). This equation describes the vertical weighting distribution of nudging, which in part controls the strength of the additional tendency term. The vertical weighting distribution used here takes the same functional form as Eq. (5) of Jones et al. (2018), but the zmax variable (representative of the TIME-GCM log-pressure level where the model becomes unconstrained) is equal to −10.5 or ∼ 75 km. For reference, a vertical weighting factor of 0.5 occurs at roughly 55 km (or 0.2 hPa), above (below) which the nudging term is more weighted toward TIME-GCM (MERRA-2) dynamical fields. Finally, we conclude this section by noting that a key assumption that underlies our approach is that all the enhanced NOx that comes flooding into the middle atmosphere would not modify ozone so dramatically as to change the circulation away from that provided by MERRA-2. Based upon the (small) degree of column ozone change shown below, we conclude that this is an acceptable assumption but clearly could be investigated further with a more self-consistent physical model.
2.3 Initial thermospheric response to multi-month solar flare
As discussed above, we model the effects of the supernova-induced soft X-ray event as if it were a multi-month solar flare. Specifically, for the X13 event, we performed a simulation which continues through the end of 2017 and then covers a complete additional year. In the analyses discussed below, we present the results of the X13 and X27 simulations with a baseline run that only includes the EPP-IE. The difference between the X13 or X27 and baseline runs serves to quantify the possible response of the middle and upper atmosphere to a multi-month soft X-ray event. We also note that for TIME-GCM simulations performed herein geomagnetic activity was held constant with Kp ≅ 3 in order to exclusively highlight flare impacts.
Figure 2 shows the initial response at low latitudes (averaged from 30° S–30° N), plotted every 2 h, as a function of longitude for the first day. The solid line is 16:00 UT, which was just at flare onset (the peak of the 10 September 2017 flare was around 16:06 UT). The four dashed lines are for 17:00, 19:00, 21:00, and 23:00 UT and show how the NO increases in both the thermosphere (panel a) and the mesosphere (panel b) immediately after flare onset. Note how the longitudinal response progresses westward for the equatorial plots, tracking the sub-solar point. This is consistent with our implicit assumption that the supernova will be aligned with the ecliptic plane. While perhaps not always true (the galactic plane is tilted 60° with respect to the ecliptic plane – see https://en.wikipedia.org/wiki/Astronomical_coordinate_system, last access: 18 March 2025), any supernova will nonetheless rise and set like the Sun, and the peak effects will, like with a solar flare, be concentrated at the sub-stellar longitude. Thus, we conclude that our approach of using an extended solar flare event as a means of simulating a supernova soft X-ray event is acceptable. In our conclusions, we will discuss the possibility of a high latitude supernova soft X-ray event further.
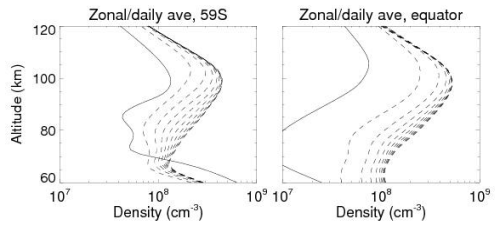
Figure 3 shows daily averaged profiles for the first 10 d for the event at both low and high latitudes. The effects are largest at the Equator, but are still significant at 59° S, and extend well down into the mesosphere. Note that the changes appear to level off after several days, suggesting that the initial response is saturating. Indeed, we find that all the thermospheric response occurs in the first 10–14 d. The middle atmosphere response includes both this initial effect and then later seasonal effects as NO is transported down from the upper mesosphere and lower thermosphere.
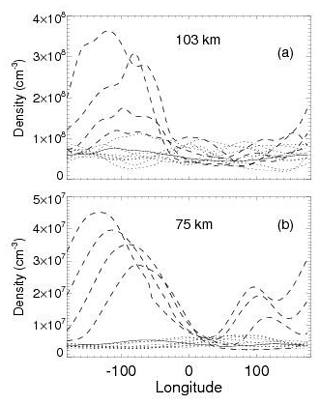
Figure 2Initial response of thermospheric (a) and mesospheric (b) nitric oxide density to the onset of the extended flare. The solid line in each panel is for 16:00 UT, which roughly corresponds to the onset of the flare. The dotted lines are for times prior to that. The dashed curves, which progressively increase and phase to the left according to the sub-solar point, are for 17:00, 19:00, 21:00, and 23:00 UT.
In order to provide a broad, but quantitative, overview of the production of NOx from the extended flare and supernova, Fig. 4 shows the calculated total number of NOx molecules in units of gigamoles (GM) and compares it to a baseline (no flare) simulation. This quantity has been previously used (Vitt and Jackman, 1996; Siskind et al., 2000; Funke et al., 2005) as a way of quantifying space weather impacts on the ambient NOx budget. Here, the production of NOx is mostly in the mesosphere, while the impacts on ozone are in the stratosphere. Therefore, using the 50 km level as an arbitrary dividing line, we break out our calculation to illustrate mesospheric NOx (top panel of Fig. 4) and stratospheric NOx (bottom panel of Fig. 4) separately.
In each panel, the upper (solid) curve is the NOx with the extended flare calculation. The dashed curve is a baseline case with no flare. First, considering the no flare case, our stratospheric value equilibrates to around 20–22 GM (we attribute the initial decrease to an excess of NOx in the initial conditions). Given that the model bottom boundary is 30 km and that significant NOx lies below 30 km, our result is likely consistent with previous estimates by Vitt and Jackman (1996) of 29–30 GM for the stratospheric production of NOx from N2O oxidation. For the no flare case, the upper panel shows a value between 3–5.5 GM due to the background secondary NOx maximum in the upper mesosphere and lower thermosphere.
For the flare case, the mesospheric results show a rapid increase to over 15 GM. The stratospheric NOx does not increase immediately but, as evidenced by the increasing divergence between solid and dashed curves, shows a gradual increase in the flare-produced NOx. It is interesting that for all four curves, the maximum NOx occurs in the period from days 570–620. This corresponds to August and September and coincides with the late winter period in the Southern Hemisphere (SH). As we will discuss, satellite analyses have indicated that the maximum delivery of upper-mesospheric and lower-thermospheric NOx to the stratosphere occurs during that time, and, as we show below, this is indeed the case here.
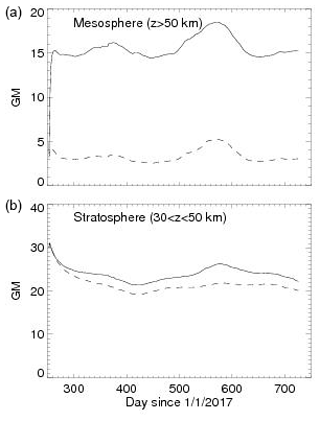
Figure 4Total globally integrated NOx () number of molecules (GM: gigamoles) for the baseline no flare case (dashed line) and the continuous soft X-ray flare (solid line) for the mesosphere (a) and stratosphere (b). The soft X-ray event, which assumes a spectrum from the 10 September 2017 flare, is assumed to have begun on that day (day 253 of 2017).
Finally, we can give a crude comparison of the global effects of this extended flare to previous space weather phenomena. The largest difference in the stratosphere between the flare and baseline, as shown in the bottom panel of Fig. 4, is ∼ 4.5 GM. This can be compared to the 1.3 GM that Funke et al. (2005) estimated was delivered to the upper stratosphere during the 2003 Antarctic winter, which followed a period of elevated space weather activity. Thus, the extended flare appears to exceed that by about a factor of 3.5. Funke et al. (2005) also estimated that a roughly equivalent amount of NOx would end up in the lower-stratospheric polar vortex, below our 30 km bottom boundary. Siskind et al. (2000) also estimated a peak vortex amount of about 0.8–1.3 GM. If we assume that this rough equivalence between upper-stratospheric and lower-stratospheric polar vortex delivery applies here, then we arrive at an estimate of 9 GM from this extended X13 flare. By comparison, Vitt and Jackman (1996) estimated a total production of 7 GM from the large solar proton event in 1989. Thus, our current simulation exceeds any previously documented space weather effect on stratospheric NOx, but at the same time, it is not dramatically bigger. As we shall see when we look at the details of the NOx distribution and its effects on ozone, our results follow that pattern, i.e., greater, but not dramatically so.
Figure 5 compares the seasonal variation of the TIME-GCM NOx (defined as NO+NO2) from our extended flare calculation with our baseline run that only includes the EPP-IE. It thus shows the seasonal variation of how the Xray-IE leads to NOx buildup in the middle atmosphere beyond that caused by energetic electron precipitation. To understand this, we first focus on our baseline EPP-IE simulation and how it compares with the recent simulations of the EPP-IE from Pettit et al. (2021), specifically their Figs. 9–10, which they compared with Michelson Interferometer for Passive Sounding (MIPAS) data in the Southern Hemisphere. Ultimately, we will conclude that the Xray-IE shows similar behavior to the EPP-IE simulation, except with a larger magnitude and a more prolonged seasonal duration. Thus, to highlight the longer impact, we show the entire year, whereas Pettit et al. (2021) just showed April–October.
In comparing with Pettit's results, we see that our baseline simulation underestimates the descent of the MIPAS NOx data at the higher latitudes. The MIPAS data show the 16 ppbv contour descending to below 35 km for the month of August, whereas our simulation (panel a) has this contour remaining above 40 km for the late austral winter period. There are likely two reasons for this. The first is likely the simple fact that TIME-GCM has a bottom boundary at 30 km and thus the descent will decay as this boundary is approached. Indeed, analyses of data from both the Halogen Occultation Experiment (HALOE) on board the Upper Atmospheric Research Satellite (UARS) and Polar Orbiting Aerosol Measurement (POAM) data have shown that enhanced NOx can routinely be detected below 30 km in the Southern Hemisphere (Siskind et al., 2000; Randall et al., 2007). Second, our model does not have the medium-energy electron ionization that Pettit et al. (2021) discuss. They show that models without this component of energetic electrons underestimate the descent of NOx into the mid-stratosphere.
On the other hand, our baseline simulation does much better at midlatitudes (38–53° S in the figure). It shows the 16 ppbv contour dipping down to 45 km for a couple of months. This is quite similar to the MIPAS data shown by Pettit et al. (2021) and is consistent with Funke et al. (2005) and Arnone and Hauchecorne (2011), who pointed out that there are two components to the descent of upper-atmospheric NOx into the stratosphere. One component is directly into the stratospheric polar vortex and descends down into the mid-stratosphere; as we note above, our model cannot capture this. However, there is a second component that is dispersed into middle latitudes in the upper stratosphere. It appears that our model does capture this, and it could be argued that from a global biospheric perspective, this second component is more important since a greater region of the globe is affected.
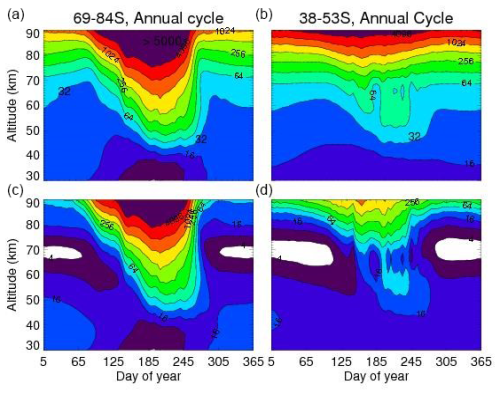
Figure 5Annual cycle of NOx descent into the upper stratosphere from TIME-GCM for two latitude bands. Panels (c)–(d) are for a baseline simulation that only includes the EPP-IE. Panels (a)–(b) additionally include the Xray-IE from the X13 simulation presented in Figs. 1–3. The year shown is 2018, thus representing the period about 4–12 months after flare onset on 10 September 2017. The values on the contour labels are in units of parts per billion by volume (ppbv). The white-colored regions in the baseline run are for mixing ratios <4 ppbv.
Regarding our Xray-IE simulation, dramatic effects are clearly seen in the mesosphere at both middle and high latitudes. The mesospheric minima near 70 km are completely filled in and mixing ratios of over 32 ppbv, up to near 100 ppbv, are seen for most of the year. However, for considerations of impacts on ozone, we focus more on the stratospheric effects. Here, at first glance, for the higher latitudes, the Xray-IE appears somewhat muted. We see no difference in the maximum value of NOx descending below 50 km between our baseline and the constant X13 simulation. However, the Xray-IE is somewhat more prolonged in its NOx enhancement. The baseline simulation shows the 16 ppbv contour curving sharply upward around day 270. Thus, NOx values near 50 km decrease abruptly and this is similar to what is seen in Pettit et al.'s MIPAS data. However, the X13 simulation shows the upper-stratospheric NOx values remaining between 16–32 ppbv for the entire austral spring.
At midlatitudes, the effect of the continual soft X-ray flux is more pronounced. Whereas the baseline simulation shows 16 ppbv descending to about 45 km, the flare simulation has about double that. Like the high-latitude case, after approximately day 270, the baseline case NOx values fall below 16 ppbv, in agreement with the MIPAS data. By contrast, in the X13 simulation we see NOx values of 32–64 ppbv descending to 45–50 km, and the entire upper stratosphere remains flooded with enhanced NOx values greater than 16 ppbv for the whole year.
Figure 6 also compares our baseline (EPP-IE only) simulation with that including the Xray-IE, this time for two pressure surfaces as a function of latitude and time: one near the stratopause (the indicated pressure roughly corresponds to altitudes of 45–48 km) and one lower down towards the middle stratosphere (approximately 38–40 km). The figure shows how the NOx from the flare–supernova spreads over the Southern Hemisphere. It is useful to first look at our baseline case; it clearly shows that the EPP-IE is mainly in late winter–early spring in the Southern Hemisphere and covers the latitudes from −80 to about −20 or −30. Note that there is no evidence for this seen at 3.0 hPa, whereas in actuality, there should still be a springtime enhancement at the highest latitudes as we discussed above. When we compare this with the top row in the figure, the effects of the soft X-rays are very apparent. The late winter–spring enhancement at 1.1 hPa is about twice as large and there is now an enhancement at 3.0 hPa whereby values of NOx of 10–12 ppbv at southern midlatitudes are now replaced by values of 14–16 ppbv. Importantly, there is no evidence for significant enhancements in the Northern Hemisphere (NH), although there does seem to be a general global increase in NOx of about 2 ppbv, about 20 % above the baseline values. This lack of significant NH enhancement is consistent with observations of the EPP-IE, which show generally weaker effects in the NH relative to the SH (Funke et al., 2014). This is generally believed to be due to the weaker descent in the NH and the greater horizontal mixing due to mesospheric planetary waves (Siskind et al., 1997), although NH enhancements are seen in specific years with very strong dynamical perturbations (see Funke et al., 2017). In the present case, while we will consider the effects on stratospheric ozone below, it does suggest a limit as to how biospherically destructive the soft X-ray event could be since the effects are likely to be much more muted in the NH.
One final consideration in looking at the annual cycles in the upper stratosphere and mesosphere in Figs. 5 and 6 is that there appears to be no evidence for any continual buildup of NOx. The NOx at the end of 2018 is not much different than at the beginning. This is consistent with Fig. 3 in that the day-to-day NO increase in the thermosphere decreases such that after 10 d the NO profile showed little change. This will be important when we try to extrapolate from our X13 simulation to stronger events.
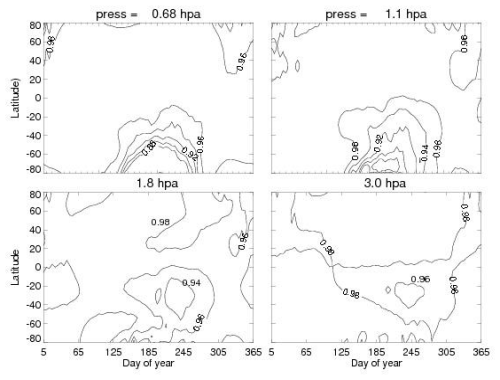
Figure 7 shows the global change in ozone for the X13 simulation compared with our baseline EPP-IE-only case for four pressure surfaces ranging from 0.68 to 3.0 hPa. The ratios are less than 1.0 globally for the entire year, which means lower ozone for the X13 simulation. However, there is a clear maximum in the reduction for the late winter–early spring period in the SH, consistent with the global distribution of the enhanced NOx shown in Fig. 5. Note that the fractional reduction is larger at the lowest pressures. Normally, at these altitudes in the lower mesosphere, ozone loss is dominated by the HOx catalytic cycle (Brasseur and Solomon, 2005). However, with NOx enhancements on the order of 100 ppbv, the NOx catalytic cycle can dominate up to higher altitudes (lower pressures) than is conventional. At the same time, since the bulk of the ozone density is in the stratosphere, the effect of a 3 %–4 % reduction at 3.0 hPa has a greater impact than a 10 % reduction at 0.68 hPa.
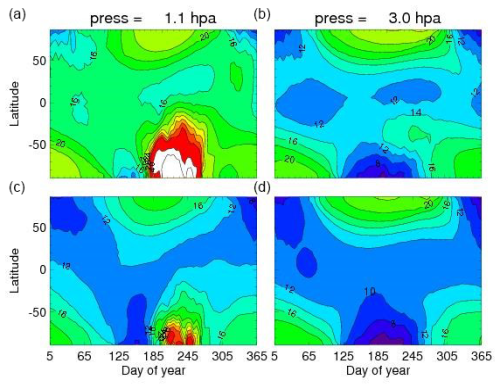
Figure 6NOx (ppbv) vs. latitude and day of year. The period of time is the same as shown in Fig. 4. Panels (c)–(d) are for the baseline case without enhanced soft X-rays. Panels (a)–(b) include the continuous X13 flux. The red regions are NOx values greater than 28 ppbv; the white regions are NOx values greater than 40 ppbv.
The results shown here clearly suggest a potentially global effect on the ozone, albeit limited to a couple of months when the SH NOx enhancement has spread to the Equator. The effect is not large – about 5 % locally in the upper stratosphere – and thus unlikely to be biospherically significant. However, there are important caveats to this statement that we will explore in the subsequent section. First, as we noted above, our input X-ray energy is much smaller than the supernova soft X-ray events postulated by Brunton et al. (2023). Second, the TIME-GCM is limited by a bottom boundary at 30 km. About half of the stratospheric ozone column lies below this altitude and must be considered before drawing any conclusions. We consider both these issues in the sections below.
To extrapolate our NO/flare response, we first seek to compare our results with observations of the NO response to solar flares. The only quantitative data analysis of the response of nitric oxide to a solar flare that we are aware of is that by Rodgers et al. (2010) using data from the Student Nitric Oxide Explorer (SNOE). SNOE was particularly well suited to study the NO response to a solar flare because it was in a Sun-synchronous orbit with an Equator crossing time in the late morning when the Sun was relatively high in the sky. Rodgers et al. calculated the NO column change observed by SNOE and plotted it versus the integrated soft X-ray input energy derived from a catalog of 11 flares.
Figure 8 compares the TIME-GCM results to Rodgers. The figure shows the integrated energy from the four strongest X-class flares observed by SNOE, with the largest being the so-called Halloween event of 28 October 2003. As noted above, this event, labeled as X18 in Rodgers et al.'s Table 3, is now recalibrated to be X25, and in our simulation with NRLFLARE it is a bit higher at X27. Also shown is the TIME-GCM-calculated hourly column NO from the local equatorial sub-solar longitude for each of the first 24 h of our model simulations for the X13 and X27 events.
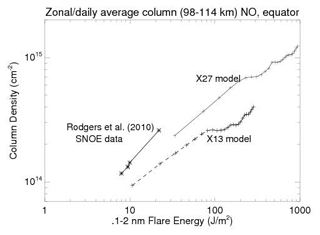
Figure 8Calculated TIME-GCM NO column density enhancement from the X13 and X27 simulations compared with the observed NO increases reported by Rodgers et al. (2010) for the four strongest flares listed in their Table 3. The plus symbols on the model curves represent output for every hour. The first points shown for each of the models account for the number of minutes after each integral hour that the flare peaked. Thus, the X13 flare peak was at 16:06 UT (see Table 1 of Siskind et al., 2022), and thus the first point shown for the X13 model represents 54 min of photon flux. Like Rodgers et al. (2010), we subtracted the pre-flare NO column in the model before calculating the enhancements shown.
In general, the figure shows a quasi-linear relationship between column NO and the integrated energy for both SNOE and the two model simulations. It appears that the rate of energy input is important for the NO increase. Thus, after 2 h of modeling, the X13 simulation accrues the same energy input as the 27 min long 28 October 2003 flare, and yet the NO column response is well below the observations. The column NO for the X13 simulation takes over 4 times the energy input of the observed flare to reach the same enhancement as observed by SNOE. The column NO for our X27 simulation, which is designed to simulate the 28 October 2003 flare, comes closer and matches the SNOE data just after the first hour of the model simulation (actually 51 min since the flare peak was at 9 min past 11:00 UT and model output was only saved hourly). However, since the actual 28 October flare only lasted 27 min, it means that the TIME-GCM is calculating a smaller NO column for the same energy input than was recorded by SNOE. Rodgers et al. (2010) reported an observed column enhancement of 2.6×1014 cm−2 for solar X-ray input of 22.4 J m−2, where, reading from the graph, the TIME-GCM requires closer to 40 J m−2 before reaching this level of NO enhancement.
After 24 h, Fig. 8 shows that the X27 simulation produces about a factor of 3 more NO than the X13 simulation. Figure 9 shows the daily averaged, zonal mean column NO for both models extended out to the full 8 d of the X27 simulation before the model crashed. Similar to Fig. 3, it shows that both models level out after several days. The ratio of the two column densities equilibrates to a slightly smaller value than seen in Fig. 8, about a factor of 2.6. The fact that the column densities level out can offer useful guidance for extrapolating our middle atmosphere NOx enhancements even without completing a full year with the X27 simulation. It suggests that reasonable enhancements might lie in the range of a factor of 2–3 over the X13 simulation. In terms of gigamoles (GM) as presented in Fig. 4, it may suggest a net delivery to the stratosphere of 20–26 GM for the X27 case. We will consider the consequences of this below.
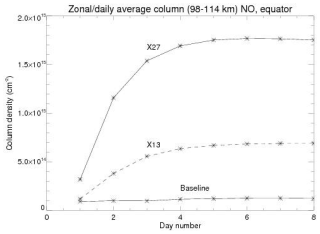
Figure 9Daily and zonally averaged equatorial column densities for the X27 (solid line with stars) and X13 (dashed line with stars) TIME-GCM simulations. A baseline case run for the conditions of September 2017, but with no flare–supernova and which remains at approximately 1 × 1014 cm−2, is also shown.
To evaluate in detail how ozone may be reduced for the X27 simulation, we will use the CHEM1D photochemical box model. This model has previously been used to model satellite observations of mesospheric OH (Siskind et al., 2013) and validate ground-based measurements of ClO (Nedoluha et al., 2020). It is important to first evaluate the model's ability to calculate stratospheric ozone since, as most recently discussed by Diouf et al. (2024), chemical models of upper-stratospheric and lower-mesospheric ozone historically fall short of fully reproducing observations.
Figure 10 shows a comparison of CHEM1D and TIME-GCM ozone with two observations from 2 September (day of year 245) 2018 at a latitude of 38–40° S. This period and location were selected because they correspond to the time and location of the most significant upper-stratospheric ozone depletions indicated by the TIME-GCM in Fig. 6. The observations are from the 9.6 µm measurement of the Sounding of the Atmosphere with Broadband Emission Radiometry (SABER) instrument on board the NASA TIMED satellite and the Microwave Limb Sounder (MLS) from the NASA Aura satellite. SABER and MLS data have long been the standards for measuring middle-atmospheric ozone globally. Figure 10 shows that TIME-GCM is ill suited for model–data comparisons of stratospheric ozone. This is perhaps not a surprise – the model was designed to study middle-atmospheric dynamics and transport and its coupling to the upper atmosphere (Roble and Ridley, 1994). For example, TIME-GCM does not include all the active chlorine and nitrogen species that are required for a comprehensive model of stratospheric ozone. Thus, for chlorine, TIME-GCM has Cl and ClO, but not HOCl. For nitrogen, TIME-GCM only has NO and NO2, but not HNO3 or N2O5. By contrast, CHEM1D does include these species. The comparison with CHEM1D very closely matches that seen by Siskind et al. (2013), who used CHEM1D for mesospheric ozone and hydroxyl, and Diouf et al. (2024), who used the model of Bertaux et al. (2020) and compared with MLS ozone and SABER O2(1Δ) 1.27 µm emission. In all cases, the model falls short of completely reproducing the observations. Both Siskind et al. (2013) and Diouf et al. (2024), having exhausted all possibilities for reaction rate changes and possible temperature inputs, invoked the possibility of an additional source of ozone from vibrationally excited oxygen as hypothesized by Slanger et al. (1988) and Price et al. (1993). The purpose here is not to answer this long-standing question; rather, Fig. 10 shows that CHEM1D does as well as could be expected given our understanding of middle-atmospheric ozone photochemistry. Our purpose here is to perform sensitivity studies for varying amounts of NOx, guided by our TIME-GCM simulations. Figure 10 shows that CHEM1D is adequate for this task. We should additionally note that as one moves towards higher pressures greater than 5 hPa, the chemical lifetime of ozone becomes longer such that it is no longer under pure chemical control but also dynamical influences. Thus, the apparent improved agreement with the observations near 10 hPa should not be over-interpreted.
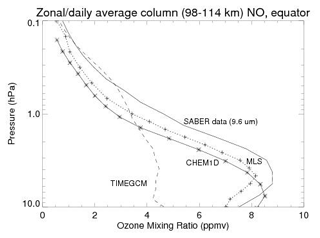
Figure 10Comparison of the TIME-GCM (long dashes) and CHEM1D (solid line with stars) models with SABER (solid line) and MLS (dotted line with plus symbols) observations of ozone. The location is 38–40° S and the time of year is 2 September 2018. CHEM1D used temperature, pressure, and NOx abundances from the TIME-GCM as input. The approximate altitude range corresponding to the y axis is about 30–62 km.
We now show the fractional ozone depletions as a function of pressure from the enhanced NOx due to a multi-month solar flare. Figure 11 presents the calculated ozone loss ratios (panel a) for two models of CHEM1D that use enhanced NOx compared with the baseline simulation presented in Fig. 10. The location and time of year are the same as in Fig. 10. The NOx enhancements (panel b) are taken from the X13 simulation shown in the previous figures plus an extrapolated enhancement (the greater of the curves in Fig. 10) based upon the short-term response shown in Fig. 9. Figure 11 also shows the vertical profile of the TIME-GCM ozone change taken from Fig. 7.
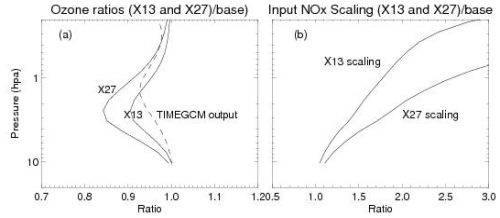
Figure 11(a) Ratios of calculated ozone from CHEM1D compared with a baseline (no flare) case for September 2 at a latitude of 39° S. The two solid lines use NOx input according to the scaling ratios shown in panel (b). The X13 scaling is based upon the NOx shown in Figs. 3–5. The X27 scaling is a hypothesized extrapolation based upon Fig. 8 and discussed in the text. Also shown as the dashed line in panel (a) is the ozone ratio from the TIME-GCM as per the surface contour plots shown in Fig. 6.
Figure 11 shows that for the X13 case, we could expect ozone depletions of up to 8 % in the upper stratosphere. For the more significant X27 case (i.e., for a more intense supernova X-ray event), we might see ozone reductions of up to 15 %–18 % in the upper stratosphere. Figure 11 also shows the vertical profile of the TIME-GCM ozone reduction. It does not exactly match the profiles from CHEM1D in terms of the shape and altitude of peak reduction, but it is very close to the X13 CHEM1D simulation in terms of giving a peak loss of 6 %–7 % in the upper stratosphere. The TIME-GCM result is useful because it allows our detailed CHEM1D calculations to be placed in the global context shown in Fig. 7.
Based upon Figs. 11 and 7, we can conclude that a supernova soft X-ray event could cause widespread ozone loss in the 10 %–20 % range in the upper stratosphere for late winter–early spring in the Southern Hemisphere. While this would likely be easily observable with suitable instrumentation, it is less likely to have a dramatic biospheric effect. This is because most of the stratospheric ozone is found at altitudes from 20–35 km (5–50 hPa pressure levels). The losses shown in Fig. 11 are only the upper edge of that layer. This is shown in Fig. 12, which shows the actual ozone mixing ratios (panel a) and ozone density profiles (panel b) that correspond to the scaling ratios shown in Fig. 10. In the case where the model output is shown as ozone densities, the curves are almost indistinguishable. The change in the total column ozone, which is most relevant for surface UV exposure, is 1 % for the X13 simulation and 2 % for the X27 extrapolation.
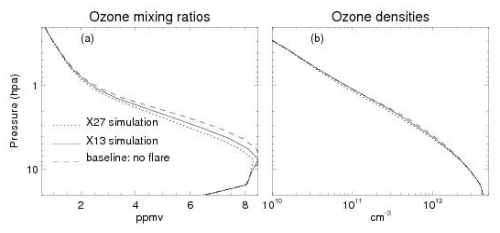
Figure 12Absolute ozone abundances corresponding to the ratios presented in Fig. 10. The three simulations are labeled in panel (a). They are identically shown in density units in panel (b) but are almost indistinguishable because the 8 %–15 % reductions are very hard to see on a graph that covers over 2 orders of magnitude.
Our results clearly suggest the strong possibility of globally widespread ozone loss in the upper stratosphere, at least for a period of a couple of months in the Southern Hemisphere. However, at the same time, we conclude that this is unlikely to have a global biospheric impact because the depletion is limited to the upper edges of the ozone layer. This limitation is derived from our simulations showing that, like the EPP-IE, the Xray-IE does not penetrate below 35–40 km on a global basis. At polar latitudes, our results allow us to speculate that a supernova could greatly exacerbate the ozone hole or even, for atmospheres without anthropogenic chlorine, create an ozone hole. Indeed, it has already been noted that the EPP-IE has been confused with an expansion of the ozone hole due to volcanic aerosols (see Siskind et al., 2000, and discussion therein). However, since the hole is generally confined to the polar vortex, the effects of the Antarctic ozone hole have not caused widespread global ecological destruction although regional effects may be occurring (Robinson et al., 2024). There are likely other more subtle hypothesized effects of the enhanced NOx that we do not address. For example, we do see moderate NOx enhancements throughout the Northern Hemisphere, and it has been suggested that EPP-IE in the Northern Hemisphere has effects on stratospheric and possibly tropospheric meteorology (Seppala et al., 2009). Our work here cannot rule this out for the Xray-IE.
Certainly, our results come with large uncertainties that would be useful to address. Perhaps the biggest is that the TIME-GCM, with a bottom boundary above the peak of the ozone layer, is not designed to study stratospheric chemistry. Moreover, the 30 km bottom boundary prevents us from studying the descent of NOx-enriched air down to the lower altitudes where the EPP-IE has been observed in the SH polar vortex (Randall et al., 2007). Thus, our comments about the ozone hole are necessarily speculative. In addition, our simulation of the NO produced during solar flares appears to be less than observed by SNOE. This might mean that the NO response to a flare would be greater than we suggest, perhaps by as much as a factor of 2. Here it would be very helpful if there were another dataset that could corroborate the NO response reported by Rodgers et al. (2010). As we noted above, the local time of the Sun-synchronous SNOE orbit was ideal for observing solar flares. By contrast, more recent NO observations, which are summarized in Table 1 and Fig. 3 of Emmert et al. (2022), are less well suited. Emmert et al. (2022) show that, for example, the Atmospheric Chemistry Experiment (ACE) and the Solar Occultation for Ice Experiment (SOFIE) on the NASA AIM satellite used the technique of solar occultation, which by definition means sunrise or sunset. This type of observation is not well suited to observing the effect from a flare that would be less noticeable at local sunset or sunrise. Likewise, the ODIN satellite, which measured NO with a sub-millimeter radiometer (SMR), was in a dawn–dusk synchronous orbit. Based upon Emmert et al. (2022) it appears that only MIPAS on the ENVISAT satellite was in a proper daytime orbit to see flares. An examination of the MIPAS data might be an interesting test of some of our SNOE-based results.
Ultimately, however, even if we did underestimate the NO production by a factor of 2 or even 3, the effects on the ozone column are likely not catastrophic because they will be limited to above 35–40 km. We point to the simulations of Thomas et al. (2007) of a possible solar proton event that may have accompanied the 1859 Carrington flare event. Solar protons penetrate much deeper into the stratosphere than soft X-rays, and thus the effect on NOx is more direct rather than indirect as simulated here. Indeed, they obtained much larger NOx increases down to 30 km and localized ozone losses near 35–40 km of greater than 30 %. Despite this greater increase in NOx and greater ozone loss, their calculated perturbation to the ozone column was less than 15 % because the bulk of the ozone density between 20–30 km remained unaffected by the proton flux. More recently, Reddmann et al. (2023) performed a similar simulation of an extreme solar proton event combined with an extreme geomagnetic storm. They show dramatically enhanced ionization in the high-latitude regions for all altitudes above 30 km. Their extrapolated NOx production is approximately 25–30 GM, roughly equivalent to our extrapolation for our X27 case, but now occurring directly at higher latitudes where transport to the lower stratosphere might be hypothesized as more efficient. However, like our results, they find the overall impact of any resulting ozone reduction on UV flux to the surface to be limited to less than 5 %. The Reddmann simulation is important because it might be relevant to the question of whether a supernova occurring out of the ecliptic plane and focused more on the higher latitudes where transport is more efficient could have a greater impact. Extrapolating from Reddmann et al. (2023) we argue that having greater ionization at higher latitudes above 30 km is still inefficient for destroying global ozone, which is concentrated at lower latitudes and at altitudes below 30 km.
By contrast, other phenomena linked to supernovae, such as gamma rays and cosmic rays, are known to be absorbed by the atmosphere near the peak of the ozone layer in the 20–30 km altitude range (Melott et al., 2017) and at lower latitudes. Therefore, in our assessment, those are likelier candidates for causing global ozone destruction that would greatly enhance the flux of destructive UV radiation to the surface. However, we should conclude by noting that even in those cases, the destructiveness of both the gamma-ray and cosmic-ray mechanisms has also been recently called into question (Christoudias et al., 2024). Our calculations here are therefore consistent with Christoudias et al. (2024) in showing how the Earth's atmosphere can shield its biosphere.
The TIME-GCM code is available by contacting the National Center for Atmospheric Research. The model output produced herein is reproducible from the TIME-GCM source code following the discussions and implementations of the nudging schemes and lower boundary conditions described thoroughly in Sect. 2.4 and in Jones et al. (2018, 2020). Daily NCAR TGCM outputs in NetCDF format from this study are archived on the DoD HPCMP long-term storage system. MERRA-2 middle-atmospheric horizontal winds and temperatures used for constraining TIME-GCM dynamics are available at https://disc.gsfc.nasa.gov/datasets?project=MERRA-2 (Gelaro et al., 2017). The SABER and MLS data used in Fig. 9 were respectively obtained from http://saber.gats-inc.com/index.php (Esplin et al., 2023) and https://mls.jpl.nasa.gov/eos-aura-mls/data.php (Livesey et al., 2022). CHEM1D output and specific supernova output from TIME-GCM are both available in separately labeled folders at https://map.nrl.navy.mil/map/pub/nrl/ (Siskind et al., 2013). The /chem1d folder contains the source code of the model and there are text files for running the supernova simulations. The /timegcm_supernova folder contains Python-compatible IDL save files of both TIME-GCM output and the NRLFLARE simulations along with text files describing them (Roble and Ridley, 1994).
DES conceived the study, performed the analysis of the TIME-GCM output, conducted the CHEM1D analysis, and led the writing. MJ configured the TIME-GCM (both to be nudged by MERRA and to input the NRLFLARE spectra), performed the simulations, and wrote Sect. 2.2. JWR is the developer of NRLFLARE; he provided the soft X-ray spectra used by the TIME-GCM and wrote Sect. 2.1.
The contact author has declared that none of the authors has any competing interests.
Publisher's note: Copernicus Publications remains neutral with regard to jurisdictional claims made in the text, published maps, institutional affiliations, or any other geographical representation in this paper. While Copernicus Publications makes every effort to include appropriate place names, the final responsibility lies with the authors.
This work was supported by the Office of Naval Research. We also acknowledge the NASA Living with a Star program for supporting the development of NRLFLARE and the development of the supernova soft X-ray spectra. Computational resources for this work were provided by the US Department of Defense (DoD) High-Performance Computing Modernization Program (HPCMP).
This research has been supported by the Office of Naval Research (6.1 funding).
This paper was edited by Gunter Stober and reviewed by Dimitry Pokhotelov and one anonymous referee.
Airapetian, V. S., Barnes, R., Cohen, O,. Collinson, G. A., Danchi, W. C., Dong, C. F., Del Genio, A. SD. France, K., Garcia-Sage, K., Glocer, A., Gopalswamy, N., Grenfell., J. L., Gronoff, G., Gudel., M, Herbst, K., Henning, W. G., Jackman, C. H., Jin, M., Johnstone, C. P., Kaltenegger, L., Kay, C. D., Kobayashi, K., Kuang, W., Li, G,. Lynch, B. J., Luftinger, T., Luhmann, J. G., Maehara, H., Mlynczak, M. G., Notsu, Y., Osten, R. A., Ramirez, R. M., Rugheimer, S., Scheucher, M., Schlieder, J. E., Shibata, K., Sousa-Silva, C., Stamenkovic, V., Strangeway, R. J., Usmanov, A. V., Vergados, P., Verkhoglyadova, O. P., Vidotto, A. A., Voytek, M., Way, M. J., Zank, G. P., and Yamashiki, Y., Impact of space weather on climate and habitability of terrestrial-type exoplanets, Int. J. Astrobiol., 19, 136–194, https://doi.org/10.1017/S1473550419000132, 2020.
Arnone, E. and Hauchecorne, A.: Stratospheric NOy species measured by MIPAS and GOMOS Onboard ENVISAT 2002–2010: Influence of plasma processes onto the observed distribution and variability, Space Sci Rev., 168, 315–332, https://doi.org/10.1007/s11214-011-9861-1, 2011.
Bertaux, J.-L., Hauchecorne, A., Lefèvre, F., Bréon, F.-M., Blanot, L., Jouglet, D., Lafrique, P., and Akaev, P.: The use of the 1.27 µm O2 absorption band for greenhouse gas monitoring from space and application to MicroCarb, Atmos. Meas. Tech., 13, 3329–3374, https://doi.org/10.5194/amt-13-3329-2020, 2020.
Bradshaw, S. J. and Cargill, P. J.: The Influence of Numerical Resolution on Coronal Density in Hydrodynamic Models of Impulsive Heating, Astrophys. J., 770, 12, https://doi.org/10.1088/0004-637X/770/1/12, 2013.
Brasseur, G. and Solomon, S.: Aeronomy of the Middle Atmosphere, D. Reidel Publishing Co., ISBN 9781402032844, 2005.
Brunton, I. R., O'Mahoney, C., Fields, B. D., Melott, A. L., and Thomas, B. C., X-Ray-luminous Supernovae: Threats to terrestrial biospheres, Astrophys. J., 947, 42, https://doi.org/10.3847/1538-4357/acc728, 2023.
Christoudias, T., Kirkby, J., Stolzenburg, D., Pozzer, A., Sommer, E., Brassuer, G. P., Kulmala, M., and Lelieveld, J.: Earth's atmosphere protects the biosphere from nearby supernovae, Nature Communications: Earth and Environment, 5, 326, https://doi.org/10.1038/s43247-024-01490-9, 2024.
Cliver, E. W., Schrijver, C. J., Shibata, K., and Usoskin, I. G.: “Extreme solar events”, Living Reviews in Solar Physics, 19, 2, https://doi.org/10.1007/s41116-022-00033-8, 2022.
Diouf, M. M. N., Lefevre, F., Hauchecorne, A., and Bertaux, J. L.: Three-Dimensional Modeling of the O2(1Δ) Dayglow: Dependence on Ozone and Temperatures, J. Geophys. Res., 129, e2023JD040159, https://doi.org/10.1029/2023JD040159, 2024.
Eckermann, S. D., Ma, J., Hoppel, K.W., Kuhl, D. D., Allen, D. R., Doyle, J. A., Viner, K. A., Ruston, B. C., Baker, N. L., Swadley, S. D., Whitcomb, T. R., Reynolds, C. A., Xu, L., Kaifler, N., Reid, I. M., Murphy, D. J., and Love, P. T., High-altitude (0–100 km) global atmospheric reanalysis system: Description and application to the 2014 austral winter of the deep propagating gravity wave experiment (DEEPWAVE), Mon. Weather Rev., 146, 2639–2666, https://doi.org/10.1175/MWR-D-17-0386.1, 2018.
Ejzak, L. M., Melott, A. L., Medved, M. V., and Thomas B. C.: Terrestrial consequences of spectral and temporal variability in ionizing photon events, Astrophys. J., 64, 373, https://doi.org/10.1086/509106, 2007.
Emmert, J. T., Jones Jr., M., Siskind D. E., Drob D. P., Picone, J. M., Stevens M. H., Bailey S. M., Bender, S., Bernath, P. F., Funke, B., Hervig, M. E., and Perot, K.: NRLMSIS 2.1: An empirical model of NO incorporated into MSIS, J. Geophys. Res., 127, e2022JA030896, https://doi.org/10.1029/2022JA030896, 2022.
Esplin, R., Mlynczak, M. G., Russell, J., Gordley, L., and SABER Team: Sounding of the Atmosphere using Broadband Emission Radiometery (SABER): Instrument and Science Measurement Description, Earth Space Sci., 10, e2023EA002999, https://doi.org/10.1029/2023EA002999, 2023 (data available at: http://saber.gats-inc.com/index.php, last access: 20 March 2025).
Fletcher, L., Dennis, B. R., Hudson, H. S., Krucker, S., Phillips, K., Veronig, A., Battaglia, M., Bone, L., Caspi, A., Chen, Q., Gallagher, P., Grigis, P. T., Ji, H., Liu, W., Milligan, R. O., and Temmer, M.: An Observational Overview of Solar Flares”, Space Sci. Rev., 159, 19–106, https://doi.org/10.1007/s11214-010-9701-8, 2011.
Funke, B., Lopez-Puertas, M., Gil-Lopez, S., von Clarmann, T., Stiller, G. P., Fischer, H., and Kellman, S.: Downward transport of upper atmospheric NOx into the polar stratosphere and lower mesosphere during the Antarctic 2003 and Arctic 2002/2003 winters, J. Geophys Res., 110, D24308, https://doi.org/10.1029/2005JD006011, 2005.
Funke, B., Lopez-Puertas M., Stiller, G. P., and von Clarmann, T.: Mesospheric and stratospheric NOy produced by energetic particle precipitation during 2002–2012, J. Geophys. Res, 119, 4429, https://doi.org/10.1002/2013JD021404, 2014.
Funke, B., Ball, W., Bender, S., Gardini, A., Harvey, V. L., Lambert, A., López-Puertas, M., Marsh, D. R., Meraner, K., Nieder, H., Päivärinta, S.-M., Pérot, K., Randall, C. E., Reddmann, T., Rozanov, E., Schmidt, H., Seppälä, A., Sinnhuber, M., Sukhodolov, T., Stiller, G. P., Tsvetkova, N. D., Verronen, P. T., Versick, S., von Clarmann, T., Walker, K. A., and Yushkov, V.: HEPPA-II model–measurement intercomparison project: EPP indirect effects during the dynamically perturbed NH winter 2008–2009, Atmos. Chem. Phys., 17, 3573–3604, https://doi.org/10.5194/acp-17-3573-2017, 2017.
Garcia, H. A.: Temperature and Emission Measure from Goes Soft X-Ray Measurements, Sol. Phys., 154, 275–308, https://doi.org/10.1007/BF00681100, 1994.
Garcia-Sage, K., Farrish, A. O., and Airapetian, V. S.: Star-exoplanet interactions, A growing interdisciplinary field in heliophysics, Frontiers in Astronomy and Space Science, 10, https://doi.org/10.3389/fspas.2023.1064076, 2023.
Gehrels, N., Laird, C. M. Jackman, C. H., Cannizzo, J. K., Mattson, B., J., and Chen, W.: Ozone depletion from nearby supernovae, Astrophys. J., 585, 1169–1176, 2003.
Gelaro, R., McCarty, W., Suarez, M. J., Todling, R., Molod, A., Takacs, L., Randles, C. A., Darmenov, A., Bosilovich, M. G., Reichle, R., Wargan, K., Coy, L., Cullather, R., Draper, C., Akella, S., Buchard, V., Conaty, A., DaSilva, A.M., Gu, W., Kim, G-K., Koster, R., Lucchesi, R., Merkova, D., Nielsen, J. E., Partyka, G., Pawson, S., Putman, W., Rienecker, M., Schubert, S. D., Sienkiewicz, M., and Zhao, B.: The modern-era retrospective analysis for research and applications, version 2 (MERRA-2), J. Climate, 30, 5419–5454, https://doi.org/10.1175/JCLI-D-16-0758.1, 2017 (data available at: https://disc.gsfc.nasa.gov/datasets?project=MERRA-2, last access: 18 March 2025).
Jones Jr., M., Drob, D. P., Siskind, D. E., McCormack, J. P., Maute, A., McDonald, S. E., and Dymond, K. F.: Evaluating Different Techniques for Constraining Lower Atmospheric Variability in an Upper Atmosphere General Circulation Model: A Case Study During the 2010 Sudden Stratospheric Warming, J. Adv. Model. Earth Sy., 10, 3076–3102, https://doi.org/10.1029/2018MS001440, 2018.
Jones Jr., M., Siskind, D. E., Drob, D. P., McCormack, J. P., Emmert, J. T., Dhadly, M. S., Attard, H. E., Mlynczak, M. G., Brown, P. G., Stober, G., Kozlovsky, A., Lester, M., and Jacobi, C.: Coupling from the middle atmosphere to the exobase: Dynamical disturbance effects on light chemical species, J. Geophys. Res.-Space, 125, e2020JA028331, https://doi.org/10.1029/2020JA028331, 2020.
Jones Jr., M., Goncharenko, L. P., McDonald, S. E., Zawdie, K. A., Tate, J., Gasperini, F., Pedatella, N. M., Drob, D. P., and McCormack, J. P.: Understanding nighttime ionospheric depletions associated with sudden stratospheric warmings in the American sector, J. Geophys. Res.-Space, 128, e2022JA031236, https://doi.org/10.1029/2022JA031236, 2023.
Kahler, S. W. and Ling, A. G.: Solar Stellar Connection: X-ray flares to energetic (>10 MeV) particle events, Astrophys. J., 956, 24, https://doi.org/10.3847/1538-4357/acf1ff, 2023.
Livesey, N. J., Read, W. G., Wagner, P. A., Froidevaux, L., Santee, M. L., Schwartz, M. J., Lambert, A., Millan Valle, L. F., Pumphrey, H. C., Manney, G. L., Ruller, R. A., Janrnot, R. F. Knosp, B. W., and Lay, R. R.: EOS MLS Version 5.0x Level 2 and 3 data quality and description document, Jet Propulsion Laboratory D‐105336 Rev. B. [data set], https://mls.jpl.nasa.gov/eos-aura-mls/data.php (last access: 20 March 2025), 2022.
McCormack, J., Hoppel, K., Kuhl, D., deWit, R., Stober, G., Espy, P., Baker, N., Brown, P., Fritts, D., Jacobi, C., Janches, D., Mitchell, N., Ruston, B., Swadley, S., Viner, K., Whitcomb, T., and Hibbins, R.: Comparison of mesospheric winds from a high-altitude meteorological analysis system and meteor radar observations during the boreal winters of 2009–2010 and 2012–2013, J. Atmos. Sol.-Terr. Phy., 154, 132–166, https://doi.org/10.1016/j.jastp.2016.12.007, 2017.
Melott, A. L., Thomas, B. C., Kahcelriess, M., Semikoz, D. V., and Overholt A. C.: A supernova at 50 pc: Effects on the Earth's atmosphere and biota, Astrophys. J., 840, 105, https://doi.org/10.3847/1538-4357/aa6c57, 2017
Nedoluha, G. N., Gomez, R. N, Boyd, I., Neal H., Parrish A., Connor B., Mooney T., Siskind, D. E., Sagawa, H., and Santee, M.: Initial Results and Diurnal Variations Measured by a New Microwave Stratospheric ClO Instrument at Mauna Kea, J. Geophys. Res., 125, e2020JD033097, https://doi.org/10.1029/2020JD033097, 2020.
Neupert, W. M., Gates, W., Swartz, M., and Young, R.: Observation of the solar flare X-ray emission line spectrum of iron from 1.3 to 20 Å, Astrophys. J., 149, L79–L83, https://doi.org/10.1086/180061, 1967.
Pettit, J. M., Randall, C. E., Peck, E. D., and Harvey, V. L.: A new MEPED-based precipitating electron data set, J. Geophys. Res., 126, e2021JA029667, https://doi.org/10.1029/2021JA029667, 2021.
Price, J. M., Mack, J. A., Rogaski, C. A., and Wodtke, A. M.: Vibrational-state-specific self-relaxation rate constant. Measurements of highly vibrationally excited O2 (v=19–28), Chem. Phys., 175, 83–98, https://doi.org/10.1016/0301-0104(93)80230-7, 1993.
Qian, L., Wang, W., Burns, A. G., Chamberlin, P., Coster, A., Zhang, S.-R., and Solomon, S.: Solar Flare and Geomagnetic Storm Effects on the Thermosphere and Ionosphere During 6–11 September 2017, J. Geophys. Res., 124, 1298, https://doi.org/10.1029/2018JA026175, 2019.
Randall, C. E., Harvey, V. L., Singleton, C. S. Bernath, P., Boone, C. D., and Kozyra, J. U.: Enhanced NOx in 2006 linked to strong upper stratospheric Arctic vortex, Geophys. Res. Lett., 33, L18811, https://doi.org/10.1029/2006GL027160, 2006.
Randall, C. E., Harvey, V. L., Singleton, C. S., Bailey, S. M., Bernath, P. F., Codrescu, M., Nakajima, H., and Russell III, J. M.: Energetic particle precipitation effects on the Southern Hemisphere stratosphere in 1992–2005, J. Geophys. Res., 112, D08308, https://doi.org/10.1029/2006JD007696, 2007.
Reddmann, T., Sinnhuber, M., Wissing, J. M., Yakovchuk, O., and Usoskin, I.: The impact of an extreme solar event on the middle atmosphere: a case study, Atmos. Chem. Phys., 23, 6989–7000, https://doi.org/10.5194/acp-23-6989-2023, 2023.
Redmon, R. J., Seaton, D. B., Steenburgh, J. R., He, J., and Rodriguez, J. V.: September 2017's geoeffective space weather and impacts on Caribbean radio communications during hurricane response, Space Weather, 16, 1190–1201, https://doi.org/10.1029/2018SW001897, 2018.
Reep, J. W. and Airapetian, V.: Understanding the duration of solar and stellar flares at various wavelengths, Astrophys. J., 958, 9, https://doi.org/10.3847/1538-4357/acf45a, 2023.
Reep, J. W., Bradshaw, S. J., Crump, N. A., and Warren, H. P.: Efficient Calculation of Non-local Thermodynamic Equilibrium Effects in Multithreaded Hydrodynamic Simulations of Solar Flares, Astrophys. J., 871, 18, https://doi.org/10.3847/1538-4357/aaf580, 2019.
Reep, J. W., Warren, H. P., Moore, C. S., Suarez, C., and Hayes, L. A.: Simulating Solar Flare Irradiance with Multithreaded Models of Flare Arcades, Astrophys. J., 895, 30, https://doi.org/10.3847/1538-4357/ab89a0, 2020.
Reep, J. W., Siskind, D. E., and Warren, H. P.: Solar Flare Irradiance: Observations and Physical Modeling, Astrophys. J., 927, 103, https://doi.org/10.3847/1538-4357/ac4784, 2022.
Robinson, S. A., Revell, L. E., Mackenzie, R., and Ossala, R.: Extended ozone depletion and reduced snow and ice cover- Consequences for Antarctic biota, Glob. Change Biol., 30, e17283, https://doi.org/10.1111/gcb.17283, 2024.
Roble, R. G. and Ridley, E. C.: A thermosphere-ionosphere-mesosphere-electrodynamics-General Circulation Model (TIME-GCM): Equinox solar cycle minimum simulations (30–500 km), Geophys. Res. Lett., 21, 417–420, 1994.
Rodgers, E. M., Bailey, S. M., Warren, H. P., Woods, T. N., and Eparvier, F. G.: Nitric oxide density enhancements due to solar flares, Adv. Space Res., 45, 28–38, 2010.
Seppala, A., Randall, C. E., Clilverd, M. A., Rozanov, E., and Rodger, C. J.: Geomagnetic activity and polar surface air temperature variability, J. Geophys. Res., 114, A10312, https://doi.org/10.1029/2008JA014029, 2009.
Siskind, D. E., Bacmeister, J. T., Summers M. E., and Russell III, J. M.: Two-dimensional model calculations of nitric oxide transport in the middle atmosphere and comparison with Halogen Occultation Experiment data, J. Geophys. Res., 102, 3527–3545, 1997.
Siskind, D. E., Nedoluha, G. N, Randall, C. E., Fromm, M., and Russell III, J. M.: An assessment of Southern Hemisphere stratospheric NOx enhancements due to transport from the upper atmosphere, Geophys. Res. Lett., 27, 329–332, 2000.
Siskind, D. E., Stevens, M. H., Englert, C. R., and Mlynczak M. G.: Comparison of a photochemical model with observations of mesospheric hydroxyl and ozone, J. Geophys. Res., 118, 195–207, https://doi.org/10.1029/2012JD017971, 2013 (data available at: https://map.nrl.navy.mil/map/pub/nrl/, last access: 18 March 2025).
Siskind, D. E., Jones Jr., M., Reep, J. W., Drob, D. P., Samaddar, S., Bailey, S. M., and Zhang, S.-R.: Tests of a new solar flare model against D and E region ionospheric data, Space Weather, 20, e2021SW003012, https://doi.org/10.1029/2021SW003012, 2022.
Slanger, T. G., Jusinski, L. E., Black, G., and Gadd, G. E.: A new laboratory source of ozone and its potential atmospheric implications, Science, 241, 945, https://doi.org/10.1126/science.241.4868.945, 1988.
Solomon, S. C. and Qian L.: Solar extreme-ultraviolet irradiance for general circulation models, J. Geophys. Res., 110, A10306, https://doi.org/10.1029/2005JA011160, 2005.
Solomon, S., Roble, R. G., and Crutzen, P. J.: Photochemical Coupling Between the Thermosphere and the Lower Atmosphere, 1. Odd nitrogen from 50 to 120 km, J. Geophys. Res., 87, 7206–7220, 1982.
Stauffer, D. R. and Seaman, N. L.: Use of four-dimensional data assimilation in a limited-area mesoscale model. Part I: Experiments with synoptic-scale data, Mon. Weather Rev., 118, 1250–1277, https://doi.org/10.1175/1520-0493(1990)118<1250:UOFDDA>2.0.CO;2, 1990.
Stauffer, D. R. and Seaman, N. L.: Multiscale four-dimensional data assimilation, J. Appl. Meteorol., 33, 416–434, https://doi.org/10.1175/1520-0450(1994)033<0416:MFDDA>2.0.CO;2, 1994.
Thomas, B. C., Jackman, C. H., and Melott, A. L.: Modeling atmospheric effects of the September 1859 solar flare, Geophys. Res. Lett., 34, L06810, https://doi.org/10.1029/2006GL029174, 2007.
Vink, J.: Supernova remnants: the X-ray perspective, Astron. Astrophys. Rev., 20, 49, https://doi.org/10.1007/s00159-011-0049-1, 2012.
Vitt, F. M. and Jackman, C. H.: A comparison of sources of odd nitrogen production from 1974 through 1993 in the Earth's middle atmosphere as calculated using a two-dimensional model, J. Geophys. Res., 101, 6729, https://doi.org/10.1029/95JD03386, 1996.
Zhang, X., Forbes, J. M., and Hagan, M. E.: Longitudinal variation of tides in the MLT region: 1. Tides driven by tropospheric net radiative heating, J. Geophys. Res., 115, A06316, https://doi.org/10.1029/2009JA014897, 2010a.
Zhang, X., Forbes, J. M., and Hagan, M. E.: Longitudinal variation of tides in the MLT region: 2. Relative effects of solar radiative and latent heating, J. Geophys. Res., 115, A06317, https://doi.org/10.1029/2009JA014898, 2010b.
- Abstract
- Introduction
- Solar flare and thermospheric NO modeling
- Seasonal variation of the Xray-IE in the middle atmosphere
- Extrapolation to higher X-ray fluxes and impact on stratospheric ozone
- Discussion and conclusions
- Code and data availability
- Author contributions
- Competing interests
- Disclaimer
- Acknowledgements
- Financial support
- Review statement
- References


