the Creative Commons Attribution 4.0 License.
the Creative Commons Attribution 4.0 License.
 | 06 Mar 2025
Comparison of meteor radar and satellite winds in the Brazilian equatorial region
Delis Otildes Rodrigues
Igo Paulino
Lourivaldo Mota Lima
Ricardo Arlen Buriti
Paulo Prado Batista
Aaron Ridley
Using data collected from a meteor radar deployed at São João do Cariri (7.4° S, 36.5° W) and from the TIMED Doppler Interferometer (TIDI) on board the Thermosphere-Ionosphere-Mesosphere Energetics and Dynamics (TIMED) satellite for 2006, comparisons of horizontal winds (meridional and zonal components) were made in order to evaluate the above-mentioned techniques for scientific investigations and to point out the advantages of each instrument. A grid of ± 5° latitude and longitude centered at São João do Cariri was used to calculate the mean winds from the TIDI, which has a resolution of 2.5 km, starting from 82.5 km and going up to 102.5 km altitude. Otherwise, the meteor radar winds were computed for seven layers of 4 km, each overlapping 0.5 km above and below, which produces layers spaced 3 km apart from 81 to 99 km altitude. When almost simultaneous measurements were compared, substantial discrepancies were observed in the vertical wind profiles. This happened because the meteor radar uses a 1 h bin size to estimate the wind from the echoes detected in the whole sky. On the other hand, the TIDI measures quasi-instantaneous winds from the airglow emissions of a small region. In contrast, when the longer period of observation was taken into account, the temporal meteor radar wind variations throughout the day, averaged over all months, were smoothed and showed more clearly the characteristics of the propagation of tides. The responses of the horizontal wind to the intraseasonal, semi-annual and annual oscillations were satisfactory for both techniques.
- Article
(2347 KB) - Full-text XML
- BibTeX
- EndNote


The mesosphere and lower thermosphere (MLT) are rich in dynamical processes. A large spectrum of mechanical oscillations can be observed in this region; this includes gravity waves, atmospheric tides, planetary waves, seasonal oscillations, quasi-biennial oscillations and so on. These phenomena are important to understand the general circulation of the atmosphere because the propagation of the waves can transfer energy and momentum across different levels (Smith, 2012).
Wind measurements in the MLT are important to investigate the interaction between the background atmosphere and waves (e.g., Hindley et al., 2022). The main instruments that have been used to estimate the wind in this region are meteor radar (e.g., Jones et al., 1998; Buriti et al., 2008); mesosphere–stratosphere–troposphere radar (e.g., Balsley et al., 1980; Qiao et al., 2020); middle- and upper-atmosphere radar (e.g., Fukao et al., 1985); laser imaging, detection, and ranging (lidar) (e.g., Clemesha et al., 1981); medium-frequency radar (e.g., Igarashi et al., 1996); and Fabry–Pérot interferometers (e.g., Fujii et al., 2004). In the last few decades, satellite measurements of the wind have contributed to the knowledge of global responses of planetary, tidal and gravity waves, amongst others (e.g., Killeen et al., 2006; Niciejewski et al., 2006).
The meteor radar is a relatively moderate-cost instrument used in the studies of MLT dynamics. Generally, the meteor radar can estimate hourly horizontal wind from 80 to 100 km altitude (e.g., Hocking and Thayaparan, 1997; Paulino et al., 2015). This time sample is very good to investigate long-period oscillations like tidal and longer-period waves (e.g., Lima et al., 2006). Nevertheless, these kinds of measurements have also been used to investigate the background atmospheric conditions for the propagation of short-period gravity waves (e.g., Fechine et al., 2009; Bageston et al., 2011; Carvalho et al., 2017, and references therein).
On the other hand, satellites can measure quasi-instantaneous winds by means of a necessary integration of about 2 min. The TIMED Doppler Interferometer instrument (TIDI) on board the Thermosphere-Ionosphere-Mesosphere Energetic Dynamics (TIMED) satellite can provide measurements of horizontal winds at a 2.5 km vertical resolution from 82.5 km up to 102.5 km (Killeen et al., 2006; Niciejewski et al., 2006). The high-resolution sample of the TIDI measurements is useful in investigating short-period gravity waves (e.g., Baumgarten et al., 2018).
In the attempt to better understand the potential of satellite wind measurements, some questions appear: (i) how do TIDI winds compare with meteor radar measurements? (ii) What are the advantages and disadvantages of each technique? Some works have been published elsewhere trying to answer such questions (e.g, Xu et al., 2009; John et al., 2011; Su et al., 2014). The present work aims to advance this topic by comparing measurements of a meteor radar deployed at São João do Cariri (7.4° S, 36.5° W) to the TIDI measurements for a grid of 5°×5° (latitude × longitude) centered at São João do Cariri for the year 2006. The salient aspects of instantaneous and long-period observations will be presented and discussed.
The meteor radar is an instrument consisting of an interferometric receiver set of Yagi antennas with two elements, a transmitter Yagi antenna with three elements, and a receiver and a transmitter modulus. It operates at 35.24 MHz, emitting 2144 pulses per second. The meteor radar uses the ablation of the meteoroids that penetrate into the MLT region. The ionized trails serve to reflect the transmitted radio waves back to the ground as meteor echoes. Operating with a low power of 12 kW, the meteor radar can detect between 1000 and 3000 echoes per day (e.g., Hocking et al., 2001). Depending on the position of the Earth in its orbit, the planet comes in contact with more or fewer particles, which introduces large variability in the detected echoes. During the day, there is a strong variability as well; the radar detects more meteors in the early morning than in the evening, which is explained by the motion in the orbit. For meteor radars deployed in middle and high latitudes, there is also a strong seasonal variation in the detection of echoes.
The traveling time of the radio waves as they travel from the transmitter antenna, reflect in the trail and come back to the receiver antennas allows us to calculate the distance of the detected meteor. The set of receiver antennas in an asymmetric cross configuration is used to estimate the location of the meteor in the sky. Lastly, the Doppler shift of the signal gives information on the wind that is pushing the meteor trails (e.g., Hocking, 2005).
Using the parameters described above, the next step is to estimate the mean wind components. It is necessary to define vertical and temporal bin sizes to estimate the northward and eastward winds. In the present work, seven layers of 4 km thickness, overlapping 0.5 km above and below, were used in the vertical profiles, with a temporal resolution of 1 h (Clemesha et al., 2001; Paulino et al., 2012).
Basically, the TIMED Doppler Interferometer (TIDI) is a Fabry–Pérot interferometer on board the Thermosphere-Ionosphere-Mesosphere Energetics and Dynamics (TIMED) satellite. The TIDI is equipped with a charged coupled device (CCD) and has four identical telescopes besides the modulus of control and operation (Killeen et al., 2006).
The TIDI was designed to measure wind and temperature in the MLT region from 70 to 120 km altitude using the airglow emissions as tracers. The interferometer measures the radiation from the OI5577 and from the rotational line of O2(0,0) airglow emissions. It has a vertical resolution of 2.5 km and an accuracy of ∼ 3 m s−1 for the estimated wind (Skinner et al., 2003; Niciejewski et al., 2006).
Thus, in the MLT region, there are overlapping measurements from the meteor radar and the TIDI that can be used for comparisons, and, consequently, these can be used to identify the advantages of each instrument for different kinds of scientific investigations. The present work aims to contribute to this topic by comparing data collected during 2006 by a meteor radar deployed at São João do Cariri (7.4° S, 36.5° W) with the measurements by the TIDI, considering a geographical grid of ± 5° latitude and longitude, centered at São João do Cariri. The size of this window approximately correlates with the field of view of the meteor radar. This meteor radar started to operate in 2005, and during the year of 2006, it had an excellent data acquisition, with high-quality data; this is the reason for choosing 2006 to make the comparisons, having an adequate temporal window for the objectives of this work.
Figure 1 shows vertical profiles for meridional (blue) and zonal (red) winds. Solid lines represents the meteor radar measurements at 14:00 universal time (UT) on 15 March 2006, while the dashed (14:13 UT), dot-dashed (14:15 UT) and dotted (14:17 UT) lines represent the TIDI measurements from the same day. One can observe that there are large discrepancies between two measurements, even within a short time interval. Although these discrepancies are well known by the community, in this paper, we have returned this to discussion with the objective of showing which technique is more advantageous for investigations using MLT wind with a short time interval.
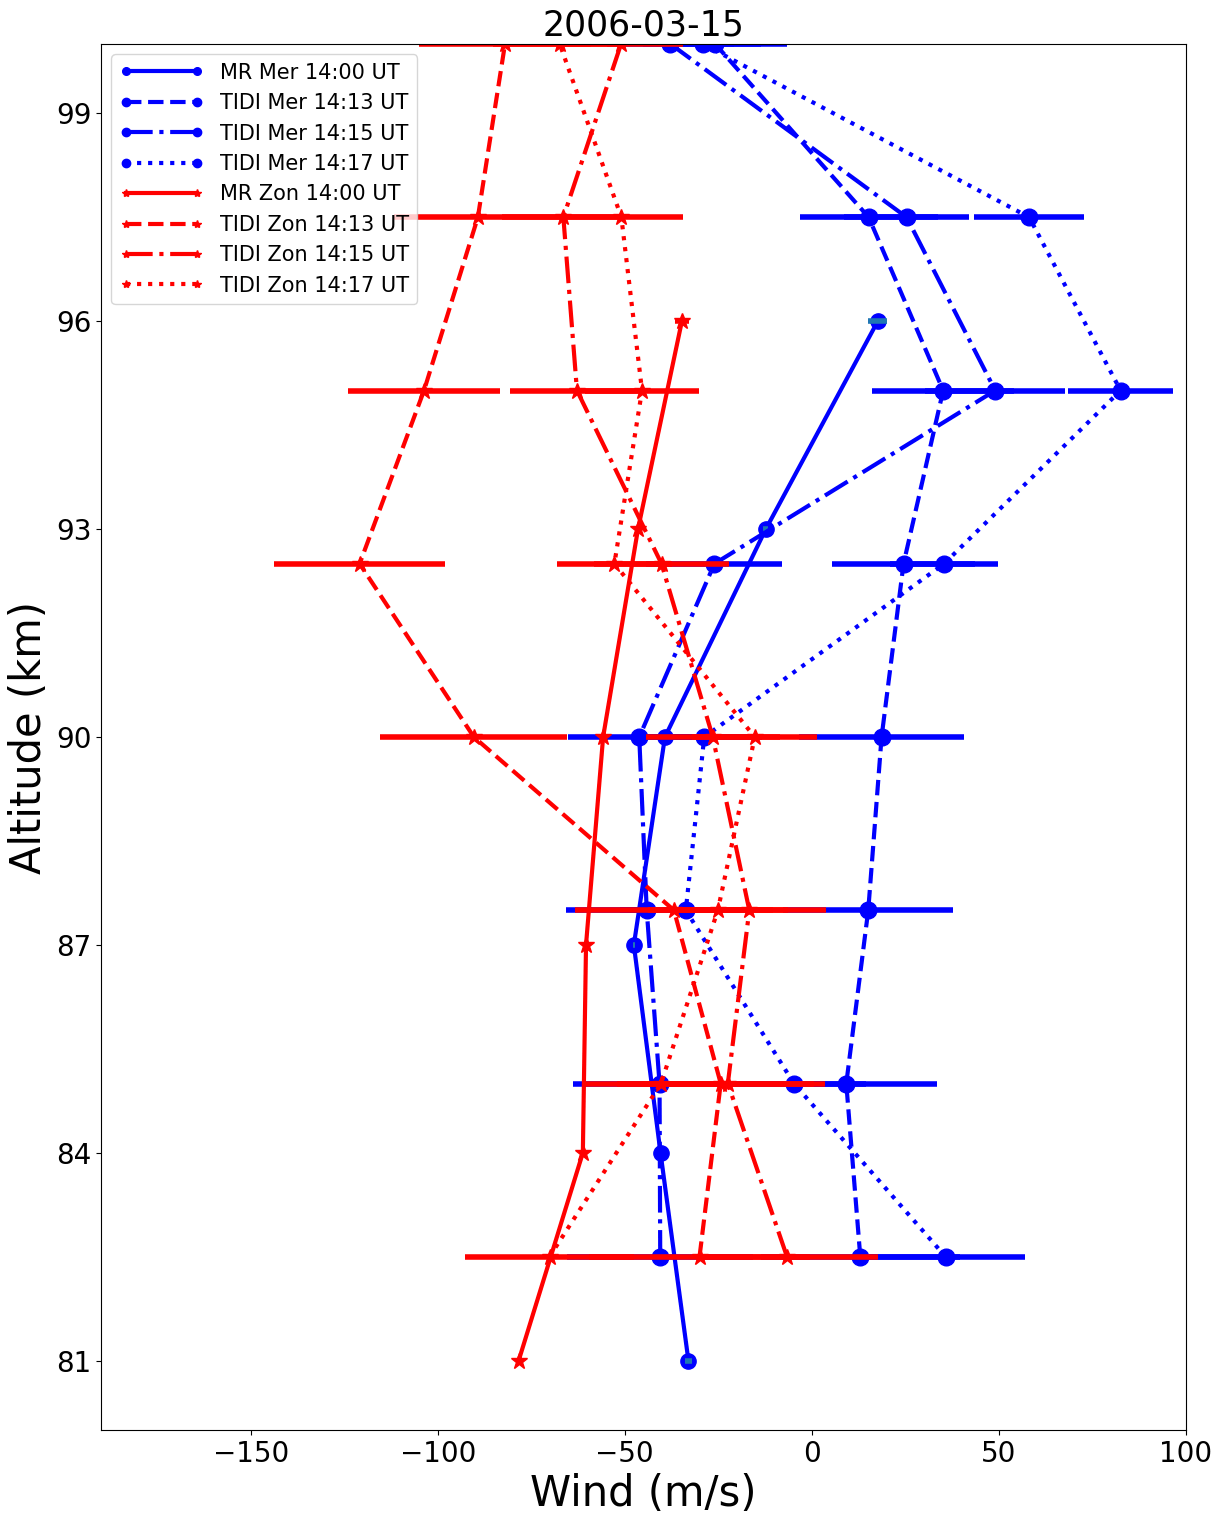
Figure 1Vertical profiles of the meridional (blue) and zonal (red) winds measured by the meteor radar (solid lines) and the TIDI (dashed, dot-dashed and dotted lines) over São João do Cariri. The meteor radar profiles were calculated at 14:00 UT on 15 March 2006. The TIDI measurements were retrieved at 14:13 UT (dashed lines), 14:15 UT (dot-dashed lines) and 14:17 UT (dotted lines).
On the one hand, the calculation of the mean winds from the meteor radar uses a bin size of 1 h, centered on the half-hour, computing all meteors within its field of view. On the other hand, the TIDI estimates the wind from the airglow within 2.5° horizontally during a single sounding (Killeen et al., 2006). Therefore, the wind profiles from the two instruments could be largely different from each other.
Another thing to call attention to is the fact that the TIDI measurements are quite different, even within a time interval of 2 min. However, as shown by John et al. (2011), if a long time interval is used to measure climatological mean wind profiles using the two instruments, the profiles will be close enough to each other.
Figure 2 shows the horizontal distribution of the meteor echoes used to compute the mean wind profile shown in Fig. 1. Additionally, the geographical positions of the TIDI's soundings are shown as blue stars. In fact, there is a long distance between two soundings, which could be separated by the same distance as the field of view of the meteor radar. Even the TIDI sounding that was very close São João do Cariri (conducted at 14:15 UT) revealed wind profiles which have significant differences when compared to the meteor radar ones.
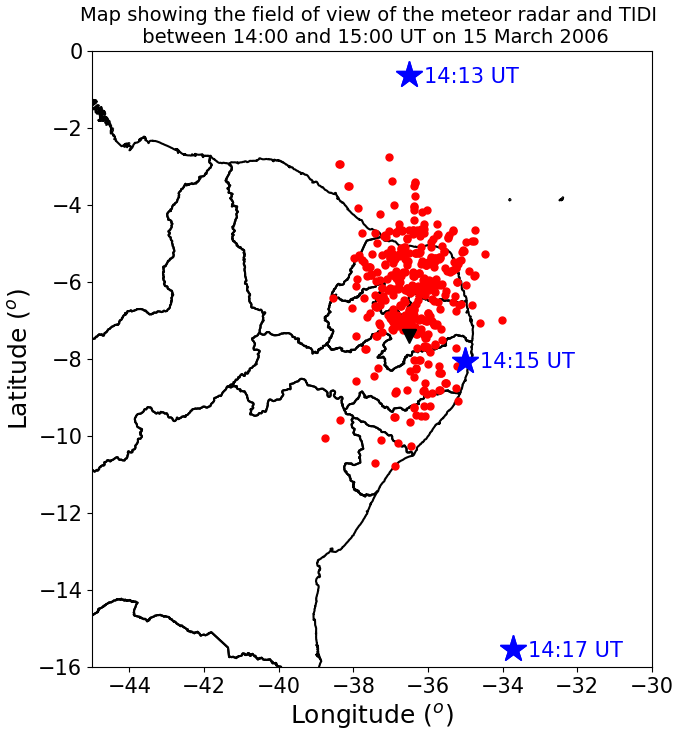
Figure 2Horizontal distribution of the meteor echoes (red dots) detected on 15 March 2006 between 14:00 and 15:00 UT over São João do Cariri (black triangle), which were used to compute the winds showed in Fig. 1. These meteor echoes were detected from ∼ 78 up to 102 km altitude. The blue stars show the position of the vertical soundings shown in Fig. 1.
It is well known that the wind in the MLT can change quickly (e.g., Clemesha et al., 1981; Kishore Kumar et al., 2018), primarily as a response to the passage of gravity waves in this region (Baumgarten et al., 2018). However, in this case, the time interval between two soundings is very short (∼ 2 min), and the likely explanation for the discrepancies between the consecutive profiles could be the large horizontal separation.
Satellite measurements are more reliable in investigating the propagation of gravity waves and their interaction with the background atmosphere. For instance, winds measured by radars have been used to evaluate the background condition of the atmosphere in the creation of Doppler ducts in the MLT (Fechine et al., 2009; Bageston et al., 2011; Carvalho et al., 2017, e.g.,); these ducts are necessary conditions for the propagation of ducted waves in the atmosphere (Dewan and Picard, 1998). Indeed, the usage of the TIDI winds for case studies of mesosphere fronts could produce more confident results if the sounding is within the field of view where the front is observed.
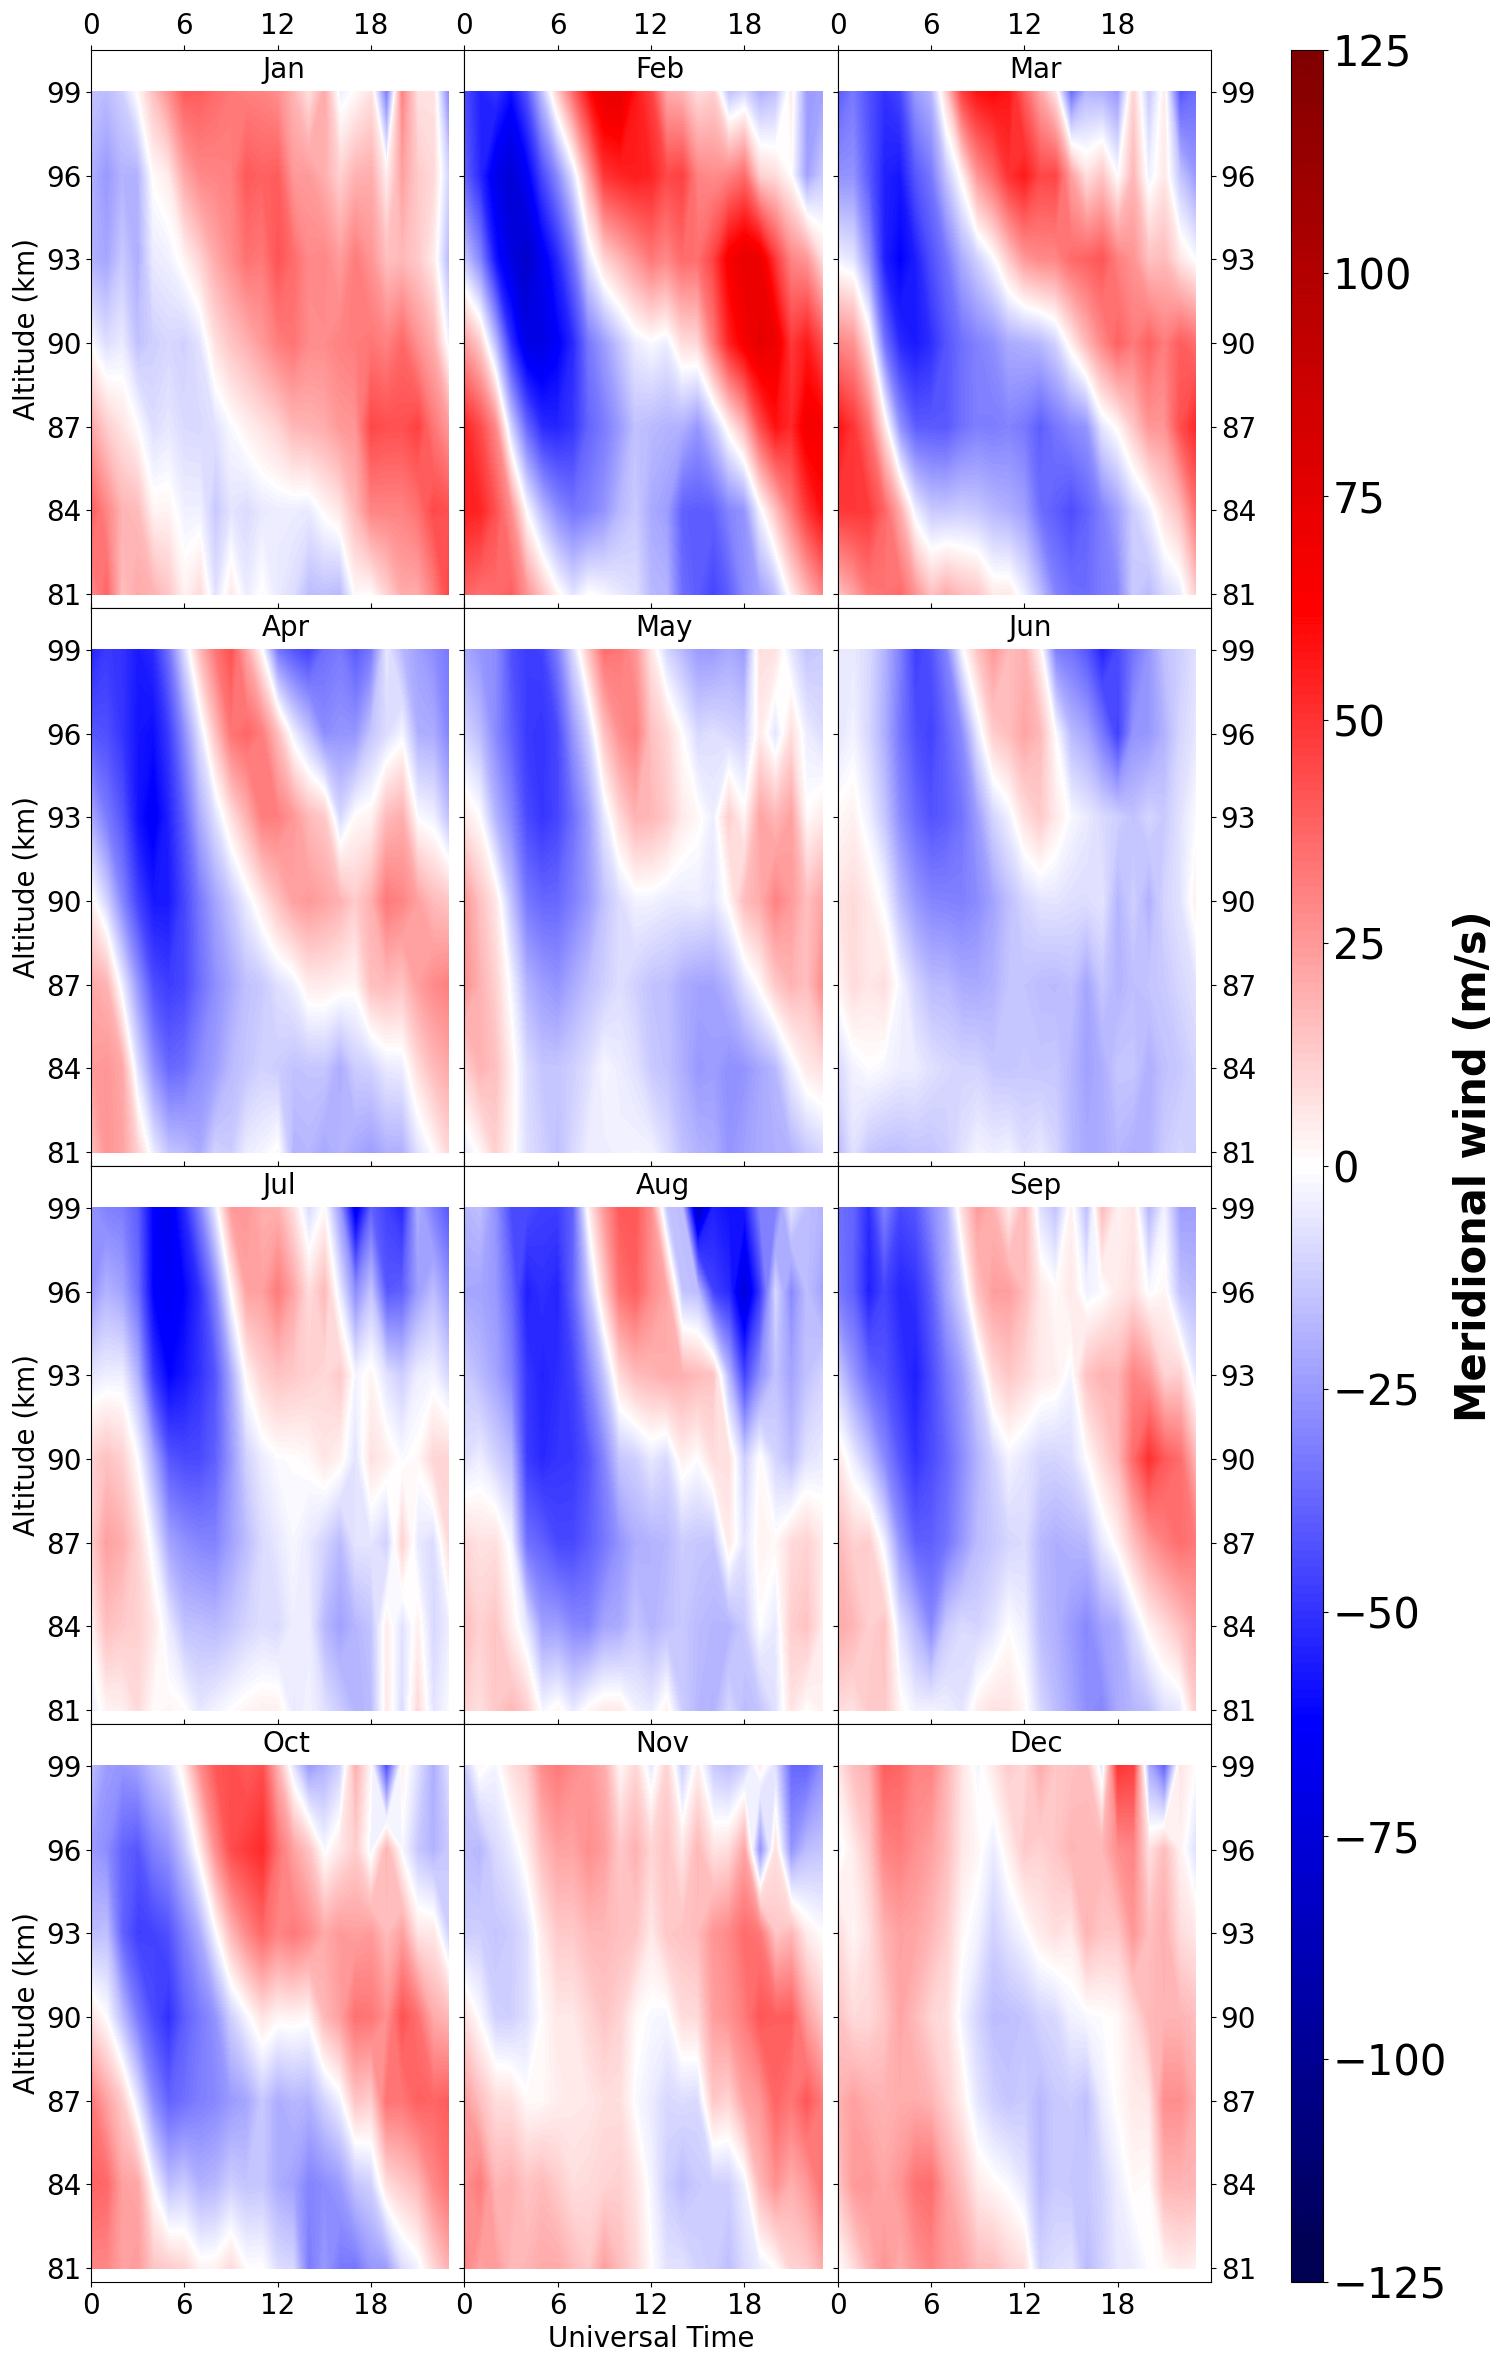
Figure 3Monthly time variation of averaged meridional wind calculated using the meteor radar for 2006.
Another important contribution in the studies of ducted gravity waves is their interaction with the background atmosphere, which can produce either convective or dynamic instabilities (Fritts and Rastogi, 1985). The most common parameter used to classify the instability as convective or dynamic is the Richardson number, which is the ratio between the buoyancy and wind shear. Thereby, the TIDI is indeed advantageous for coincident measurements.
A disadvantage of investigating gravity waves combining the TIDI and background measurements is having coincident soundings of the satellite cross the field of view of the instrument deployed on the ground.
How are the long-term-averaged winds from the TIDI reliable if they have strong short-time variations? In order to try to answer this question, a variation in the mean wind over the course of the day was calculated for each month of 2006 using the meteor radar (Figs. 3 and 5) and the TIDI (Figs. 4 and 6). In the analysis of both measurements, winds faster than 150 m s−1 were treated as missed points.
Figure 3 shows the time variation in the averaged meridional wind calculated using all the days within the months as a function of the altitude. One can observe that the meridional winds range from approximately −120 to 100 m s−1, where the large values were observed in the summer months. It is clear that the presence of diurnal oscillations propagates with the decrease in altitude in most of the months. For some months, primarily in the autumn and winter, the semi-diurnal oscillations appear to be dominant in the upper levels. This annual variability in the diurnal and semi-diurnal tides is well known in the equatorial region (e.g., Lima et al., 2007). As the wind calculated by the meteor radar data is averaged over time bin sizes of 1 h, no short-time (<2 h) oscillations were observed clearly.
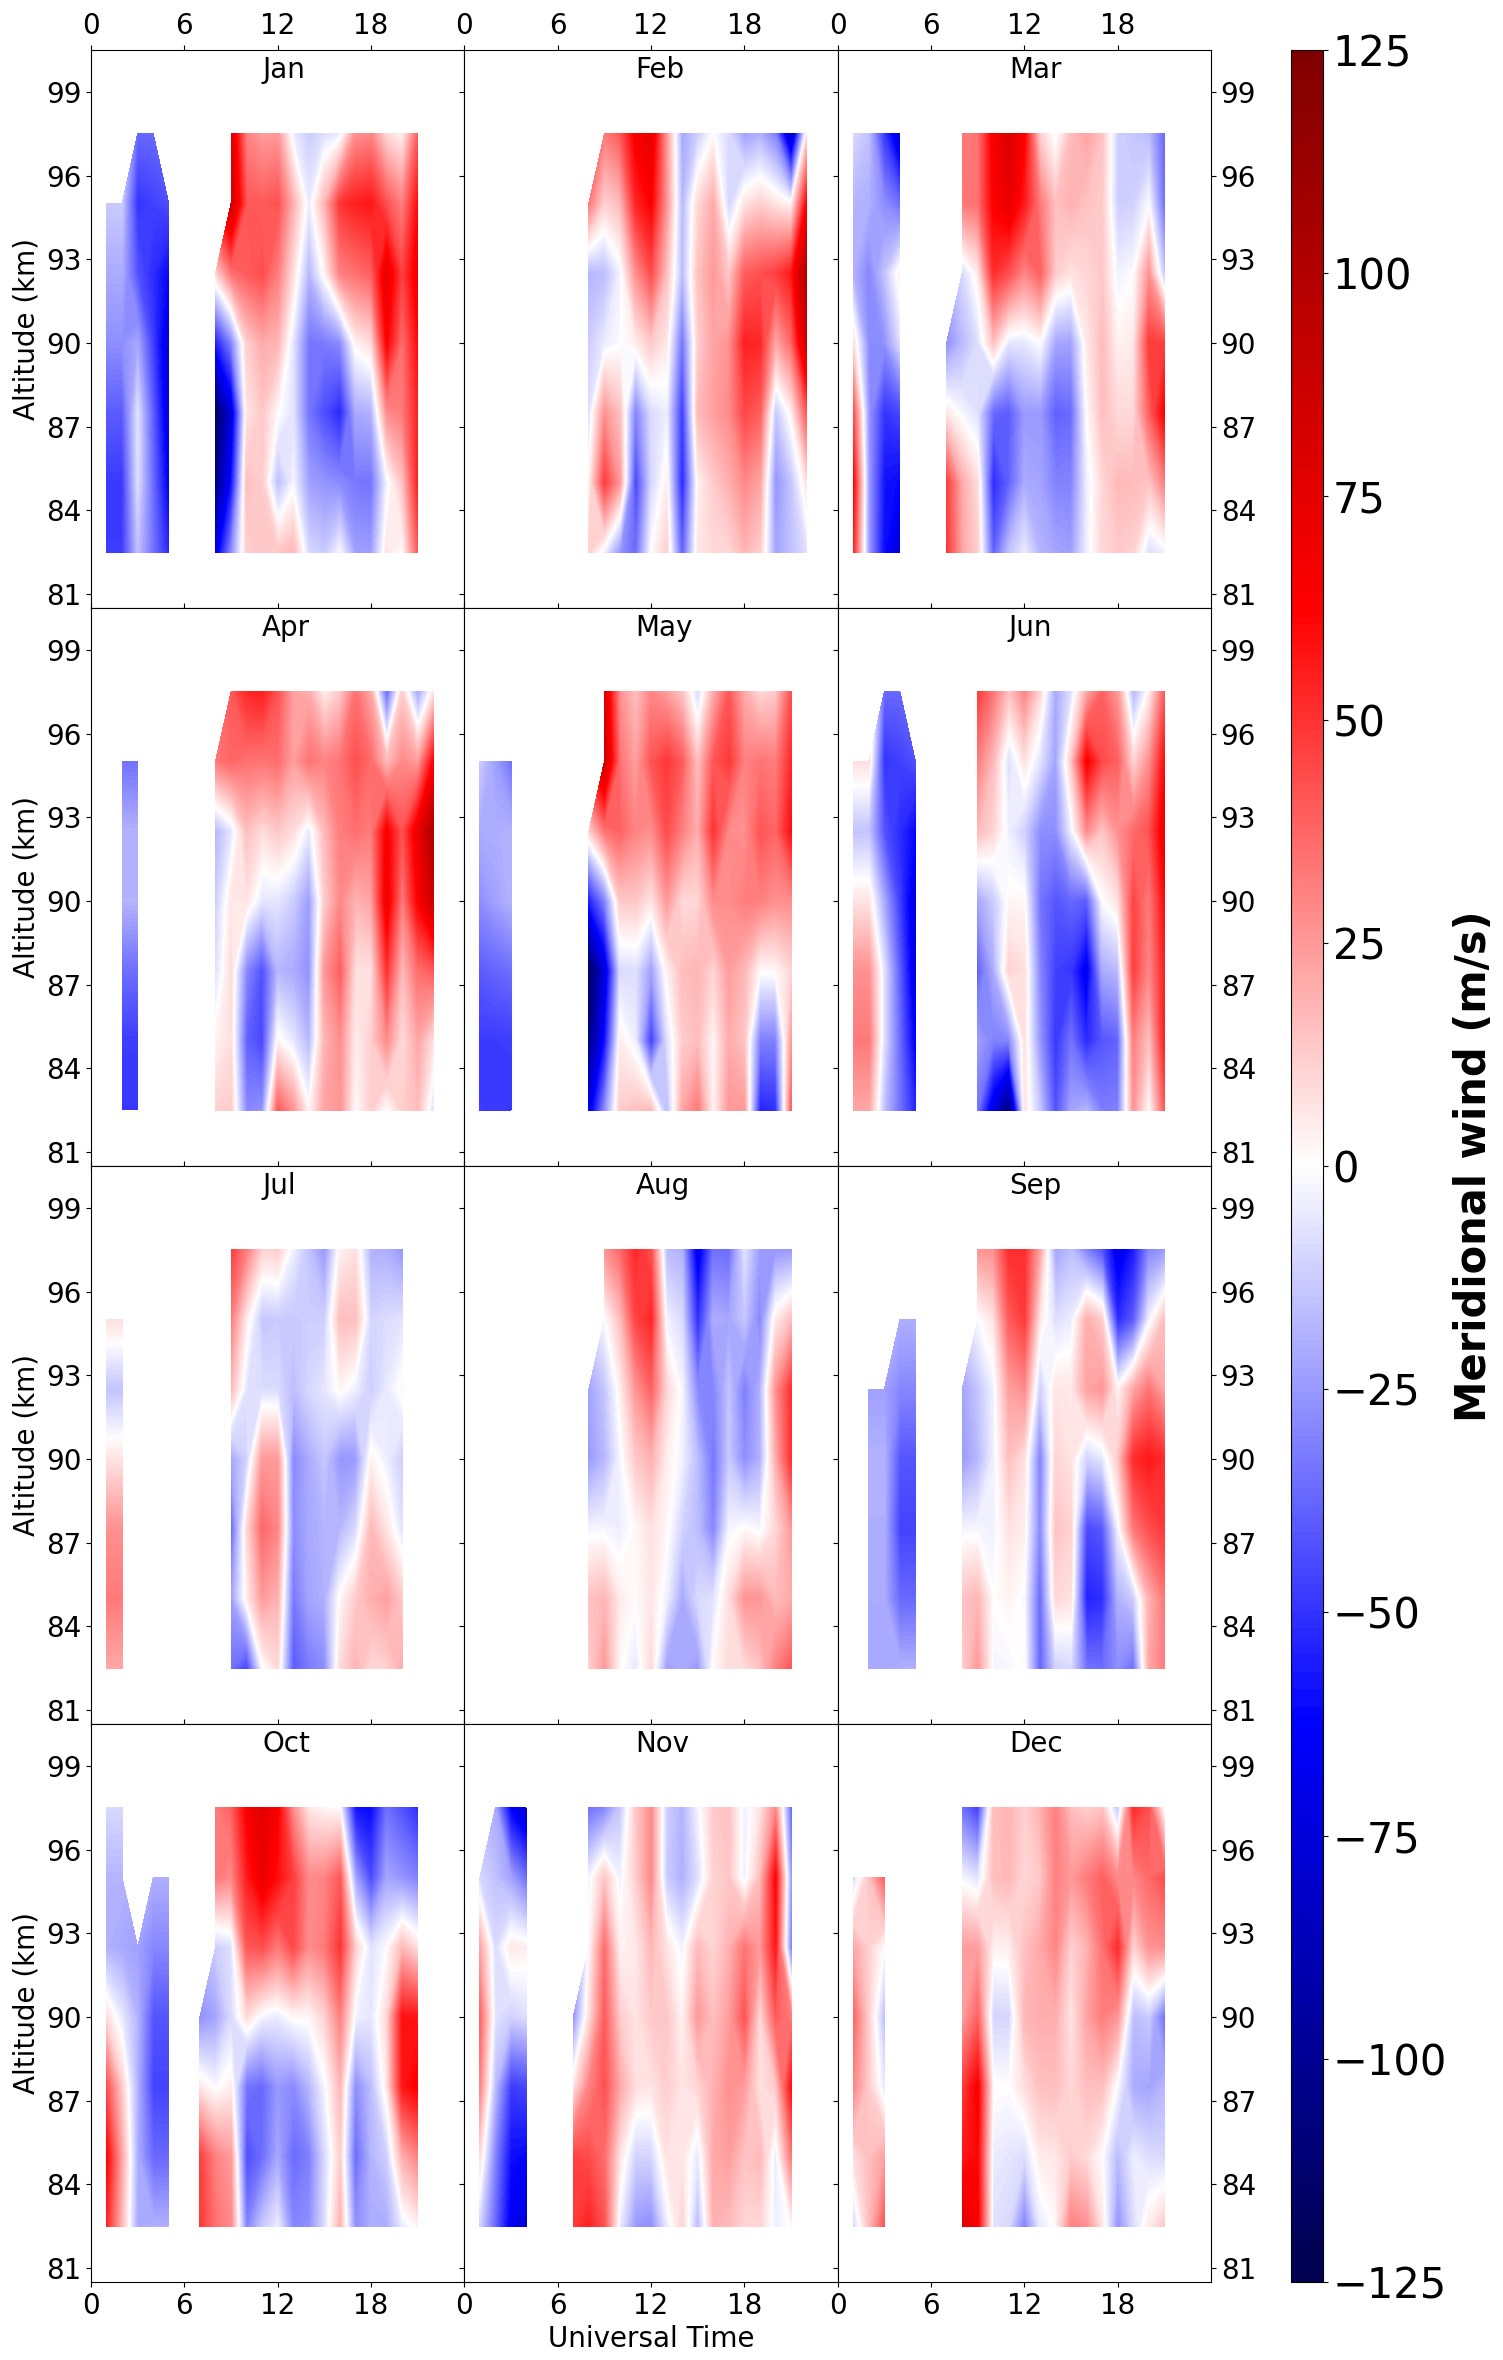
Figure 4 is the same as Fig. 3 but for the TIDI meridional winds. It has been produced using the data retrieved from the TIDI within a grid of ± 5° (latitude × longitude), centered at São João do Cariri, over the course of 60 d, covering each month of 2006. The color bar is of the same scale as in Fig. 3; thereby, the amplitudes of the wind and the seasonal changes are quite similar when comparing the two kinds of measurements. This good qualitative comparison was found by Xu et al. (2009) as well.
Furthermore, even using a temporal window of 60 d, some gaps have appeared in Fig. 4 due to the small number of soundings for a given hour. If the window size is enlarged to 30 × 30° (figure not shown here), these gaps decrease substantially, and the behaviors of the meridional wind composite during the day tend to approach what can be seen in Fig. 4.
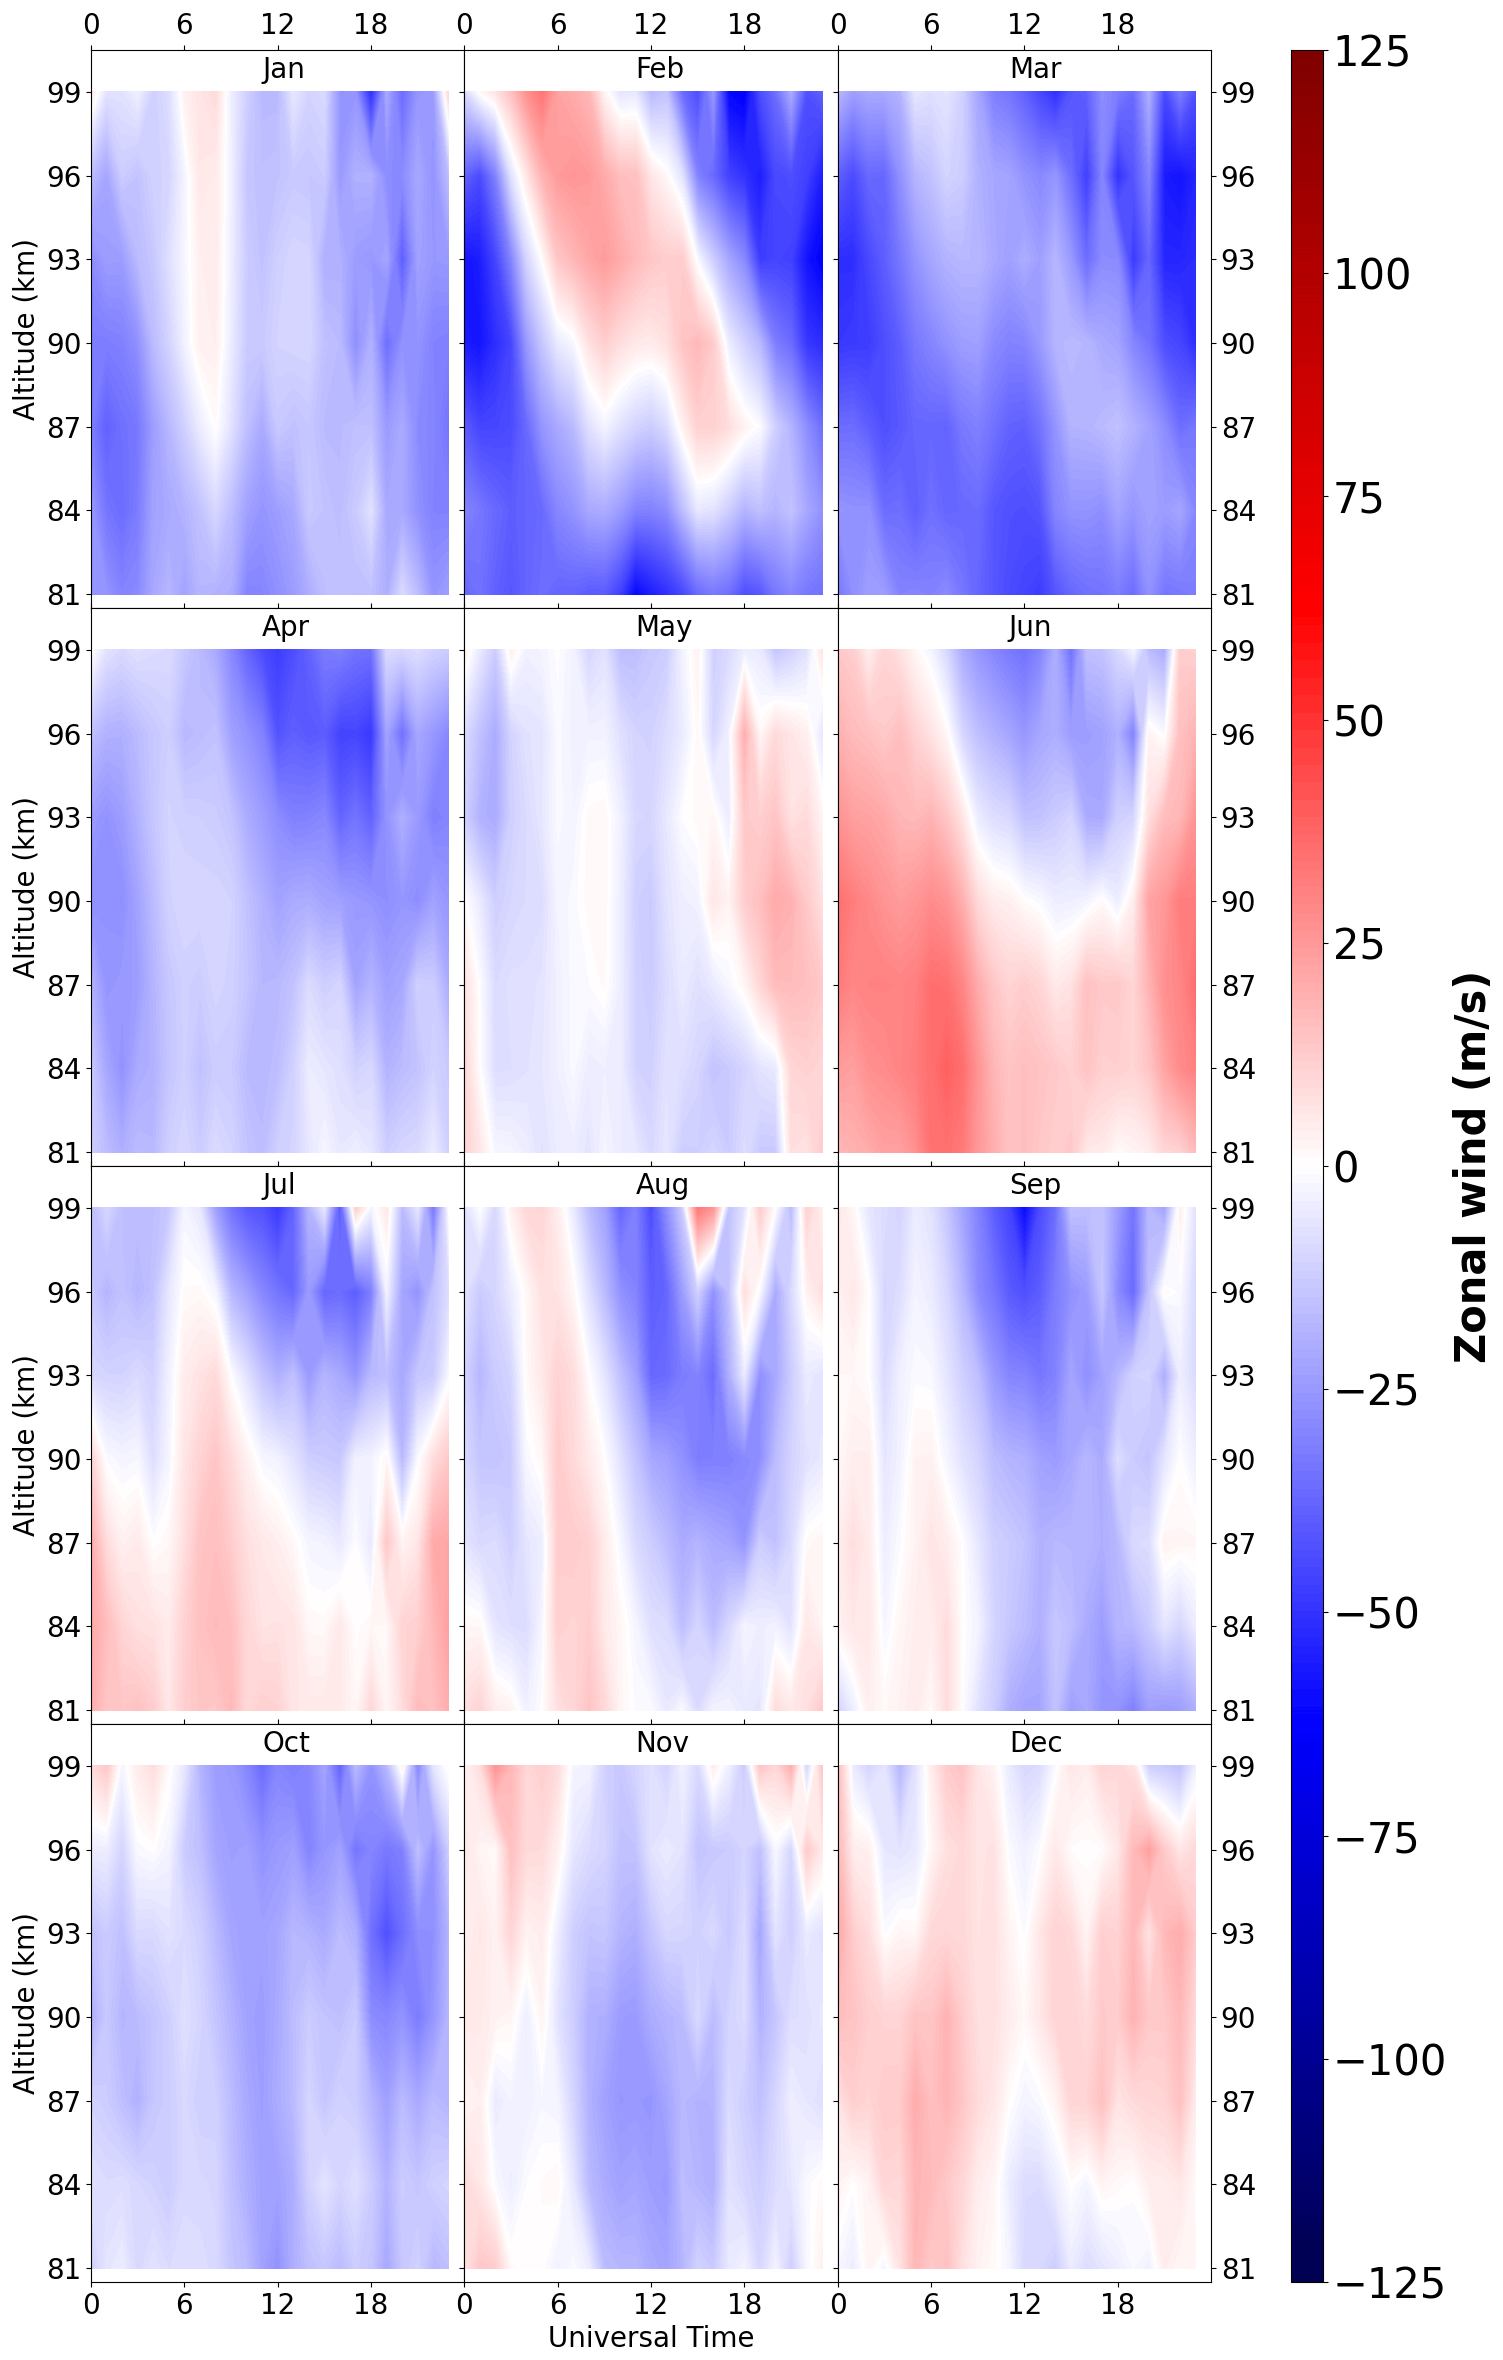
Figure 5Monthly time variation in averaged zonal wind calculated using the meteor radar for 2006.
In addition, most of the months presented well-defined diurnal oscillations; however, short-period structures are more evident for the TIDI meridional winds. Maybe the presence of atmospheric oscillations during some days could modulate the observed diurnal tide phase. Furthermore, the small number of soundings by the satellite within the chosen window may not be enough to nullify the effects of short-period variations. John et al. (2011) compared the temporal wind over the course of 3 months and reached relatively good agreement over Thumba (8.5° N, 77° E), which is an equatorial region as well.
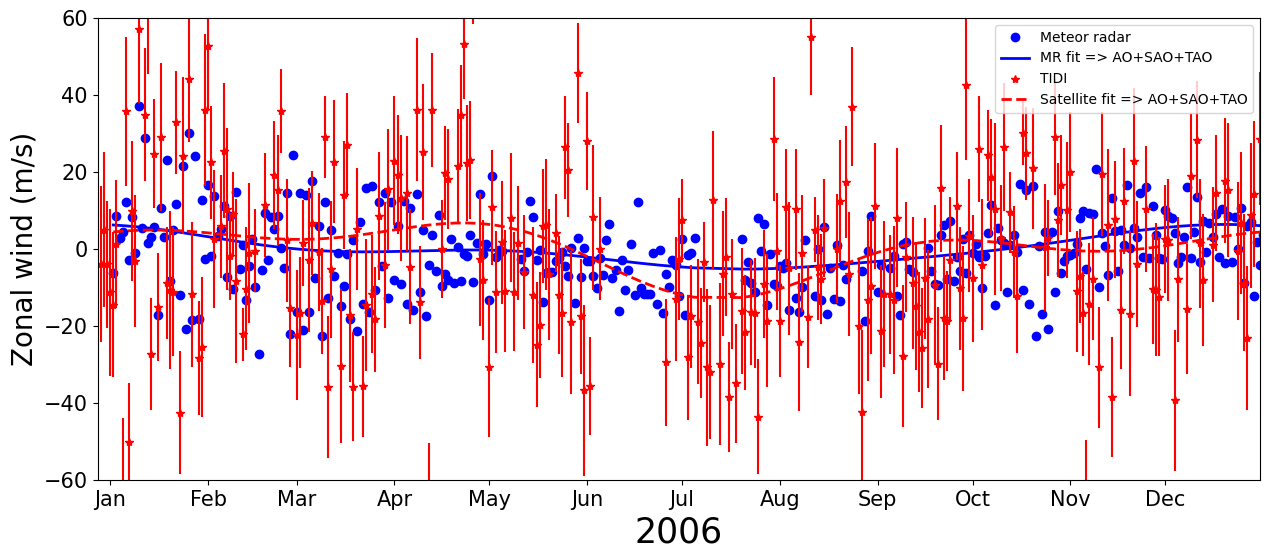
Figure 7Temporal evolution of the meridional wind calculated for all available altitudes for the meteor radar (blue) and the TIDI (red) during 2006. The solid blue line (meteor radar) and the dashed red line (TIDI) represent the least-square fits for annual oscillations (AOs), semi-annual oscillations (SAOs) and tri-annual oscillations (TAOs).
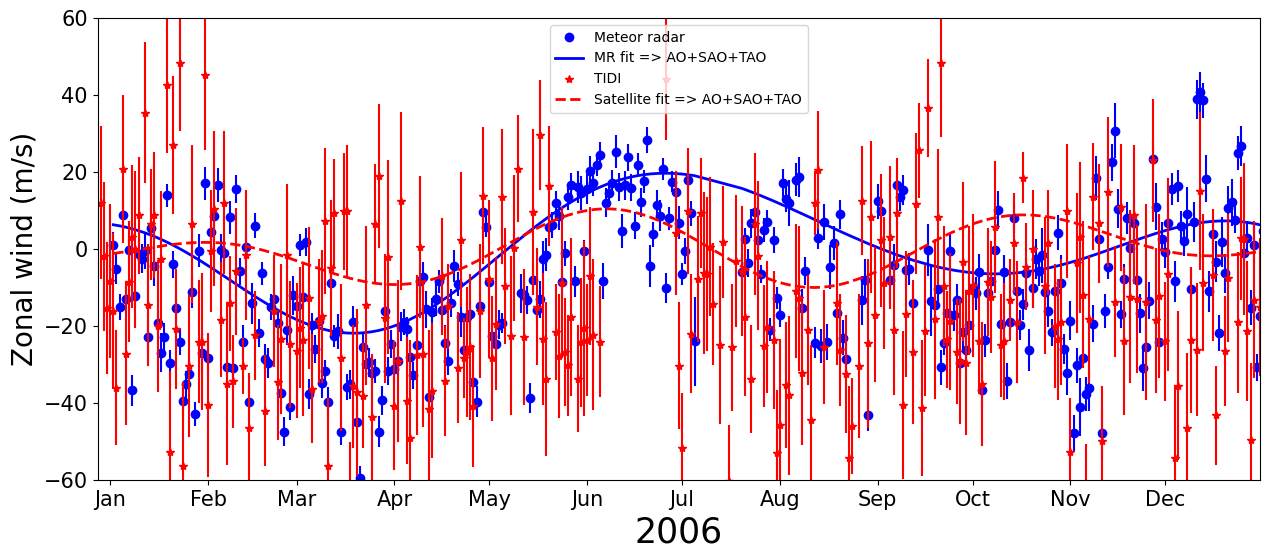
Figure 5 is the same as Fig. 3 but for the zonal component. It is of the same scale as Figs. 3 and 4. Thus, one can observe that the zonal winds have smaller amplitudes than the meridional ones. Similarly, the diurnal oscillation is stronger during the summer, while the semi-diurnal one appears sporadically for some altitudes.
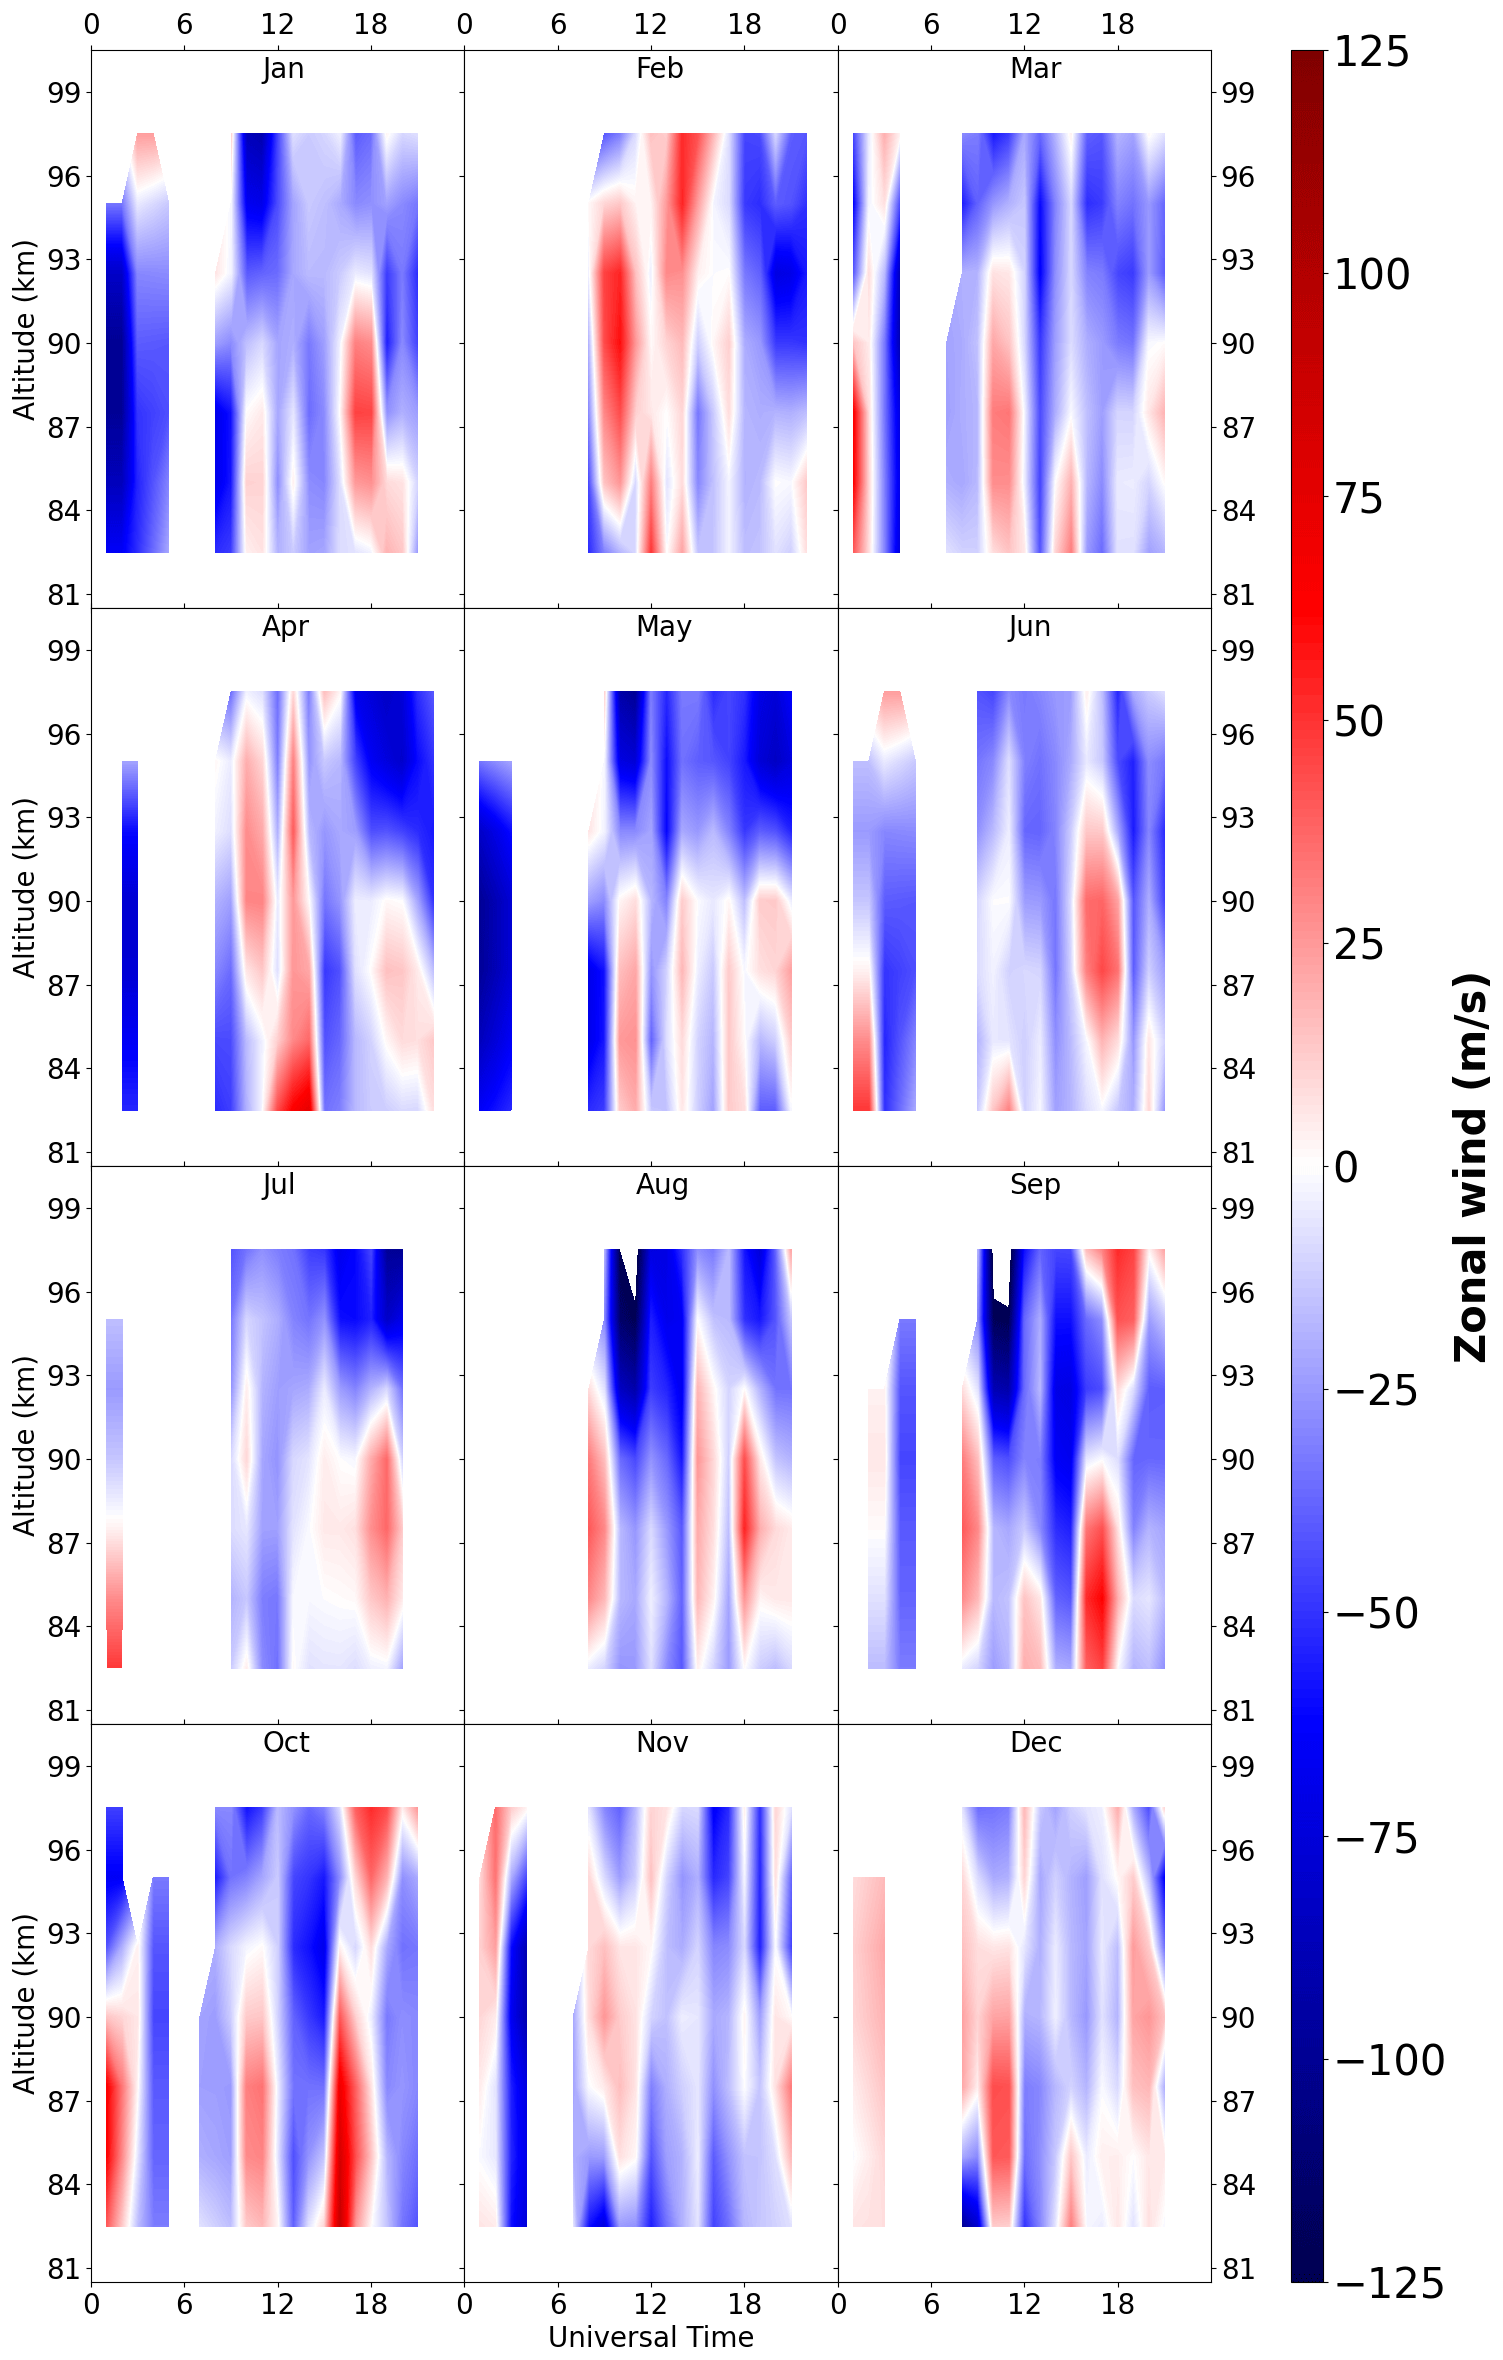
Figure 6 presents the same kind of chart as Fig. 4 but for the zonal component. For almost all months, the amplitudes of the zonal winds are larger than those of the meteor radar. Diurnal structures can be observed, but shorter-period structures appear as well for practically the whole year. Although the mean zonal wind calculated from the TIDI compares favorably to meteor radar measurements, there are several short structures that could be associated with short-period oscillations in the MLT, for instance. The same discussion about the gaps in Fig. 4 can be applied to Fig. 6.
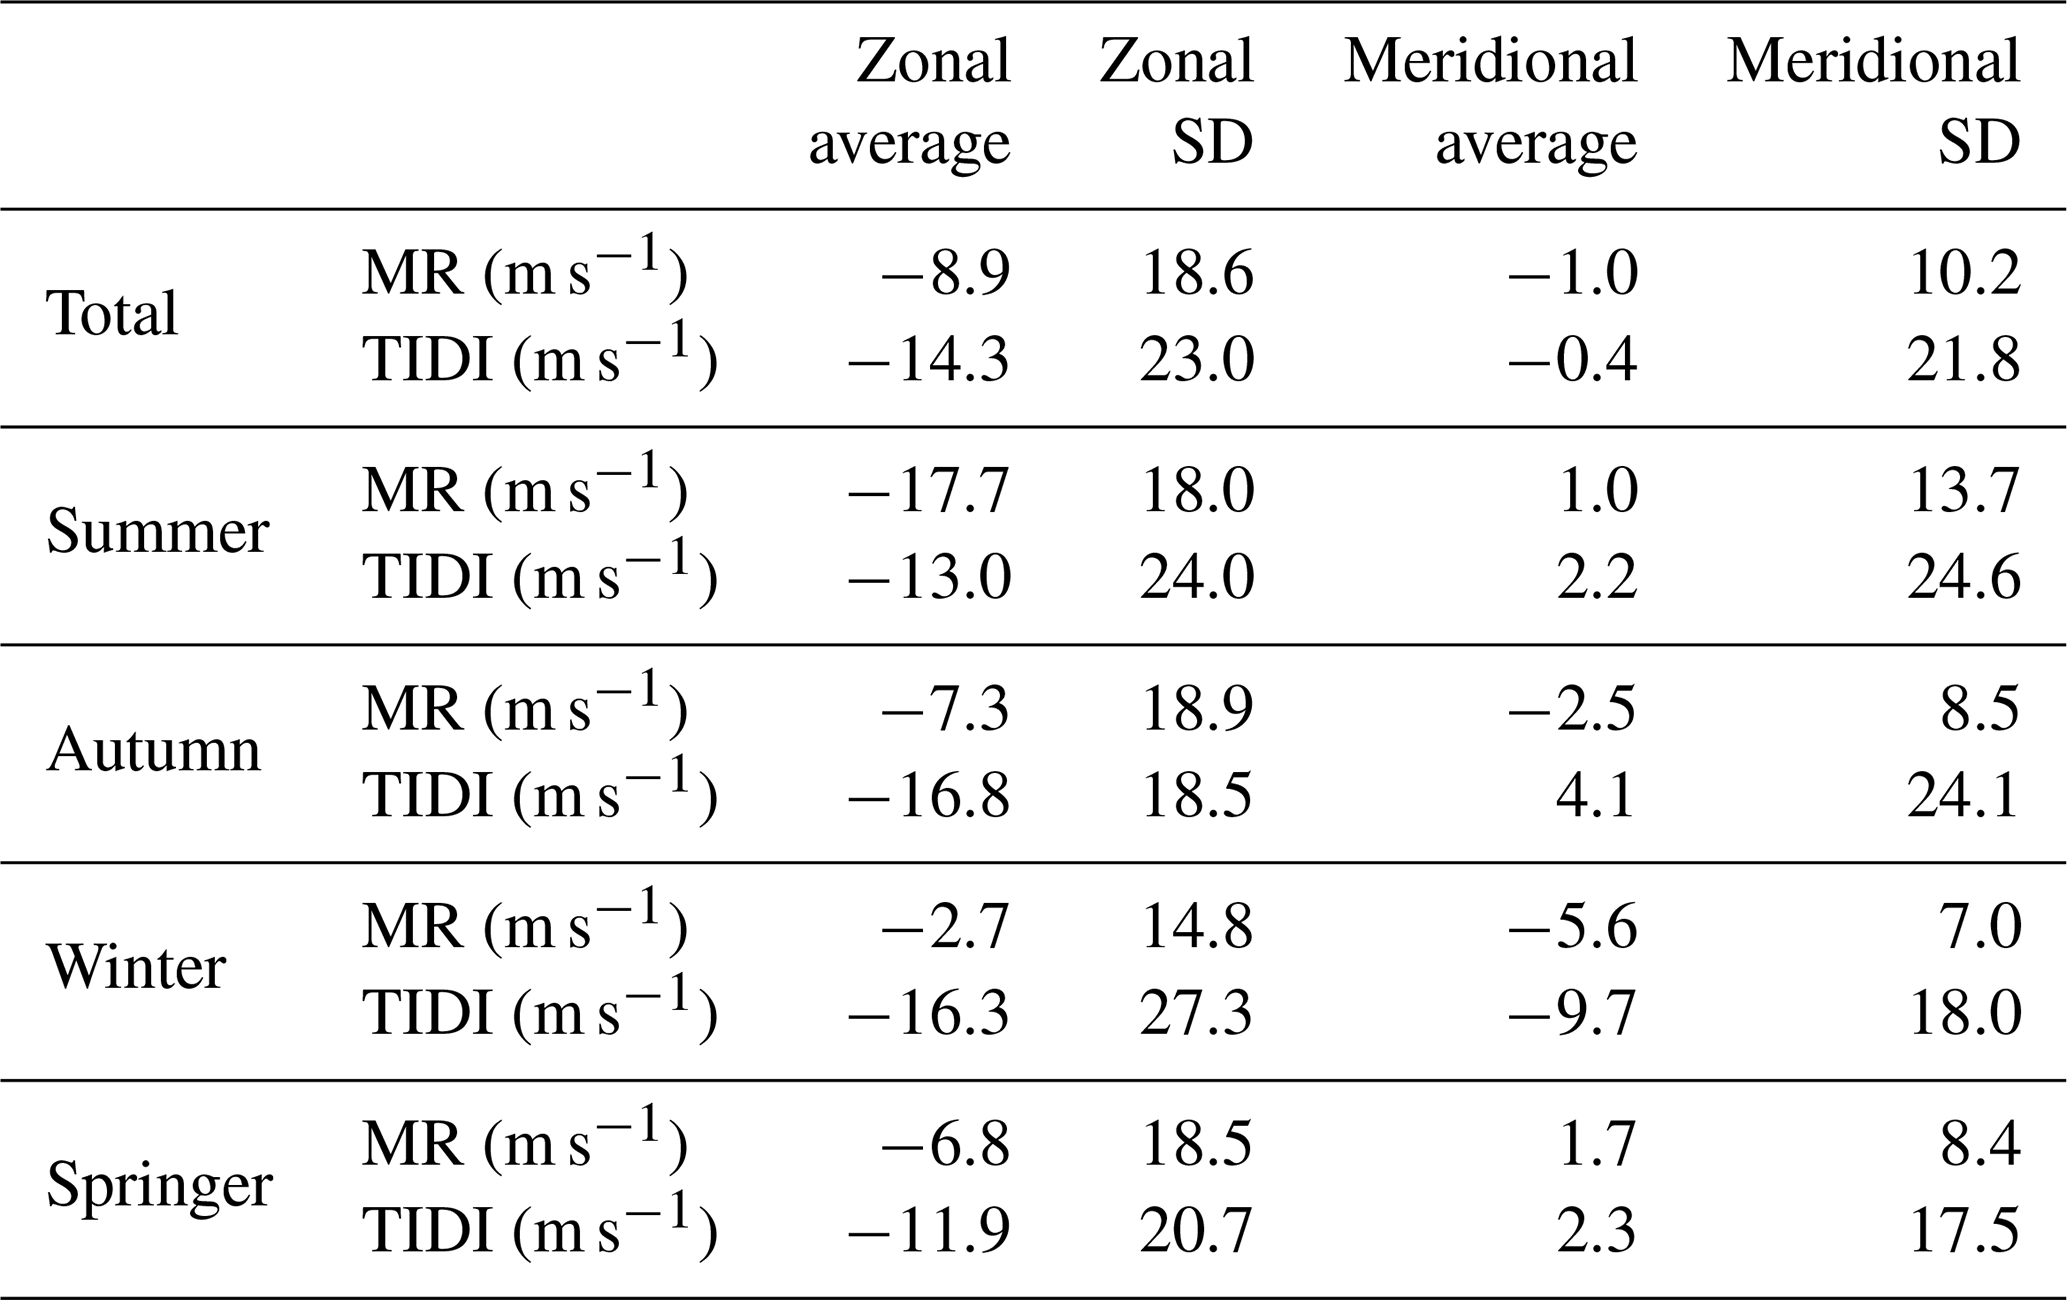
Table 1Statistical parameters for a Gaussian distribution of the zonal and meridional winds measured by the TIDI and meteor radar.
Su et al. (2014) made a comparison of these two kinds of measurements during the Leonids meteor shower in 2012 and observed reasonable agreement, but short-time structures were presented in the TIDI as well.
The last question to be discussed within the scope of these comparisons is as follows: how do the TIDI wind measurements respond to the seasonal, semi-annual and annual variations? Features like quasi-biennial oscillation (QBO), semi-annual oscillation (SAO) and annual oscillation (AO) have been pointed out as being responsible for the long-term variability in the migrating diurnal tide (e.g., Xu et al., 2009).
Figure 7 shows the meridional wind measured by the two instruments over the course of 2006, averaged for all available altitudes. The meteor radar and the TIDI wind points within the window centered over São João do Cariri were daily averaged.
The meteor radar meridional wind presents a predominant annual oscillation, with a maximum during the summer and other small-period structures. Even though the zonal wind from the TIDI presents a spread of points during 2006, the points approach the general behavior of the radar measurements, which can be seen in the solid and dashed lines in Fig. 7.
Figure 8 is the same as Fig. 7 but for the zonal component, which has a semi-annual oscillation that is more pronounced and other short oscillations throughout the year. Again, the TIDI winds follow the meteor radar winds. Additionally, the least-square fits were close in phase for the SAO, which is the dominant oscillation in the radar data. Otherwise, there is the presence of a tri-annual oscillation in the TIDI winds, which is not strong in the radar winds.
The data shown in Figs. 7 and 8 obey a statistical Gaussian distribution, which is not shown here, but the parameters, i.e., the averages and standard deviation (SD) for the TIDI and meteor radar (MR) measurements, are presented in Table 1. Note that the parameters of the Gaussian distribution for the total data are close each other, except for the standard deviation of the meridional component, which is greater for the TIDI measurements. Thereby, this suggests that, in addition to being close, the values of the two measurements could obey the same statistical distribution. Additionally, the averages for each season are close to each other, except in autumn and in winter for the zonal component. This could be the result of the reduced number of points and the seasonal effects, which can be seen in Figs. 7 and 8.
Xu et al. (2009) compared the amplitude of the migrating diurnal tide calculated from wind retrieved by these two techniques, and the results showed good agreement as well. This suggests that, for studies of long-period observations, these measurements converge.
The present work compared the horizontal wind measured by the TIMED Doppler Interferometer and a meteor radar over São João do Cariri in 2006. Three aspects were analyzed and discussed: (i) quasi-instantaneous measurements; (ii) time variations in the average wind for every month; and (iii) the responses of the two techniques to the intraseasonal, semi-annual and annual oscillations in the wind. The objective was to figure out the advantages and disadvantages of each technique. The main results are as follows:
-
A case study for 15 March 2006 showed that almost simultaneous measurements of the zonal and meridional wind vertical profiles were substantially different when comparing the TIDI and meteor radar measurements. This happens because the TIDI measures a quasi-instantaneous wind in the MLT region, while the meteor radar uses a bin size of 1 h to average the wind over the whole sky. Thus, a single TIDI profile is more reliable to conduct studies involving short-period waves (gravity waves) in the MLT. However, the disadvantage of using the TIDI to study gravity waves, for instance, is the difficulty of matching simultaneous measurements from different instruments.
-
Looking at the time variation of the averaged zonal and meridional winds calculated using the TIDI measurements for every month of 2006, there are poor agreements with the meteor wind calculations. The main discrepancy is that the meteor radar calculations for each month are smoother compared to those of the TIDI. For this reason, the meteor radar clearly shows the contribution of the tides (diurnal and semi-diurnal) to the dynamics of the MLT. It was discussed that, when extending the temporal window for integrating the daily wind from the TIDI measurements, the behaviors approach each other in terms of similarity.
-
Both measurements respond satisfactorily to the long-period (seasonal, semi-annual and annual) oscillations. Thus, they could be comparable to studies of long-term dynamics in the MLT, although the large spread of the TIDI averaged wind could introduce some discrepancies.
ARP – conceptualization, methodology and analysis; DOR and IP – conceptualization, analysis and revision; LML – conceptualization and revision; RAB, PPB, AR and CW – experiments and revision.
At least one of the (co-)authors is a member of the editorial board of Annales Geophysicae. The peer-review process was guided by an independent editor, and the authors also have no other competing interests to declare.
Publisher’s note: Copernicus Publications remains neutral with regard to jurisdictional claims made in the text, published maps, institutional affiliations, or any other geographical representation in this paper. While Copernicus Publications makes every effort to include appropriate place names, the final responsibility lies with the authors.
The authors thank the Conselho Nacional de Desenvolvimento Científico e Tecnológico, the Fundação de Am- paro à Pesquisa do Estado da Paraíba, and the Universidade Estadual da Paraíba.
This research has been supported by the Conselho Nacional de Desenvolvimento Científico e Tecnológico (grant nos. 404971/2021-0 and 306063/2020-4), Fundação de Apoio à Pesquisa do Estado da Paraíba (grant nos. 047/2021 and 002/2019), and Universidade Estadual da Paraíba (PRPGP 05/2024).
This paper was edited by Gunter Stober and reviewed by four anonymous referees.
Bageston, J. V., Wrasse, C. M., Batista, P. P., Hibbins, R. E., C Fritts, D., Gobbi, D., and Andrioli, V. F.: Observation of a mesospheric front in a thermal-doppler duct over King George Island, Antarctica, Atmos. Chem. Phys., 11, 12137–12147, https://doi.org/10.5194/acp-11-12137-2011, 2011. a, b
Balsley, B. B., Ecklund, W. L., Carter, D. A., and Johnston, P. E.: The MST radar at Poker Flat, Alaska, Radio Sci., 15, 213–223, https://doi.org/10.1029/RS015i002p00213, 1980. a
Baumgarten, K., Gerding, M., Baumgarten, G., and Lübken, F.-J.: Temporal variability of tidal and gravity waves during a record long 10-day continuous lidar sounding, Atmos. Chem. Phys., 18, 371–384, https://doi.org/10.5194/acp-18-371-2018, 2018. a, b
Buriti, R. A., Hocking, W. K., Batista, P. P., Medeiros, A. F., and Clemesha, B. R.: Observations of equatorial mesospheric winds over Cariri (7.4° S) by a meteor radar and comparison with existing models, Ann. Geophys., 26, 485–497, https://doi.org/10.5194/angeo-26-485-2008, 2008. a
Carvalho, A., Paulino, I., Medeiros, A., Lima, L., Buriti, R., Paulino, A., Wrasse, C., and Takahashi, H.: Case study of convective instability observed in airglow images over the Northeast of Brazil, J. Atmos. Sol.-Terr. Phys., 154, 33–42, https://doi.org/10.1016/j.jastp.2016.12.003, 2017. a, b
Clemesha, B., Batista, P., and Simonich, D.: Simultaneous measurements of meteor winds and sporadic sodium layers in the 80–110 km region, Adv. Space Res., 27, 1679–1684, https://doi.org/10.1016/S0273-1177(01)00238-1, 2001. a
Clemesha, B. R., Kirchhoff, V. W. J. H., Simonich, D. M., and Batista, P. P.: Mesospheric winds from lidar observations of atmospheric sodium, J. Geophys. Res.-Space, 86, 868–870, https://doi.org/10.1029/JA086iA02p00868, 1981. a, b
Dewan, E. M. and Picard, R. H.: Mesospheric bores, J. Geophys. Res.-Atmos., 103, 6295–6305, https://doi.org/10.1029/97JD02498, 1998. a
Fechine, J., Wrasse, C. M., Takahashi, H., Medeiros, A. F., Batista, P. P., Clemesha, B. R., Lima, L. M., Fritts, D., Laughman, B., Taylor, M. J., Pautet, P. D., Mlynczak, M. G., and Russell, J. M.: First observation of an undular mesospheric bore in a Doppler duct, Ann. Geophys., 27, 1399–1406, https://doi.org/10.5194/angeo-27-1399-2009, 2009. a, b
Fritts, D. C. and Rastogi, P. K.: Convective and dynamical instabilities due to gravity wave motions in the lower and middle atmosphere: Theory and observations, Radio Sci., 20, 1247–1277, https://doi.org/10.1029/RS020i006p01247, 1985. a
Fujii, J., Nakamura, T., Tsuda, T., and Shiokawa, K.: Comparison of winds measured by MU radar and Fabry-Perot interferometer and effect of OI5577 airglow height variations, J. Atmos. Sol.-Terr. Phys., 66, 573–583, https://doi.org/10.1016/j.jastp.2004.01.010, 2004. a
Fukao, S., Sato, T., Tsuda, T., Kato, S., Wakasugi, K., and Makihira, T.: The MU radar with an active phased array system: 1. Antenna and power amplifiers, Radio Sci., 20, 1155–1168, https://doi.org/10.1029/RS020i006p01155, 1985. a
GSFC NASA: TIDI wind vector, GSFC NASA [data set], https://cdaweb.gsfc.nasa.gov/pub/data/timed/tidi/vector/ (last access: 25 February 2025), 2025. a
Hindley, N. P., Mitchell, N. J., Cobbett, N., Smith, A. K., Fritts, D. C., Janches, D., Wright, C. J., and Moffat-Griffin, T.: Radar observations of winds, waves and tides in the mesosphere and lower thermosphere over South Georgia island (54° S, 36° W) and comparison with WACCM simulations, Atmos. Chem. Phys., 22, 9435–9459, https://doi.org/10.5194/acp-22-9435-2022, 2022. a
Hocking, W., Fuller, B., and Vandepeer, B.: Real-time determination of meteor-related parameters utilizing modern digital technology, J. Atmos. Sol.-Terr. Phys., 63, 155–169, https://doi.org/10.1016/S1364-6826(00)00138-3, 2001. a
Hocking, W. K.: A new approach to momentum flux determinations using SKiYMET meteor radars, Ann. Geophys., 23, 2433–2439, https://doi.org/10.5194/angeo-23-2433-2005, 2005. a
Hocking, W. K. and Thayaparan, T.: Simultaneous and colocated observation of winds and tides by MF and meteor radars over London, Canada (43° N, 81° W), during 1994–1996, Radio Sci., 32, 833–865, https://doi.org/10.1029/96RS03467, 1997. a
Igarashi, K., Nishimuta, I., Murayama, Y., Tsuda, T., Nakamura, T., and Tsutsumi, M.: Comparison of wind measurements between Yamagawa MF Radar and the MU Radar, Geophys. Res. Lett., 23, 3341–3344, https://doi.org/10.1029/96GL03241, 1996. a
John, S. R., Kumar, K. K., Subrahmanyam, K. V., Manju, G., and Wu, Q.: Meteor radar measurements of MLT winds near the equatorial electro jet region over Thumba (8.5° N, 77° E): comparison with TIDI observations, Ann. Geophys., 29, 1209–1214, https://doi.org/10.5194/angeo-29-1209-2011, 2011. a, b, c
Jones, J., Webster, A. R., and Hocking, W. K.: An improved interferometer design for use with meteor radars, Radio Sci., 33, 55–65, https://doi.org/10.1029/97RS03050, 1998. a
Killeen, T. L., Wu, Q., Solomon, S. C., Ortland, D. A., Skinner, W. R., Niciejewski, R. J., and Gell, D. A.: TIMED Doppler Interferometer: Overview and recent results, J. Geophys. Res.-Space, 111, A10S01, https://doi.org/10.1029/2005JA011484, 2006. a, b, c, d
Kishore Kumar, G., Nesse Tyssøy, H., and Williams, B. P.: A preliminary comparison of Na lidar and meteor radar zonal winds during geomagnetic quiet and disturbed conditions, J. Atmos. Sol.-Terr. Phys., 168, 70–79, https://doi.org/10.1016/j.jastp.2018.01.010, 2018. a
Lima, L. M., Batista, P. P., Clemesha, B. R., and Takahashi, H.: 16-day wave observed in the meteor winds at low latitudes in the southern hemisphere, Adv. Space Res., 38, 2615–2620, https://doi.org/10.1016/j.asr.2006.03.033, 2006. a
Lima, L. M., Paulino, A. R. S., Medeiros, A. F., Buriti, R. A., Batista, P. P., Clemesha, B. R., and Takahashi, H.: First observation of the diurnal and semidiurnal ocillation in the mesospheric winds over São João do Cariri-PB, Brazil, Rev. Brasil. Geofis., 25, 35–41, https://doi.org/10.1590/S0102-261X2007000600005, 2007. a
Niciejewski, R., Wu, Q., Skinner, W., Gell, D., Cooper, M., Marshall, A., Killeen, T., Solomon, S., and Ortland, D.: TIMED Doppler Interferometer on the Thermosphere Ionosphere Mesosphere Energetics and Dynamics satellite: Data product overview, J. Geophys. Res.-Space, 111, A11S90, https://doi.org/10.1029/2005JA011513, 2006. a, b, c
Paulino, A., Batista, P., and Clemesha, R.: Lunar tides in the mesosphere and lower thermosphere over Cachoeira Paulista (22.7° S; 45.0° W), J. Atmos. Sol.-Terr. Phys., 78/79, 31–36, https://doi.org/10.1016/j.jastp.2011.04.018, 2012. a
Paulino, A., Batista, P., Lima, L., Clemesha, B., Buriti, R., and Schuch, N.: The lunar tides in the mesosphere and lower thermosphere over Brazilian sector, J. Atmos. Sol.-Terr. Phys., 133, 129–138, https://doi.org/10.1016/j.jastp.2015.08.011, 2015. a
Qiao, L., Chen, G., Zhang, S., Yao, Q., Gong, W., Su, M., Chen, F., Liu, E., Zhang, W., Zeng, H., Cai, X., Song, H., Zhang, H., and Zhang, L.: Wuhan MST radar: technical features and validation of wind observations, Atmos. Meas. Tech., 13, 5697–5713, https://doi.org/10.5194/amt-13-5697-2020, 2020. a
Skinner, W. R., Niciejewski, R. J., Killeen, T. L., Solomon, S. C., Gablehouse, D., Wu, Q., Ortland, D., Gell, D. A., Marshall, A. R., Jr., E. W., Cooper, M., and Kafkalidis, J. F.: Operational performance of the TIMED Doppler Interferometer (TIDI), in: Optical Spectroscopic Techniques and Instrumentation for Atmospheric and Space Research V, edited by: Larar, A. M., Shaw, J. A., and Sun, Z., Vol. 5157, 47–57, International Society for Optics and Photonics, SPIE, Proc. SPIE 5157, https://doi.org/10.1117/12.503727, 2003. a
Smith, A. K.: Global Dynamics of the MLT, Surv. Geophys., 33, 1177–1230, https://doi.org/10.1007/s10712-012-9196-9, 2012. a
Su, C. L., Chen, H. C., Chu, Y. H., Chung, M. Z., Kuong, R. M., Lin, T. H., Tzeng, K. J., Wang, C. Y., Wu, K. H., and Yang, K. F.: Meteor radar wind over Chung-Li (24.9° N, 121° E), Taiwan, for the period 10–25 November 2012 which includes Leonid meteor shower: Comparison with empirical model and satellite measurements, Radio Sci., 49, 597–615, https://doi.org/10.1002/2013RS005273, 2014. a, b
Xu, J., Smith, A. K., Liu, H.-L., Yuan, W., Wu, Q., Jiang, G., Mlynczak, M. G., Russell III, J. M., and Franke, S. J.: Seasonal and quasi-biennial variations in the migrating diurnal tide observed by Thermosphere, Ionosphere, Mesosphere, Energetics and Dynamics (TIMED), J. Geophys. Res.-Atmos., 114, D13107, https://doi.org/10.1029/2008JD011298, 2009. a, b, c, d