the Creative Commons Attribution 4.0 License.
the Creative Commons Attribution 4.0 License.
 | 25 Feb 2025
Evaluating F10.7 and F30 radio fluxes as long-term solar proxies of energy deposition in the thermosphere
Liying Qian
Kalevi Mursula
We use model simulations and observations to examine how well the F10.7 and F30 solar radio fluxes have represented solar forcing in the thermosphere during the last 60 years of weakening solar activity. We found that increased saturation of radio fluxes during the last two extended solar minima leads to an overestimation of solar energy deposition, which manifests as a change in the linear relation between thermospheric parameters and F10.7. On the other hand, the linear relation between thermospheric parameters and F30 remains nearly the same throughout the whole studied period because of a recently found relative increase of F30 with respect to F10.7. This explains the earlier finding that F30 correlates better with several ionospheric and thermospheric parameters than F10.7 during recent decades. We note that continued evaluation is needed to see how well F10.7 and F30 will serve as solar proxies in the future when solar activity may start increasing toward the next grand maximum.
- Article
(5333 KB) - Full-text XML
- BibTeX
- EndNote


The solar radio flux at 10.7 cm, F10.7, is a solar activity parameter which is widely used in observational and modeling studies of the thermosphere and ionosphere, serving as a proxy of solar extreme ultra-violet (EUV) irradiance in studies of space climate and space weather. For example, it is used in the MSIS series of empirical models of the thermosphere (Emmert et al., 2021, and references therein) and in the empirical solar irradiance EUVAC model (Richards et al., 1994). EUVAC is widely used to parameterize solar spectral irradiance input in upper-atmospheric general circulation models such as the Thermosphere–Ionosphere–Electrodynamics General Circulation Model (TIE-GCM; Richmond et al., 1992; Qian et al., 2014); the Thermosphere–Ionosphere–Mesosphere–Electrodynamics General Circulation Model (TIME-GCM; Roble and Ridley, 1994); the Whole Atmosphere Community Climate Model with thermosphere and ionosphere eXtension (WACCM-X; Liu et al., 2018); the Global Ionosphere Thermosphere Model (GITM; Ridley et al., 2006); the Coupled Thermosphere Ionosphere Plasmasphere electrodynamics model (CTIPe; Fuller-Rowell and Rees, 1980; Millward et al., 2001); and the NOAA operational space weather forecast model, the Whole Atmosphere Model-Ionosphere Plasmasphere Electrodynamics (WAM-IPE; Fuller-Rowell et al., 2008; Fang et al., 2016, 2018) model.
However, some recent studies have suggested that the F30 flux, the solar radio flux at 30 cm, is a better solar proxy than the F10.7 flux in representing the long-term solar EUV irradiance impact in the thermosphere and ionosphere system. For example, using accelerometer data from the Gravity field and steady-state Ocean Circulation Explorer (GOCE; November 2009–October 2013), the Gravity Recovery and Climate Experiment (GRACE; April 2003–December 2015), and Stella (January 2000–April 2013), Dudok de Wit and Bruinsma (2017) found that the F30 flux improves the response of the thermospheric density to solar forcing in the Drag Temperature Model (DTM; Bruinsma et al., 2012; Bruinsma, 2015), with the model bias dropping on average by 0 %–20 % and the standard deviation of the bias being 15 %–40 % smaller than when using the F10.7 flux. This improved performance is achieved for all three density datasets, covering both solar cycle minimum and maximum conditions. In addition, based on analysis of changes in F2-layer parameter data, several research groups have found that F30 is better than F10.7 in representing F2 parameters. Using the ionospheric foF2 and foE parameters of four European stations with long (1976–2014) data series, Lastovicka (2019) found that the dependence of yearly averaged values of foF2 on F10.7 changed over time, being steeper in 1996–2014 than in 1976–1995. Using the foF2 parameters of 11 ionospheric stations in four continents over 1976–2014, Laštovička and Burešová (2023) further found that among the six studied solar activity proxies including sunspot number, F10.7, F30, Mg II, He II, and H Lyman-α flux, the F30 flux is the best solar proxy to explain the variability of foF2 at middle latitudes. In addition, the dependence of foF2 on F10.7 and sunspot number was found to be significantly steeper in 1996–2014 than in 1976–1995, whereas the dependence of foF2 on F30 was the same in both intervals. Danilov and Berbeneva (2024) also found that F30 is the best solar proxy to describe the seasonally dependent local-time variation of foF2.
When studying the performance of F10.7 and F30 as solar EUV proxies in the thermosphere and ionosphere, it is necessary to understand their origin and mutual relationship. Mursula et al. (2024) analyzed solar radio flux observations from two independent observatories, the Penticton (Canada) F10.7 flux and four long-term radio fluxes from the Nobeyama National Astronomical Observatory of Japan. They found that there is a systematic, long-term relative increase in all five radio fluxes (originating in the upper chromosphere and low corona) with respect to the sunspot number (photosphere) during the decay of the Modern Maximum from solar cycle 20 to solar cycle 24. Also, other chromospheric parameters like the MgII index were found to increase with respect to sunspots. In addition, the fluxes of longer radio waves (from higher altitudes) were found to increase with respect to the shorter radio waves (from lower altitudes). For example, F30 increased relative to F10.7 during this period. Mursula et al. (2024) concluded that there is a relative difference in the long-term evolution between the photosphere and the upper solar atmosphere (chromosphere and low corona), as well as between different altitudes of the upper solar atmosphere. This differential long-term evolution in the solar atmosphere due to the weakening solar activity during the decay of the Modern Maximum may offer an explanation to why the F30 flux performs more consistently as a solar EUV proxy than the F10.7 flux. Note that the study periods of those other recent studies mentioned above include the time when the largest relative change between the different solar proxies was found by Mursula et al. (2024).
Considering the wide usage of the F10.7 flux in ionosphere–thermosphere (I-T) science, as well as in space weather and space climate applications, it is imperative that we understand the long-term evolution of the F10.7 flux and how well it really represents solar EUV forcing over multi-decadal timescales. In this paper, we take an interdisciplinary approach to examine how well the F10.7 and F30 fluxes represent solar EUV forcing in the thermosphere over multi-decadal timescales when the highly active Modern Maximum (with the peak in cycle 19) was decaying to a much lower activity level (∼ 1961–2023). We will conduct this investigation using model simulations of the upper atmosphere and analyzing related observational data.
2.1 NCAR global mean model
The upper-atmospheric model used in this study is a global mean version of the National Center for Atmospheric Research (NCAR) TIME-GCM (Roble et al., 1987; Roble and Ridley, 1994; Roble, 1995). The solar irradiance input (0–175 nm) and the solar EUV energy deposition scheme are described in Solomon and Qian (2005). Solar EUV spectral irradiance is based on the EUVAC model, which is parameterized using the daily F10.7 value and the 81 d averaged value of F10.7 (Solomon and Qian, 2005). For simplicity, hereafter, we refer to the solar irradiance input in this model as the EUVAC model.
We conducted two model runs under identical conditions, with one key difference: one run utilized the actual observed F10.7 flux, while the other employed F30∗, which is the F30 flux scaled to the F10.7 level using the relation F30∗ = (Dudok de Wit and Bruinsma, 2017; Yaya et al., 2017). It is important to note that F30∗ retains the temporal variability of the F30 flux but aligns with the magnitude of the F10.7 flux, allowing it to be used in the EUVAC model, which is based on F10.7. Geomagnetic activity was kept constant at a relatively low level (Ap = 4) to eliminate the influence of geomagnetic variability. Additionally, CO2 concentrations were based on the same time-varying measurements from the Mauna Loa Observatory (Qian et al., 2006) in both runs, ensuring that the long-term thermospheric cooling due to increasing CO2 concentration was consistent in both model runs. Thus, the differences between the two runs stem from the use of F10.7 versus F30∗.
2.2 Penticton F10.7 and Nobeyama F30 radio flux data
The NOAA F10.7 flux index covers the time from the start of continuous 10.7 cm measurements (1947) until the end of April 2018, when the NOAA stopped the index production. We continued the NOAA F10.7 flux from May 2018 onward using the recent Penticton radio flux data available from the NRCan server, as described in more detail in Mursula (2023). NRCan provides daily F10.7 flux from 28 October 2004 to present.
Continuous solar radio flux observations in Japan started in the early 1950s (Shimojo and Iwai, 2023). Observations are made at four frequencies (1, 2, 3.75, and 9.4 GHz; corresponding to wavelengths 30, 15, 8, and 3.2 cm, to be called F30, F15, F8, and F3.2) in Nobeyama, Japan. Note that the observed daily solar radio fluxes are modulated by the level of solar activity and by the changing distance between the Sun and the Earth due to eccentricity of the Earth's orbit. Since the NCAR TIME-GCM considers solar irradiance variations due to the varying Sun–Earth distance, the F10.7 and F30 fluxes presented in this paper and input to the model are adjusted radio fluxes, which are the observed radio fluxes corrected for the varying Sun–Earth distance, given at the fixed distance of one astronomical unit (AU). The unit of F10.7 and F30 is solar flux unit (sfu), and 1 sfu = 10−22 . Note that provisional solar radio flux data (with data quality flag = 1) are excluded in our data analysis.
2.3 Satellite-drag-derived thermospheric mass density
The satellite-drag-derived thermospheric mass density dataset is a long-term dataset of globally averaged thermospheric mass density derived from orbit data of about 7700 objects in a low-Earth orbit, affected by atmospheric drag (Emmert et al., 2021). The data cover the years 1967–2019 and altitudes 250–575 km. The temporal resolution is 3–4 d for most years. These data are suitable for climatological studies of thermospheric density variations and trends and for space weather studies on timescales longer than 3 d.
2.4 NASA GOLD Qeuv data
The GOLD instrument is on board the SES-14 communication satellite, which was launched on 25 January 2018. The satellite is located on a geostationary orbit at 47.5° W. The GOLD far ultraviolet (FUV) imager observes the Earth's FUV airglow at 134–162 nm, including the OI 135.6 nm and N2 Lyman–Birge–Hopfield (LBH) bands. We will use the current version of Qeuv (L2 version 4; Correira et al., 2021) in this study. Qeuv () is a measure of solar extreme ultraviolet (EUV) energy flux into the I-T system in the wavelength band from 1 to 45 nm, derived from the GOLD FUV observations (see Eastes et al., 2020, for more details).
Figure 1a shows daily solar radio fluxes F10.7 (in black), F30 (in red), and F30∗ (the scaled F30, in cyan) from 1961–2019. Figure 1b shows the ratio of the 81 d averaged F30∗ and F10.7 and its linear fit. It is evident that during this period, F30∗ increased with respect to F10.7. Mursula et al. (2024) conducted a detailed analysis of the long-term evolution of radio fluxes, showing that both F30 and F15 increased with respect to F10.7 from the 1960s to the 2010s (see Fig. 5 of Mursula et al., 2024). They also found that F30 increases with respect to F15 (measured by the same instrument as F30), which excludes the possibility that the relative drift of F10.7 and F30 is due to an instrumental defect.
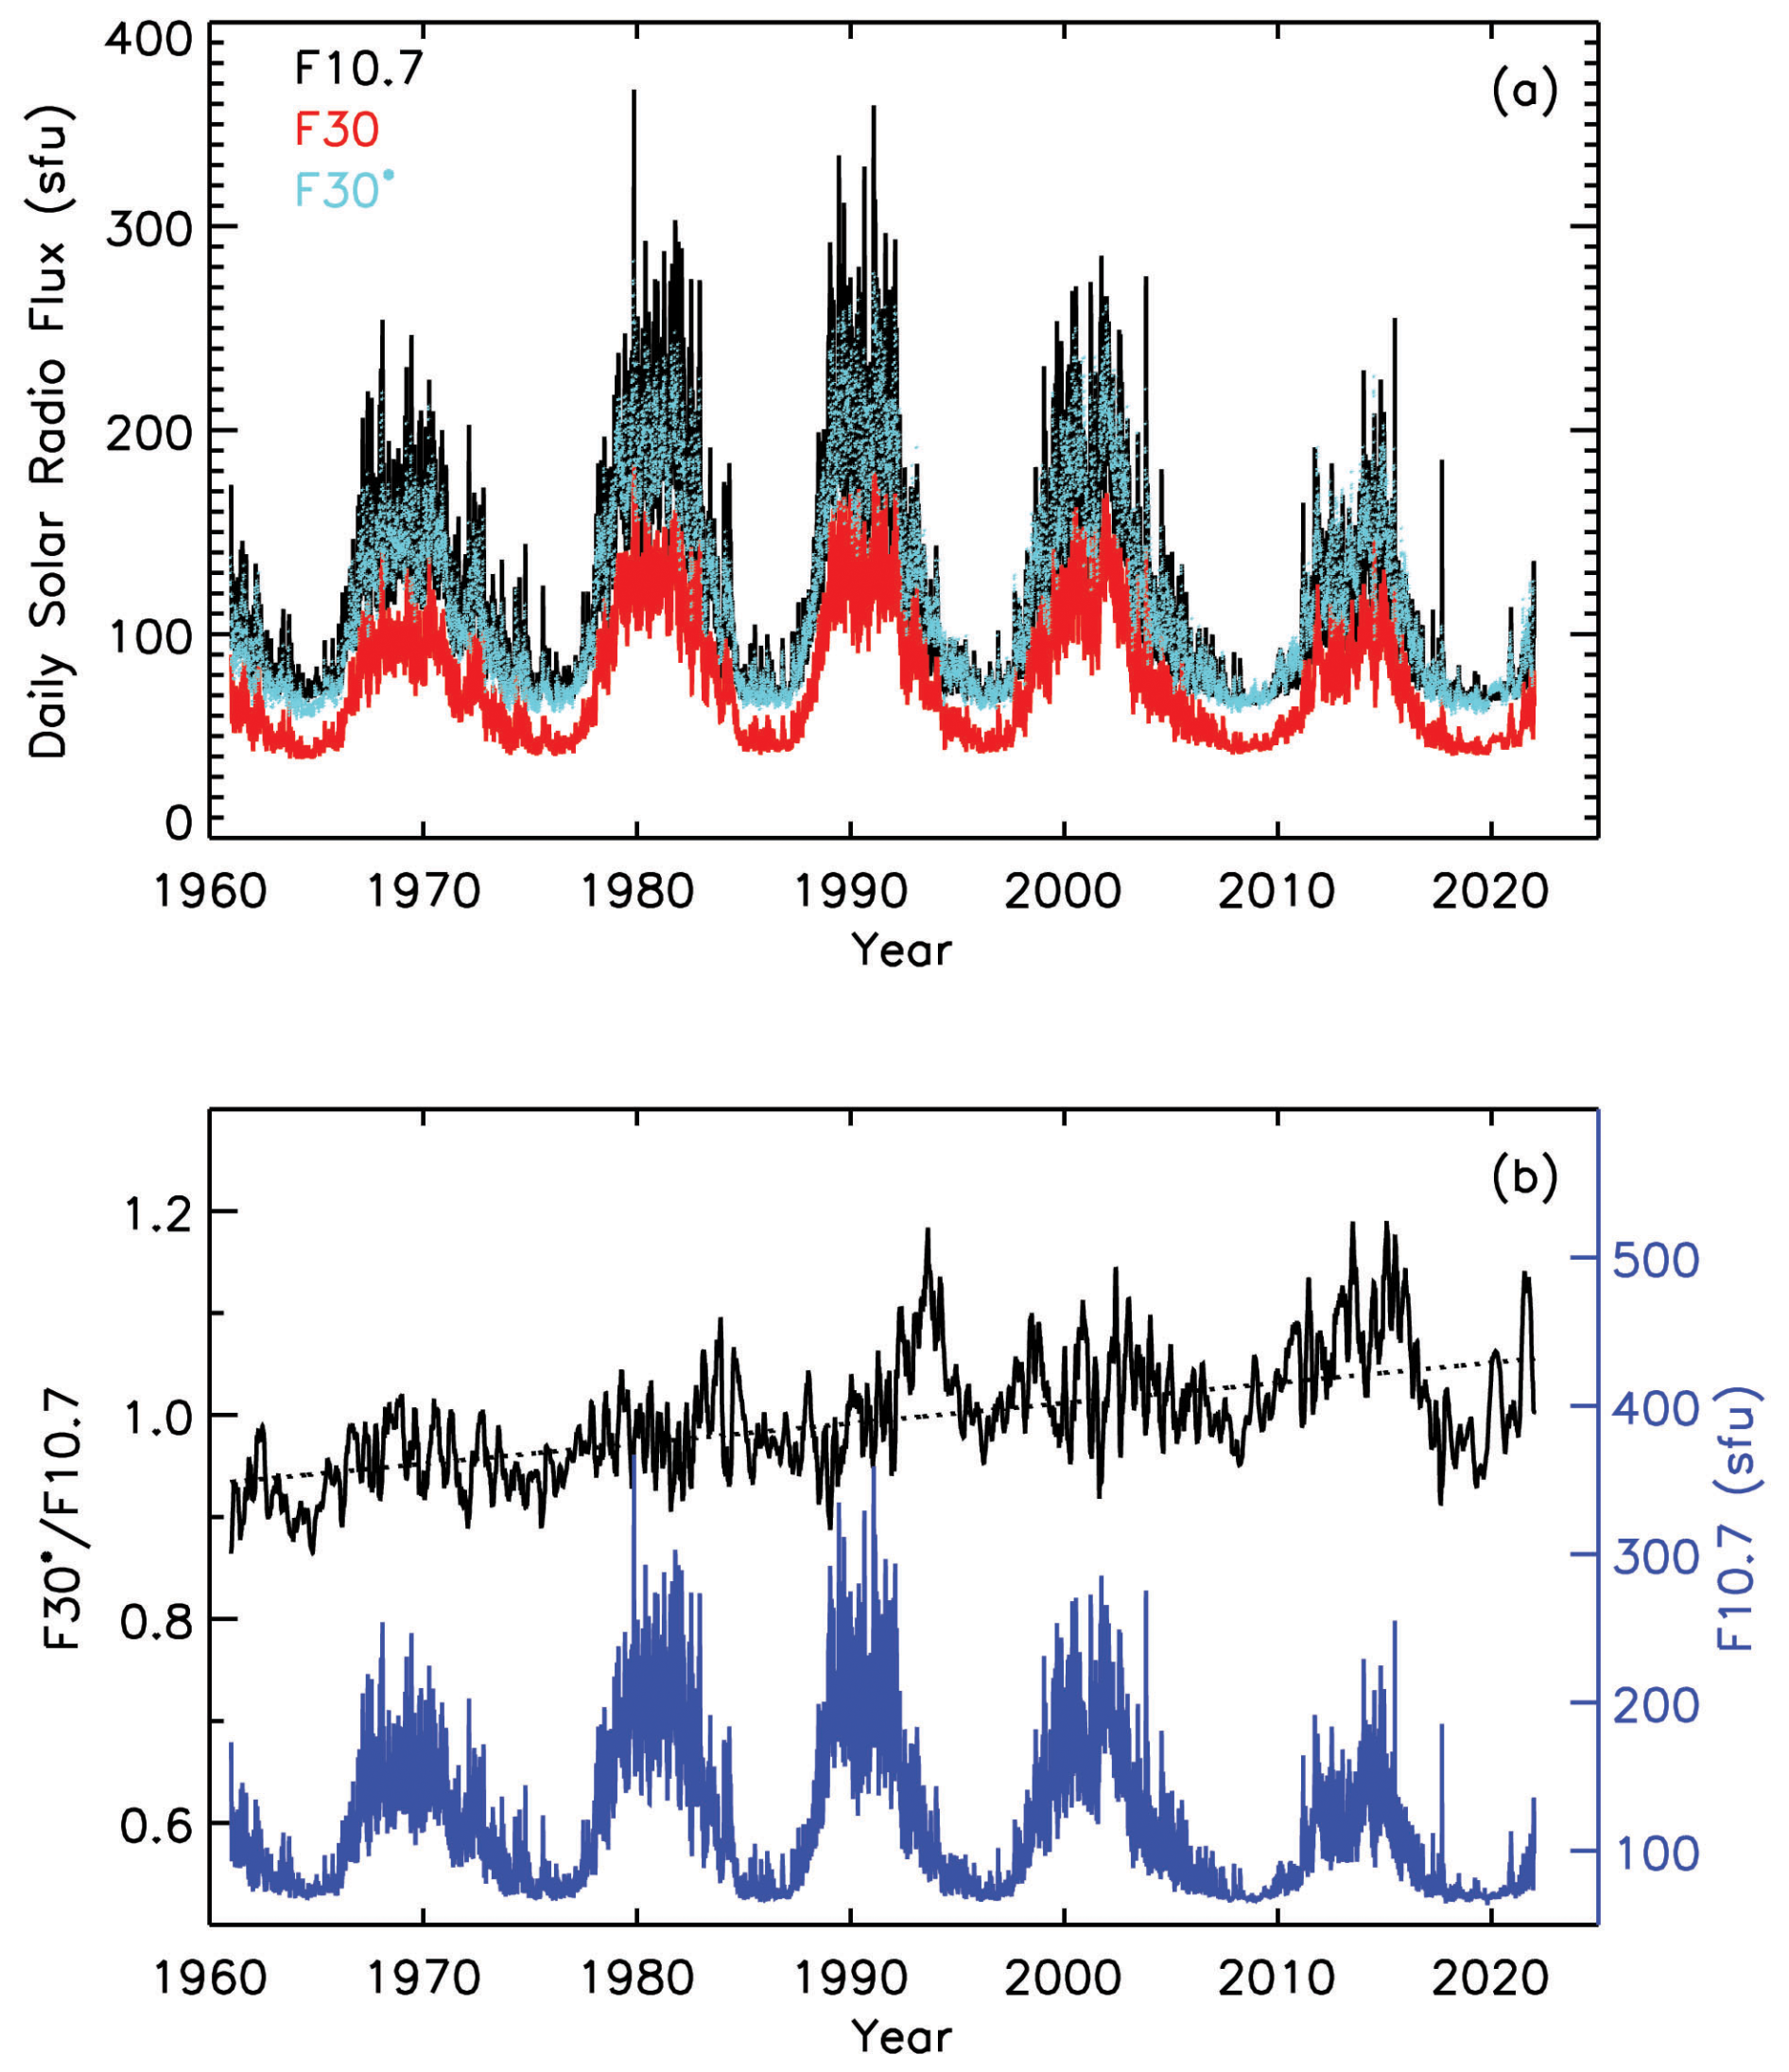
Figure 1(a) Black: daily solar radio fluxes F10.7; red: F30; cyan: F30∗ (scaled F30, F30∗ = ). (b) Black: ratio of the 81 d averaged F30∗ and F10.7; dotted black line: linear fit to the ratio; blue: daily F10.7 for reference.
We conducted two model simulations using the global mean version of the NCAR TIME-GCM model (Roble et al., 1987; Roble and Ridley, 1994). The two model simulations are the same except that one simulation used the standard EUVAC solar proxy model (Richards et al., 1994) for solar irradiance input, which uses the F10.7 flux, while in the other simulation we replaced the F10.7 flux by the F30∗ flux in the EUVAC model. Figure 2a shows the 365 d running mean of daily global averaged mass density at 400 km (1961–2019 for the simulated densities, 1967–2019 for the satellite drag derived mass density): mass density derived from satellite drag data in black, simulated mass density using the F10.7 flux in blue, and simulated mass density using the F30∗ flux in red. The simulated densities reproduce the solar cycle variability of the observational data closely. However, there are notable quantitative differences during both solar maximum and minimum periods.
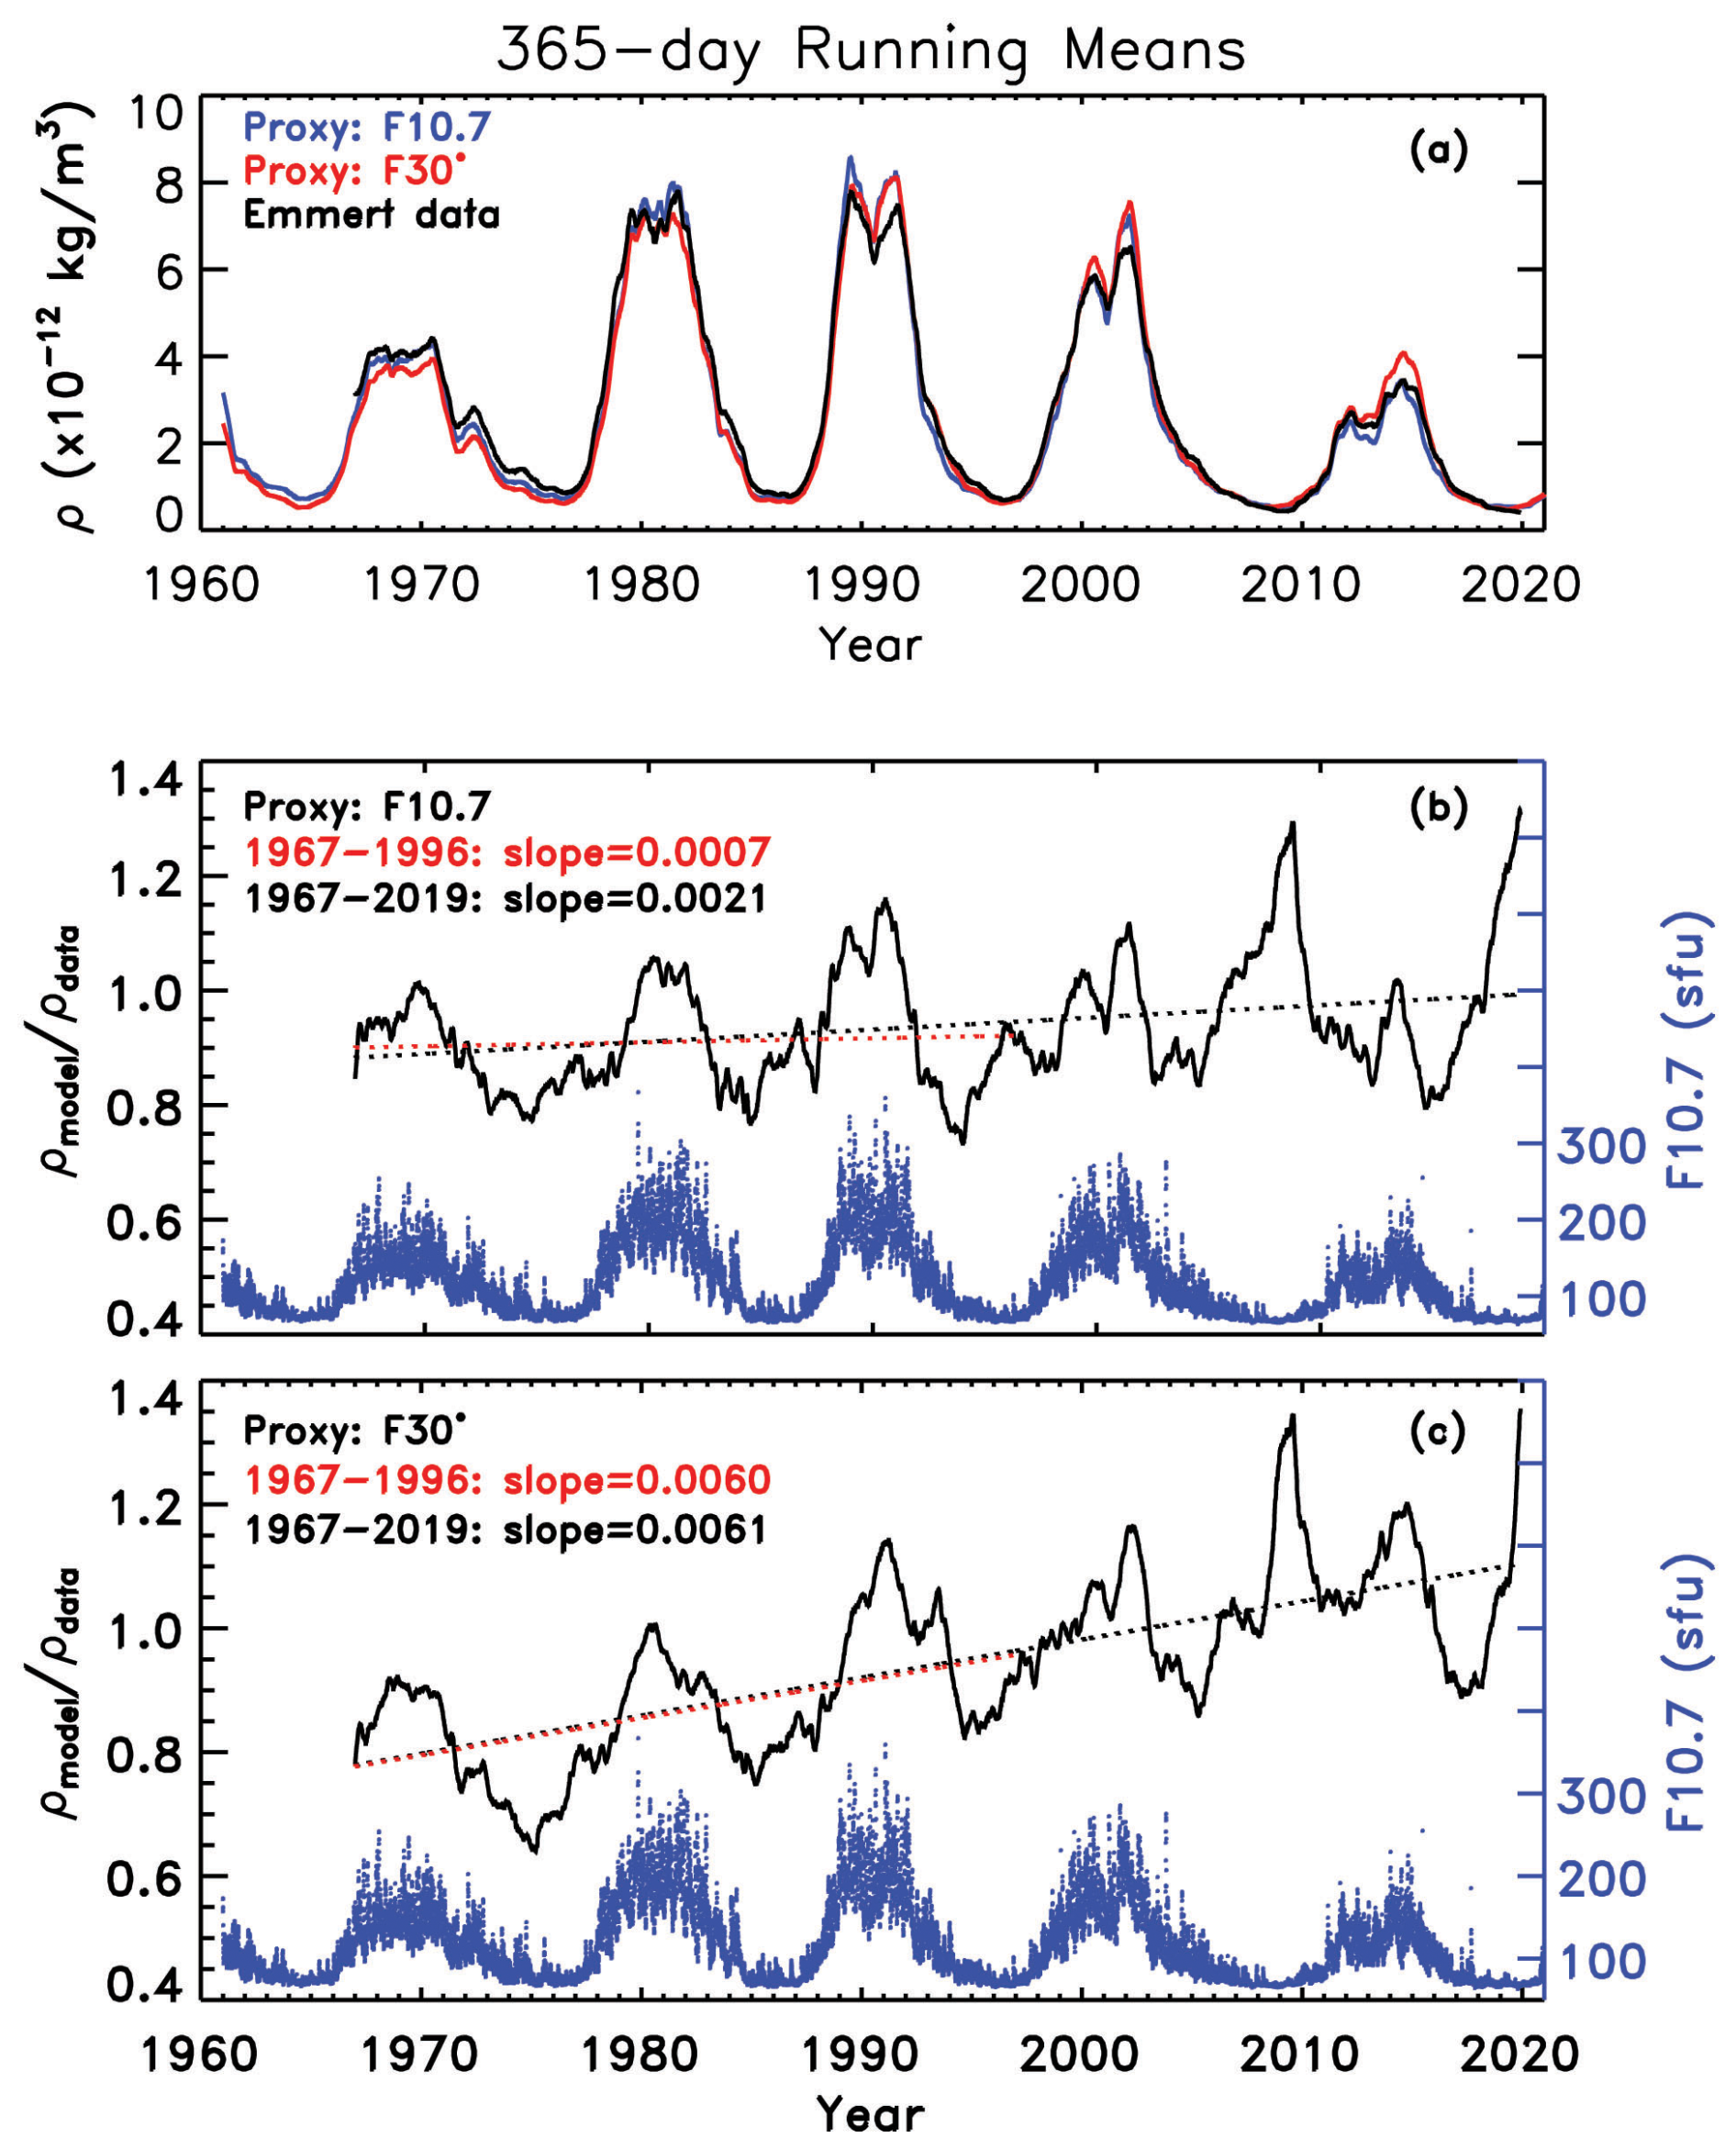
Figure 2(a) The 365 d running means of the daily and globally averaged mass density at 400 km. Black: mass density derived from satellite drag data; blue: simulated mass density using F10.7 as a solar EUV proxy; red: simulated mass density using F30∗ as a solar EUV proxy. (b) Solid black: mass density ratio of the simulated density using F10.7 as a solar EUV proxy to the density derived from satellite drag; dotted red line: linear fit to the mass density ratio from 1967–1996; dotted black line: linear fit to the mass density ratio from 1967–2019; blue: daily F10.7 for reference. (c) Same as panel (b) but for the case with the simulated mass density using F30∗ as a solar EUV proxy.
To better evaluate the difference between the simulated and observed mass densities, we calculated the ratios of the simulated and observed mass densities. The mass density values are the 365 d running mean of daily global averaged mass densities at 400 km from Fig. 2a. Figure 2b shows the ratio of the mass densities using the F10.7 flux in simulation. The linear slope (k=0.0021) for the entire period 1967–2019 is significantly larger than the linear slope (k=0.0007) for the earlier period 1967–1996, indicating that there is a change in the linear relation between the mass density ratio and F10.7 around the minimum between cycles 22 and 23. The F-test statistics for these two linear regressions are 1851 and 44, indicating that the linear fittings are statistically significant (in F test, if F > 2.5, then we can reject the null hypothesis). Note the upward linear slope in the density ratio between simulated and orbit-derived mass density for the period 1967–2019 in Fig. 2b and c does not describe the long-term effect caused by increasing CO2 concentrations. Both the simulated and the orbit-derived mass densities include the trend driven by the rising CO2 level, and model simulations incorporate the time-varying CO2 concentrations measured at the Mauna Loa Observatory (Qian et al., 2006). Moreover, Emmert (2015) demonstrated that the height dependence of orbit-derived mass-density trends agree with model simulations of the impact of increasing CO2. The larger slope (about 0.0021) of the F10.7 model for the longer period 1967–2019 arises because the F10.7 model is unable to explain the very small density during the unusually low solar minima of 2008–2009 and 2019–2020 because of enhanced saturation of the F10.7 flux. This will be discussed further later.
The change of the linear relation between the density ratio and F10.7 after approximately 1996 in Fig. 2b is consistent with the change of the slope of the linear relation between foF2 and F10.7 (see Fig. 2 in Laštovička, 2019). Note also that the observed density is used to calculate the ratios of densities and to normalize the simulated densities for solar cycle variability. From the 1960s to about 1996, the ratio fluctuated roughly in phase with the solar cycle, indicating that the model relatively overestimates the mass density during solar maxima but underestimates it during solar minima. Since the simulated densities using F10.7 (F30∗) reflect solar irradiance energy deposition represented by F10.7 (F30∗), the slope between the simulated densities normalized by the observed densities and time can reveal how well F10.7 and F30∗ serve as proxies for solar irradiance energy input for the thermosphere over this several decades period.
Figure 2c shows the ratio of the simulated mass density to the drag derived mass density from 1967 to 2019, using F30∗ in simulation. The linear slope of the ratio throughout the whole period from 1967 to 2019 (0.0061) is almost unchanged from the linear slope for the earlier period of 1967–1996 (0.0060). Note that the F-test statistics for these two linear regressions are 17 809 and 3254, indicating that the linear fittings are statistically significant. The constancy of slopes is consistent with Laštovička and Burešová (2023), who demonstrated that the dependence of the yearly averaged foF2 on F10.7 is significantly steeper in 1996–2014 than in 1976–1995, whereas for F30 the two intervals provide no significant difference.
The change of the linear slope of the density ratio after about 1996 shown in Fig. 2b can be explained by increased saturation of the F10.7 flux during the extremely low solar activity minima of 2008–2009 and 2019–2020. It is known that the F10.7 flux does not decrease below a certain minimum value of about 67, which comes from thermal emission of radio waves (see Tapping and Morgan, 2017), even when solar EUV activity continues to decrease. Figure 2b shows that, during these two extended solar minima, the simulated mass density breaks the pattern of underestimating mass density at solar minima. Rather, it significantly overestimates the mass density compared to the observed density. This happens because of the increased saturation of the F10.7 flux during these two extended minima when solar activity was very low during a longer time than in earlier minima. On the other hand, the observed mass density continues to decrease as the actual solar EUV activity continues to decline. The overestimation of the simulated mass density at these two solar minima leads to the change of the density ratio slope after solar cycle 22 seen in Fig. 2b. Note also that the ratio in Fig. 2b always reaches its cycle minimum in the declining phase rather than at the exact minimum, where it always has a local maximum, even during the minima before the two extended minima. This indicates that saturation has occurred at all solar minima but has remained unnoticed during the earlier, shorter minima and only become evident during the longer and weaker minima of the 2000s and 2010s (e.g., Elias et al., 2023).
This raises a question: why does the linear slope of the density ratio in Fig. 2c not show a similar clear change as the ratio in Fig. 2b? Note first that the ratio in Fig. 2c also depicts high maxima during the two extended minima in 2008–2009 and 2019–2020, while the cycle maxima in earlier cycles were found at solar maxima, similarly to Fig. 2b. However, conversely to Fig. 2b, the ratio in Fig. 2c has an upward slope during the whole period depicted in Fig. 2c. It is clear that this increasing trend is not due to the increased saturation during the last two minima. This raises another question: why does the density ratio for the simulated density using F30∗ (Fig. 2c) have a continuously upward slope, whereas the ratio using F10.7 (Fig. 2b) is nearly flat during the first part of the studied interval in solar cycles 20, 21, and 22?
Recall that the solar irradiance input for the NCAR global mean model is via EUVAC, which is based on the F10.7 flux (Richards et al., 1994). The period from the peak of the Modern Maximum in solar cycle 19 through solar cycle 22 does not have extended (extremely low or long) solar minima, so the ratio of the simulated density and the observed density fluctuates around a constant without a trend. As discussed above, the linear slope of the density ratio in Fig. 2b changed after solar cycle 22 because of increased saturation of the F10.7 flux during the extended solar minima of 2008–2009 and 2019–2020. This increased the minimum-time ratio above 1, which made the linear slope turn upward. In the case of the ratio using F30∗ (Fig. 2c), since F30 increases with respect to F10.7 during the whole period (Mursula et al., 2024; see also Fig. 1b), the simulated mass density using F30∗ also increases in time compared to the simulation using F10.7, thus producing an upward slope in the F30∗ ratio, which persists during the whole period. The increased saturation during the extended minima affects also F30∗, but its effect on the slope of the F30∗ ratio in Fig. 2c remains rather small. This explains why the slope of the F30∗ model to observation ratio in Fig. 2c depicted no significant change but, rather, remained fairly stable during the whole period of 1967–2019.
The linear relation between thermospheric mass density and F30∗ remains almost the same during the whole studied period of 1967–2019, but it has an upward slope. However, for an optimum proxy of solar irradiance in upper atmosphere models, the slope of the density ratio should be zero, as seen for F10.7 until 1996 (Fig. 2b), at most only fluctuating around 1. To achieve this goal, a solar proxy model similar to the EUVAC needs to be developed based on the F30 flux. However, this calibration project is beyond the scope of this paper.
Next, we use another new thermospheric dataset to verify the above findings. Figure 3a shows the GOLD daily mean Qeuv data from October 2018 to 2023 in blue, the daily F10.7 flux in black, and the daily F30∗ flux in red. Note that there have been observation interruptions of F30 due to instrumental issues at Nobeyama since 2020. These data gaps have been filled by the “solar radio flux for orbit determination: nowcast and forecast” project of the Collecte Localisation Satellites (CLS) using the expectation–maximization interpolation method described in Dudok de Wit (2011) (for further details, see https://spaceweather.cls.fr/services/radioflux/, last access: 19 February 2025).
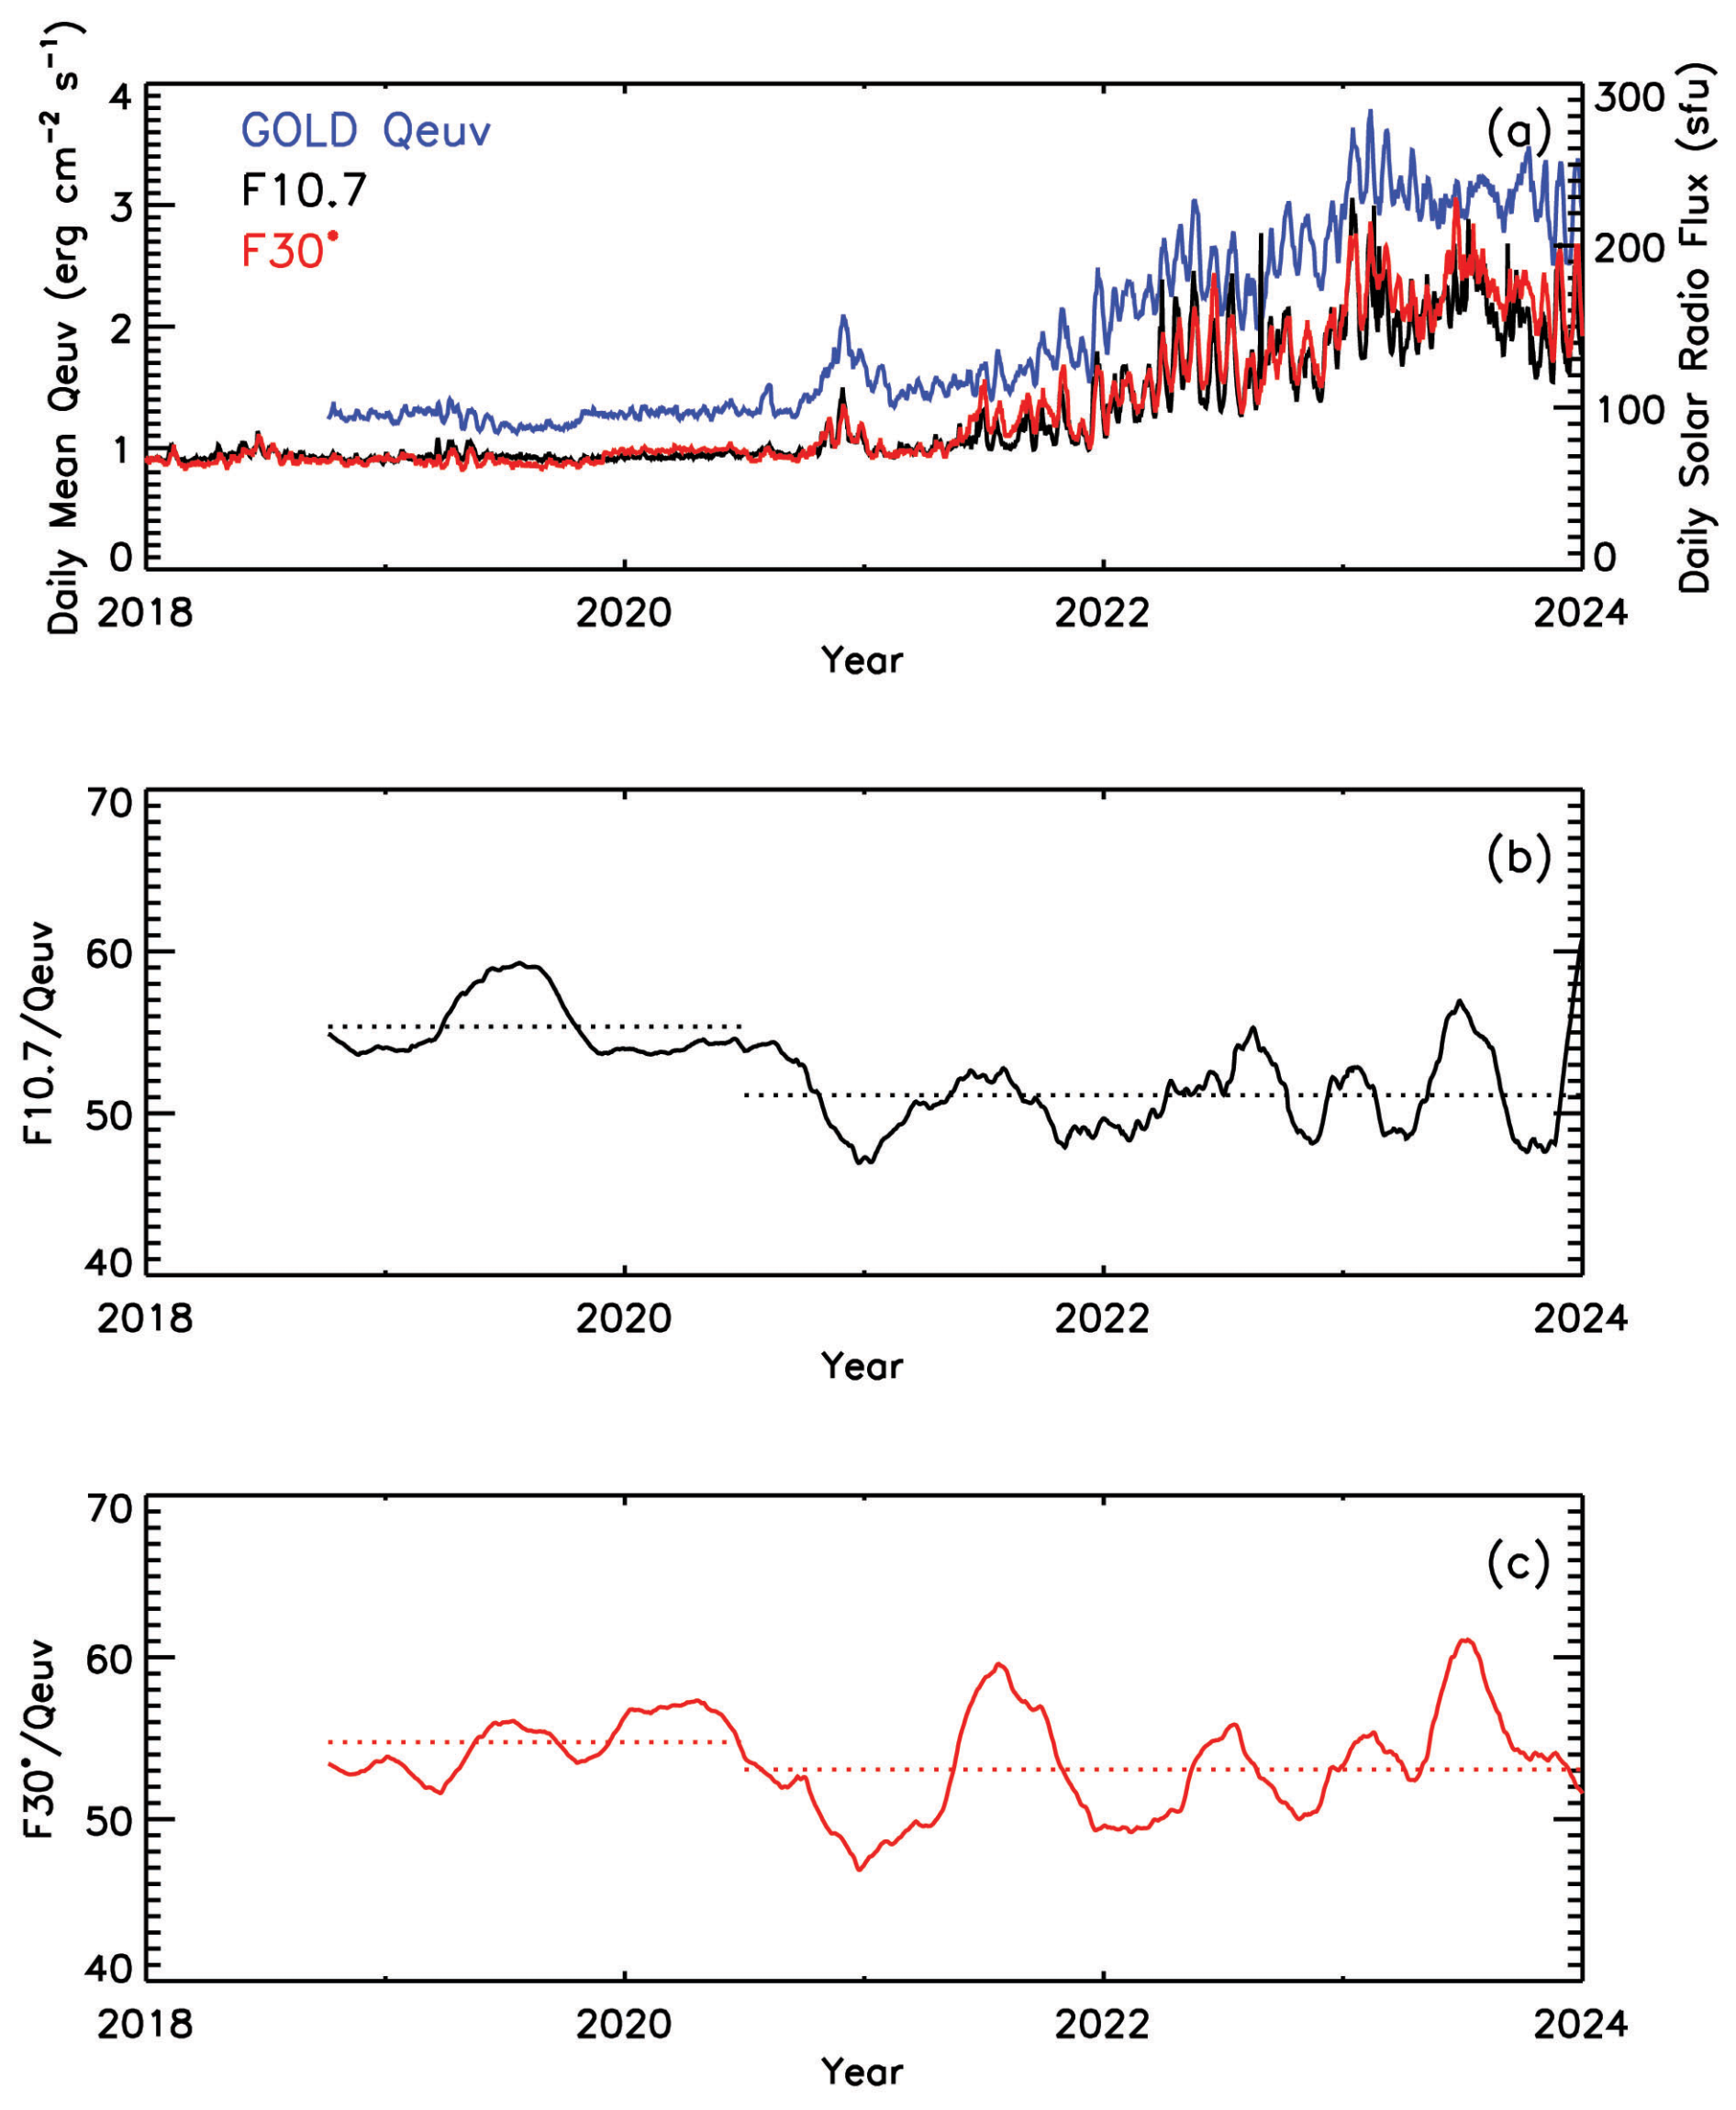
Figure 3(a) Blue: GOLD daily mean Qeuv; black: daily F10.7; red: daily F30∗. (b) Solid black line: ratio of the 81 d averaged F10.7 and Qeuv; dotted black lines: the mean ratios for the periods of the extended minimum (late 2018 to first half of 2020) and after the extended minimum (second half of 2020 to 2023). (c) Solid red line: ratio of the 81 d averaged F30∗ and Qeuv; dotted red lines: the mean ratios for the periods of the extended minimum (late 2018 to first half of 2020) and after the extended minimum (second half of 2020 to 2023).
Qeuv is derived from NASA GOLD FUV airglow data and represents the integrated solar EUV energy between 1 and 45 nm incident on the upper atmosphere (Correira et al., 2021). Figure 3b shows the ratio of the 81 d averaged F10.7 flux to the 81 d averaged Qeuv in black from October 2018 to December 2023. Figure 3b shows that the F10.7 / Qeuv ratio is unstable in time, being consistently at a larger level from the start of the ratio in October 2018 to the first half of 2020 (average ratio of 55) compared to the rest of the time interval when the ratio oscillates at a considerably lower average level (average ratio of 51). The first interval is exactly the solar minimum period of the later extended minimum when solar activity was extremely low. This verifies that the observed F10.7 flux during this minimum time is larger than the actual solar EUV forcing represented by GOLD Qeuv.
On the other hand, the ratio between the 81 d average F30∗ and the 81 d averaged Qeuv in Fig. 3c remains more stable in time. The mean value of this ratio during the first interval from October 2018 to June 2020 (average ratio of 55) is somewhat larger than its mean during the latter period (average ratio of 53). Accordingly, this ratio was raised by a factor of about 4 % during the extended minimum. This is considerably less than for the F10.7 flux (a factor of about 8 %), which supports the above result that the F30 flux is more suitable to be used as a solar EUV proxy in thermospheric modeling. Since the effect of increased saturation to F30∗ during the extended minima is rather small, its effect on the slope of the F30∗ ratio in Fig. 2c also remains rather small, explaining why the slope of the ratio of the F30∗ model to observations in Fig. 2c depicted no significant change but, rather, remained fairly stable in time. This gives further evidence that F30 can more consistently represent the solar EUV energy deposition in the thermosphere better than F10.7 during the last several decades of weakening solar activity.
The recent solar minima in 2008–2009 and in 2019–2020, together with the intervening low solar cycle 24, may reproduce a similar centennial solar minimum as found earlier for 1810–1830 and 1900–1910 (Feynman and Ruzmaikin, 2014). They suggested that such long minima are minima related to Gleissberg cyclicity, a roughly 100-year quasi-periodic variation observed in sunspot activity, in the solar wind, in geomagnetic activity, and throughout the heliosphere. The Modern Maximum is only the most recent repetition of this periodicity, and the last 60 years studied here, from the maximum of solar cycle 19 to the extended minimum in 2008–2009, forms the decay phase of this latest Gleissberg cycle. Since then, with cycle 25 exceeding the activity of cycle 24, the Sun may be slowly transitioning into the growth phase of the next Gleissberg cycle, the Future Maximum (Mursula, 2023).
A smaller fraction of solar radio flux is generated in sunspots, while a larger fraction is produced in active regions (chromospheric plages) (Schonfeld et al., 2015). The frequency of radio waves produced in the active regions depends on local plasma density. Shorter (longer) radio waves are produced in more dense (rarefied, respectively) regions at a somewhat lower (higher) altitude in the solar atmosphere. As argued by Mursula et al. (2024), the observed relative increase of the flux of longer radio waves with respect to shorter radio waves can be explained by a less rapid cooling of the longer waves due to a larger volume compression in the canopy structure of solar magnetic field lines. This evolution of the solar radio fluxes and other solar parameters (Mursula et al., 2024) indicates that, as the overall solar activity weakens during the decay of the Modern Maximum, the solar parameters being produced at different mean heights of solar atmosphere vary slightly but systematically differently.
So, how will these relations evolve in the future? As solar cycles will very likely start growing again, the extended minima will turn more normal, and saturation will decrease. Consequently, the relation of F10.7 with the EUV flux (and thermospheric mass density) will be temporally more stable, and the current EUVAC model based on F10.7 can be used. However, it is expected (Mursula et al., 2024) that, with increasing solar activity, the mutual relation of F10.7 and F30 will very likely be opposite to that seen during the decay of the Modern Maximum. Then, F30 would decrease with respect to F10.7. In view of these interesting forecasts, we believe that it is necessary to continue evaluating these relations between thermospheric–ionospheric parameters and radio fluxes during the coming decades.
In this study we found the following results:
-
Minimum-time saturation of the F10.7 flux as a solar EUV proxy remained unnoticed until it increased and became evident during the extended solar minima in 2008–2009 and 2019–2020. Models based on the F10.7 flux have overestimated the solar irradiance energy deposition in the thermosphere because of this increased saturation. We demonstrated this in a change of the linear relation between the modeled and observed thermospheric density during the last 60 years, when solar activity is weakening in the decay of the Modern Maximum.
-
F30 increases with respect to F10.7 during this period, so the simulated mass density using F30∗ also increases in time compared to the simulation using F10.7, thus producing an upward slope in the ratio of F30∗-modeled and observed densities. Increased saturation during the extended minima also affects F30∗, but its effect on the slope of the F30∗ ratio remains rather small. Consequently, the linear relation between thermospheric mass density simulated using F30∗ and observed density remains stable during the whole period of 1967–2019. This explains the earlier finding that F30 has correlated better with several ionospheric and thermospheric parameters than F10.7 during recent decades.
-
However, because the F30 flux increases relative to the F10.7 flux from the 1960s until 2010s (Mursula et al., 2024) and because the thermospheric models are calibrated to use the F10.7 flux, the models using F30 correlated to F10.7 show a continuous increase, which needs to be removed by recalibrating models to use the F30 index.
Future work includes the following:
-
A solar proxy model will be developed, similar to the EUVAC but based on the F30 flux. This would enable using F30 as a long-term consistent solar irradiance proxy in upper atmosphere and whole atmosphere models.
-
It will continue to be evaluated how the F10.7 and F30 fluxes will succeed as solar EUV proxies for the thermosphere and ionosphere in the future, during the expected increase of solar activity in future solar cycles (Mursula, 2023). This entails, for example, continued efforts in evaluating the relation between different thermospheric-ionospheric parameters and solar radio fluxes.
Solar radio flux data are available from the Collecte Localisation Satellites (CLS) website at https://spaceweather.cls.fr/services/radioflux/ (CLS, 2025). The thermosphere mass density dataset is available at https://map.nrl.navy.mil/map/pub/nrl/orbit_derived_density/ (Emmert, 2021). GOLD (Global-scale Observations of the Limb and Disk) Qeuv data from 5 October 2018 onward are available at https://gold.cs.ucf.edu/data/search/ (GOLD, 2025). The NetCDF and IDL SAV data used to produce the figures in this paper, including both model simulation and observational data (Qian, 2024), are available at the National Center for Atmospheric Research Geoscience Data Exchange Repository via https://doi.org/10.5281/zenodo.13909713 (Qian and Mursula, 2024).
LQ carried out numerical model simulations and model–data comparisons. KM analyzed solar radio fluxes. LQ and KM decided on the contents and key points of the manuscript.
At least one of the (co-)authors is a guest member of the editorial board of Annales Geophysicae for the special issue “Long-term trends in the stratosphere–mesosphere–thermosphere–ionosphere system”. The peer-review process was guided by an independent editor, and the authors also have no other competing interests to declare.
Publisher's note: Copernicus Publications remains neutral with regard to jurisdictional claims made in the text, published maps, institutional affiliations, or any other geographical representation in this paper. While Copernicus Publications makes every effort to include appropriate place names, the final responsibility lies with the authors.
This article is part of the special issue “Long-term trends in the stratosphere–mesosphere–thermosphere–ionosphere system”. It is a result of the 12th International Workshop on Long-Term Changes and Trends in the Atmosphere (TRENDS 2024), Ourense, Spain, 6–10 May 2024.
The authors acknowledge the financial support of the NASA and the National Science Foundation. We would like to acknowledge high-performance computing support provided by NCAR's Computational and Information Systems Laboratory, sponsored by the National Science Foundation.
This research has been supported by the National Aeronautics and Space Administration (grant nos. 80NSSC20K0189, 80NSSC19K0278, 80NSSC19K0835, and 80NSSC21K1315). National Center for Atmospheric Research is a major facility sponsored by the National Science Foundation under cooperative agreement no. 1852977.
This paper was edited by Jan Laštovička and reviewed by three anonymous referees.
Bruinsma, S.: The DTM-2013 thermosphere model, J. Space Weather Spac., 5, A1, https://doi.org/10.1051/swsc/2015001, 2015.
Bruinsma, S. L., Sánchez-Ortiz, N., Olmedo, E., and Guijarro, N.: Evaluation of the DTM-2009 thermosphere model for benchmarking purposes, J. Space Weather Spac., 2, A04, https://doi.org/10.1051/swsc/2012005, 2012.
Collecte Localisation Satellites (CLS): Solar radio flux for orbit determination: nowcast and forecast, https://spaceweather.cls.fr/services/radioflux/, last access: 19 February 2025.
Correira, J., Evans, J. S., Lumpe, J. D., Krywonos, A., Daniell, R., Veibell, V., McClintock, W. E., and Eastes, R. W.: Thermospheric composition and solar EUV flux from the Globalscale Observations of the Limb and Disk (GOLD) mission, J. Geophys. Res.-Space, 126, e2021JA029517, https://doi.org/10.1029/2021JA029517, 2021.
Danilov, A. D. and Berbeneva, N. A.: Dependence of foF2 on Solar Activity Indices Based on the Data of Ionospheric Stations of the Northern and Southern Hemispheres, Geomagn. Aeron.+, 64, 224–234, https://doi.org/10.1134/S0016793223601035, 2024.
Dudok de Wit, T.: A method for filling gaps in solar irradiance and solar proxy data, Astron. Astrophys., 533, A29, https://doi.org/10.1051/0004-6361/201117024, 2011.
Dudok de Wit, T. and Bruinsma, S.: The 30 cm radio flux as a solar proxy for thermosphere density modelling, J. Space Weather Spac., 7, A9, https://doi.org/10.1051/swsc/2017008, 2017.
Eastes, R. W., McClintock, W. E., Burns, A. G., Anderson, D. N., Andersson, L., Aryal, S., Budzien, S. A., Cai, X., Codrescu, M. V., Correira, J. T., Daniell, R. E., Dymond, K. F., England, S. L., Eparvier, F. G., Evans, J. S., Foroosh, H., Gan, Q., Greer, K. R., Karan, D. K., Krywonos, A., Laskar, F. I., Lumpe, J. D., Martinis, C. R., McPhate, J. B., Oberheide, J., Siegmund, O. H., Solomon, S. C., Veibel, V., and Woods, T. N..: Initial Observations by the GOLD Mission, J. Geophys. Res.-Space, 125, e27823, https://doi.org/10.1029/2020JA027823, 2020.
Elias, A. G., Martinis, C. R., de Haro Barbas, B. F., Medina, F. D., Zossi, B. S., Fagre, M., and Duran, T.: Comparative analysis of extreme ultraviolet solar radiation proxies during minimum activity levels, Earth Planet. Phys., 7, 540–547, https://doi.org/10.26464/epp2023050, 2023.
Emmert, J. T.: Altitude and solar activity dependence of 1967–2005 thermospheric density trends derived from orbital drag, J. Geophys. Res.-Space, 120, 2940–2950, https://doi.org/10.1002/2015JA021047, 2015.
Emmert, J. T., Orbit derived density, U.S. Naval Research Laboratory [data set], https://map.nrl.navy.mil/map/pub/nrl/orbit_derived_density/ (last access: 19 February 2025), 2021.
Emmert, J. T., Dhadly, M. S., and Segerman, A. M.: A globally averaged thermospheric density data set derived from two-line orbital element sets and special perturbations state vectors, J. Geophys. Res.-Space, 126, e2021JA029455, https://doi.org/10.1029/2021JA029455, 2021.
Fang, T.-W., Akmaev, R., Stoneback, R. A., Fuller-Rowell, T., Wang, H., and Wu, F.: Impact of midnight thermosphere dynamics on the equatorial ionospheric vertical drifts, J. Geophys. Res.-Space, 121, 4858–4868, 2016.
Fang, T.-W., Fuller-Rowell, T., Yudin, V., Matsuo, T., and Viereck, R.: Quantifying the sources of ionosphere day-to-day variability, J. Geophys. Res.-Space, 123, 9682–9696, https://doi.org/10.1029/2018JA025525, 2018.
Feynman, J. and Ruzmaikin, A.: The Centennial Gleissberg Cycle and its association with extended minima, J. Geophys. Res.-Space, 119, 6027–6041, https://doi.org/10.1002/2013JA019478, 2014.
Fuller-Rowell, T. J. and Rees, D.: A three-dimensional, timedependent model of the thermosphere, J. Atmos. Sci., 37, 2545—2567, 1980.
Fuller-Rowell, T. J., Akmaev, R., Wu, F., Anghel, A., Maruyama, N., Anderson, D. N., Codrescu, M. V., Iredell, M., Moorthi, S., Juang, H.-M., Hou, Y.-T., and Millward, G.: Impact of terrestrial weather on the upper atmosphere, Geophys. Res. Lett., 35, L09808, https://doi.org/10.1029/2007GL032911, 2008.
GOLD: Qeuv data, https://gold.cs.ucf.edu/data/search/, last access: 19 February 2025.
Lastovicka, J.: Is the relation between ionospheric parameters and solar proxies stable?, Geophys. Res. Lett., 46, 14208–14213, https://doi.org/10.1029/2019GL085033, 2019.
Laštovička, J. and Burešová, D.: Relationships between foF2 and various solar activity proxies, Space Weather, 21, e2022SW003359, https://doi.org/10.1029/2022SW003359, 2023.
Liu, H.-L., Bardeen, C. G., Foster, B. T., Lauritzen, P., Liu, J., Lu, G., Marsh, Daniel R., Maute, A., McInerney, J. M., Pedatella, N. M., Qian, L., Richmond, A. D., Roble, R. G., Solomon, S. C., Vitt, Francis M., and Wang, W.: Development and validation of the Whole Atmosphere Community Climate Model with thermosphere and ionosphere extension (WACCM-X 2.0), J. Adv. Model. Earth Sy., 10, 381–402, https://doi.org/10.1002/2017MS001232, 2018.
Millward, G. H., Müller-Wodrag, I. C. F., Aylward, A. D., Fuller-Rowell, T. J., Richmond, A. D., and Moffett, R. J.: An investigation into the influence of tidal forcing on F region equatorial vertical ion drift using a global ionosphere-thermosphere model with coupled electrodynamics, J. Geophys. Res., 106, 24733–24744, https://doi.org/10.1029/2000JA000342, 2001.
Mursula, K.: Hale cycle in solar hemispheric radio flux and sunspots: Evidence for a northward shifted relic field, Astron. Astrophys., 674, A182, https://doi.org/10.1051/0004-6361/202345999, 2023.
Mursula, K., Pevtsov, A. A., Asikainen, T., Tähtinen, I., and Yeates, A.: Transition to a weaker Sun: Changes in the solar atmosphere during the decay of the Modern maximum, Astron. Astrophys., 685, A170, https://doi.org/10.1051/0004-6361/202449231, 2024.
Qian, L.: Evaluating F10.7 and F30 Radio Fluxes as Long-Term Solar Proxies of Energy Deposition in the Thermosphere, Zenodo [data set], https://doi.org/10.5281/zenodo.13909713, 2024.
Qian, L. and Mursula, K.: Evaluating F10.7 and F30 Radio Fluxes as Long-Term Solar Proxies of Energy Deposition in the Thermosphere, Version 1.0, Zenodo [data set], https://doi.org/10.5281/zenodo.13909713, 2024.
Qian, L., Roble, R. G., Solomon, S. C., and Kane, T. J.: Calculated and observed climate change in the thermosphere, and a prediction for solar cycle 24, Geophys. Res. Lett., 33, L23705, https://doi.org/10.1029/2006GL027185, 2006.
Qian, L., Burns, A. G., Emery, B. A., Foster, B., Lu, G., Maute, A., Richmond, A. D., Roble, R. G., Solomon, S. C., and Wang, W.: The NCAR TIE-GCM: A community model of the coupled thermosphere/ionosphere system, in: Modeling the Ionosphere–Thermosphere System, edited by: Joseph Huba, J., Schunk, R., and Khazanov, G., AGU Geophysical Monographs, American Geophysical Union, https://doi.org/10.1002/9781118704417.ch7, 2014.
Richards, P. G., Fennelly, J. A., and Torr, D. G.: EUVAC: A solar EUV flux model for aeronomic calculations, J. Geophys. Res., 99, 8981–8992, https://doi.org/10.1029/94JA00518, 1994.
Richmond, A. D., Ridley, E. C., and Roble, R. G.: A thermosphere/ionosphere general circulation model with coupled electrodynamics, Geophys. Res. Lett., 19, 601–604, 1992.
Ridley, A. J., Deng, Y., and Toth, J.: The global ionosphere–thermosphere model, J. Atmos. Sol.-Terr. Phy., 68, 839–864, 2006.
Roble, R. G.: Energetics of the mesosphere and thermosphere, in: The Upper Mesosphere and Lower Thermosphere: A Review of Experiment and Theory, edited by: Johnson, R. M. and Killeen, T. L., Geophys. Monogr. Ser., vol. 87, p. 1, AGU, Washington, DC, ISBN: 0-87590-044-5TS24, 1995.
Roble, R. G., Ridley, E. C., and Dickinson, R. E.: On the global mean structure of the thermosphere, J. Geophys. Res., 92, 8745–8758, https://doi.org/10.1029/JA092iA08p08745, 1987.
Schonfeld, S. J., White, S. M., Henney, C. J., Arge, C. N., and McAteer, R. T. J.: Coronal Sources of the Solar F10.7 Radio Flux, Astrophys. J., 808, 29, https://doi.org/10.1088/0004-637X/808/1/29, 2015.
Shimojo, M. and Iwai, K.: Over seven decades of solar microwave data obtained with Toyokawa and Nobeyama Radio Polarimeters, Geosci. Data J., 10, 114–129, https://doi.org/10.1002/gdj3.165, 2023.
Solomon, S. C. and Qian, L.: Solar extreme-ultraviolet irradiance for general circulation models, J. Geophys. Res., 110, A10306, https://doi.org/10.1029/2005JA011160, 2005.
Tapping, K. and Morgan, C.: Changing Relationships Between Sunspot Number, Total Sunspot Area and F10.7 in Cycles 23 and 24, Sol. Phys., 292, 73, https://doi.org/10.1007/s11207-017-1111-6, 2017.
Yaya, P., Hecker, L., de Wit, T. D., Le Fèvre, C., and Bruinsma, S.: Solar radio proxies for improved satellite orbit prediction, J. Space Weather Spac., 2017, A35, A335, 2017.