the Creative Commons Attribution 4.0 License.
the Creative Commons Attribution 4.0 License.
 | 12 Feb 2025
Statistical analysis of magnetopause response during substorm phases
Tuija I. Pulkkinen
We investigate variations in the position of the magnetopause in response to the interplanetary magnetic field (IMF) and different phases of magnetospheric substorms. The average location of the magnetopause is examined using magnetic field observations from multiple satellites (Time History of Events and Macroscale Interactions during Substorms, THEMIS; Radiation Belt Storm Probes, RBSP; and Magnetospheric Multiscale, MMS), and the Shue model utilizing OMNI solar wind data for a period of 5 years, from 2016–2020. We estimate the average position of the magnetopause using the Shue model through superposed epoch analysis of the standoff distance and tail flaring angle at different substorm timings (onset, peak, and end) and from in situ measurements through 2D equatorial maps of average BZ under IMF conditions. We found that southward IMF is associated with a greater number of substorms compared to northward IMF orientations. Our analysis highlights a very small movement of the magnetopause during substorm phases for both northward and southward IMF orientations (). Notably, magnetopause experiences inward movement, reaching its closest point to the Earth, particularly during the substorm growth phase followed by a relaxation from the substorm peak to the recovery end. The empirical model provides an accurate estimation of the magnetopause location during periods of both northward and southward IMF as the model curve traverses a distinct location representing the magnetopause shown in the 2D average map of observed BZ.
- Article
(1709 KB) - Full-text XML
- BibTeX
- EndNote


The magnetopause is the boundary of the Earth’s magnetosphere which separates the magnetic cavity from the surrounding plasma environment. The location of the magnetopause is determined by the pressure balance between the magnetospheric magnetic field and the solar wind. The magnetopause is not stationary, being strongly influenced by the solar wind dynamic pressure (Chapman and Ferraro, 1931), interplanetary magnetic field (IMF) orientation and strength (Fairfield, 1971; Shue et al., 1997, 1998), and dipole tilt angle (Liu et al., 2012). The solar wind pressure changes move the magnetopause, sometimes to inside the geosynchronous orbit (∼6.6 RE, RE being the Earth's radius) (Cahill and Winckler, 1999). Furthermore, strongly southward IMF leads to inward motion of the magnetopause due to magnetic flux erosion from the dayside magnetopause via magnetic reconnection and during periods of sharp increases in solar wind dynamic pressure (Tsyganenko and Sibeck, 1994). However, reconnection only causes minimal inward motion as the thickness of the subsolar magnetopause is typically only a few hundred kilometers thick (Paschmann et al., 2018).
Several models parameterize the magnetopause location and shape by solar wind and IMF parameters (Chao et al., 2002; Fairfield, 1971; Sibeck et al., 1991; Lin et al., 2010; Liu et al., 2015; Nguyen et al., 2022, and references therein). Shue et al. (2000) reviewed many magnetopause models and compared the differences among them for extreme solar wind conditions and their limitations. Shue et al. (1997) studied the magnetopause location using in situ magnetopause crossings by multiple satellites to construct an empirical model that incorporates the influence of solar wind dynamic pressure and IMF BZ on controlling the location and shape of the magnetopause.
Wang et al. (2018) studied the effects of IMF north–south orientation and upstream solar wind dynamic pressure on the location of the magnetopause and bow shock using a global magnetohydrodynamics (MHD) model. They found that during southward IMF and high solar wind pressure, increased reconnection moves the magnetopause earthward and outward for positive IMF BZ. They also conclude that the effect of dynamic pressure on magnetopause location is more prominent than those due to the IMF orientation changes. Lu et al. (2011) constructed a magnetopause model through global MHD calculations and observed that IMF BZ primarily influences the magnetopause shape with minor effects on standoff distance. In contrast, the solar wind dynamic pressure predominantly affects the magnetopause standoff distance with minimal impact on the magnetopause shape.
Substorms are dynamic and transient phenomena that play a crucial role in the Earth's magnetosphere, storing solar wind energy and then releasing it through an explosive process (Baker et al., 1996). Substorms represent a key dynamic cycle in the solar wind–magnetosphere–ionosphere system, with the coupling involving the intensification of auroral currents (Akasofu, 1964). Several studies have proposed that substorms are triggered by changes in the solar wind driver: while substorm onsets are often followed by an interval of southward IMF (Kokubun, 1972), northward turnings of the IMF can also be responsible for triggering substorms (Mcpherron et al., 1986; Sergeev et al., 1986). Wild et al. (2009) concluded that substorm onsets occur following a southward turning of the IMF and at least a 20 min interval of sustained southward IMF. Furthermore, Hsu (2003) considered changes in IMF BY, dynamic pressure, and IMF BZ changes and concluded that majority of the substorms are triggered by IMF BZ change, while a rather small number are triggered by IMF BY rotation or change in dynamic pressure and some substorms have no identifiable external trigger (Henderson et al., 1996). Aubry et al. (1970) observed the inward motion of magnetopause and its relation to an increase in the tail flux and substorm onset using satellite observations. They found earthward motion of magnetopause during reversal of IMF BZ from northward to southward just prior to substorm onset which continues for 2 h with the magnetopause moving inward up to 2 RE.
In this paper, we present a statistical investigation of the average location of the magnetopause for northward–southward IMF during different phases of substorms. Focusing on a period of 5 years, from 2016–2020, we use satellite observations from Radiation Belt Storm Probes (RBSP) (Mauk et al., 2013), Time History of Events and Macroscale Interactions during Substorms (THEMIS) (Angelopoulos, 2008), and Magnetospheric Multiscale (MMS) (Burch et al., 2016), which provide a very good coverage of magnetosphere out to 30 RE in the dayside. We complement the space measurements with data from ground-based magnetometers available from the SuperMAG collaboration (Gjerloev, 2012). For this study period, we identified 5077 isolated substorms from a list of substorm onsets created by Ohtani and Gjerloev (2020). We use superposed epoch analysis to estimate the average standoff distance and tail flaring angle taken from the nonlinear relation given by Shue et al. (1998) in their empirical model for magnetospheric shape and size. We also discuss the application of the Shue model in the estimation of average magnetopause location observed in this study. Section 2 describes the data, Sect. 3 presents the average map of the observed magnetic field in the equatorial plane during substorm phases, and Sect. 4 presents a superposed epoch analysis. Section 5 shows the empirical model by Shue, and Sect. 6 concludes with a discussion of the results.
We examine the magnetospheric signatures of substorms during the interval of 2016–2020, when several (multi-satellite) missions were operational. We use data from the three Time History of Events and Macroscale Structures during Substorms (THEMIS) in near-Earth near-equatorial orbits (apogee ∼12 RE); from the two Radiation Belt Storm Probes (RBSP) in the inner magnetosphere inside of about ∼ 6 RE; and from one of the Magnetospheric Multiscale (MMS) spacecraft in near-equatorial, higher-altitude orbit (apogee ∼25 RE). Although the MMS mission involves four spacecraft, their close formation is such that incorporating observations from more than one spacecraft is not pertinent to this study. The orbits of the RBSP, THEMIS, and MMS satellites are near the equatorial plane, which corresponds to low latitudes. These missions are designed to investigate key processes in the magnetosphere, many of which occur in the near-equatorial plane.
We use magnetic field data from the EMFISIS instrument suite (Kletzing et al., 2013) on board both RBSP-A and RBSP-B spacecraft. We also use spin-averaged magnetic field data from the fluxgate magnetometer (FGM) (Auster et al., 2008) from THEMIS-A, D, and E (excluding THEMIS-B and THEMIS-C, which orbit around the Moon). Magnetic field data from the MMS-1 spacecraft come from the fluxgate magnetometer (Russell et al., 2016). All observations (magnetic field and spacecraft position) used in this study are averaged over 1 min intervals and examined in the geocentric solar magnetospheric (GSM) coordinates.
We use time series of SuperMAG auroral electrojet (SML) index and solar wind and interplanetary magnetic field (IMF) data at 1 min time resolution from the SuperMAG database (https://supermag.jhuapl.edu/indices/, last access: 23 May 2023, Gjerloev, 2012). The solar wind data on the SuperMAG site come from the OMNI database (https://omniweb.gsfc.nasa.gov/). The list of isolated substorm onsets comes from Ohtani and Gjerloev (2020), who identified substorm onsets using the SML index. During the period from 2016 to 2020, there were 5077 substorms identified, and we found the substorm peak times (corresponding to the minimum SML) and end times (when the SML recovers to above −100 nT) (see Kumar et al., 2024, for details).
In order to assess the magnetopause location as a function of the solar wind parameters, we use the formulation introduced by Shue et al. (1998) that gives the position and shape of the magnetopause in the following form:
where r is the radial distance from the Earth and θ is the solar zenith angle computed from the positive XGSM axis. The parameter r0 gives the standoff distance at the subsolar point, and α determines the level of tail flaring.
We examine the external magnetic field using combined datasets from spacecraft (THEMIS-A, D, and E; RBSP-A and B; and MMS-1) during different phases of substorms and for 5 years, 2016–2020. In Fig. 1a–f, the observed magnetic field BZ is represented through color-coded maps. These maps are created by averaging the magnetic field values in 1RE×1RE bins of X and Y. The maps provide visual representations of the variations in field strength within the dayside regions of the Earth. The maps utilize 5 min data of BZ collected prior to the onset (pre-onset), after the substorm peak (post-peak), and before the substorm end (pre-end) for northward IMF (Fig. 1a, c, e) and southward IMF (Fig. 1b, d, f). In Fig. 1, the average BZ is presented in the X–Y (equatorial) plane of magnetosphere during substorm growth (pre-onset), early recovery (post-peak), and late recovery (pre-end) phases for northward IMF (IMF 〈BZ〉>0 nT, Fig. 1a, c, e) and southward IMF (IMF 〈BZ〉<0 nT, Fig. 1b, d, f) separately. The near-equatorial orbits of the spacecraft result in the most comprehensive data coverage being in the equatorial region (see Fig. 2 in Kumar et al., 2024). First, we aggregate magnetic field measurements from all satellites over the 5-year period, resulting in nearly 15 million data points when averaged over 1 min intervals. This magnetic field data are combined with solar wind data, specifically the IMF BZ and dynamic pressure, obtained from the OMNI database and also averaged over 1 min. We utilize a predefined list of substorms and develop an algorithm to identify the time intervals from the onset to the end of each substorm. This approach enables us to compute the average of IMF BZ for each substorm period (from onset to recovery end), offering an insight into the typical value of IMF BZ during each event. We then filter the data based on IMF BZ values, distinguishing between IMF BZ>0 (northward IMF) and IMF BZ<0 (southward IMF). This allows us to estimate the number of substorms occurring under both northward and southward IMF conditions. During the study period from 1 January 2016 to 31 December 2020, we observed a total of 5077 isolated substorms. Of these, the majority of substorms (3458) occurred during periods of southward IMF compared to 1502 substorms during northward IMF. Additionally, 117 substorms occurred independently of any IMF changes. The reason for choosing substorms during northward/southward IMF is that there is a strong correlation between IMF BZ and the occurrence of magnetospheric substorms. The more prolonged and intense the southward IMF BZ, the more energy is transferred into the magnetosphere, leading to more frequent and intense substorms. When the IMF BZ is northward, the probability of substorm occurrence is lower. However, substorms can still occur, often due to other processes or a prior build-up of energy in the magnetotail. In Fig. 1, we illustrate the Earth at the center with a radius of 1 RE. The region within 4 RE around the Earth is masked as we focus on the region outside that distance, and the black circle at 6.6 RE provides a reference to geostationary orbit. Each panel in Figs. 1 and 2 consists of 861 bins, but the number of data points per bin varies. In Fig. 1a, c, e, for northward IMF, the number of data points ranges from 0 (lighter bins) to a maximum of 351 (darker bins). In contrast, Fig. 1b, d, f for southward IMF contain more data points, with counts ranging from 0 to a maximum of 700, reflecting the higher number of substorms during southward IMF periods.
In Fig. 1a, c, e, the black curves are plotted on the average magnetic field BZ maps using the standoff distance (r0) and tail flaring angle (α) obtained from the empirical model by Shue et al. (1998). To plot these black curves, we initially utilize Eqs. (2) and (3) for r0 and α, respectively. We then estimate their average values near all the 5077 substorm onset, peak, and end times from Fig. 3j–o for strong northward IMF, where strong northward IMF is defined as IMF BZ>5. Using average values of r0 and α around all onset, peak, and end times of substorms, we estimate radial distance r from Eq. (1) and finally calculate the positions xs and rs using and . In Fig. 1a, c, e, the black curves representing xs versus rs do pass through the high magnetic field regions (green) within the magnetopause. However, it is important to note that these curves may not accurately represent the average location of the magnetopause. The dashed red curves in Fig. 1a, c, e are plotted exactly in the same manner as black curves but for northward IMF, which is defined as IMF BZ>0. For these curves, we first estimate r0 and α from a figure similar to Fig. 3j–o (not shown) but for northward IMF. The red curves in Fig. 1a, c, e pass very close to the thin boundary between yellow and green, indicating a relatively accurate representation of the average magnetopause location.
Figure 1b, d, f are plotted in the same way as Fig. 1a, c, e, representing a color-coded map of averaged magnetic field BZ from growth to recovery end phases of substorm but for southward IMF (IMF BZ<0). In Fig. 1b, d, f, the magnetopause is clearly identified between yellow and green.
The dashed red curves plotted (same as in Fig. 1a, c, e) using the Shue et al. (1998) model over the averaged magnetic field BZ maps for northward IMF (IMF BZ>0) that pass through the boundary between the yellow and green also confirm (as in the Fig. 1a, c, e) the location of the outer boundary of the magnetosphere. Similar to Fig. 1a, c, e, the plotting of black curves – for strong southward IMF (IMF ) – follows the same methodology.
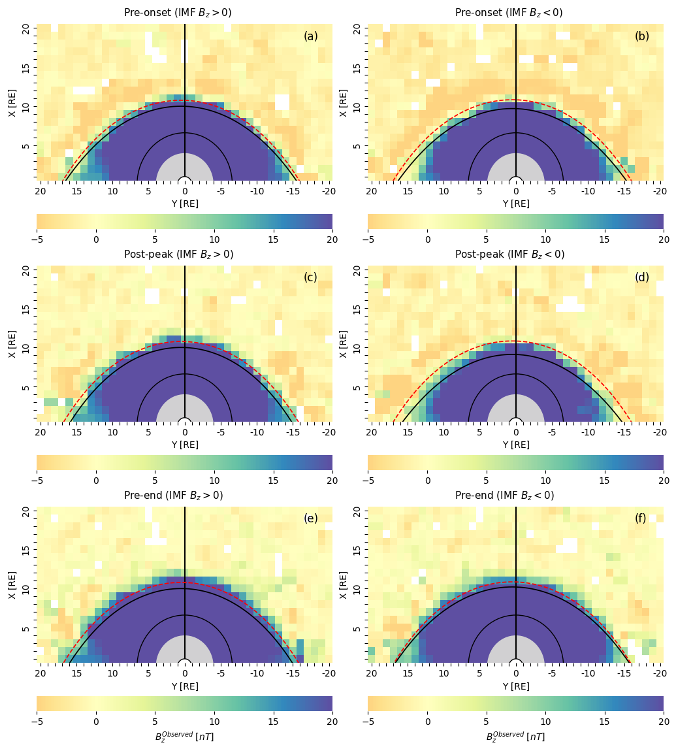
Figure 1Average magnetic field, BZ, in the equatorial plane averaged over 5 min before the substorm onset (pre-onset; a, b), 5 min after the peak (post-peak; c, d), and 5 min before the end (pre-end; e, f) for northward IMF (〈BZ〉 > 0 nT, a, c, e) and southward IMF (〈BZ〉 > 0 nT, b, d, f) are shown separately. The black (dashed red) curves are plotted using the Shue et al. (1998) model with IMF BZ>5(0) nT for northward IMF (left side panels) and with IMF nT for southward IMF (right side panels).
Figure 2 shows difference maps indicating the time evolution of dayside BZ averaged for 1RE×1RE bins in X and Y during substorm onset to peak (pre-peak–pre-onset), around the substorm peak (post-peak–pre-peak), and from the substorm peak to end of the recovery phase (pre-end–post-peak) during northward IMF (〈BZ〉>0) (Fig. 2a, c, e) and southward IMF (〈BZ〉<0) (Fig. 2b, d, f). Each panel shows a color-coded 2D difference map of the 5 min average data of BZ with positive values (indicating an increase in the magnetic field) displayed in red and negative values (indicating a decrease in the magnetic field) shown in blue. The curves (black, dashed cyan) are identical to those in Fig. 1. These curves in the left panels (Fig. 2a, c, e) represent cases with northward IMF, specifically with IMF BZ>5 nT (0 nT), while in the right panels (Fig. 2b, d, f) they depict cases with southward IMF, corresponding to IMF nT (0 nT).
The difference maps for the expansion phase (Fig. 2a, b) demonstrate that during this phase (pre-peak–pre-onset), the magnetic field outside the magnetopause in the magnetosheath increases (shown in red) more prominently in both the northward IMF and the southward IMF case. As the magnetosheath field is created by the shocked IMF, this is an indication of an IMF maximum at the substorm onset time.
The field inside the dayside magnetosphere shows more complex behavior. For northward IMF (Fig. 2a), between the magnetopause and geostationary orbit, the dayside field change is predominantly negative, but inside the geostationary orbit, the field change is mildly positive. This would be consistent with an enhancement of the ring current in that sector, with a field enhancement inside the current peak and field reduction outside of it.
We also point out that there is a bipolar structure with a field increase inside geostationary orbit and a field decrease outside of it in the morning sector (Fig. 2a), and the opposite changes in the evening sector near the terminator.
For the southward IMF case (Fig. 2b), the dayside field is strongly negative under the black (dashed cyan) curve, which could imply a strong ring current enhancement. As the field depression is negative throughout the region, the ring current peak is likely closer to the Earth as particles under southward IMF and stronger convection have access to closer drift paths around the Earth. The bipolar structure is not visible for the southward IMF case.
As the substorm reaches its peak and the recovery starts, the positive field change outlines the magnetopause, indicating an outward motion of the magnetopause (Fig. 2c, d). Other changes inside the magnetosphere are mostly small. The substorm recovery phase (Fig. 2e, f) causes a strong signal around the magnetopause for both northward and southward IMF cases, implying further outward motion (relaxation) of the magnetopause.
For both cases, the dawn and dusk fields are strongly enhanced from inside the geostationary orbit out to the magnetopause.
The field continues to increase around the substorm peak time, with mostly red colors indicating further relaxation. Moreover, the field continues to increase strongly beyond the substorm peak, which is demonstrated by strongly positive (dark red) values during the late recovery phase, as shown by in situ measurements (Fig. 2e, f). However, the Shue magnetopause exhibits a relaxation of the magnetic field (moving outward) from post-peak to pre-end phases, with its position changing from 10.28 to 10.29 RE (Table 1). Although, the outward movement of magnetopause is very small shown in in situ measurements, but the same tendency of outward movement during substorm recovery phase is supported by the Shue model as well.
Figure 2b depicts that from the pre-onset to the pre-peak phase, the dayside magnetic field is not in a relaxed state and experiences a decrease, as indicated by mostly blue colors, and the magnetopause exhibits antisunward motion or compression.
This behavior is the same as shown by the Shue magnetopause, which shows a compression (albeit very small) of the magnetopause from the pre-onset to pre-peak phases, with its position changing from 10.27 to 10.26 RE (Table 1). Around the substorm peak (from the pre-peak to post-peak phases), the field increases, indicated by mostly red colors, signifying slight sunward motion of the magnetopause. This pattern aligns with the empirical model results illustrated in Fig. 1c. The field continues to increase strongly from the substorm peak to the recovery end, as indicated by strongly positive (dark red) values of the magnetic field during the recovery end (Fig. 2e, f). Similarly to the case of a northward IMF, the Shue magnetopause exhibits a relaxation of the magnetic field from the post-peak to pre-end phases, with its position changing from 10.33 to 10.37 RE (Table 1).
The difference maps (Fig. 2b, d, f) show that during the pre-peak–pre-onset phase, the dayside magnetospheric field is reduced (predominantly blue colors), indicating a inward motion of the magnetopause. The changes around the substorm peak time are predominantly positive, indicating further expansion of the field (consistent with the empirical model results), and even more strongly positive during the recovery phase.
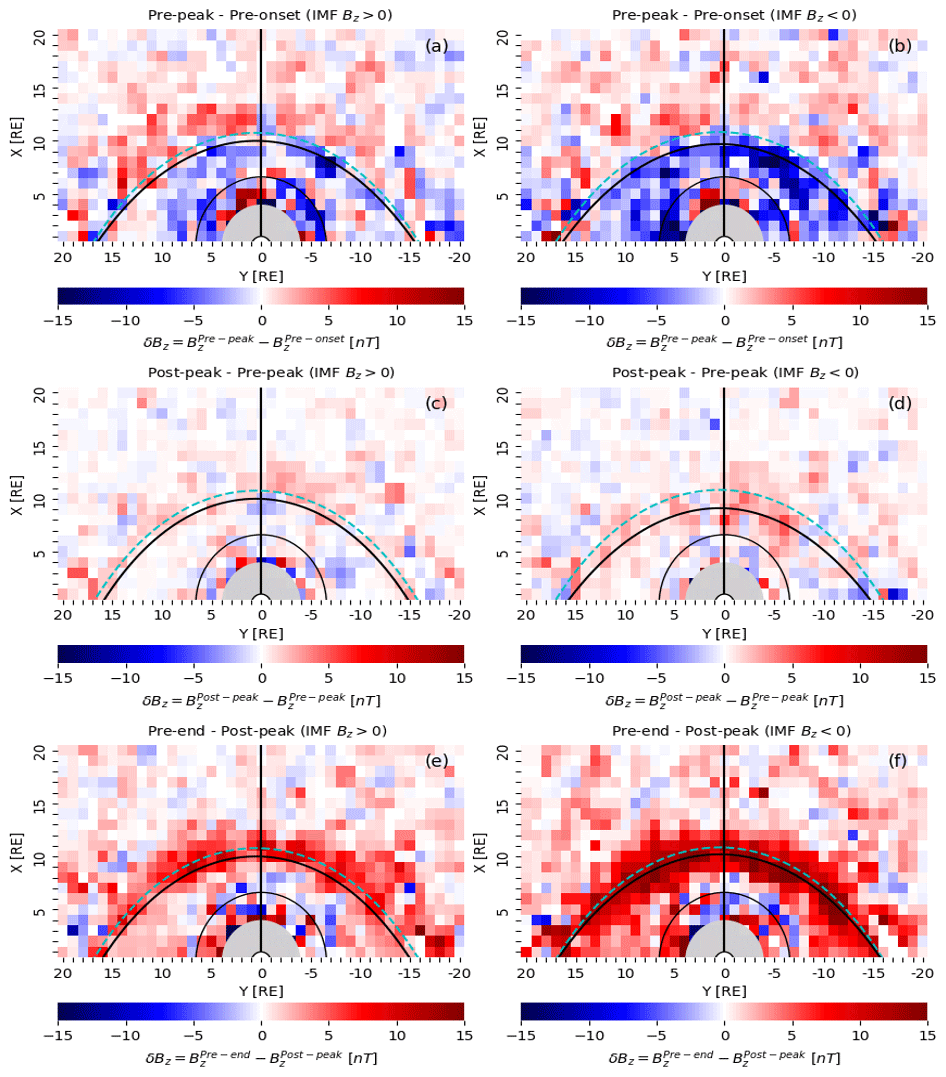
Figure 2Average differences δBZ = , , and , indicating changes in magnetic field from substorm onset to peak, around the peak, and from peak to recovery end during northward IMF (〈BZ〉>0 nT, a, c, e) and during southward IMF (〈BZ〉<0 nT, b, d, f). The black (dashed cyan) curves are the same as in Fig. 1 and show the magnetopause location plotted using the Shue et al. (1998) model with IMF BZ>5(0) nT for northward IMF (left panels) and with IMF nT for southward IMF (right panels).
Superposed epoch analysis is a statistical technique used to identify patterns in a time series associated with specific events. The method allows for the examination of the average system response centered around the zero epoch. We use three zero epochs as the substorm onset (SML onset), substorm peak (SML minimum), and substorm end (SML recovery to above −100 nT).
Figure 3 displays the superposed epoch analysis for strongly northward IMF defined as 〈BZ〉>5 nT during the epoch period from the substorm onset to recovery end. The panels show the observed SML index; IMF BZ; solar wind dynamic pressure, Pdyn; and magnetopause model parameters r0 and α using a 240 min time window around the zero epoch (onset, peak, and end) times. To ensure consistency, we employed a broad time window of 240 min to capture the complete pattern in SML, particularly during periods of southward IMF. This time window was uniformly applied to each parameter to maintain uniformity throughout the analysis. The blue (red) curve represents the median (mean), and the vertical dotted black lines show the zero epoch. The shading indicates the interquartile range between 25 % and 75 %.
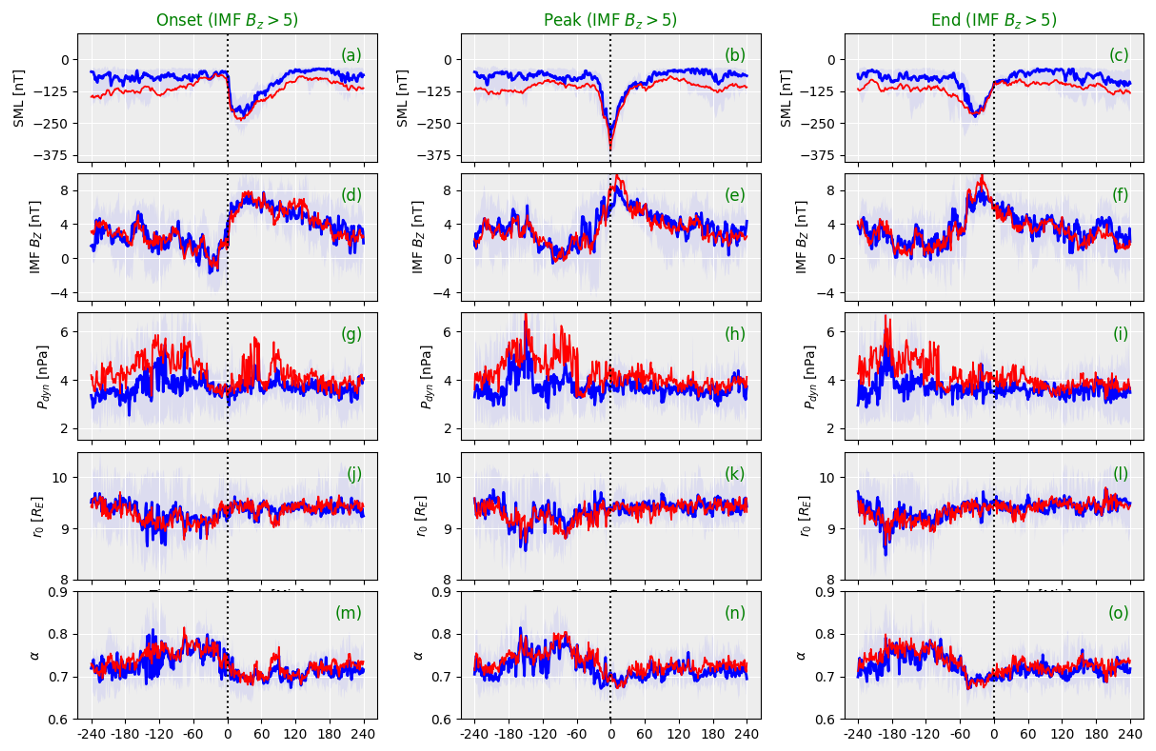
Figure 3Superposed epoch analysis – median (blue), mean (red), interquartile range (shaded) – of the (a–c) SML index; (d–f) IMF BZ; (g–i) dynamic pressure, Pdyn; and magnetopause location parameters (j–l) r0 and (m–o) α for strongly northward IMF (〈BZ〉 > 5 nT). Three zero epoch times are used: (left) substorm onset, (center) substorm peak, and (right) substorm end.
In Fig. 3a–c, the SML exhibits a rapid decline or the initiation of a negative bay at the substorm onset, reaching its minimum value with a peak magnitude around −250 nT. Subsequently, it ascends towards the pre-onset level (above −100 nT) by the end of the substorm. The duration from substorm onset to peak (expansion phase) is approximately 40 min and from peak to substorm end (recovery phase) is about 70 min. As one would expect during northward IMF conditions, this dataset comprises small, relatively short-lived substorms.
Figure 3d–f display that IMF BZ started to increase a few minutes before the substorm onset, indicating that the substorm onset was associated with a further enhancement of the northward IMF component. The peak of the northward IMF is coincident with the substorm and SML activity peak. The IMF magnitude starts to decrease prior to the end time and continues to do so after the recovery phase ends.
The solar wind dynamic pressure (Pdyn) results (Fig. 3g–i) reveal only very weak changes near the substorm onset time. In the minutes leading to the substorm onset, there is a discernible decrease in the average magnitude of Pdyn that reaches its lowest point at the onset. During the substorm peak, the average magnitude of Pdyn remains nearly constant and persists at the same level even beyond the recovery phase's end. Figure 3j–l show the magnetopause subsolar location (r0) evaluated using Eq. (2), which gives the standoff distance at subsolar point as function of the upstream solar wind dynamic pressure (Pdyn) and the IMF BZ. Overall, the changes in the subsolar point location are small during northward IMF. However, the subsolar distance increases toward the end of the growth phase and has a small peak at the substorm onset time. This demonstrates the significant reliance of r0 on solar wind dynamic pressure as it exhibits a slight increase during a slight decrease in solar wind pressure despite an increase in IMF BZ near the onset. Even after the onset, r0 follows the trends in solar wind pressure, continuing beyond the substorm end despite variations in IMF BZ near the peak and recovery end. Figure 3m–o display the results for the tail flaring parameter (α; Eq. 3). The flaring exponent starts to decrease before the substorm onset, indicating that there is a reduction in the tail flaring angle at the same time as the subsolar point is moving away from the Earth. The flaring exponent value is at its minimum at the substorm peak, after which it starts to increase slightly again.
Figure 4 displays the results of superposed epoch analysis of SML, IMF BZ, Pdyn, and magnetopause location parameters r0 and α similarly to Fig. 3 but for strongly southward IMF ( nT during the interval from the substorm onset to the recovery end. The top row of Fig. 4 (panels a–c) shows clear growth-, expansion-, and recovery-phase signatures in the SML index. The duration of expansion phase is nearly 120 min (Fig. 4a) for substorms during southward IMF, which is much longer than the expansion phase for substorms during northward IMF. The substorms are very strong (higher amplitude, ∼ −750 nT), and their recovery timescale is significantly longer (∼ 140 min; Fig. 4a, b) compared to substorms during northward IMF.
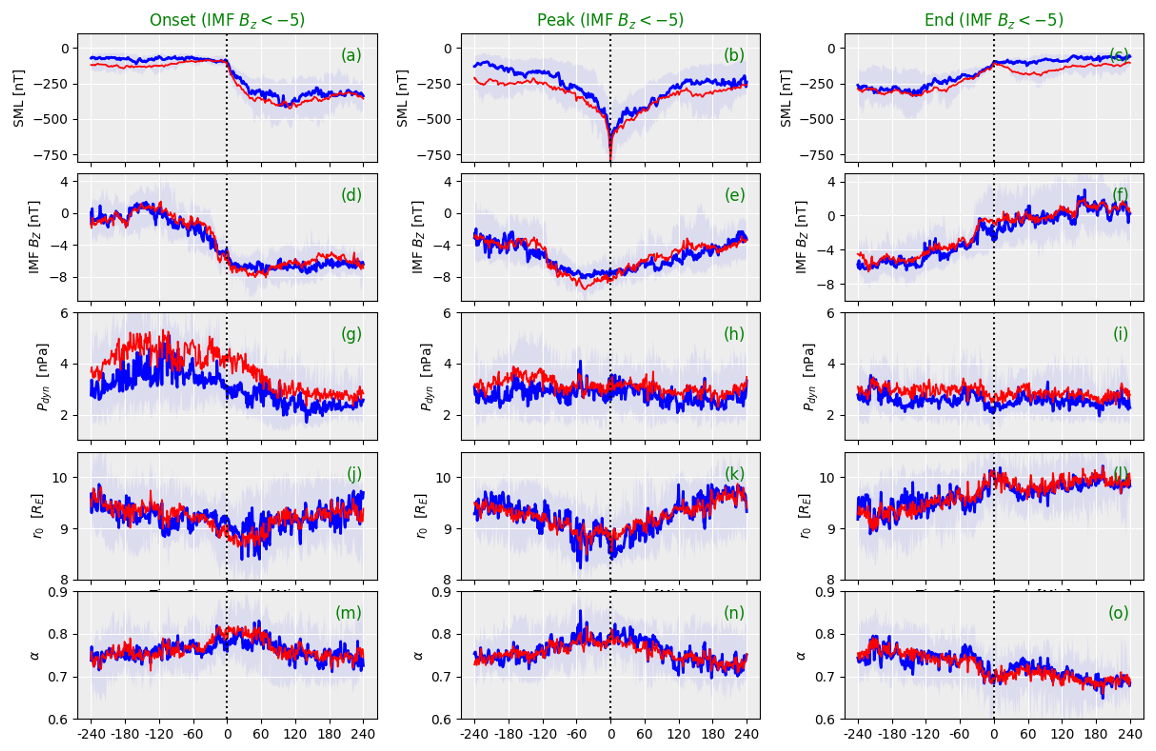
Figure 4Superposed epoch analysis with the median (depicted in blue), mean (shown in red), and interquartile range (highlighted) of various parameters, i.e., the SML index (a–c); IMF BZ (d–f); solar wind dynamic pressure, Pdyn (g–i); and magnetopause location parameters r0 (j–l) and α (m–o), specifically focusing on instances of strongly southward IMF (〈BZ〉 < −5 nT). The analysis is conducted at three distinct zero epoch times: substorm onset (left), substorm peak (center), and substorm end (right).
Figure 4d–f show quite a different pattern from the northward IMF case: during the growth phase, IMF BZ decreases to reach a minimum at the substorm onset without a signature of northward turning at that time. The IMF BZ increase starts prior to the peak time, without a clear timing in relation to the substorm phases, and continues throughout the end of the substorm. The IMF changes are smooth and broad, indicating that they are not directly associated with the substorm timing.
The dynamic pressure trends (Fig. 4g–i) show a pressure decrease during the growth phase and slightly beyond the onset, while there are no clear trigger signatures at either onset, peak, or end times (note a slight pressure minimum at the substorm end). Figure 4j–l illustrate the reduction in standoff distance during the substorm growth phase and continuing past the onset. The subsolar distance has a minimum at the peak of the substorm and starts a gradual increase that continues throughout the recovery phase. The end time is associated with a localized peak in the standoff distance. The inward movement of the magnetopause (decrease in r0) due to flux erosion during southward IMF (reconnection) is not very pronounced as the subsolar magnetopause is typically less than 1000 km thick (Paschmann et al., 2018). It is important to note that r0 strongly depends on the solar wind pressure, as illustrated in Fig. 4g, j. However, when the pressure is relatively constant (approximately 3 nPa during the peak and end phases), r0 is influenced by the trends in IMF BZ.
Figure 4m–o show the results for the tail flaring (α). The flaring parameter increases during the growth phase and has a broad peak during the expansion phase (between onset and peak times). The flaring parameter has a minimum at the end of the substorm, which is coincident with the peak in the standoff distance.
The Shue et al. (1998) model is an empirical model developed through a statistical analysis of an extensive dataset of magnetopause crossings that considers the pressure exerted by the incoming solar wind on the magnetosphere and the southward component of the IMF, which plays a pivotal role in the dayside reconnection process at the magnetopause. This model predicts the magnetopause's location as a function of two input parameters (Pdyn and IMF BZ). Based on the predicted location, the model offers an estimation of the magnetopause shape. Due to its simplicity and accuracy under specific solar wind conditions, this model has become a widely utilized tool in space weather research and magnetospheric simulations, and therefore, it is employed in this study to estimate the average location of the magnetopause and shape at substorm onset, peak, and end times. The Shue model is solely parameterized by solar wind parameters and was not originally intended to account for substorm variations. However, despite this limitation, its predictions serve as valuable contextual information for interpreting the statistics derived from the magnetopause.
In Figs. 1 and 2, each panel exhibits black and red (cyan) dashed curves plotted over the average 2D maps of BZ. These curves are generated using the standoff distance (r0) and flaring angle (α) parameters from the Shue et al. (1998) model at the times of all 5077 substorm onset, peak, and end times. The values of these parameters at various substorm timings are derived from superposed epoch analysis (see Figs. 3 and 4). Utilizing the average values of r0 and α around substorm key times, we calculate the radial distance (r) using Eq. (1) and then determine the positions xs and rs through xs=rcos (θ) and rs=rsin (θ). When these xs-versus-rs curves are plotted on the average 2D maps of BZ for strongly northward or strongly southward IMF (), they appear in black in Figs. 1 and 2. Additionally, we show northward (BZ>0) or southward IMF (BZ<0) model results by dashed red and cyan curves.
In these figures, the Shue magnetopause (dashed red) passes very closely to the magnetopause, particularly during the pre-onset phase, signifying the average magnetopause location for northward/southward IMF conditions. During the substorm peak (post-peak phase), the dashed red curve appears to pass inside the magnetopause for northward IMF (Fig. 1c), indicating a sunward movement of the magnetopause during this phase. In contrast, it passes over the boundary of the green color in Fig. 1d and accurately predicts the location of the magnetopause for southward IMF.
During substorm end (pre-end) times, the magnetopause indicates further outward movement for both the northward and the southward IMF, and this trend is in line with the Shue model. This indicates that during the substorm end, the magnetopause is slightly further away from the Earth than predicted by the Shue et al. (1998) model. However, the model curve (black) consistently failed to predict the magnetopause location for both northward and southward IMF () conditions at all substorm timings, as it traverses far within the boundary. The differences between dashed red and black curves are small but more prominent just before the substorm onset (pre-onset phase) and after the peak (post-peak phase) of the substorm during southward IMF (Fig. 1b, d).
Table 1Subsolar distances in the Shue et al. (1998) model for the different superposed epoch results. The columns show the values for positive, strongly positive, negative, and strongly negative average IMF BZ, respectively. The rows indicate times just before substorm onset, before substorm peak, after substorm peak, and just before substorm end.
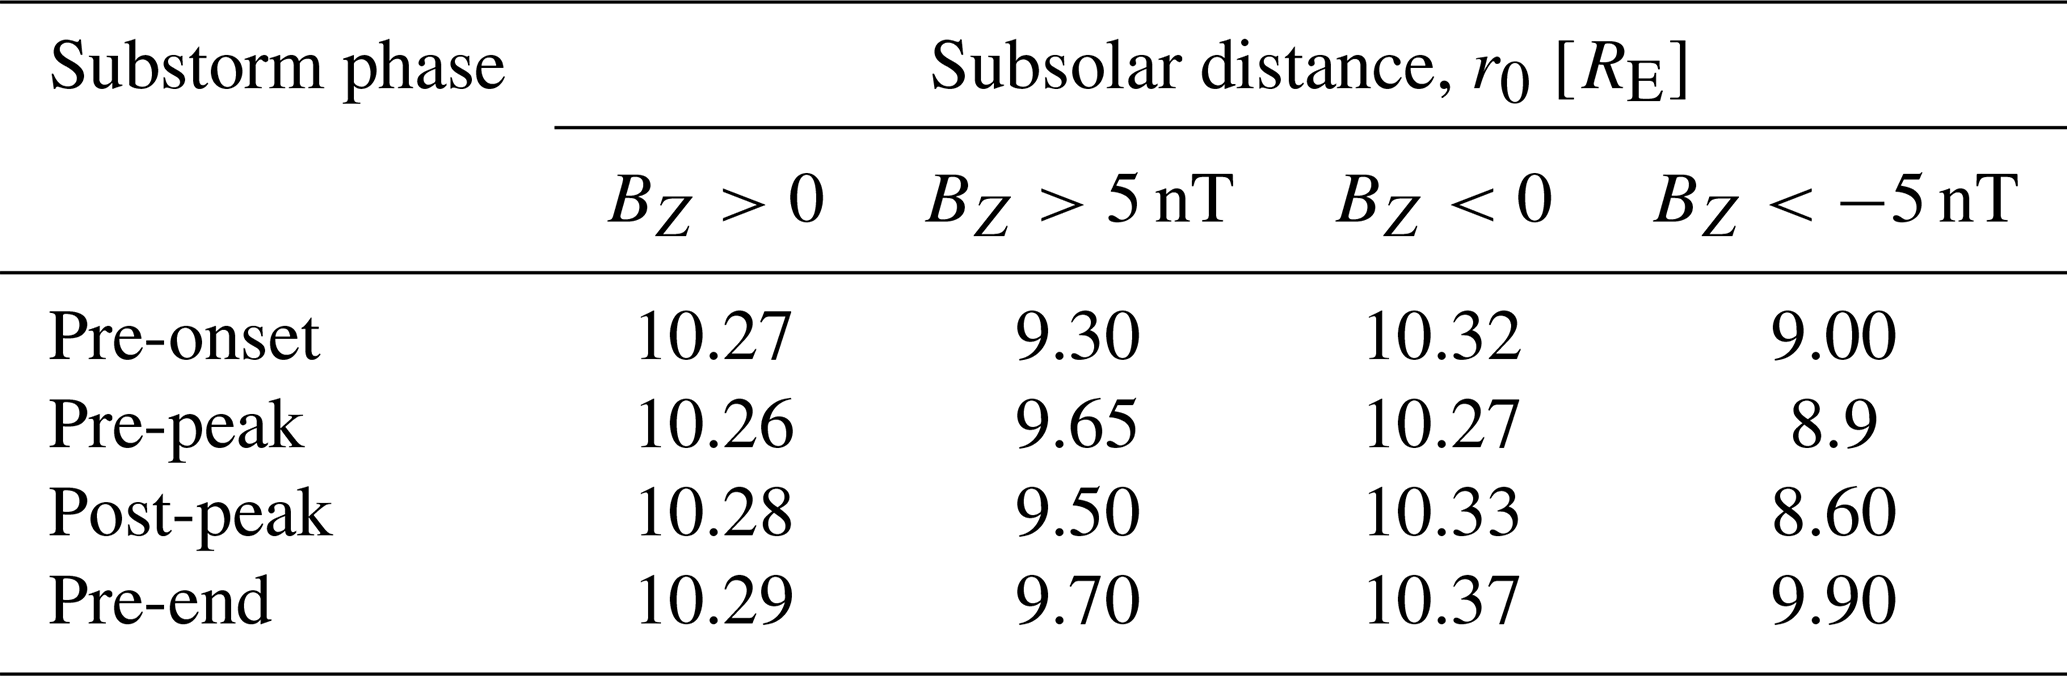
The subsolar distances in the Shue et al. (1998) model for various superposed epoch results are presented in four rows in the table, showing their values for positive, strongly positive, negative, and strongly negative average IMF BZ, respectively. Each row indicates times just before substorm onset, before substorm peak, after substorm peak, and before substorm end.
In each case, the magnetopause is shown to be the closest to the Earth at the pre-peak phase of the substorm (except for BZ>5), recovering outward from the post-peak to the recovery end phase – in line with the in situ measurements (Fig. 1c–f). However, during strong northward and southward IMF, the trend of r0 deviates from others, showing a closer proximity to the Earth during the post-peak phase (). Furthermore, comparing the Shue magnetopause location during strongly northward and southward IMF, it is evident that the compression of magnetopause is the most pronounced for a strong southward IMF and at the substorm peak (post-peak). It is important to note that the change in the magnetopause position is very small during substorms from the pre-onset phase to the recovery end. However, the behavior of r0 is consistent with satellite observation results, as shown in Fig. 1. It is well known that changes in the magnetopause location arise due to variations in the IMF BZ, dynamic pressure, and other factors. However, its position is heavily influenced by solar wind pressure. We studied separately the variation in r0 with respect to changes in solar wind dynamic pressure. We found that for pressures ≤2 nPa, r0 is approximately 10.7 RE during the pre-onset phase and 10.73 RE near the substorm end. For the higher pressure (≥5 nPa), r0 is about 8.6 RE during the pre-onset phase and 8.7 RE near the substorm end. This indicates that solar wind pressure has a more significant effect on the magnetopause location than the IMF BZ. However, similarly to the results for IMF BZ changes, the variation in r0 for solar wind pressure change during substorm phases is minimal and thus not shown in this study.
The magnetopause serves as the boundary layer that demarcates the interface between the solar wind and the magnetospheric plasma. The shape and position of the magnetopause are considerably impacted by two key factors: the dynamic pressure exerted by the solar wind and the strength and orientation of the IMF (Aubry et al., 1970). Consequently, fluctuations in the solar wind pressure and the presence of a strong northward or southward IMF can induce inward or outward motion of the magnetopause. In this study, we explore variations in the average position of the magnetopause during different phases of magnetospheric substorms. The average location of the magnetopause is determined through magnetic field observations collected by space missions such as THEMIS-A, D, and E; RBSP-A and B; and MMS-1 over a 5-year period, from 2016 to 2020. For the estimation of magnetopause location, we employ the empirical model for magnetospheric shape and size proposed by Shue et al. (1998), incorporating OMNI solar wind data, specifically solar wind dynamic pressure (Pdyn) and IMF BZ, throughout the study period. A list of substorm onsets, identified by a change in the SML index, was obtained from the work of Ohtani and Gjerloev (2020). In order to investigate changes in the magnetopause location during substorm phases, we identified the peak and end times of each substorm in a subset of 5077 substorms identified within this study period. The initial step involves combining magnetic field measurements from all satellites over the 5-year duration and computing the average of the IMF BZ for each substorm (from onset to recovery end). Subsequently, we filter substorms based on their occurrence during northward IMF (BZ>0) and southward IMF (BZ<0). During our observation, we noted that out of 5077 isolated substorms studied in this work, the highest number of substorms (3458) occurred during periods of southward IMF compared to those during northward IMF (1502). Additionally, there were a few substorms (117) that occurred independent of any IMF changes. We generate average 2D maps of the observed BZ for northward–southward IMF during distinct substorm phases, including pre-onset, post-peak, and pre-end phases (Fig. 1). The variation in the magnetopause location from substorm growth to the recovery phase is clearly visible in that figure. The magnetopause appears to be the closest to the Earth during the growth (pre-onset) phase for both northward and southward IMF conditions (Fig. 1a, b) and exhibits an outward movement from the post-peak phase to the recovery end (Fig. 1c–f). However, Fig. 1c–f illustrate a noticeable outward displacement of the magnetopause, with the movement being less pronounced for the southward IMF compared to the northward IMF.
It is widely acknowledged that substorms have a notable impact on the ring current (Sandhu et al., 2018), and in turn, the ring current can influence the inward–outward motion of the magnetopause. Therefore, the observed movement of the magnetopause during substorm phases depicted in Figs. 1 and 2 could be attributed to the presence and behavior of the ring current. Schield (1969) conducted a survey to evaluate the impact of the ring current on the magnetic field at the boundary of the magnetopause. Their findings indicated that the presence of the ring current could potentially lead to a substantial increase in the subsolar standoff distance of the magnetopause.
In the difference maps of BZ shown in Fig. 2, an outward movement of the magnetopause from expansion to the recovery phase is confirmed as well regardless of whether the IMF orientation is northward or southward. This observation aligns with the findings presented in Fig. 1.
The magnetopause motion during dayside reconnection could be associated with generation of field-aligned Region 1 and 2 currents (Birkeland, 1908; Iijima and Potemra, 1976).
We used the standoff distance (r0) and tail flaring angle (α) from magnetopause model by Shue et al. (1998). The superposed epoch analysis of solar wind and magnetospheric (r0, α) parameters for strong northward and southward IMF at substorm phases depicted in Figs. 3 and 4 demonstrates a clear relationship of standoff distance with IMF BZ and solar wind dynamic pressure. Both figures represent the fact that standoff distance is primarily influenced by the solar wind pressure. However, when the pressure remains relatively constant, the IMF BZ becomes the driving factor for the standoff distance, as illustrated in Figs. 3d–l and 4d–l. Although, over the years, various other methods have been employed to analyze and approximate the magnetopause location, including empirical models (Dmitriev and Suvorova, 2000; Shukhtina and Gordeev, 2015; Wang et al., 2013) and global MHD models (García and Hughes, 2007; Lu et al., 2011). Real-time models like the SWMF (Gombosi et al., 2004; Tóth et al., 2012) have also been utilized to predict the magnetopause boundary for space weather forecasting analysis.
Figures 3d–f and 4d–f reveal a clear correlation between substorm onsets and changes in the IMF direction and indicate that substorms occur during strong northward and southward IMF, which shows a consistency with earlier research and has shown that substorm onsets are associated with intervals of southward IMF (Kokubun, 1972; Wild et al., 2009) as well as with the northward turning of the IMF (Mcpherron et al., 1986; Sergeev et al., 1986; Hsu, 2003).
The average values of the subsolar point (r0) is estimated during the substorm onset, peak, and end from Figs. 3j–l and 4j–l. To provide a clear representation of these values, they are presented in Table 1, which offers a concise summary of the average subsolar point r0 at different stages of the substorm.
From the table, it is clear that the subsolar point is the closest to the Earth during the substorm growth phase for both IMF BZ>0, 5 and BZ<0, −5. It then moves outward from the peak to the substorm recovery end so it is farther from the Earth at the end of the substorm than it was at substorm onset for all IMF BZ. Shue et al. (1998) predict the behavior of magnetopause to be similar to that shown in the average maps of BZ (Fig. 1). During the substorm phases, it is observed that there is only a minimal change in the subsolar point (r0). However, despite this small change, the behaviors of the magnetopause, as observed through in situ measurements and the predictions from the Shue model, align with each other. This consistency between the in situ measurements and the Shue model highlights the robustness of the model in capturing the magnetopause dynamics during substorm events. Despite being solely parameterized by solar wind parameters and not originally intended to account for substorm variations, the Shue model predictions still provide valuable contextual information for interpreting the statistics derived from the magnetopause, showcasing its usefulness despite this limitation.
In summary, we utilize an extensive dataset from multi-satellite observations and the Shue et al. (1998) model to demonstrate the changes in the magnetopause position under the influence of northward–southward IMF and internal magnetospheric process like substorms, and we observed the following:
-
The majority of substorms occur during periods of southward IMF, with fewer occurring during northward IMF and some even happening under stable IMF conditions.
-
The magnetopause is closest to the Earth during the growth phase of a substorm and shows outward movement during the expansion and recovery phases for .
-
The variation in standoff distance, r0, across the three substorm phases is minimal for both northward and southward IMF conditions.
-
Shue et al. (1998) model accurately predicts the average magnetopause location during substorm key timings, particularly for northward and southward IMF orientations (IMF ).
-
The differences between the substorm-time values and the average conditions indicate that the internal magnetospheric state impacts the location of (and likely processes at) the magnetopause. This may implicate a more complicated relationship between geomagnetic activity and the solar wind driver than illustrated by solar-wind-based coupling functions (Newell et al., 2007).
All data used in this study are available from the NASA Goddard Space Flight Center Coordinated Data Analysis Web (CDAWeb) (http://cdaweb.gsfc.nasa.gov/, CDAWeb, 2023) and the SuperMAG website (https://supermag.jhuapl.edu/indices/, SuperMAG, 2023).
SK conducted the data processing, analysis, and writing for this study. TP contributed to data interpretation, reviewed the manuscript, and provided feedback. Both authors reviewed and approved the final version of the paper.
The contact author has declared that neither of the authors has any competing interests.
Publisher’s note: Copernicus Publications remains neutral with regard to jurisdictional claims made in the text, published maps, institutional affiliations, or any other geographical representation in this paper. While Copernicus Publications makes every effort to include appropriate place names, the final responsibility lies with the authors.
We acknowledge the substorm timing list identified by the Newell and Gjerloev technique (Ohtani and Gjerloev, 2020), the SMU and SML indices (Newell and Gjerloev, 2011), and the SuperMAG collaboration (Gjerloev, 2012).
This research has been supported by NASA (grant no. 80NSSC21K1675).
This paper was edited by Christopher Mouikis and reviewed by three anonymous referees.
Akasofu, S.-I.: The development of the auroral substorm, Planet. Space Sci., 12, 273–282, https://doi.org/10.1016/0032-0633(64)90151-5, 1964. a
Angelopoulos, V.: The THEMIS Mission, Space Sci. Rev., 141, 5–34, https://doi.org/10.1007/s11214-008-9336-1, 2008. a
Aubry, M. P., Russell, C. T., and Kivelson, M. G.: Inward motion of the magnetopause before a substorm, J. Geophys. Res., 75, 7018–7031, https://doi.org/10.1029/JA075i034p07018, 1970. a, b
Auster, H. U., Glassmeier, K. H., Magnes, W., Aydogar, O., Baumjohann, W., Constantinescu, D., Fischer, D., Fornacon, K. H., Georgescu, E., Harvey, P., Hillenmaier, O., Kroth, R., Ludlam, M., Narita, Y., Nakamura, R., Okrafka, K., Plaschke, F., Richter, I., Schwarzl, H., Stoll, B., Valavanoglou, A., and Wiedemann, M.: The THEMIS Fluxgate Magnetometer, Space Sci Rev., 141, 235–264, https://doi.org/10.1007/s11214-008-9365-9, 2008. a
Baker, D. N., Pulkkinen, T. I., Angelopoulos, V., Baumjohann, W., and McPherron, R. L.: Neutral line model of substorms: Past results and present view, J. Geophys. Res.-Space, 101, 12975–13010, https://doi.org/10.1029/95JA03753, 1996. a
Birkeland, K.: The Norwegian Aurora Polaris Expedition 1902–1903 Vol. 1, H. Aschelhoug & Co., Christiania, Norway, https://doi.org/10.5962/bhl.title.17857, 1908. a
Burch, J. L., Moore, T. E., Torbert, R. B., and Giles, B. L.: Magnetospheric Multiscale Overview and Science Objectives, Space Sci. Rev., 199, 5–21, https://doi.org/10.1007/s11214-015-0164-9, 2016. a
Cahill, L. J. and Winckler, J. R.: Magnetopause crossings observed at 6.6 RE, J. Geophys. Res.-Space, 104, 12229–12237, https://doi.org/10.1029/1998JA900072, 1999. a
CDAWeb: Coordinated Data Analysis Web, Goddard Space Flight Center [data set], http://cdaweb.gsfc.nasa.gov/ (last access: 23 May 2023), 2023. a
Chao, J., Wu, D., Lin, C.-H., Yang, Y.-H., Wang, X., Kessel, M., Chen, S., and Lepping, R.: Models for the size and shape of the earth's magnetopause and bow shock, in: COSPAR Colloquia Series, Vol. 12, 127–135, Elsevier, ISBN 9780080440576, https://doi.org/10.1016/S0964-2749(02)80212-8, 2002. a
Chapman, S. and Ferraro, V. C. A.: A new theory of magnetic storms, J. Geophys. Res., 36, 77–97, https://doi.org/10.1029/TE036i002p00077, 1931. a
Dmitriev, A. V. and Suvorova, A. V.: Three-dimensional artificial neural network model of the dayside magnetopause, J. Geophys. Res.-Space, 105, 18909–18918, https://doi.org/10.1029/2000JA900008, 2000. a
Fairfield, D. H.: Average and unusual locations of the Earth's magnetopause and bow shock, J. Geophys. Res., 76, 6700–6716, https://doi.org/10.1029/JA076i028p06700, 1971. a, b
García, K. S. and Hughes, W. J.: Finding the Lyon-Fedder-Mobarry magnetopause: A statistical perspective, J. Geophys. Res.-Space, 112, 2006JA012039, https://doi.org/10.1029/2006JA012039, 2007. a
Gjerloev, J. W.: The SuperMAG data processing technique, J. Geophys. Res.-Space, 117, A09213, https://doi.org/10.1029/2012JA017683, 2012. a, b, c
Gombosi, T., Powell, K., De Zeeuw, D., Clauer, C., Hansen, K., Manchester, W., Ridley, A., Roussev, I., Sokolov, I., Stout, Q., and Toth, G.: Solution-adaptive magnetohydrodynamics for space plasmas: Sun-to-Earth simulations, Comput. Sci. Eng., 6, 14–35, https://doi.org/10.1109/MCISE.2004.1267603, 2004. a
Henderson, M. G., Reeves, G. D., Belian, R. D., and Murphree, J. S.: Observations of magnetospheric substorms occurring with no apparent solar wind/IMF trigger, J. Geophys. Res.-Space, 101, 10773–10791, https://doi.org/10.1029/96JA00186, 1996. a
Hsu, T.-S.: Occurrence frequencies of IMF triggered and nontriggered substorms, J. Geophys. Res., 108, 1307, https://doi.org/10.1029/2002JA009442, 2003. a, b
Iijima, T. and Potemra, T. A.: The amplitude distribution of field-aligned currents at northern high latitudes observed by Triad, J. Geophys. Res., 81, 2165–2174, https://doi.org/10.1029/JA081i013p02165, 1976. a
Kletzing, C. A., Kurth, W. S., Acuna, M., MacDowall, R. J., Torbert, R. B., Averkamp, T., Bodet, D., Bounds, S. R., Chutter, M., Connerney, J., Crawford, D., Dolan, J. S., Dvorsky, R., Hospodarsky, G. B., Howard, J., Jordanova, V., Johnson, R. A., Kirchner, D. L., Mokrzycki, B., Needell, G., Odom, J., Mark, D., Pfaff, R., Phillips, J. R., Piker, C. W., Remington, S. L., Rowland, D., Santolik, O., Schnurr, R., Sheppard, D., Smith, C. W., Thorne, R. M., and Tyler, J.: The Electric and Magnetic Field Instrument Suite and Integrated Science (EMFISIS) on RBSP, Space Sci. Rev., 179, 127–181, https://doi.org/10.1007/s11214-013-9993-6, 2013. a
Kokubun, S.: Relationship of interplanetary magnetic field structure with development of substorm and storm main phase, Planet. Space Sci., 20, 1033–1049, https://doi.org/10.1016/0032-0633(72)90214-0, 1972. a, b
Kumar, S., Pulkkinen, T. I., and Gjerloev, J.: Magnetotail Variability During Magnetospheric Substorms, J. Geophys. Res.-Space, 129, e2023JA031722, https://doi.org/10.1029/2023JA031722, 2024. a, b
Lin, R. L., Zhang, X. X., Liu, S. Q., Wang, Y. L., and Gong, J. C.: A three-dimensional asymmetric magnetopause model: THREE-DIMENSIONAL MAGNETOPAUSE MODEL, J. Geophys. Res.-Space, 115, A04207, https://doi.org/10.1029/2009JA014235, 2010. a
Liu, Z., Lu, J. Y., Wang, C., Kabin, K., Zhao, J. S., Wang, M., Han, J. P., Wang, J. Y., and Zhao, M. X.: A three-dimensional high Mach number asymmetric magnetopause model from global MHD simulation, J. Geophys. Res.-Space, 120, 5645–5666, https://doi.org/10.1002/2014JA020961, 2015. a
Liu, Z.-Q., Lu, J. Y., Kabin, K., Yang, Y. F., Zhao, M. X., and Cao, X.: Dipole tilt control of the magnetopause for southward IMF from global magnetohydrodynamic simulations: dipole tilt control of the magnetopause, J. Geophys. Res.-Space, 117, A07207, https://doi.org/10.1029/2011JA017441, 2012. a
Lu, J. Y., Liu, Z.-Q., Kabin, K., Zhao, M. X., Liu, D. D., Zhou, Q., and Xiao, Y.: Three dimensional shape of the magnetopause: Global MHD results: three dimensional magnetopause, J. Geophys. Res.-Space, 116, A09237, https://doi.org/10.1029/2010JA016418, 2011. a, b
Mauk, B. H., Fox, N. J., Kanekal, S. G., Kessel, R. L., Sibeck, D. G., and Ukhorskiy, A.: Science Objectives and Rationale for the Radiation Belt Storm Probes Mission, Space Sci. Rev., 179, 3–27, https://doi.org/10.1007/s11214-012-9908-y, 2013. a
Mcpherron, R. L., Terasawa, T., and Nishida, A.: Solar wind triggering of substorm expansion onset, J. Geomagn. Geoelectr., 38, 1089–1108, https://doi.org/10.5636/jgg.38.1089, 1986. a, b
Newell, P. T. and Gjerloev, J. W.: Evaluation of SuperMAG auroral electrojet indices as indicators of substorms and auroral power, J. Geophys. Res.-Space, 116, A12211, https://doi.org/10.1029/2011JA016779, 2011. a
Newell, P. T., Sotirelis, T., Liou, K., Meng, C. I., and Rich, F. J.: A nearly universal solar wind-magnetosphere coupling function inferred from 10 magnetospheric state variables, J. Geophys. Res., 112, A01206, https://doi.org/10.1029/2006JA012015, 2007. a
Nguyen, G., Aunai, N., Michotte De Welle, B., Jeandet, A., Lavraud, B., and Fontaine, D.: Massive Multi-Mission Statistical Study and Analytical Modeling of the Earth's Magnetopause: 3. An Asymmetric Non Indented Magnetopause Analytical Model, J. Geophys. Res.-Space, 127, A01206, https://doi.org/10.1029/2021JA030112, 2022. a
Ohtani, S. and Gjerloev, J. W.: Is the Substorm Current Wedge an Ensemble of Wedgelets?: Revisit to Midlatitude Positive Bays, J. Geophys. Res.-Space, 125, e2020JA027902, https://doi.org/10.1029/2020JA027902, 2020. a, b, c, d
Paschmann, G., Haaland, S. E., Phan, T. D., Sonnerup, B. U. Ã., Burch, J. L., Torbert, R. B., Gershman, D. J., Dorelli, J. C., Giles, B. L., Pollock, C., Saito, Y., Lavraud, B., Russell, C. T., Strangeway, R. J., Baumjohann, W., and Fuselier, S. A.: Large-Scale Survey of the Structure of the Dayside Magnetopause by MMS, J. Geophys. Res.-Space, 123, 2018–2033, https://doi.org/10.1002/2017JA025121, 2018. a, b
Russell, C. T., Anderson, B. J., Baumjohann, W., Bromund, K. R., Dearborn, D., Fischer, D., Le, G., Leinweber, H. K., Leneman, D., Magnes, W., Means, J. D., Moldwin, M. B., Nakamura, R., Pierce, D., Plaschke, F., Rowe, K. M., Slavin, J. A., Strangeway, R. J., Torbert, R., Hagen, C., Jernej, I., Valavanoglou, A., and Richter, I.: The Magnetospheric Multiscale Magnetometers, Space Sci. Rev., 199, 189–256, https://doi.org/10.1007/s11214-014-0057-3, 2016. a
Sandhu, J. K., Rae, I. J., Freeman, M. P., Forsyth, C., Gkioulidou, M., Reeves, G. D., Spence, H. E., Jackman, C. M., and Lam, M. M.: Energization of the Ring Current by Substorms, J. Geophys. Res.-Space, 123, 8131–8148, https://doi.org/10.1029/2018JA025766, 2018. a
Schield, M. A.: Pressure balance between solar wind and magnetosphere, J. Geophys. Res., 74, 1275–1286, https://doi.org/10.1029/JA074i005p01275, 1969. a
Sergeev, V., Dmitrieva, N., and Barkova, E.: Triggering of substorm expansion by the IMF directional discontinuities: Time delay analysis, Planet. Space Sci., 34, 1109–1118, https://doi.org/10.1016/0032-0633(86)90023-1, 1986. a, b
Shue, J., Song, P., Russell, C. T., Chao, J. K., and Yang, Y.: Toward predicting the position of the magnetopause within geosynchronous orbit, J. Geophys. Res.-Space, 105, 2641–2656, https://doi.org/10.1029/1999JA900467, 2000. a
Shue, J.-H., Chao, J. K., Fu, H. C., Russell, C. T., Song, P., Khurana, K. K., and Singer, H. J.: A new functional form to study the solar wind control of the magnetopause size and shape, J. Geophys. Res.-Space, 102, 9497–9511, https://doi.org/10.1029/97JA00196, 1997. a, b
Shue, J.-H., Song, P., Russell, C. T., Steinberg, J. T., Chao, J. K., Zastenker, G., Vaisberg, O. L., Kokubun, S., Singer, H. J., Detman, T. R., and Kawano, H.: Magnetopause location under extreme solar wind conditions, J. Geophys. Res.-Space, 103, 17691–17700, https://doi.org/10.1029/98JA01103, 1998. a, b, c, d, e, f, g, h, i, j, k, l, m, n, o, p, q
Shukhtina, M. A. and Gordeev, E.: In situ magnetotail magnetic flux calculation, Ann. Geophys., 33, 769–781, https://doi.org/10.5194/angeo-33-769-2015, 2015. a
Sibeck, D. G., Lopez, R. E., and Roelof, E. C.: Solar wind control of the magnetopause shape, location, and motion, J. Geophys. Res.-Space, 96, 5489–5495, https://doi.org/10.1029/90JA02464, 1991. a
SuperMAG: Solar wind and IMF data, SuperMAG [data set], https://supermag.jhuapl.edu/indices/ (last access: 23 May 2023), 2023. a
Tsyganenko, N. A. and Sibeck, D. G.: Concerning flux erosion from the dayside magnetosphere, J. Geophys. Res.-Space, 99, 13425–13436, https://doi.org/10.1029/94JA00719, 1994. a
Tóth, G., Van Der Holst, B., Sokolov, I. V., De Zeeuw, D. L., Gombosi, T. I., Fang, F., Manchester, W. B., Meng, X., Najib, D., Powell, K. G., Stout, Q. F., Glocer, A., Ma, Y.-J., and Opher, M.: Adaptive numerical algorithms in space weather modeling, J. Comput. Phys., 231, 870–903, https://doi.org/10.1016/j.jcp.2011.02.006, 2012. a
Wang, J., Guo, Z., Ge, Y. S., Du, A., Huang, C., and Qin, P.: The responses of the earth's magnetopause and bow shock to the IMF Bz and the solar wind dynamic pressure: a parametric study using the AMR-CESE-MHD model, J. Space Weather Spac., 8, A41, https://doi.org/10.1051/swsc/2018030, 2018. a
Wang, Y., Sibeck, D. G., Merka, J., Boardsen, S. A., Karimabadi, H., Sipes, T. B., Šafránková, J., Jelínek, K., and Lin, R.: A new three-dimensional magnetopause model with a support vector regression machine and a large database of multiple spacecraft observations, J. Geophys. Res.-Space, 118, 2173–2184, https://doi.org/10.1002/jgra.50226, 2013. a
Wild, J. A., Woodfield, E. E., and Morley, S. K.: On the triggering of auroral substorms by northward turnings of the interplanetary magnetic field, Ann. Geophys., 27, 3559–3570, https://doi.org/10.5194/angeo-27-3559-2009, 2009. a, b