the Creative Commons Attribution 4.0 License.
the Creative Commons Attribution 4.0 License.
Investigating the role of gravity waves in mesosphere and lower-thermosphere (MLT) inversions at low latitudes
Chalachew Lingerew
U. Jaya Prakash Raju
The mesosphere and lower-thermosphere (MLT) transitional region, encompassing a height range of 60–100 km, is a distinct and highly turbulent zone within Earth's atmosphere. The region is significant owing to dynamics of atmospheric processes like planetary, tidal, and particularly gravity waves, which contribute to the formation of the mesospheric inversion layer (MIL). Investigating these inversion phenomena is crucial for understanding the dynamics of the middle and upper atmosphere, especially regarding stability and energy transfer. These phenomena are associated with energy transfer processes vital for understanding the overall dynamics of the atmosphere. Despite extensive studies on inversions, the formation mechanisms of mesospheric inversions remain poorly understood. Here, upper and lower inversion phenomena and their causative mechanisms are explored. The study utilizes long-term SABER (Sounding of the Atmosphere using Broadband Emission Radiometry) observations during 2005–2020 over the latitudinal, 3–15° N, and longitudinal, 33–48° E, ranges. The results show that the upper inversion occurs more frequently, with a frequency below 40 %, compared to the lower inversion, which occurs below 20 %. The upper inversion occurs within the height range of 78–91 km, with an inversion amplitude of approximately 20–80 K and a thickness of around 3–12 km. In contrast, the lower inversion is confined to the height range of 70–80 km, with an inversion amplitude of about 10–60 K and a thickness of around 4–10 km. Moreover, the gravity wave indicator potential energy shows high energy (below 100 J kg−1) in the upper-MLT region (85–90 km) compared to the lower-MLT region (70–75 km), with less than 50 J kg−1. Considering gravity waves, the Brunt–Väisälä frequency (N2) stability criteria indicate instability in the upper-MLT region, with very low values compared to the lower-MLT region. This suggests that the high amount of gravity wave potential energy is a consequence of the higher instability in the upper inversion compared to the lower inversion.
- Article
(15948 KB) - Full-text XML
- BibTeX
- EndNote
The mesosphere and lower-thermosphere (MLT) region serves as a transitional zone for atmospheric wave processes from the lower and upper atmosphere, including tidal, planetary, and gravity waves. Gravity waves (GWs) originating in the lower atmosphere propagate into the upper mesosphere, where they break and dissipate, releasing energy and momentum. This process influences the thermal structure, global atmospheric circulation, and mesospheric inversion layers (MILs), which are associated with increased temperature variability in the mesosphere. MILs indicate wave saturation when the lapse rate falls below the dry adiabatic lapse rate (Sica et al., 2007). Temperature inversions in the mesosphere have been widely observed and studied using various techniques across different geographic locations, including lidar, radar, rocket sondes, and satellites. Sivakandan et al. (2014) utilized TIMED/SABER kinetic temperature data to examine the occurrence and characteristics of mesospheric inversions over the equatorial Indian region (0 to 10° N and 70 to 90° E) for the years 2002 and 2008. However, they did not explore the causative factors. This study aims to investigate the causes of these inversions, focusing specifically on the role of atmospheric gravity waves.
Gravity waves and MILs are interconnected phenomena within Earth's atmosphere, particularly in the MLT. Inversions are layers within the mesosphere where the temperature profile exhibits an increment. As a result, the temperature increases with altitude, contrary to the typical decrease. These inversion layers often form because of these atmospheric wave dynamic processes, including the breaking and dissipation of gravity waves. As gravity waves propagate upwards, they can grow in amplitude since the atmospheric density decreases with altitude. When these waves reach a critical amplitude, they break. This breaking process releases energy and momentum into the surrounding atmosphere, leading to localized heating that creates or enhances mesospheric inversion layers by increasing the temperature with altitude. The breaking of gravity waves contributes to the momentum, and energy deposition can also generate turbulence, which further influences the structure and instability of an inversion layer.
The deposition of momentum and energy from GWs is considered a major factor driving large-scale atmospheric circulation, the coupling between atmospheric layers, and the occurrence of inversion phenomena (Fritts and Alexander, 2003; Lindzen, 1981; Smith, 2012; Hirota, 1984). Researchers have also investigated the effects of gravity wave breaking on MLT dynamics to better understand its role in inversion phenomena, especially in mid- and high-latitude regions (Gan et al., 2012; Walterscheid and Hickey, 2009; Collins et al., 2011; Szewczyk et al., 2013). Observational and modeling studies have examined GWs as a factor contributing to these inversions (Fritts, 2018a, b; Collins et al., 2014; Sridharan et al., 2008; Ramesh and Sridharan, 2012; Ramesh et al., 2013, 2014, 2017). Despite extensive research, our understanding of how gravity waves influence mesosphere inversions – particularly regarding temperature variability – remains incomplete, even in mid- and high-latitude regions (Singh and Pallamraju, 2018; Fritts et al., 2018a, b). Consequently, studying inversion phenomena and their underlying causes continues to be a crucial area of investigation, especially for MLT dynamics at low latitudes.
Research on the temporal and spatial variability of the mesosphere inversion phenomenon, regarding atmospheric waves and particularly gravity wave activity, is notably lacking at low latitudes. To address this gap, our study investigates the mesosphere inversion phenomenon and its association with gravity wave activity and instability criteria. We use the Brunt–Väisälä frequency (N2) over the low-latitude band (3–15° N) with long-term SABER observations from 2005 to 2020. The study is organized as follows: Sect. 2 details the data and methodology used to analyze the mesosphere inversion phenomena and their causative gravity waves via the potential energy. Section 3 presents the results, and Sect. 4 concludes with the findings.
2.1 SABER observations
The TIMED/SABER satellite, launched on 7 December 2001, operates in an elliptical orbit at approximately 625 km altitude with a 74° inclination relative to the Equator. Since its launch, SABER has been a crucial tool for atmospheric research, providing extensive data on the middle and upper atmosphere. SABER is a limb-viewing radiometer working in the infrared region (1.27–17 µm) and can measure radiative emissions across a wide range of altitudes. It offers nearly global coverage and continuous 24 h data over 60 d. The instrument completes 15 orbits daily, each taking about 97 min, and collects around 1400 data files per day, with each profile taking 58 s. SABER's high-resolution temperature profiles are essential for studying the dynamics and wave processes in the MLT. It provides temperature measurements with an accuracy of 1 to 2 K between 15 and 60 km. The accuracy decreases to 5 K below 85 km and increases to 6.7 to 10 K near 100 km. These data have been crucial in enhancing our understanding of the thermal structure and dynamic processes in the mesospheric region, as emphasized by several studies (Garcia-Comas et al., 2008; Schmidlin, 1976; Remsberg et al., 2003; Gan et al., 2012, 2014; Russell et al., 1999; Bizuneh et al., 2022; Lingerew et al., 2023; Rezac et al., 2015; Meriwether and Gerrard, 2004; Fechine et al., 2008; Dou et al., 2009; France et al., 2015).
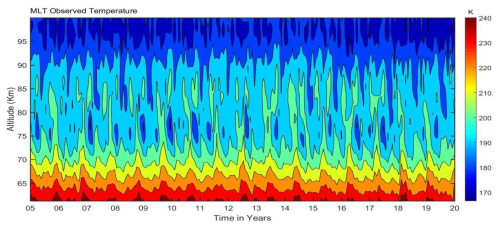
Due to this, we used the SABER vertical temperature profiles collected within the 60–100 km altitude range. These profiles encompass the period from 2005 to 2020, covering latitudes from 3 to 15° N and longitudes from 33 to 48° E. Figure 1 illustrates the monthly mean SABER temperature data for the mesosphere and lower thermosphere. The data aim to illustrate the MLT temperature variability, which helps us identify the MILs. The monthly mean temperatures in the MLT region show a maximum of 200–240 K at altitudes of 60–70 km. Then, it decreases to around 160–180 K at 95–100 km throughout the entire period. While the temperature patterns in the 70–90 km altitude range suggest an inversion, these inversions are not visible.
2.2 Analysis technique
Earth's middle atmosphere typically has a negative temperature gradient, but some reports have shown positive temperature gradients in the mesosphere (Meriwether and Gardner, 2000; Gan et al., 2012). This phenomenon, the MIL, is identified using the method described by Leblanc and Hauchecorne (1997) and Fechine et al. (2008). Mesospheric inversions are defined by their thickness (the altitude difference between the maximum warming and cooling) and their amplitude (the temperature difference between these points) (Bègue et al., 2017; Meriwether and Gardner, 2000). The following are the criteria for identifying these inversions:
-
The bottom level of the lower inversion is above 70 km, and the top level is below 80 km. For the upper inversion, the bottom level is above 80 km and the top level is below 92 km.
-
The amplitude is considered larger than 5 K.
-
The thickness is greater than or equal to 3 km.
Figure 2 illustrates this concept, highlighting the positive temperature difference between the top and bottom levels of the inversion. This method has been widely applied in numerous studies investigating mesospheric inversions (Irving et al., 2014; Leblanc et al., 1998; Meriwether and Gardner, 2000; Duck et al., 2001; Duck and Greene, 2004; Cutler et al., 2001; Sivakumar et al., 2001; Gan et al., 2012). In addition, the frequency of MIL occurrences is determined for the period 2005–2020 in both the upper- and lower-MLT regions. This frequency is calculated by dividing the number of inversion days in each month by the total number of days in that month over the 16-year observation period (2005–2020).
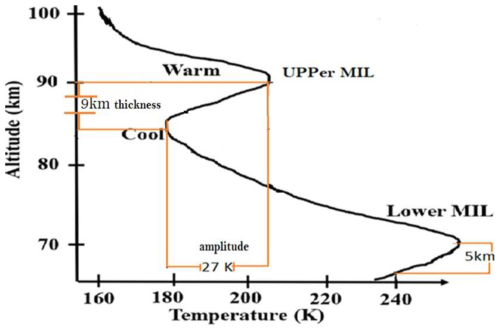
Figure 2Schematic of the upper- and lower-mesospheric inversion layers shown in the temperature profile for the MLT regions (adapted from Meriwether and Gerrard, 2004).
Mesospheric temperature inversions are linked to MLT instabilities driven by the dynamics of atmospheric wave processes. To identify the causative, short-period atmospheric gravity waves, a high-pass filter with a 1 h interval cutoff frequency is applied using the Brunt–Väisälä frequency (N2). Another important concept for estimating the Brunt–Väisälä frequency is the potential temperature (θ). This represents the air parcel's temperature when it is displaced adiabatically to a standard pressure level, p0, from the current pressure level, p. This is based on the first law of thermodynamics:
This yields
The vertical motion of an atmospheric air parcel can thus be described by Liu and Liu (2011) and Vadas and Fritts (2005), as shown in Eq. (2). This equation calculates the Brunt–Väisälä frequency of the parcel, accounting for the buoyant and gravitational forces acting upon it.
Based on the hydrostatic equation ρ=ρ0,
and the ideal gas law, gives the parcel motion of an equation:
Following the same approach using the hydrostatic Eq. (4) and the adiabatic Eq. (6),
yields
For the ideal gas law of p=ρRT, the natural logarithm is taken for altitude z on both sides, yielding
Then, the potential temperature (θ) of the parcel is calculated as follows based on Eq. (2):
This derives the parcel acceleration based on Eq. (7) to become
by introducing the frequency, N, with .
The Brunt–Väisälä frequency N2 is calculated based on the following mathematical formulation used to characterize atmospheric stability or instability:
where g is the acceleration due to gravity, N is the Väisälä frequency, T0 is the background temperature (estimated based on third-order polynomial fitting), is the adiabatic lapse rate, and cp=1004 is the specific heat capacity of the atmosphere at constant pressure. When the Brunt–Väisälä frequency, N2, is positive, the atmosphere is stable, whereas when it is negative the atmosphere is unstable. When N2 is positive, the atmosphere is stable, whereas a negative N2 indicates atmospheric instability. In this regard, the atmospheric lapse rate, , is higher than the adiabatic lapse rate, K km−1. A third-order least-squares polynomial fit was applied to the SABER-observed temperature (T) profile to determine the background temperature (T0), following the method outlined by Leblanc and Hauchecorne (1997). Subsequently, the perturbed temperature (Tp) is computed by subtracting the background temperature from the T data:
After estimating Tp, a high-pass band filter is applied. This filter removes low-frequency components associated with planetary and tidal waves, retaining the high-frequency components related to short-period gravity waves (John and Kumar, 2012). This process isolates the influence of gravity waves, enabling accurate calculation of their potential energy. The high-pass filter operates within known frequency ranges, typically below a 1 h period.
The potential energy of the waves, a function of z, is used to determine the impact of atmospheric gravity waves on atmospheric inversions.
3.1 Identification and characteristics of the lower- and upper-MLT inversions
The SABER temperature profiles, covering altitudes of 60–100 km during 2005–2020, are shown in the contour plots of Fig. 3. Figure 3a and b show the upper-MLT region (mesospheric and lower thermospheric), while Fig. 3c and d show the lower-MLT region. Figure 3a and c show observed temperatures ranging from approximately 180 to 220 K before the inversion layers are accounted for, where Fig. 3b and d show inversion day temperatures ranging from 180 to 225 K.
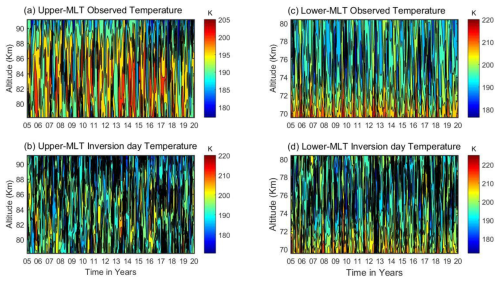
Figure 3The upper- and lower-mesosphere observed temperatures in panels (a) and (c), with their inversions in panels (b) and (d).
Figure 3a shows that the observed temperature in the upper mesosphere ranges from approximately 180 to 205 K at altitudes of around 80–90 km. Figure 3c shows the lower mesosphere, with temperatures ranging from about 180 to 220 K at altitudes of approximately 70–80 km. In contrast, Fig. 3b shows an upper-mesosphere inversion day temperature range from 180 to 220 K at an altitude of approximately 80–90 km. Figure 3d shows a lower-mesosphere inversion day temperature, with the temperature ranging from 180 to 225 K at an altitude of approximately 70–80 km. These inversion day temperatures are higher than those shown in Fig. 3a and c. This indicates that maximum temperatures occur on inversion days in both the upper- and lower-MLT regions relative to the observed temperature. These inversion day temperatures in Fig. 3b and d suggest a temperature gradient shifting from negative to positive. This could be due to factors such as atmospheric waves (planetary, tidal, and particularly gravity waves), chemical reactions, or solar radiation. Our temperature observations for the lower-MLT region on an inversion day, within the altitudinal range of 70–80 km, align with those reported by Sivakumar et al. (2001), who identified inversion day temperature variability in the altitudinal range of 73–79 km. Additionally, Sivakandan et al. (2014) examined mesospheric inversions in the 60–105 km altitude range over low-latitude regions; their findings closely match our results.
Figure 4 shows the frequency occurrence rates of MILs in histograms. It shows the occurrence rate for the upper MILs, while Fig. 4b shows the rates of the lower MILs. The mean frequency occurrence rate of the upper inversions is below approximately 40 %. The peak rates range from 60 % to 78 %, notably in the years 2008, 2010, and mid-2016. In contrast, the mean occurrence rate for the lower inversions of Fig. 4b is below approximately 20 %. The overall occurrence rate for the upper inversions is relatively higher compared to the lower inversions; this may be related to atmospheric wave activities, mainly gravity waves. Hauchecorne et al. (1987) and France et al. (2015) discuss the effects of gravity waves on inversion variability in the upper and lower mesosphere. Regarding these findings, Fig. 5 examines the characteristics of the inversion day temperature variability, based on their amplitude and thickness. It focuses on base height, amplitude, and thickness before examining the effects of gravity waves on an inversion. The histograms display the frequency distribution of amplitude, thickness, and base height for MLT temperature variability on inversion days, with the best-fit Gaussian distribution curves shown in red. The observed distributions align with Gaussian curves, indicating that the number of MILs follows a normal distribution. This suggests that the attributes are real-value random variables. The left column has three rows showing histograms of the (a) amplitude, (b) thickness, and (c) base height of the inversion day temperature variability for the upper MLT. These histograms also include the statistical metrics mean and standard deviation (SD) with their values. The corresponding right column has three rows representing the (d) amplitude, (e) thickness, and (f) base height of the inversion day temperature variability for the lower-MLT region.
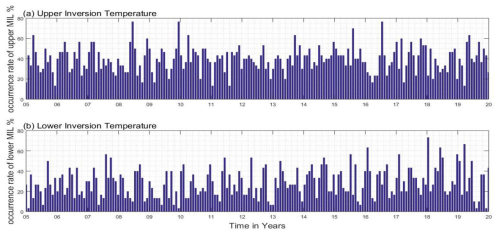
Figure 4The frequency occurrence rate (percentage) of the (a) upper and (b) lower inversion temperatures during 2005–2020 over low latitudes.
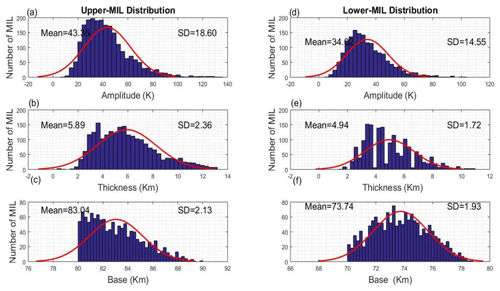
Figure 5The histograms depict the occurrence of MLT inversion day temperature variability. The first column shows the distribution of (a) amplitude, (b) thickness, and (c) base height for the upper inversion day. The second column presents the corresponding distribution for the lower inversion day, including (d) amplitude, (e) thickness, and (f) base height.
The amplitude of the upper inversion day temperature variability in Fig. 5a ranges from 20 to 80 K, with a peak value of 38 K. This follows a Gaussian distribution with a large SD of 18.6, which indicates high inversions. The thickness of the inversion layer for upper MILs, shown in Fig. 5b, ranges from 3 to 9 K, and their most probable value is 5.5 K, with a low SD of 2.3. The base height of the upper MIL in Fig. 5c ranges from ∼80 to 90 km, with a peak value of around 83 km. This indicates a large number of upper-MLT inversions, with an SD of 2.13. The highest number of upper inversions between 2005 and 2020 is observed at 82 km. This may be attributed to gravity wave breaking and energy dissipation, influenced by waves generated by lower-atmospheric regions and solar flux impacts.
The lower inversion amplitude, shown in Fig. 5d, ranges from 10 to 60 K, with a peak value of 25 K and an SD of 14.5. The inversion thickness, as illustrated in Fig. 5e, ranges from 3 to 8 km, with the most likely value at 3.8 km and with a low SD of 1.72. The base height of the lower inversion in Fig. 5f ranges from 70 to 80 km, with a peak value of around 74 km and a lower SD of 1.93. Previous investigations by Sivakandan et al. (2014) from the Indian sector reported amplitudes ranging from 14 to 39 K in 2002 and from 15 to 42 K in 2008. The thicknesses ranged from 2.7 to 7.5 km in 2002 and from 2.8 to 7.3 km in 2008 under the influence of solar flux. These findings align well with the present study, indicating no significant variation in characterizing mesospheric inversion based on amplitude and thickness in the low-latitude region within the altitude range of 60–90 km.
3.2 Latitudinal variations of MILs
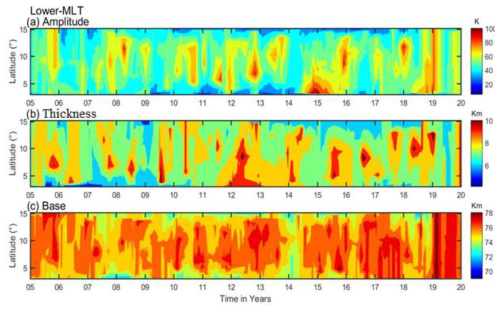
This section examines the spatiotemporal variability of upper- and lower-mesosphere inversion phenomena. The contour plots of time vs. latitude in Figs. 6 and 7 show the variability of the upper- and lower-MLT inversion amplitude, thickness, and base height over the low-latitude band (3–15° N) during 2005–2020. The upper inversion is observed around 80–90 km; the maximum amplitude, in the range of 90–120 K, occurs over the latitude band (5–12° N) in 2005, 2007, mid-2011, 2013, 2015, 2016, mid-2019, and 2020 (Fig. 6a). Figure 6b shows the thickness, with a maximum range of ∼ (8–12 km) across the entire latitudinal region (3–15° N). Figure 6c shows the base height, with relative maximum values of around ∼ (84–88 km) in the latitudinal range between 4 and 14° N in 2006, 2008, 2010, 2012, 2016, and 2018.
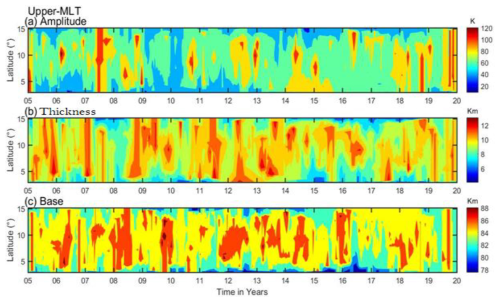
Figure 6The daily upper inversions (∼80–90 km) of (a) amplitude, (b) thickness, and (c) base height during 2005–2020 over the latitudinal variation.
The contour plots of Fig. 7a–c show the lower-MIL amplitude, thickness, and base height over an altitudinal range of ∼70–80 km. Overall, the amplitude values ranged from approximately 30 to 60 K across all the latitudinal bands, reaching a peak range of about 80–100 K in 2013, 2015, 2016, and 2019 in various latitudinal regions between 5 and 14° N. Figure 7b indicates thickness values ranging from 5 to 7 km across the entire latitude band, with the maximum thicknesses reaching 8–10 km in 2012–2013, 2016, and 2019. Figure 7c shows a base height of 76–80 km across most of the latitudes and periods, with notable exceptions in 2008, 2014, and mid-2018, when the base height reached its maximum.
The higher amplitude and greater thickness are demonstrated in the upper and lower inversions to exhibit a suggested highly dynamic phenomenon. These valuable investigations are confirmed in Gan et al. (2012) based on SABER satellite observations at low latitudes.
3.3 Analysis of perturbed temperature variations in the MLT region
The Tp of the upper- and lower-MLT inversions in Figs. 8 and 9 can be used further to calculate their derived potential energy of gravity waves and N2. First, the upper inversion profiles are identified in the MLT region during the entire observational period of 2005–2020, as shown in the contour plot of Fig. 8a. Based on the observed temperature, which ranges from ∼170 to 220 K with minimal variability, the background temperature is estimated. A third-order polynomial fit is applied to calculate T0, as shown in the contour plot of Fig. 8b. This maximum background temperature exhibits a periodic variability over an altitude of around ∼82–87 km, ranging from ∼195 to 197 K. The perturbed temperature profiles (Tp), determined by subtracting the background temperature profiles (T0) from the observed inversion temperature (T), are in the range from −25 to +25 K, as shown in Fig. 8c.
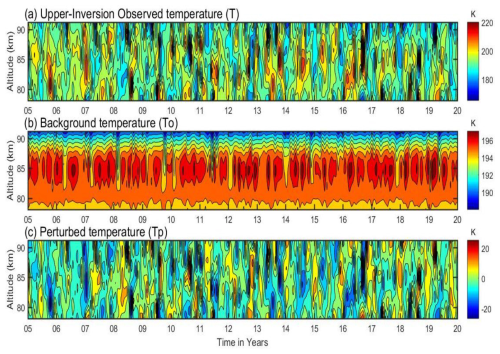
Figure 8The upper-mesosphere temperatures in the temperature bars are the (a) inversion day observed temperature, (b) background temperature, and (c) perturbed temperature.
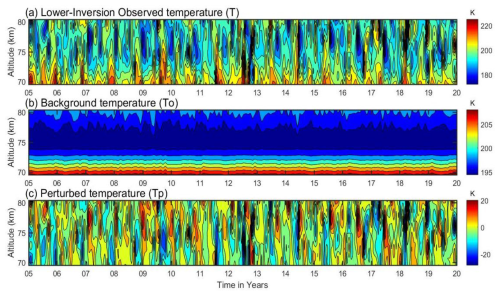
The lower-MLT region's Tp is calculated using the same approach as that of the upper-MLT perturbed temperature, using the observed and background temperatures. Their corresponding contours are displayed in Fig. 9a–c.
In Fig. 9a, the observed temperature of the lower inversion ranges from ∼170 to 220 K, whereas the background temperature of the lower inversion ranges from ∼195 to 210 K, with maximum values of ∼200–210 K at heights of ∼70–72 km, as shown in Fig. 9b. The derived lower-MLT perturbed temperature from the observed and background temperatures is presented in Fig. 9c and ranges from −25 to 20 K. Notably, the upper-MLT perturbed temperature is at its maximum compared to the lower-MLT region, possibly due to a highly dynamic phenomenon.
3.4 Effects of gravity waves on mesosphere inversions and the associated instability
Atmospheric gravity waves form when air parcels oscillate due to the restoring force of gravity after being transported vertically. Several factors contribute to these waves, including airflow over mountains, convection, and wind shear. As the waves propagate vertically, they break and dissipate, releasing energy and momentum into the surrounding atmosphere, which contributes to the formation of inversion layers. The gravity wave contribution is quantified by calculating the potential energy and assessing its impact on MLT instability through the N2 derived from data ranging from 2005 to 2020. Several authors (Tsuda et al., 2000; Wang and Geller, 2003; Liu et al., 2014; Thurairajah et al., 2014; Wang and Alexander, 2010) suggest that gravity wave activity is represented by potential energy. Further investigation is required, focusing on altitudes of 90, 85, 75, and 70 km, to evaluate the impacts of gravity waves on an inversion by applying a high-pass filter with a 1 h interval to the data (see Fig. 10a–d). The high-pass filter attenuates low-frequency components, removing the effects of long-period wave oscillations, such as tidal and planetary wave contributions. This effectively isolates the GWs, allowing a clearer focus on their impact on MLT inversions, as shown in Fig. 10.
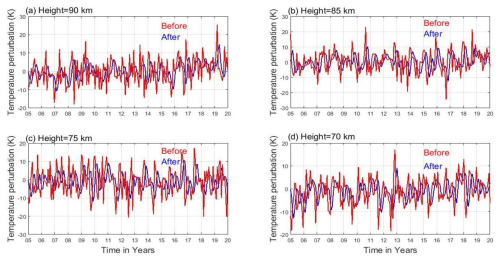
Figure 10Perturbed temperature profiles before (red) and after (blue) applying the high-pass filter for the upper (90 and 85 km; a, b) and lower (75 and 70 km; c, d) regions.
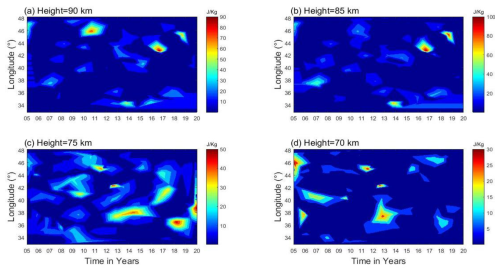
Figure 11Gravity wave potential energy for the upper-MLT (90 and 85 km; a, b) and lower-MLT (75 and 70 km; c, d) regions.
The blue curve in Fig. 10a–d appears smoother after applying the high-pass filter to the perturbed temperature. However, the filter removes the peaks of low-frequency variations, resulting in retained perturbed temperature values that appear more uniform, creating a smooth plateau effect. In the upper mesosphere (90 and 85 km), the filter reduces the amplitude of the wave oscillations from approximately ±20 to ±10 K, as shown by the blue curves in Fig. 10a and b compared to the red curves. Similarly, in the lower mesosphere (75 and 70 km) (Fig. 10c and d), the amplitude decreases from ∼ (−20 to 20 K) to ∼ (−8 to 8 K) when filtering out higher amplitudes.
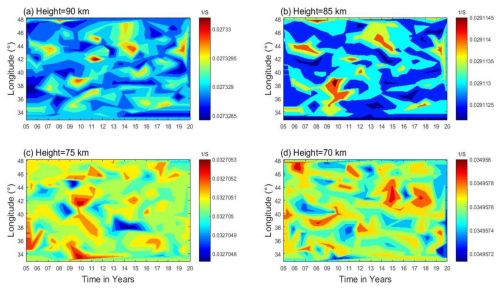
Figure 12Brunt–Väisälä frequency (N2) variability for the upper (90 and 85 km; a, b) and lower (75 and 70 km; c, d) regions.
In the MLT atmospheric region, gravity wave breaking typically dissipates the potential and kinetic energy, leading to increased turbulence and mixing. As illustrated, gravity wave propagation and dissipation are major forces in the MLT (Lindzen, 1981; Holton, 1983), influencing the middle- and upper-atmospheric regions. This has a substantial impact on the overall dynamics as well as the MLT's thermal structure, particularly the increase in temperature variability with elevation known as inversion. Holton et al. (2003) and Holton and Hakim (2013) demonstrate an interaction between the potential energy of gravity waves and inversions. These notable upper and lower inversions are observed in Fig. 4 during the period 2005–2020 over the low-latitude regions. During this period, particularly for the upper-MLT region above 80 km altitude, high-resolution SABER satellite temperature data revealed the presence of a strong MIL, with peak occurrence rates ranging from 60 % to 78 %, especially in 2010, 2014, 2016/17, and 2018/19 (Fig. 4a). Correspondingly, at the same time and in the same region (upper MLT), at altitudes of 85 and 90 km, there is a noticeable increase in the gravity wave potential energy (Ep), as shown in Fig. 11. The maximum potential energy for the upper-MLT region corresponds to the breaking or dissipation of gravity waves as they propagate upward. This spike in potential energy coincides with the occurrence of the inversion layer, suggesting that the breaking or dissipation of gravity waves releases energy into the atmosphere, contributing to localization of heating in the mesosphere and leading to the formation of the inversion. The sudden transfer of momentum and energy from the breaking GWs to the surrounding atmosphere disrupts the thermal structure, causing the temperature inversion. In this case, the temporal and spatial coincidence between the peak of the gravity wave potential energy and the formation of the inversion demonstrates a clear physical connection. The energy released from breaking GWs plays a direct role in the creation of the inversion layer, as shown in Figs. 4 and 11. Similarly, the statistical distributions of upper-MLT inversions in Fig. 5a show maximum amplitudes, which correspond to the maximum potential energy of the gravity waves in Fig. 11a and b. This provides a straightforward demonstration of how gravity wave dynamics – specifically, the dissipation of their potential energy – are linked to the formation of MILs.
Figure 11a–d demonstrate the spatiotemporal variability of gravity wave potential energy, shown over the upper MLT at 90 and 85 km and the lower MLT at 75 and 70 km. Figure 11a of the upper-MLT inversions at 90 km shows maximum gravity wave potential energies, ranging from ∼70 to 90 J kg−1, over the longitudinal regions of 45–47° E, 43° E, and 44° E in 2011, 2017, and 2019. In contrast, potential energies, being the least in amount around ∼10 to 60 J kg−1, are present across the entire longitudinal region from 33 to 48° E. Figure 11b of the upper-MLT region shows maximum potential energies of ∼70 to 100 J kg−1 over the longitudinal regions of 34, 44, and 46° E in 2014, 2016, and 2018 at 85 km. Its minimum potential energies between 20 and 70 J kg−1 appear over the longitudinal regions from 33 to 48° E, whereas Fig. 11c and d depict the gravity wave potential energy in the lower-MLT region at 75 and 70 km, respectively. At 75 km, Fig. 11c shows a relative maximum potential energy of 40–50 J kg−1 over the longitudinal regions of 46, 42, 40, 37, 36, and 38° E in 2011, 2012, 2017, 2013–2015, 2018, and 2020. Similarly, Fig. 11d illustrates gravity wave potential energy ranging from 2 to 30 J kg−1 at 70 km across the longitudinal region of 33–48° E. Its maximum potential energy of 25–30 J kg−1 is observed in certain longitudinal regions over time.
The role of gravity waves in the MLT region's instability, the Brunt–Väisälä frequency, is analyzed. The contour plots in Fig. 12a–d show the spatiotemporal variability of the Brunt–Väisälä frequency, with Fig. 12a and b representing the upper MLT (90 and 85 km) and Fig. 12c and d representing the lower MLT (75 and 70 km). The N2 shows that the upper-MLT region is more unstable (∼0.027 at 90 km and ∼0.029 at 85 km) relative to that of the lower-MLT region (∼0.033 at 75 km and ∼0.035 at 70 km). These different values of the Brunt–Väisälä frequency are a consequence of gravity wave generation in different sizes, with smaller waves being the main derivers of instability and turbulence in the MLT region (Liu and Meriwether, 2004; Szewczyk et al., 2013; Yuan et al., 2014). Hauchecorne et al. (1987) propose a model where a series of breaking gravity waves leads to the formation of MILs through the gradual accumulation of heat, which contributes to the instability. Using the MIL phenomenon is crucial for understanding MLT atmospheric dynamics, especially when it comes to stability and energy transfer.
In this article, 16 years of SABER MLT temperature profiles are utilized to investigate the MIL phenomenon and its causative mechanism through gravity wave potential energy and instability criteria of the Brunt–Väisälä frequency (N2) at low latitudes. The following conclusions are drawn from the observations in this article:
-
The upper-mesosphere inversion frequency occurs more often than the lower-mesosphere inversion frequency.
-
Analysis of the MIL characteristic features reveals the most probable values for the upper inversion: an amplitude of 38 K, a thickness of 5.5 km, and a base height of 78 km. The lower inversion has an amplitude of 25 K, a thickness of 3.8 km, and a base height of 73 km.
-
The upper-mesosphere region has higher gravity wave potential energy compared to the lower-mesosphere region.
-
The high potential energy in the upper-mesosphere region is likely due to the deposition of energy and momentum by gravity wave breaking. This could influence the dynamics of the inversion phenomenon.
-
The N2 indicates that the upper-mesosphere region is less stable than the lower-mesosphere region. This lower stability contributes to the high potential energy in the upper mesosphere, which leads to larger inversion phenomena.
-
Atmospheric processes vary significantly from region to region, with altitude, and over time.
The SABER data are freely available via the link at http://saber.gats-inc.com/index.php (Russell et al., 2017).
CL: data curation, investigation, software, visualization, writing – original draft, writing – review. UJPR: supervision, editing.
The contact author has declared that none of the authors has any competing interests.
Publisher's note: Copernicus Publications remains neutral with regard to jurisdictional claims made in the text, published maps, institutional affiliations, or any other geographical representation in this paper. While Copernicus Publications makes every effort to include appropriate place names, the final responsibility lies with the authors.
The authors would like to express their gratitude to the National Aeronautics and Space Administration (NASA) for providing the SABER data from the website at http://saber.gats-inc.com/index.php (last access: 30 December 2020).
This paper was edited by Igo Paulino and reviewed by Olga Zorkaltseva, Ana Roberta Paulino, and one anonymous referee.
Bègue, N., Mbatha, N., Bencherif, H., Loua, R. T., Sivakumar, V., and Leblanc, T.: Statistical analysis of the mesospheric inversion layers over two symmetrical tropical sites: Réunion (20.8° S, 55.5° E) and Mauna Loa (19.5° N, 155.6° W), Ann. Geophys., 35, 1177–1194, https://doi.org/10.5194/angeo-35-1177-2017, 2017.
Bizuneh, C. L., Prakash, R., and Nigussie, M.: Long-term temperature and ozone response to natural drivers in the mesospheric region using 16 years (2005–2020) of TIMED/SABER observation data at 5–15° N, Adv. Space Res., 70, 2095–2111, https://doi.org/10.1016/j.asr.2022.06.051, 2022.
Collins, J., Smith, A., Johnson, B., and Brown, C.: Dynamics of the middle atmosphere and its impact on weather systems, J. Atmos. Sol.-Terr. Phy., 120, 45–59, https://doi.org/10.1016/j.jastp.2014.01.005, 2014.
Collins, R. L., Lehmacher, G. A., Larsen, M. F., and Mizutani, K.: Estimates of vertical eddy diffusivity in the upper mesosphere in the presence of a mesospheric inversion layer, Ann. Geophys., 29, 2019–2029, https://doi.org/10.5194/angeo-29-2019-2011, 2011.
Cutler, L. J., Collins, R. L., Mizutani, K., and Itabe, T.: Rayleigh lidar observations of mesospheric inversion layers at Poker Flat, Alaska (65° N, 14° W), Geophys. Res. Lett., 28, 1467–1470, https://doi.org/10.1029/2000GL012535, 2001.
Dou, X., Li, T., Xu, J., Liu, H. L., Xue, X., Wang, S., Leblanc, T., McDermid, I. S., Hauchecorne, A., Keckhut, P., Bencherif, H., Heinselman, C., Steinbrecht, W., Mlynczak, M. G., and Russell III, J. M.: Seasonal oscillations of middle atmosphere temperature observed by Rayleigh lidars and their comparisons with TIMED/SABER observations, J. Geophys. Res., 114, D20103, https://doi.org/10.1029/2008JD011654, 2009.
Duck, T. J. and Greene, M. D.: High Arctic observations of mesospheric inversion layers, Geophys. Res. Lett., 31, L02105, https://doi.org/10.1029/2003GL018481, 2004.
Duck, T. J., Sipler, D. P., and Salah, J. E.: Rayleigh lidar observations of a mesospheric inversion layer during night and day, Geophys. Res. Lett., 28, 3597–3600, 2001.
Fechine, J., Wrasse, C. M., Takahashi, H., Mlynczak, M. G., and Russell, J. M.: Lower-mesospheric inversion layers over Brazilian equatorial region using TIMED/SABER temperature profiles, Adv. Space Res., 41, 1447–1453, https://doi.org/10.1016/j.asr.2007.04.070, 2008.
France, J. A., Harvey, V. L., Randall, C. E., Collins, R. L., Smith, A. K., Peck, E. D., and Fang, X.: A climatology of planetary wave-driven mesospheric inversion layers in the extratropical winter, J. Geophys. Res.-Atmos., 120, 399–413, https://doi.org/10.1002/2014JD022244, 2015.
Fritts, D. C. and Alexander, M. J.: Gravity wave dynamics and effects in the middle atmosphere, Rev. Geophys., 41, 1003, https://doi.org/10.1029/2001RG000106, 2003.
Fritts, D. C., Laughman, B., Wang, L., Lund, T. S., and Collins, R. L.: Gravity wave dynamics in a mesospheric inversion layer: 1. Reflection, trapping, and instability dynamics, J. Geophys. Res.-Atmos., 123, 626–648, https://doi.org/10.1002/2017JD027440, 2018a.
Fritts, D. C., Wang, L., Laughman, B., Lund, T. S., and Collins, R. L.: Gravity wave dynamics in a mesospheric inversion layer: 2. Instabilities, turbulence, fluxes, and mixing, J. Geophys. Res.-Atmos., 123, 649–670, https://doi.org/10.1002/2017JD027442, 2018b.
Gan, Q., Zhang, S. D., and Yi, F.: TIMED/SABER observations of lower mesospheric inversion layers at low and middle latitudes, J. Geophys. Res., 117, D07109, https://doi.org/10.1029/2012JD017455, 2012.
Gan, Q., Zhang, S. D., and Yi, F.: A numerical study of gravity wave penetration into the ionosphere, Earth Planets Space, 66, 111, https://doi.org/10.1186/1880-5981-66-111, 2014.
Garcia-Comas, M., Lopez-Puertas, M., Marshall, B. T., Winter Steiner, P. P., Funke, B., Bermejo-Pantaleon, D., Mertens, C. J., Remsberg, E. E., Gordley, L. L., Mlynczak, M. G., and Russell III, J. M.: Errors in Sounding of the Atmosphere using Broadband Emission Radiometry (SABER) kinetic temperature caused by non-local-thermodynamic-equilibrium model parameters, J. Geophys. Res., 113, D24106, https://doi.org/10.1029/2008JD010105, 2008.
Hauchecorne, A., Chanin, M. L., and Wilson, R.: Mesospheric temperature inversion and gravity wave breaking, Geophys. Res. Lett., 14, 933–936, https://doi.org/10.1029/GL014i009p00933, 1987.
Hirota, I.: Climatology of gravity waves in the middle atmosphere, J. Atmos. Terr. Phys., 46, 767–773, 1984.
Holton, J. R.: The influence of gravity wave breaking on the general circulation of the middle atmosphere, J. Atmos. Sci., 40, 2497–2507, 1983.
Holton, J. R. and Hakim, G. J.: An introduction to dynamic meteorology, 5th ed., Academic Press, Cambridge, Massachusetts, 2013.
Holton, J. R., Curry, J. A., and Pyle, J. A.: Encyclopedia of atmospheric sciences, vol. 1, Academic Press, London, 2003.
Irving, B. K., Collins, R. L., Lieberman, R. S., Thurairajah, B., and Mizutani, K.: Mesospheric Inversion Layers at Chatanika, Alaska (65° N, 147° W): Rayleigh lidar observations and analysis, J. Geophys. Res.-Atmos., 119, 11235–11249, https://doi.org/10.1002/2014JD021838, 2014.
John, S. R. and Kumar, K. K.: TIMED/SABER observations of global gravity wave climatology and their interannual variability from stratosphere to mesosphere lower thermosphere, Clim. Dynam., 39, 1489–1505, https://doi.org/10.1007/s00382-012-1329-9, 2012.
Leblanc, T. and Hauchecorne, A.: Recent observations of mesospheric temperature inversions, J. Geophys. Res., 102, 19471–19482, https://doi.org/10.1029/97JD01445, 1997.
Leblanc, T., McDermid, I. S., Hauchecorne, A., and Keckhut, P.: Evaluation of optimization of lidar temperature analysis algorithms using simulated data, J. Geophys. Res., 103, 6177–6187, 1998.
Lindzen, R. S.: Turbulence and stress due to gravity waves and tidal breakdown, J. Geophys. Res., 86, 9707–9714, https://doi.org/10.1029/JC086iC10p09707, 1981.
Lingerew, C., Jaya Prakash Raju, U., and Guimarães Santos, C. A.: NN-MLT model prediction for low-latitude region based on artificial neural network and long-term SABER observations, Earth and Space Science, 10, e2023EA002930, https://doi.org/10.1029/2023EA002930, 2023.
Liu, A. Z. and Meriwether, J. W.: A study on atmospheric dynamics, J. Atmos. Sci., 47, 123–135, https://doi.org/10.1016/j.jas.2004.02.001, 2004.
Liu, S.-D. and Liu, S.-S.: Atmosphere Dynamics, Peking University Press, Beijing, 2011.
Liu, X., Xue, X., Dou, X., Qian, J., and Wang, Y.: A global morphology of gravity wave activity in the mesosphere and lower thermosphere as derived from SABER data, J. Atmos. Sol.-Terr. Phy., 119, 7181, https://doi.org/10.1016/j.jastp.2014.07.010, 2014.
Meriwether, J. W. and Gardner, C. S.: A review of the mesosphere inversion layer phenomenon, J. Geophys. Res., 105, 12405–12416, 2000.
Meriwether, J. W. and Gerrard, A. J.: Mesosphere inversion layers and stratosphere temperature enhancements, Rev. Geophys., 42, RG3003, https://doi.org/10.1029/2003RG000133, 2004.
Ramesh, K. and Sridharan, S.: Large mesospheric inversion layer due to breaking of small scale gravity waves: Evidence from Rayleigh lidar observations over Gadanki (13.51° N, 79.21° E), J. Atmos. Sol.-Terr. Phy., 89, 90–97, https://doi.org/10.1016/j.jastp.2012.08.011, 2012.
Ramesh, K., Sridharan, S., Vijaya Bhaskara Rao, S., Raghunath, K., and Bhavani Kumar, K.: Rayleigh lidar observations of mesospheric inversion layers over Gadanki (13.5° N, 79.2° E) and their relation with gravity wave activities, Indian J. Radio Space, 43, 83–90, 2013.
Ramesh, K., Sridharan, S., and Vijaya Bhaskara, S.: Causative mechanisms for the occurrence of a triple-layered mesospheric inversion event over low latitudes, J. Geophys. Res.-Space, 119, 3930–3943, https://doi.org/10.1002/2013JA019750, 2014.
Ramesh, K., Sridharan, S., Raghunath, K., and Rao, S. V. B.: A chemical perspective of day and night tropical (10° N–15° N) mesospheric inversion layers, J. Geophys. Res.-Space, 122, 85–96, https://doi.org/10.1002/2016JA023721, 2017.
Remsberg, E., Lingenfelser, V., Harvey, V., Grose, W., Russell III, J., Mlynczak, M., Gordley, L., and Marshall, B. T.: The verification of the quality of SABER temperature, geopotential height, and wind fields by comparison with Met Office assimilated analyses, J. Geophys. Res., 108, 4628, https://doi.org/10.1029/2003JD003720, 2003.
Rezac, L., Kutepov, A., Russell, J. M., Feofilov, A. G., Yue, J., and Goldberg, R. A.: Simultaneous retrieval of T(p) and CO2 VMR from two-channel non-LTE limb radiances and application to daytime SABER/TIMED measurements, J. Atmos. Sol.-Terr. Phy., 130–131, 23–42, https://doi.org/10.1016/j.jastp.2015.05.004, 2015.
Russell, J. M., Mlynczak, M. G., Gordley, L. L., Tansock, J., and Esplin, R.: An overview of the SABER experiment and preliminary calibration results, in: Proceedings of the SPIE, 44th Annual Meeting, Denver, CO, USA, 3756, 277–288, https://doi.org/10.1117/12.366382, 1999.
Russell, J. M., Edwards, D. P., Mertens, C. J., Gordley, L. L., Gille, J. C., Huang, H. L., and Janz, S. J.: SABER: Sounding of the Atmosphere using Broadband Emission Radiometry (Version 2.0), GATS, Inc., http://saber.gats-inc.com/index.php (last access: 23 December 2024), 2017.
Schmidlin, F. J.: Temperature inversions near 75 km, Geophys. Res. Lett., 3, 173–176, 1976.
Sica, R. J., Argall, P. S., Shepherd, T. G., and Koshyk, J. N.: Model-measurement comparison of mesospheric temperature inversions, and a simple theory for their occurrence, Geophys. Res. Lett., 34, L23806, https://doi.org/10.1029/2007GL030627, 2007.
Singh, R. P. and Pallamraju, D.: Mesospheric temperature inversions observed in OH and O2 rotational temperatures from Mount Abu (24.6° N, 72.8° E), India, J. Geophys. Res.-Space, 123, 8823–8834, https://doi.org/10.1029/2018JA025703, 2018.
Sivakandan, M., Kapasi, D., and Taori, A.: The occurrence altitudes of middle atmospheric temperature inversions and mesopause over low-latitude Indian sector, Ann. Geophys., 32, 967–974, https://doi.org/10.5194/angeo-32-967-2014, 2014.
Sivakumar, V., Bhavani Kumar, Y., Raghunath, K., Rao, P. B., Krishnaiah, M., Mizutani, K., Aoki, T., Yasui, M., and Itabe, T.: Lidar measurements of mesospheric temperature inversion at a low latitude, Ann. Geophys., 19, 1039–1044, https://doi.org/10.5194/angeo-19-1039-2001, 2001.
Smith, A.: Global Dynamics of the MLT, Surv. Geophys., 33, 1177–1230, https://doi.org/10.1007/s10712-012-9196-9, 2012.
Sridharan, S., Sathishkumar, S., and Gurubaran, S.: Influence of gravity waves and tides on mesospheric temperature inversion layers: simultaneous Rayleigh lidar and MF radar observations, Ann. Geophys., 26, 3731–3739, https://doi.org/10.5194/angeo-26-3731-2008, 2008.
Szewczyk, A., Strelnikov, B., Rapp, M., Strelnikova, I., Baumgarten, G., Kaifler, N., Dunker, T., and Hoppe, U.-P.: Simultaneous observations of a Mesospheric Inversion Layer and turbulence during the ECOMA-2010 rocket campaign, Ann. Geophys., 31, 775–785, https://doi.org/10.5194/angeo-31-775-2013, 2013.
Thurairajah, B., Bailey, S. M., and Russell III, J. M.: Gravity wave activity in the middle atmosphere during sudden stratospheric warming events, J. Geophys. Res.-Atmos., 119, 41014111, https://doi.org/10.1002/2013JD020918, 2014.
Tsuda, T., Nishida, M., Rocken, C., and Ware, R. H.: A global morphology of gravity wave activity in the stratosphere revealed by the GPS occultation data (GEODYN), J. Geophys. Res.-Atmos., 105, 7257–7273, https://doi.org/10.1029/1999JD901005, 2000.
Vadas, S. L. and Fritts, D. C.: Thermosphere responses to gravity waves: Influences of increasing viscosity and thermal diffusivity, J. Geophys. Res., 110, D15103, https://doi.org/10.1029/2004JD005574, 2005.
Walterscheid, R. L. and Hickey, M. P.: Gravity wave ducting in the upper mesosphere and lower thermosphere duct system, J. Geophys. Res., 114, D19109, https://doi.org/10.1029/2008JD011269, 2009.
Wang, L. and Alexander, M. J.: Global estimates of gravity wave parameters from GPS radio occultation temperature data, J. Geophys. Res., 115, D21122, https://doi.org/10.1029/2010JD013860, 2010.
Wang, L. and Geller, M. A.: Morphology of gravity wave energy as observed from 4 years (1998–2001) of high vertical resolution U.S. radiosonde data, J. Geophys. Res.-Atmos., 108, https://doi.org/10.1029/2002JD002786, 2003.
Yuan, T., Pautet, P. D., Zhao, Y., Cai, X., Criddle, N. R., Taylor, M. J., and Pendleton, W. R.: Coordinated investigation of mid-latitude upper mesospheric temperature inversion layers and the associated gravity wave forcing in Logan, Utah, J. Geophys. Res.-Atmos., 119, 3756–3769, https://doi.org/10.1002/2013JD020586, 2014.


