the Creative Commons Attribution 4.0 License.
the Creative Commons Attribution 4.0 License.
 | 28 Feb 2024
Climatological comparison of polar mesosphere summer echoes over the Arctic and Antarctica at 69°
Damian J. Murphy
Polar mesosphere summer echoes (PMSE) have been observed for more than 30 years with 50 MHz VHF radars at various locations in the Northern Hemisphere. Continuous observation of PMSE is conducted on the northern Norwegian island of Andøya (69.3° N) using the ALWIN radar (1999–2008) and MAARSY (since 2010). The same kind of PMSE measurements began in 2004 in the Southern Hemisphere with the Australian Antarctic Division's VHF radar at Davis Station in Antarctica (68.6° S), which is at an opposite latitude to Andøya. Since the radars at both sites are calibrated, the received echo strength of PMSE from more than 1 decade of mesospheric observations on both hemispheres could be converted to absolute signal power, allowing for direct comparison of the measurements. Comparison of PMSE observations obtained at both radar sites during a period of 23 boreal summers (Andøya) and 15 austral summers (Davis) shows that their PMSE signal strengths are of the same order of magnitude, but significantly fewer PMSE are observed in the Southern Hemisphere than in the Northern Hemisphere. Compared to Andøya, the PMSE season over Davis starts about 7 d later on average and ends 9 d earlier, making it 16 d shorter. PMSE over Davis occur less frequently but with greater variability in seasonal, diurnal, and altitudinal occurrence. For example, PMSE over Davis reach maximum altitudes about 1.5 km higher than those over Andøya.
- Article
(3233 KB) - Full-text XML
- BibTeX
- EndNote


Radar echoes in the very high frequency range (VHF) from the mesosphere and lower thermosphere have been detected from the Norwegian island of Andøya (69.30° N, 16.03° E) for more than 23 years. The strong echoes from the mesopause region and above observed mainly in the summer months have been known as polar mesosphere summer echoes (PMSE) for more than 30 years. PMSE result from inhomogeneities in electron density of a size comparable to the radar Bragg scale caused by neutral air turbulence combined with the action of negatively charged aerosol or ice particles, the latter existing only in the extremely cold mesopause region during the summer months. The existence of ice particles in the mesopause region or the resulting visual phenomenon of noctilucent clouds (NLC) is known from various ground-, rocket-, and satellite-based observations. The close connection between PMSE and NLC was confirmed early on by simultaneous and common-volume lidar and radar measurements (e.g. von Zahn and Bremer, 1999). Early observations of PMSE and their relationship to NLC are discussed in detail in Cho and Röttger (1997), while a comprehensive overview of the current understanding of this phenomenon is given in Rapp and Lübken (2004).
However, suitable measurements in the Southern Hemisphere (SH) have been rare in the past and limited to low southern latitudes, largely due to the lack of radars in the southern polar region. The first experiments for PMSE observations in the Southern Hemisphere were conducted by Balsley et al. (1993) at the Peruvian Antarctic base on King George Island (62.1° S) called Machu Picchu during the austral summer of 1992/1993. Analysis of these observations led to the conclusion that PMSE do not exist at this latitude (Balsley et al., 1993) or, if they exist at all, these echoes must be at least 34 to 44 dB weaker than their NH counterparts (Balsley et al., 1995). One year later, the first SH PMSE were observed with the improved radar at Machu Picchu (Woodman et al., 1999). These observations confirmed the earlier conclusions that there are large differences between the strength of PMSE observed in the two hemispheres. Woodman et al. (1999) attributed this asymmetry to differences in mesopause temperature between the two sites. Huaman and Balsley (1999) suggested that differences in water vapour and dynamics may be the cause of the observed delay in the occurrence of PMSE. However, Lübken et al. (1999) showed, based on in situ measurements, that there is no significant difference in polar mesopause temperature between the two hemispheres. Lübken et al. (2017), on the other hand, showed with high-resolution temperature measurements using resonance lidar at Davis (68.6° S, 78.0° E) that a sudden mesopause height increase and associated mesopause temperature decrease can occasionally occur in the SH. These so-called “mesopause jumps” only occur in the SH and are associated with the late breakdown of the polar vortex.
Morris et al. (2004) presented the first morphology of daily and seasonal occurrence of SH PMSE based on VHF radar observations at Davis during 2003/2004 austral summer. They concluded that SH PMSE observed at 68.6° S had similar characteristics to published observations (i.e. height, intensity, daily, and seasonal distribution of occurrence) at similar northern latitudes, at least for the last 3 weeks of the austral PMSE season. Latteck et al. (2007) conducted the first comparison of continuous measurements of PMSE collected at Andøya (69° N) during the 2004 boreal summer and at Davis (69° S) during 2004/2005 austral summer based on radar volume reflectivity. They found that PMSE observed at Davis were weaker and reached maximum altitudes about 1 km higher than those observed in the Northern Hemisphere at an equivalent latitude. In addition, PMSE over Davis occurred less frequently but with greater variability. The PMSE seasons studied began about 34 d before the solstice at Andøya and Davis, but the duration of the PMSE season was about 9 d shorter at Davis. Another study that examined continuous PMSE observations during three Arctic summers at Andøya and three Antarctic summers at Davis confirmed these statements (Latteck et al., 2008). The volume reflectivity distribution of PMSE observed at Andøya showed a larger maximum ( m−1) than the distribution of its counterparts observed at Davis ( m−1). The mean PMSE occurrence was smaller and more variable over Davis than at Andøya. The duration of the mean PMSE season was about 16 d shorter at Davis than at Andøya. The diurnal variations in PMSE occurrence showed a maximum at 11–16 LMT (local mean time) in both hemispheres. The mean altitude was 85.5 km at Davis, about 0.7 km higher than at Andøya. The vertical extent of the PMSE height distribution was 8.4 km over Davis, about 3 km less than at Andøya. Differences in mesospheric temperatures were suggested as a major cause of the observed differences in PMSE occurrence at Davis and Andøya, as shown by model studies and supported by temperature measurements by meteor radars. Kirkwood (2007) compared PMSE measured with cross-calibrated VHF radars in the Arctic (Kiruna, 68° N) and Antarctica (Wasa, 73° S) and found that the PMSE characteristics of the two sites were very similar in late summer.
In this paper, the interhemispheric PMSE comparison is revisited by including more than 1 decade of observations. It is confirmed that the SH PMSE are indeed more climatologically variable in terms of season, time of day, and altitude than their NH counterparts. The paper is structured as follows. The observations are described in Sect. 2, followed by the climatological comparisons of reflectivity and distribution of occurrence as a function of season, time of day, and altitude in Sect. 3, a discussion (Sect. 4), and a summary.
Mesospheric radar echoes have been observed at the northern tip of Andøya, Norway (69.3° N, 16.0° E), starting from the early 1990s using the mobile SOUSY radar (Czechowsky et al., 1984). From 1994, these observations continued during summer measurement campaigns with the ALOMAR SOUSY radar (Singer et al., 1995). ALOMAR SOUSY was replaced in 1999 by the ALWIN radar (Latteck et al., 1999), which was in continuous operation between 1999 and 2008. ALWIN was followed in 2010 by the Middle Atmosphere Alomar Radar SYstem (MAARSY) (Latteck et al., 2012). During the construction phase of MAARSY in 2009, ALWIN was operated with a reduced number of antennas for PMSE observations (Latteck et al., 2010). In the summer of 2010, the observation of mesospheric echoes could be continued with a first expansion stage of MAARSY (Latteck et al., 2010). Since May 2011 MAARSY has been fully extended. ALWIN was operated on a radar frequency of 53.5 MHz, on which MAARSY continues to operate. Most of the other technical parameters such as the transmitter peak power, the filter characteristics of the receivers, or the antenna aperture were different (Table 1).
Table 1Basic radar parameters and experiment configurations used with ALWIN, MAARSY, and the Davis VHF radar, relevant to the determination of volume reflectivity from PMSE observations used in this study.
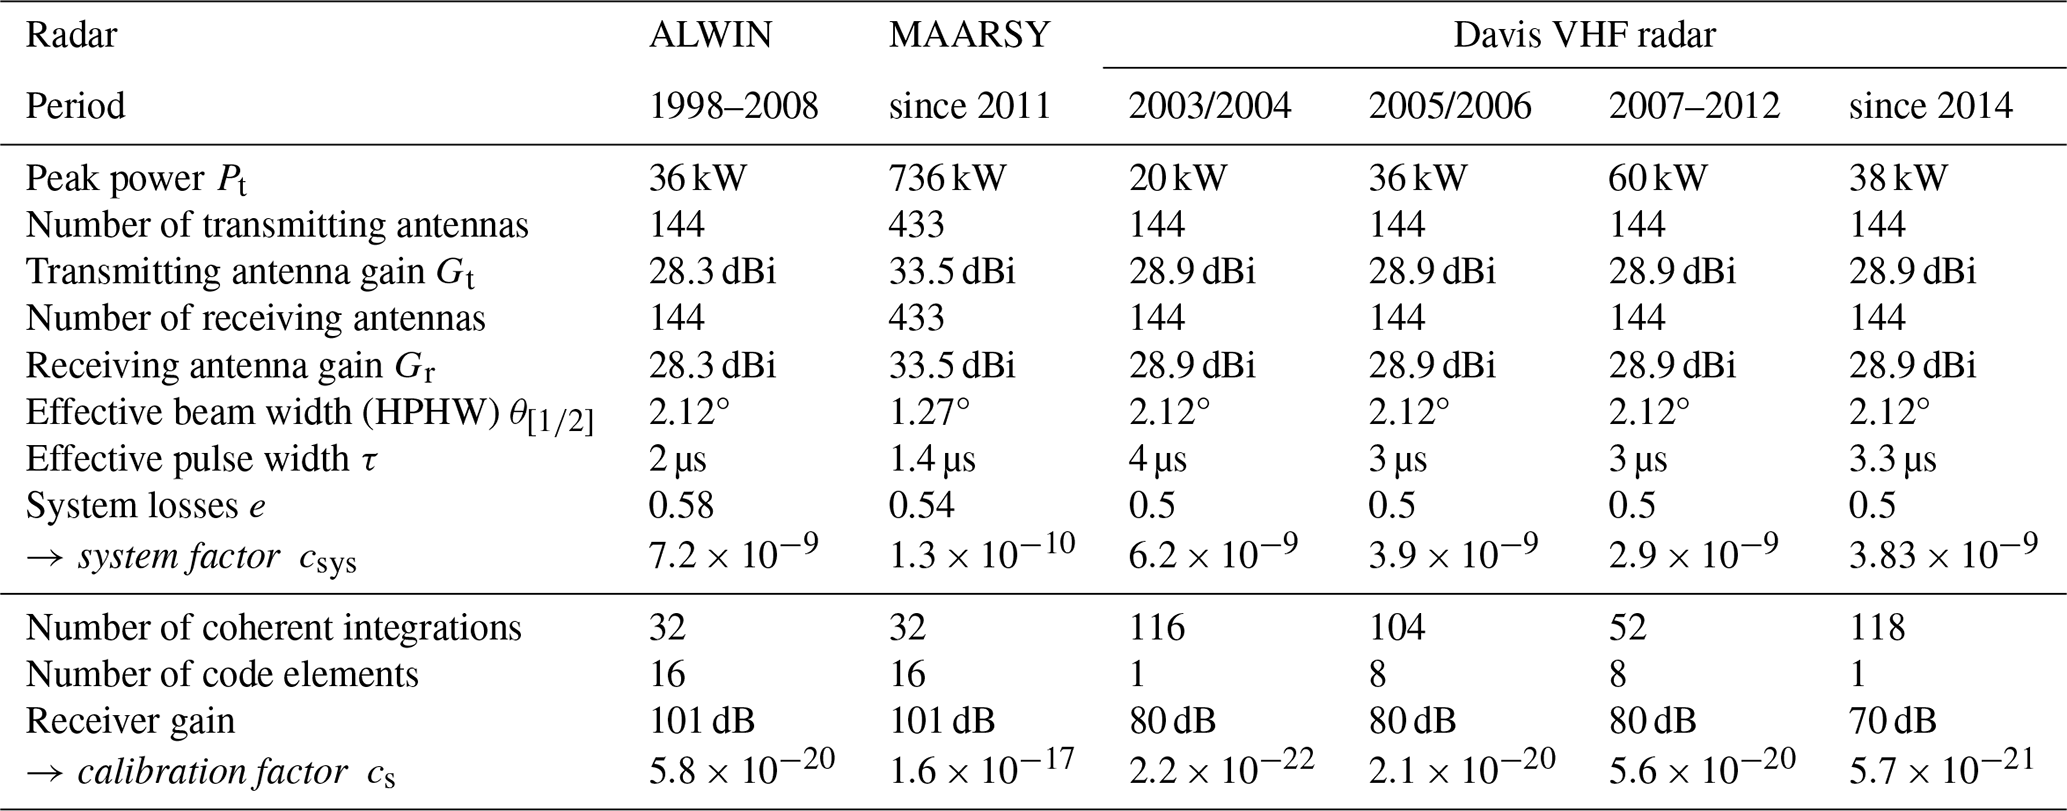
The VHF radar at Davis, Antarctica (68.6° S, 78.0° E), was installed in the late austral summer of 2002/2003 (Morris et al., 2004). Apart from the radar frequency of 55.0 MHz and the slightly lower peak power (see Table 1), the Davis VHF radar was similar to ALWIN in its design and technical parameters at the time of its installation. In January 2005, the Davis VHF radar received a system upgrade, mainly replacing the transmitter and beam control unit, and was changed another time in 2014. Since that year, the radar was also not operated in any special mode for mesospheric observations. Instead, the focus was placed on tropospheric measurements. This was expressed among other things in an increased pulse repetition frequency (4750 Hz) adapted to range-alias the PMSE altitude range such that mesospheric echoes were recorded between approx. 17 and 30 km.
In order to use comparable parameters from data from different radars, the received echo power was converted to radar volume reflectivity. The radar volume reflectivity η is defined as the power that would be scattered if all powers were isotropically scattered with a power density equal to that of the backscattered radiation, per unit volume and per unit incident power density (Hocking, 1985). It can be expressed as
where r is the distance to the scatterers, Gt and Gr are the one-way gain of the transmit and receive antennas respectively, is the effective half-width of the combined transmit/receive antenna beam, λ is the radar wavelength, e is the system efficiency, which mainly includes the antenna feed system losses, Pt is the transmitted peak power, Pr is the received signal power, c is the speed of light, and τ is the effective pulse width (Hocking and Röttger, 1997). The correction term 2ln (2) accounts for the non-uniform antenna gain over half the power width (Probert-Jones, 1962; Skolnik, 1990). All the system-dependent parameters of Eq. (1) can be combined into a system factor csys, as shown in Table 1 for the different periods and radar configurations. Thus, the radar reflectivity η depends only on the distance to the scatterers r and the absolute value of the received signal power Pr:
The VHF radars at Andøya and Davis are calibrated regularly and specifically before and after all major engineering changes following a procedure described in Latteck et al. (2008) and Appendix A1. A compilation of the main technical parameters of the radars used in this study and the parameters of the experimental configurations as used for standard observations of PMSE are listed in Table 1. However, some of the parameters listed there have changed in experiment configurations during special campaigns.
3.1 Signal strength characteristics
The PMSE data sets reused in this study are based on 6 min and 300 m averages of radar volume reflectivities of PMSE observations from ALWIN and MAARSY and the Davis VHF radar respectively. To use reliable values and exclude outliers, PMSE events were detected and flagged in the data sets. A PMSE event was defined as a radar reflectivity increase above the detection limit, persisting for a minimum duration of 24 min (equivalent to four consecutive averages) within a single range gate.
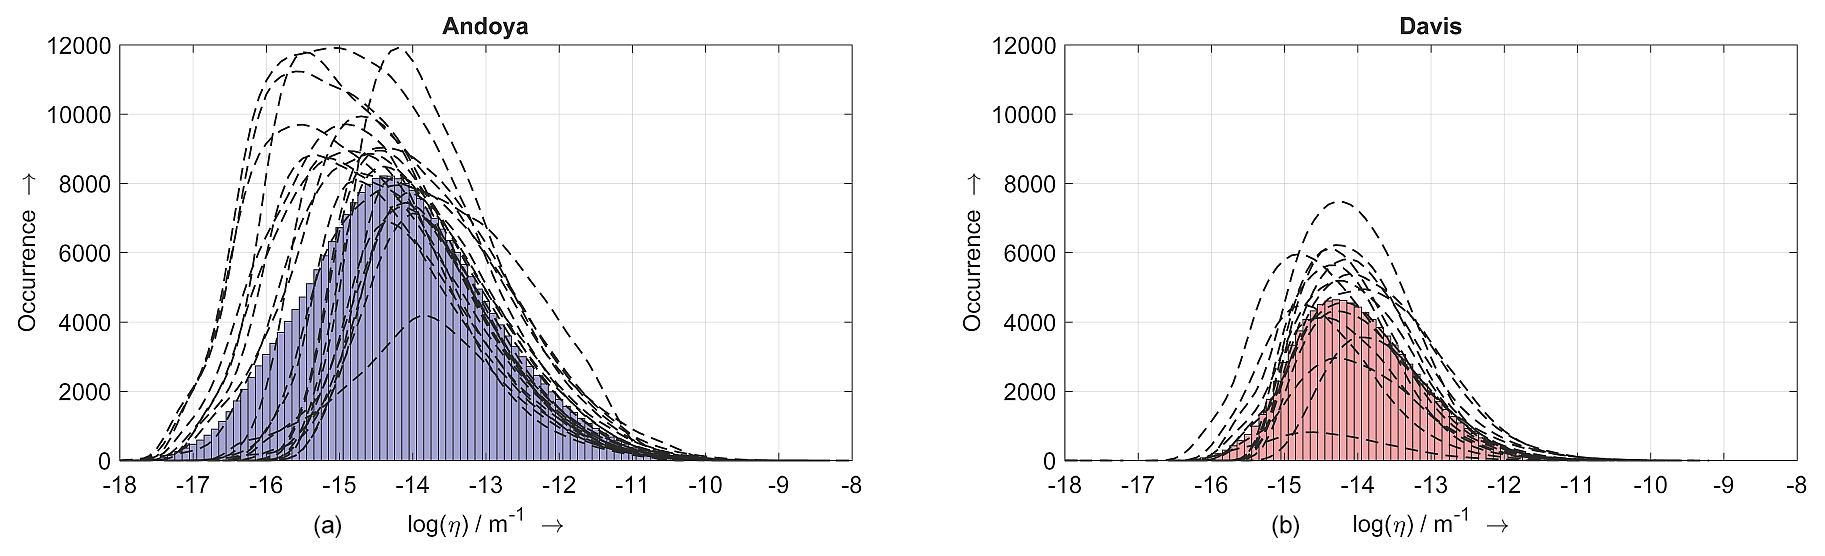
Figure 1Annual distributions of volume reflectivity (dashed lines) of mesospheric echoes determined over Andøya (1999–2022, a) and Davis (2005–2022, b). The blue and red bars represent the mean values.
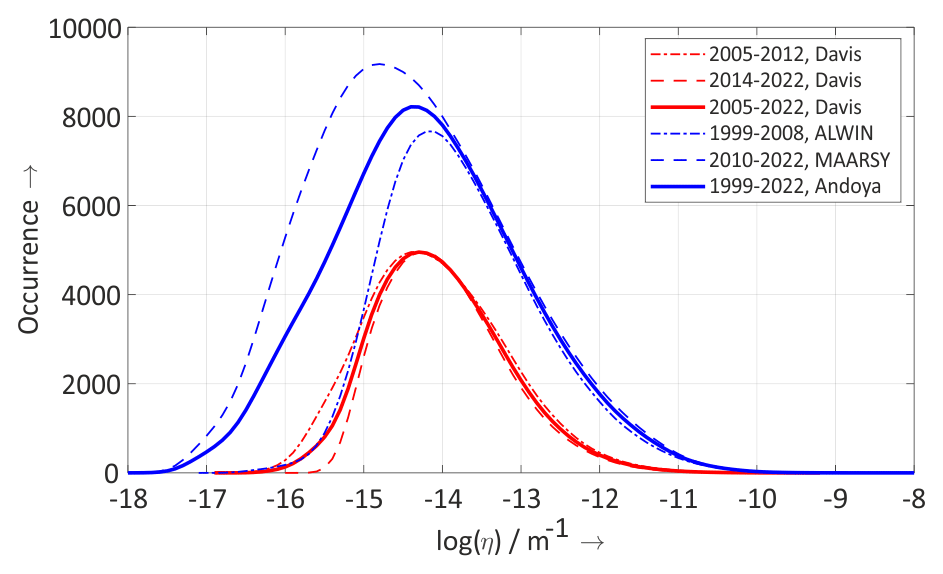
Figure 2Mean distributions of PMSE volume reflectivity obtained by ALWIN and MAARSY at 69° N (blue) during the boreal summer periods (May–August) of 1999–2008 and 2010–2022 respectively and those obtained with the Davis VHF radar at 69° S (red) during the austral summer periods (November–February) of 2005–2012 and 2014–2022.
Table 2Extreme values and quantiles of mean annual distribution of volume reflectivity of PMSE obtained by ALWIN (1999–2008), MAARSY (2010–2022), and the Davis VHF radar during the periods 2005–2012 and 2014–2022.
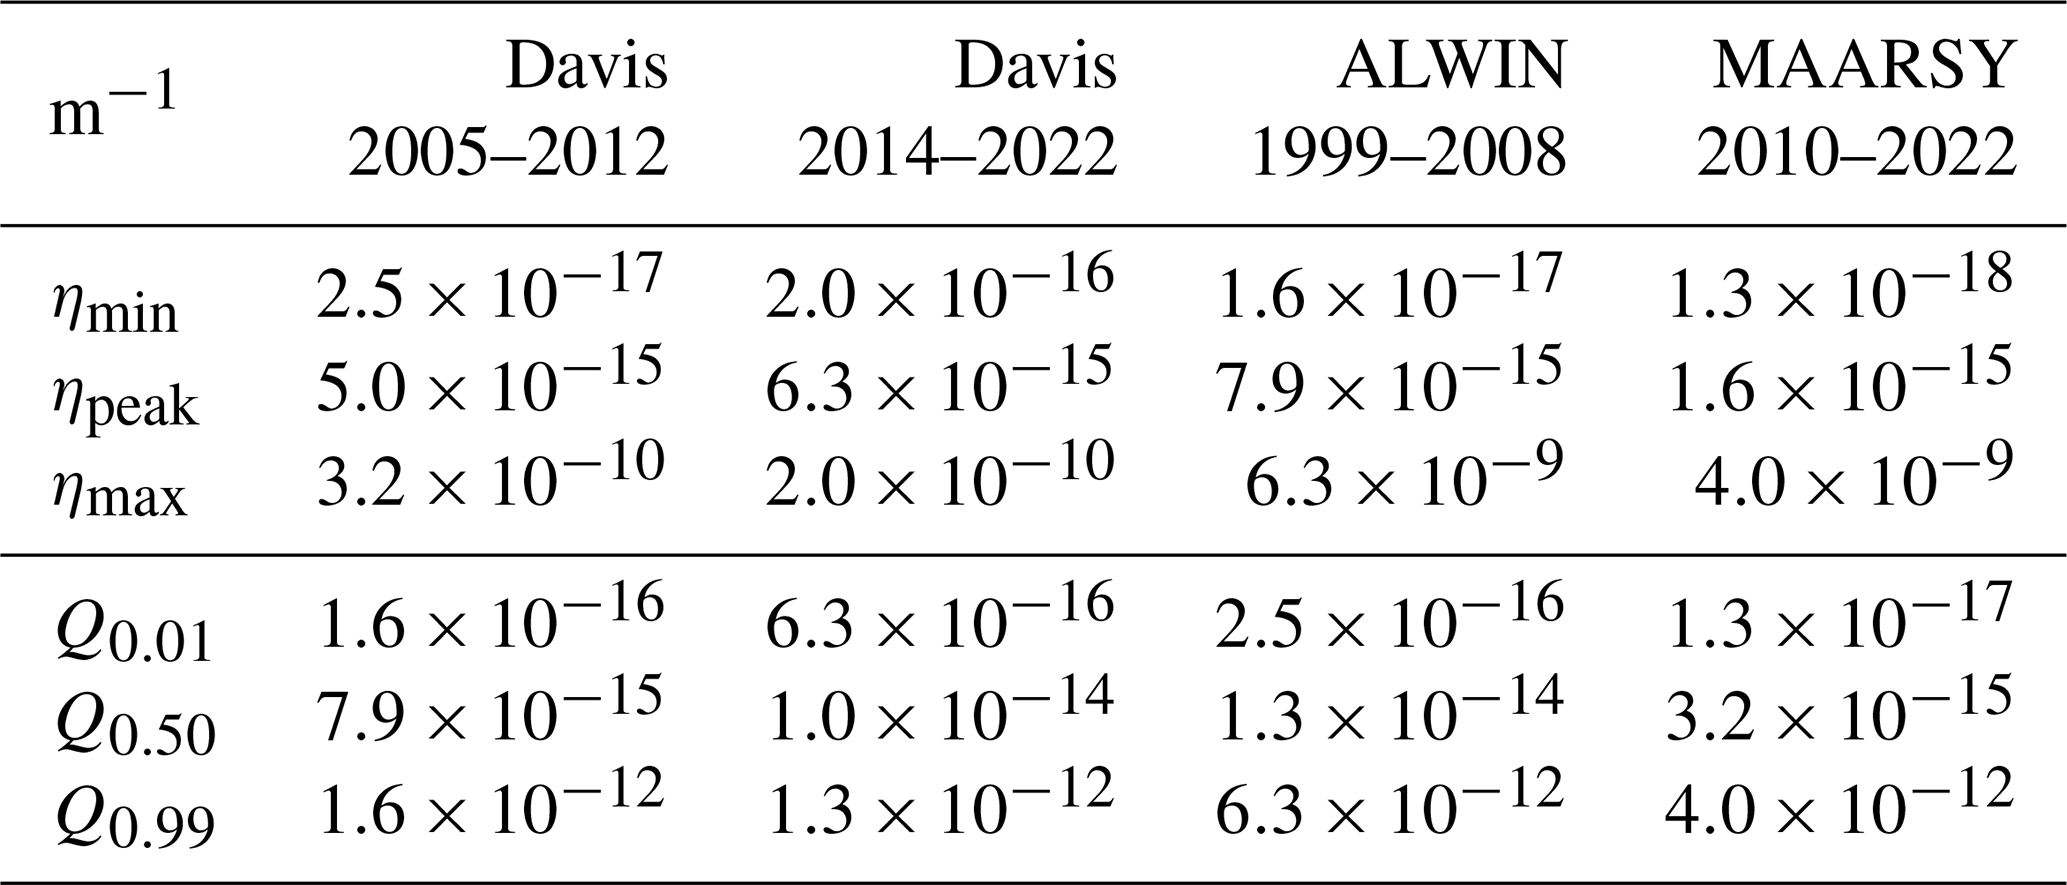
Figure 1 shows the annual distributions of volume reflectivity of PMSE obtained by ALWIN (1999–2008) and MAARSY (2010–2022) at 69° N (a) during the boreal summer periods (May–August) and by the Davis VHF radar (2005–2022) at 69° S (b) during the austral summer periods (November–February). The differences in minimum signal detectability, which determines the left-hand slope of the distributions, are in the case of ALWIN and MAARSY mainly determined by the size of the antenna array used and the differences in peak power but are in general also affected by fluctuations caused by changes in the radar experiment configurations, especially by the use of different receiving antenna configurations and the number of coherent integrations as often used within the observation periods for specific campaigns (Latteck and Bremer, 2017). The annual distributions of Davis volume reflectivity (Fig. 1b) show only a small variation. This is mainly due to the fact that other than changes to the beam steering method to hardware-only, the antenna was not changed during the entire period of the observations studied. Changes in other system parameters were accounted for by the system factor in Eq. (1) and receiver calibration.
The red and blue bars in Fig. 1 represent the mean distributions of volume reflectivity of PMSE obtained at Davis (b) and Andøya (a) respectively. In Fig. 2, these mean annual distributions of the volume reflectivity of PMSE (solid lines) determined at both sites are compared in one diagram. The additional curves are shown for Andøya and Davis for the periods of major technical changes to the radar systems at both sites. Because the antenna size of ALWIN and the Davis VHF radar were identical and the other system parameters had comparable magnitudes (Table 1), the two systems had almost directly comparable minimum detection sensitivities (dashed-dotted lines in Fig. 2).
The mean distribution of the volume reflectivity of the observed PMSE covers a range beginning at the detection limit of the radars and extending to a maximum value of about 10−10 m−1 for the Davis radar and 10−9 m−1 for ALWIN and MAARSY, with peak values occurring at around and m−1 for Davis and ALWIN respectively. The corresponding value for MAARSY is lower at m−1 because of the greater sensitivity of the system. The differences that can nevertheless be seen in the comparison of the left-hand slopes of the results from the Davis radar (red curves in Fig. 2) are due to an increased background signal in the tropospheric region in the determination of PMSE events compared to the direct measurement in the mesosphere, which in turn is due to the aliased PMSE measurement within a tropospheric experiment at Davis from 2014.
The volume reflectivity quantiles, which are summarised in Table 2, quantitatively confirm the above: 1 % of the echoes detected by the Davis radar in the 2005–2012 period (Q0.01) have a value of m−1 and in the period 2014–2022, it is m−1. Similarly, the respective median value of m−1 changes after 2012 to m−1. The value Q0.01 of the PMSE observations from ALWIN is m−1, which is close to that of the 2005–2012 observations from Davis. The same is true for m−1 as the median value of the ALWIN PMSE distribution, illustrating once again the direct comparability of the two systems. MAARSY's values are correspondingly lower with m−1 and m−1 due to the higher sensitivity of the radar. Interesting are the differences in the maximum values ηmax and Q0.99 of the PMSE distributions of the Northern and Southern hemispheres. If the differences in ηmax range over 1 order of magnitude, they are still different by a factor of about 4 in the statistical Q0.99.
3.2 Seasonal, diurnal, and altitudinal occurrence distributions
The minimum signal detectability of the radars used in this study is caused not only by different system characteristics as listed in Table 1 but also by changes in radar experiment configurations, mainly by a change in the number of coherent integrations used within observing seasons for specific campaigns. To obtain as unbiased a picture as possible of the seasonal and daily variations in the occurrence rates of polar mesospheric summer echoes, a lower threshold of m−1 was set. This threshold is below the peak ηpeak of the PMSE distribution from ALWIN and the Davis VHF radar as listed in Table 2 but is also larger than the minimum volume reflectivity detected by all radars at Davis and Andøya, and thus should cause nearly all detected PMSE to have been counted regardless of variations in the minimum detection limit. The chosen threshold of m−1 also allows for qualitative comparison to other studies (e.g. Kirkwood et al., 2007; Latteck and Bremer, 2013, 2017; Sato et al., 2017; Latteck et al., 2021).
3.2.1 Seasonal variation in PMSE occurrence
Figure 3 shows the mean seasonal and diurnal variation in the occurrence frequency of PMSE measured over Andøya (1999–2022) and Davis (2005–2022). Figure 3a and b show the mean seasonal occurrence frequencies of PMSE normalised by their maximum value. This plot allows for comparison of the seasonal dynamics of PMSE occurrence over the entire altitudinal range of observations. A qualitative comparison of mean absolute daily occurrence frequencies is provided in Fig. 3c and d. Here, an occurrence is triggered if the volume reflectivity exceeds the minimum threshold at any altitude and at any time during the day. June/July and December/January are the months with the highest PMSE frequencies in the Northern and Southern hemispheres respectively. During these periods, PMSE were observed with an average frequency of 82.2 % over Andøya but only 55.3 % over Davis. The shape of the mean PMSE frequency distribution in the left middle plot in Fig. 3 is similar and directly comparable to the results of previous studies of PMSE occurrence over Andøya (Bremer et al., 2009; Latteck and Bremer, 2013, 2017; Latteck et al., 2021).
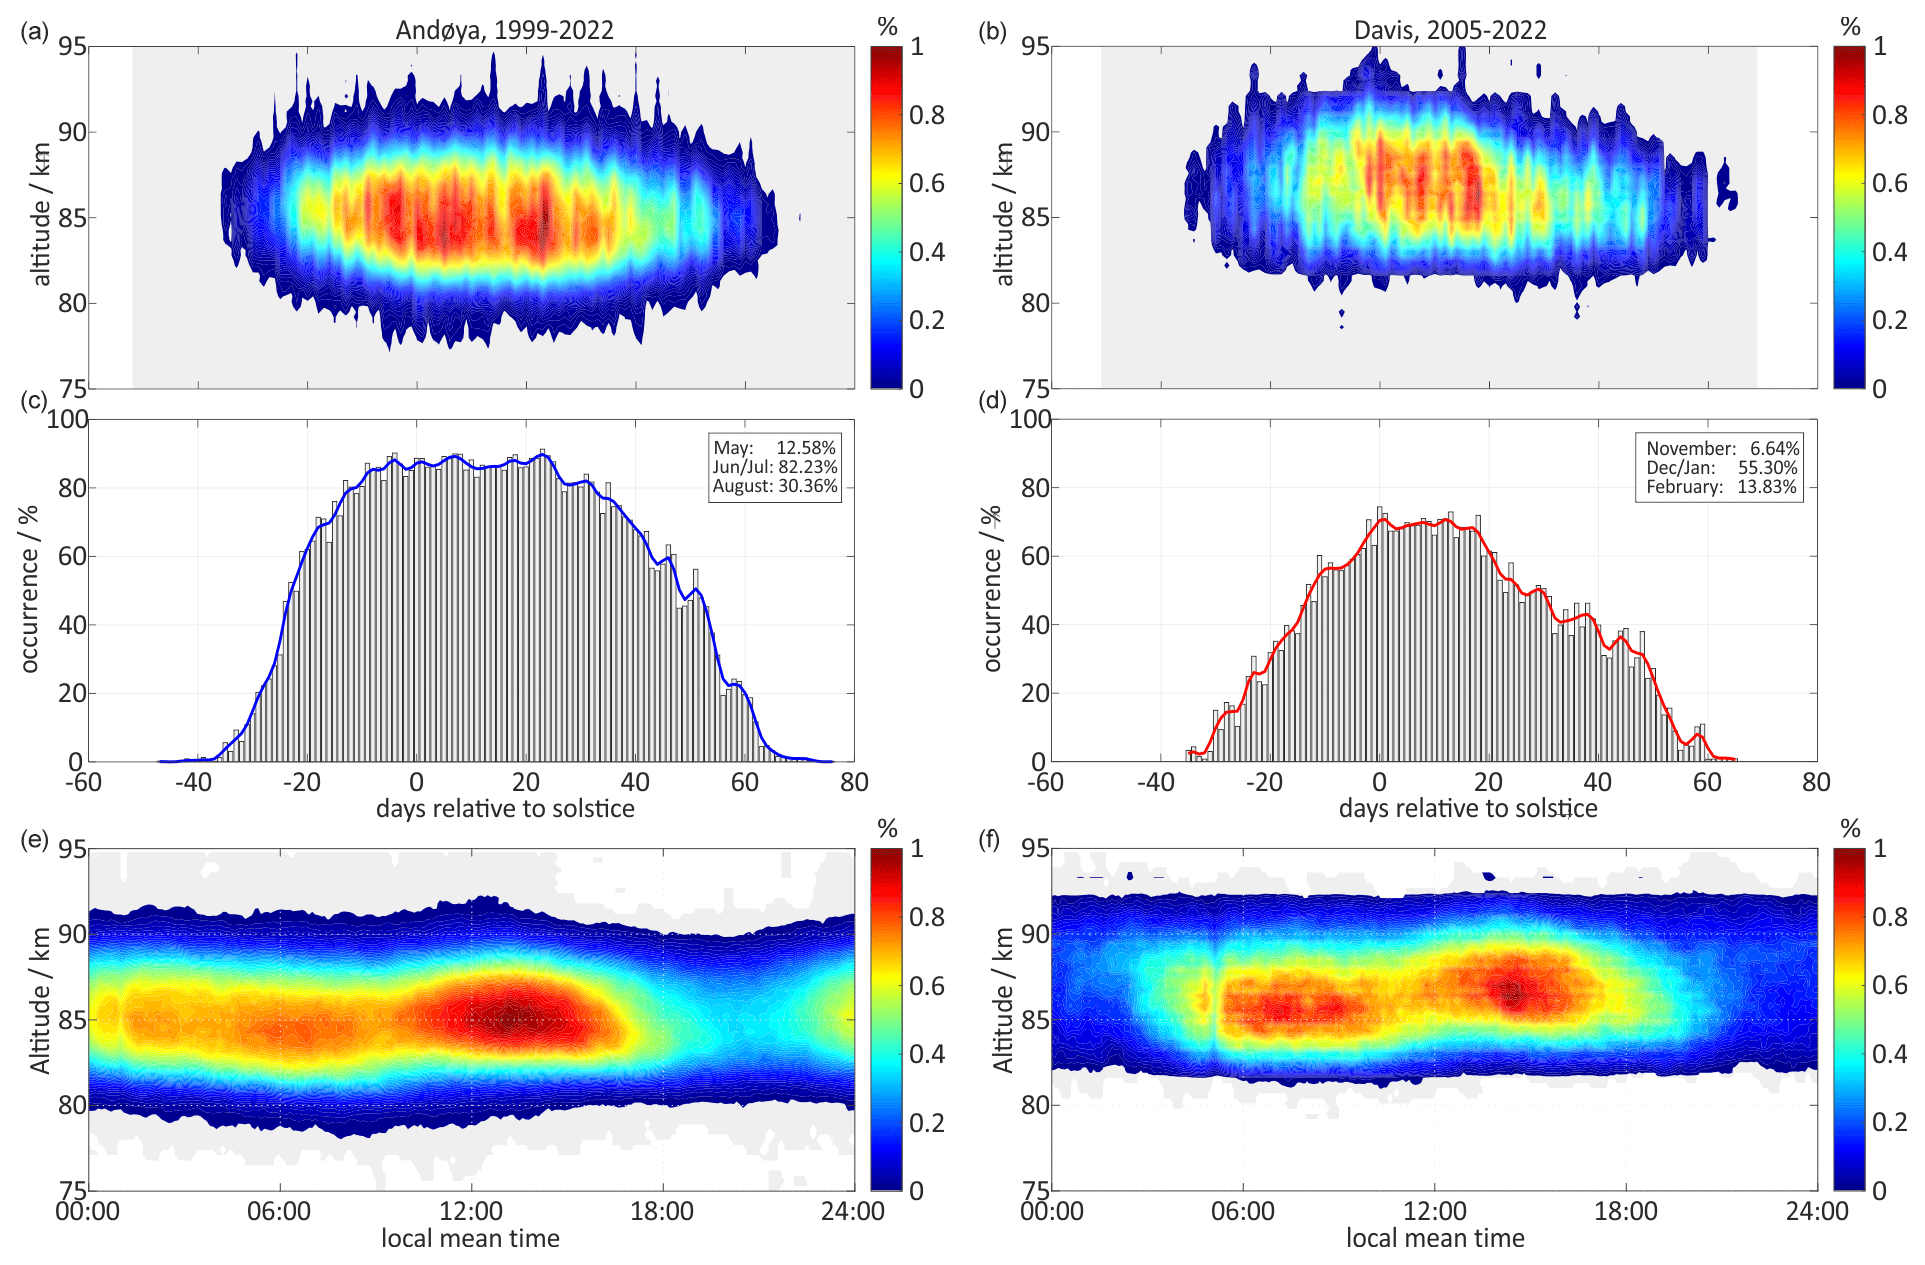
Figure 3Seasonal height distribution and variation in PMSE occurrence and their diurnal occurrence variation above Andøya (1999–2022, a, c, e) and Davis (2005–2022, b, d, f). The occurrence rates refer to radar reflectivities above a common threshold of 10−15 m−1 and to the number of 6 min averages per day (maximum 240). The seasonal height distribution of PMSE in (a) and (b) are normalised to its maximum. The seasonal occurrence rates in (c) and (d) are based on the occurrence of a PMSE event at any range gate within a 6 min time bin. The solid lines represent a 3 d running mean value. Panels (e) and (f) show the daily occurrence rate of PMSE normalised to its maximum.
Table 3Earliest, mean, and latest onset and end of PMSE season in Andøya (1999–2022) and Davis (2005–2022) for volume reflectivities m−1. The day numbers listed refer to the solstices in the NH and SH.
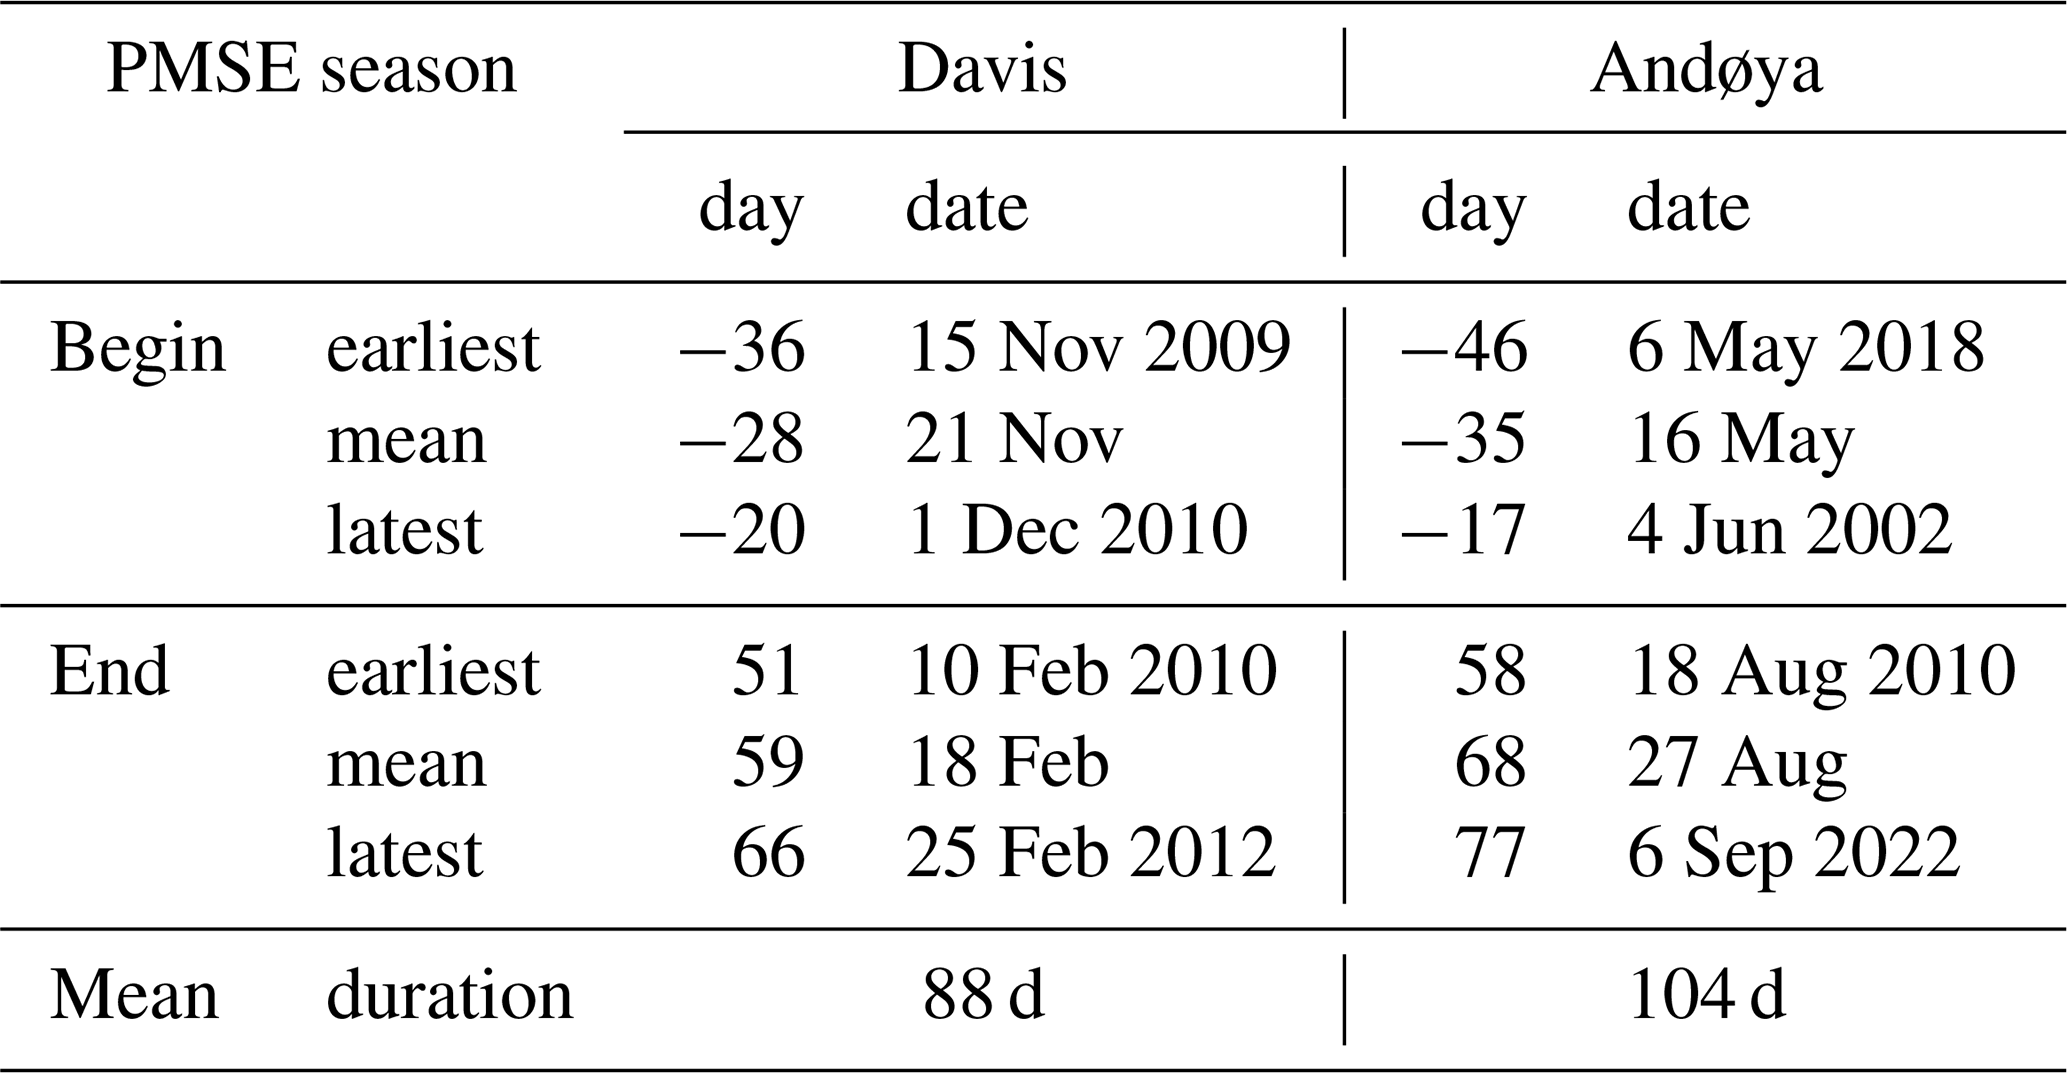
The PMSE season, analysed here based on volume reflectivities m−1, begins in the Northern Hemisphere on mean day −35 (16 May) and lasts to mean day 68 (27 August) relative to the summer solstice (rts) with a standard deviation of 6.0 and 4.4 d respectively. One 24 min single-range occurrence is sufficient to trigger the presence of PMSE in this context. The earliest start of the PMSE season over Andøya during the observation period was recorded on day −46 rts (6 May 2018) and the latest start was on day −17 rts (4 June 2002). The earliest end of the season was on day 58 rts (18 August 2010) and the latest end was on day 77 rts (6 September 2022). The earliest start of the PMSE season over Davis during the observation period was on day −36 rts (15 November 2009), 10 d later than over Andøya, and the latest start was on day −20 rts (1 December 2010), which is only 3 d later compared to Andøya. The earliest end of the season in the Southern Hemisphere was on day 51 rts (10 February 2010), 7 d earlier than over Andøya, and the latest end was on day 66 rts (25 February 2012), 11 d earlier than over Andøya), which is shown by the vertical dashed blue and red lines in Fig. 4. Thus, the mean start of the PMSE season in the Southern Hemisphere is day −28 rts (21 November) and the mean end is day 59 rts (18 February), with standard deviations of 5.4 and 4.0 d respectively. This results in a significantly shorter mean PMSE season of 88 d in the Southern Hemisphere compared to 104 d in the Northern Hemisphere, as illustrated by the curves in Fig. 4c and summarised in Table 3.
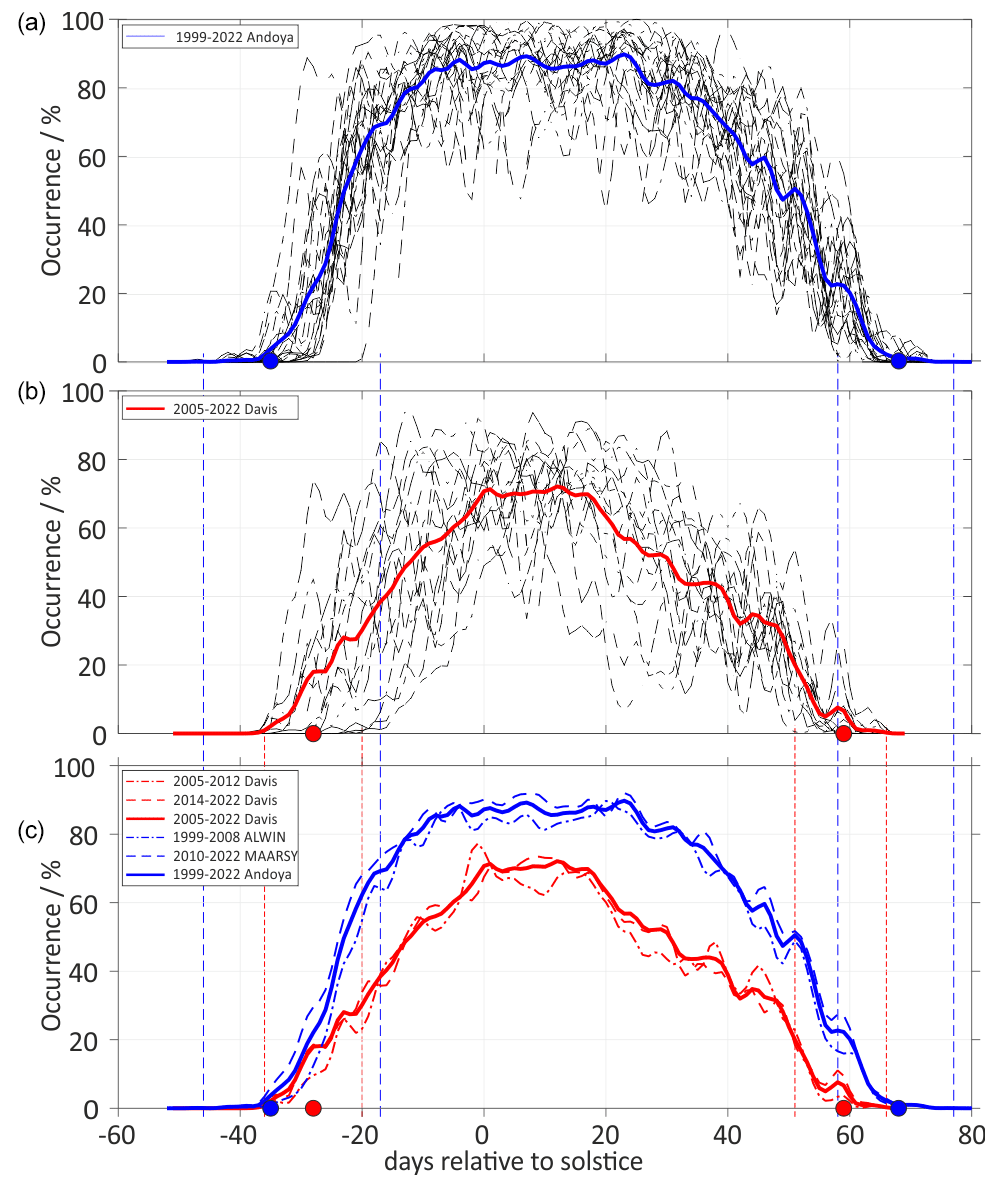
Figure 4Seasonal variations in the frequency of occurrence of PMSE in Andøya, 69° N (a), and Davis, 69° S (b). The solid blue and red curves represent the mean values of the occurrence rates over the entire observation period for Andøya and Davis respectively. Panel (c) compares the mean occurrence rates for the PMSE observations in Andøya and Davis for different time periods. The vertical dashed blue and red lines mark the earliest and latest start and end of the PMSE season observed in the NH and SH respectively. The blue and red dots mark the mean start day and the mean end day of the respective PMSE seasons.
3.2.2 Diurnal variation in PMSE occurrence
The mean daily variation in PMSE occurrence shown in Fig. 3e and f over local mean time (LMT, the mean solar time for a given location on Earth) has similar characteristics in both data sets. PMSE at both sites occur clustered in the morning and midday hours over the range of 82 to 90 km, with the diurnal pattern of this occurrence showing differences in the comparison of the two observations. For illustration and quantification, Fig. 5 compares the multi-season mean diurnal variation in both data sets. For this purpose, the mean value over the altitude range 81–89 km was used for the measurements from Andøya and the range 83–91 km was used for the measurements from Davis. The daily variation in PMSE occurrence of the individual years refers only to the measurement time, i.e. 100 % per range gate would have been achieved if an echo had been recorded in the same range gate in one of the daily time intervals of 6 min on all days on which measurements were taken. The mean daily PMSE occurrences over Andøya shown in the upper part of Fig. 5 illustrate a pronounced pattern with large variation around a mean of about 20 % between midnight and 17:00 LMT. All mean trajectories also show a pronounced maximum between 11:00 and 15:00 LMT, peaking on average around 13:09 LMT. In the period between 17:00 and midnight, all mean diurnal traces show a pronounced minimum. In the 23-year mean response (blue curve), the frequency rate drops sharply during this period to about 10 % at 20:42 LMT and then rises again to 20 % by about 01:30 LMT. The morning course of the mean diurnal cycle shows a slight first maximum at 06:17 LMT, which is very weak, indicated by the strong variation in the maxima of the individual annual cycles (black dots) around this time.
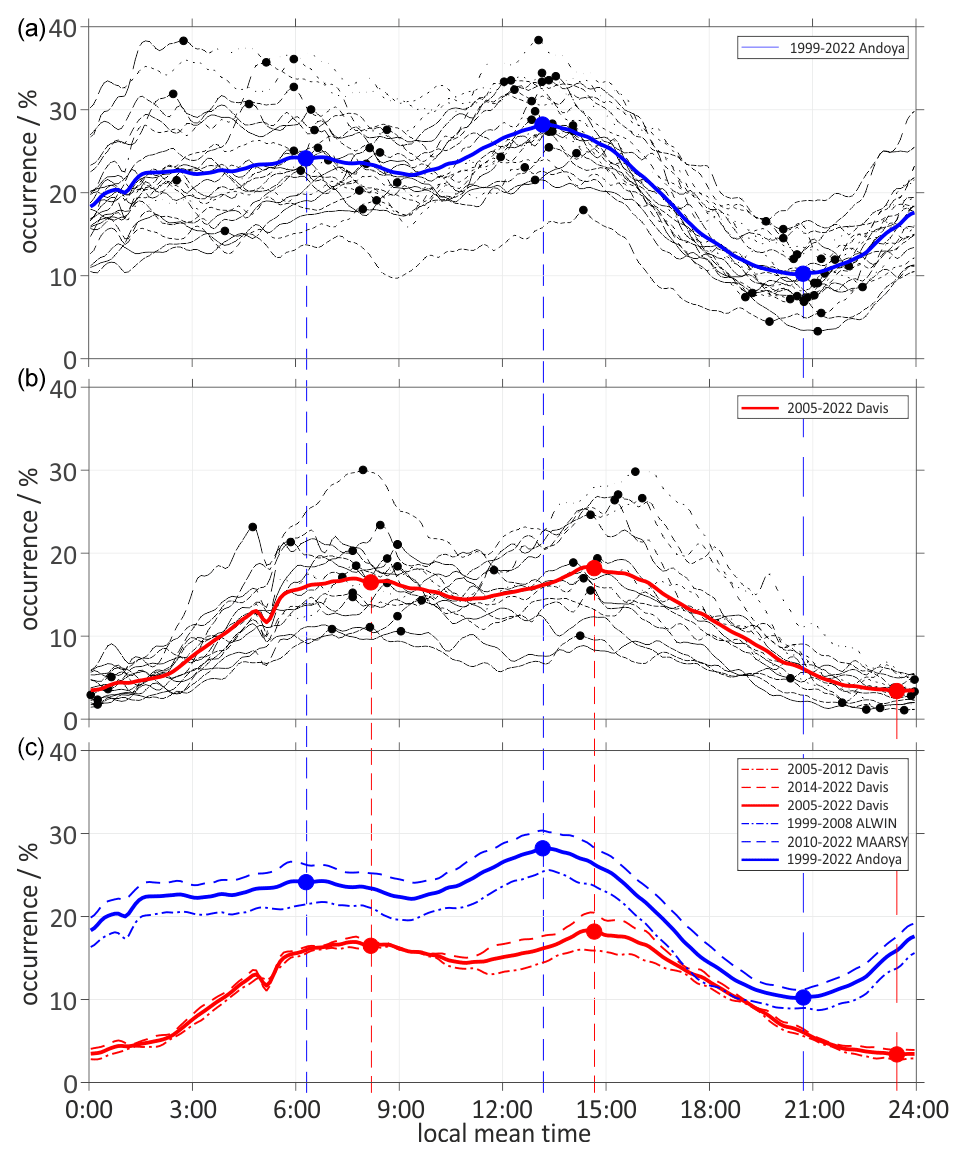
Figure 5Mean diurnal variations in PMSE occurrence frequencies obtained at Andøya, 69° N (81–89 km, a), and Davis, 69° S (83–91 km, b). The solid blue and red curves represent the averaged values of the mean diurnal occurrence rates over the entire observation period. Panel (c) compares the averaged mean diurnal occurrence rates for the PMSE observations at Andøya (blue curves) and Davis (red curves) for different time periods. The blue and red dots mark the daily times of the first and second maxima and the minima of the mean daily occurrence of PMSE over Andøya and Davis respectively. The black dots indicate the corresponding times of the individual seasons.
Such a first maximum is far more prominent in the individual and the averaged mean diurnal cycle of PMSE frequency over Davis (Fig. 5b). The averaged mean diurnal cycle (red curve) begins with a minimum of about 3 % at 23:26 LMT (near midnight), then rises to the first maximum of about 16 % at 08:10 LMT, then drops somewhat to rise to about 18 % at 14:40 LMT for the second time, and then drops continuously until midnight.
The direct comparison of the averaged mean diurnal variation in PMSE occurrences from Andøya and Davis in Fig. 5c shows a clearly asymmetric pattern in the Andøya data compared to Davis. Also clearly visible is a larger offset of the second maximum at local noon of 2.65 h in Davis compared to 1.16 h in the observations from Andøya. The distance of the local minima to each other is even larger at about 2.7 h.
3.2.3 Altitudinal distribution of PMSE occurrence
Figure 6a and b show the altitude distributions of the PMSE occurrence rates of the individual measurement periods (dashed black lines) and their mean values (solid lines) for Andøya and Davis respectively. Figure 6c directly compares the mean values for different measurement periods for both sites. The thickness of the distributions at the half maximum (stars in Fig. 6c) is ∼ 6 km at both sites. The peak of the PMSE altitude distributions of the individual years is marked with black dots in Fig. 6. The mean peak of the PMSE altitude distributions over Davis is at an altitude of 86.1 km (red dots), about 1.5 km higher than at Andøya site (84.6 km, blue dots).
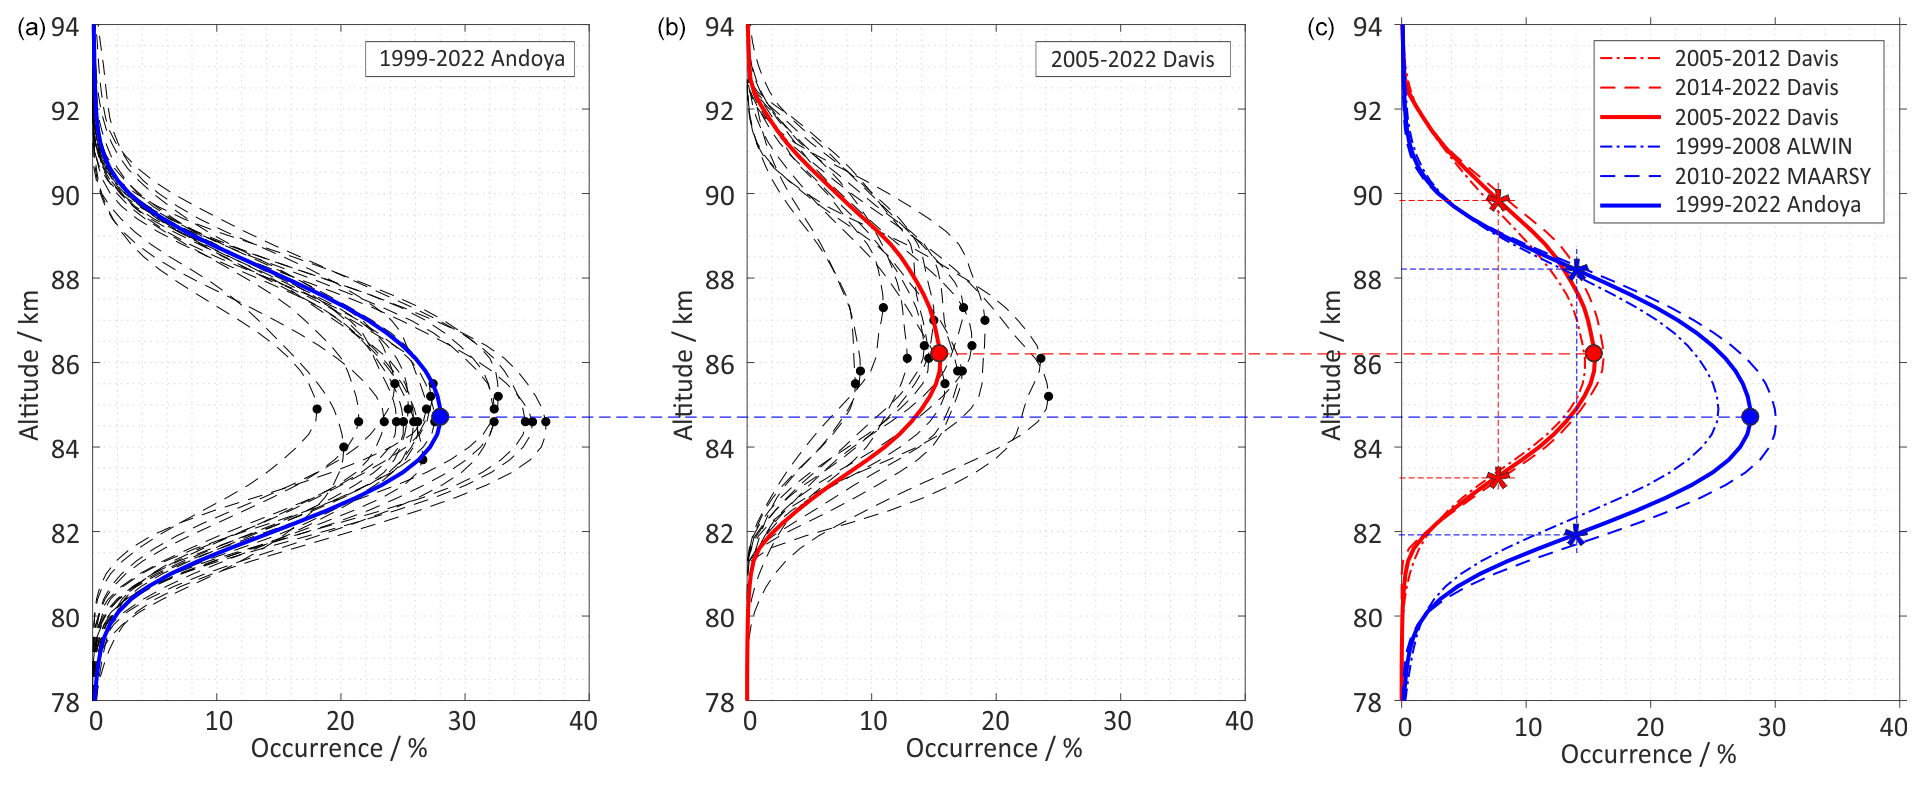
Figure 6Mean annual altitude distributions of PMSE occurrences obtained at Andøya, 69° N (a), and Davis, 69° S (b), during the boreal summer period (May–August) of 1999–2022 and the austral summer period (November–February) of 2005–2022 respectively. The solid blue and red curves represent the mean values of the altitude distributions of PMSE occurrences over the entire observation period. Panel (c) compares the mean height distributions of PMSE for the Andøya (blue curves) and Davis (red curves) observations for different time periods. The blue and red dots mark the mean peak heights of each PMSE occurrence, and the stars indicate the half-maxima of the distributions.
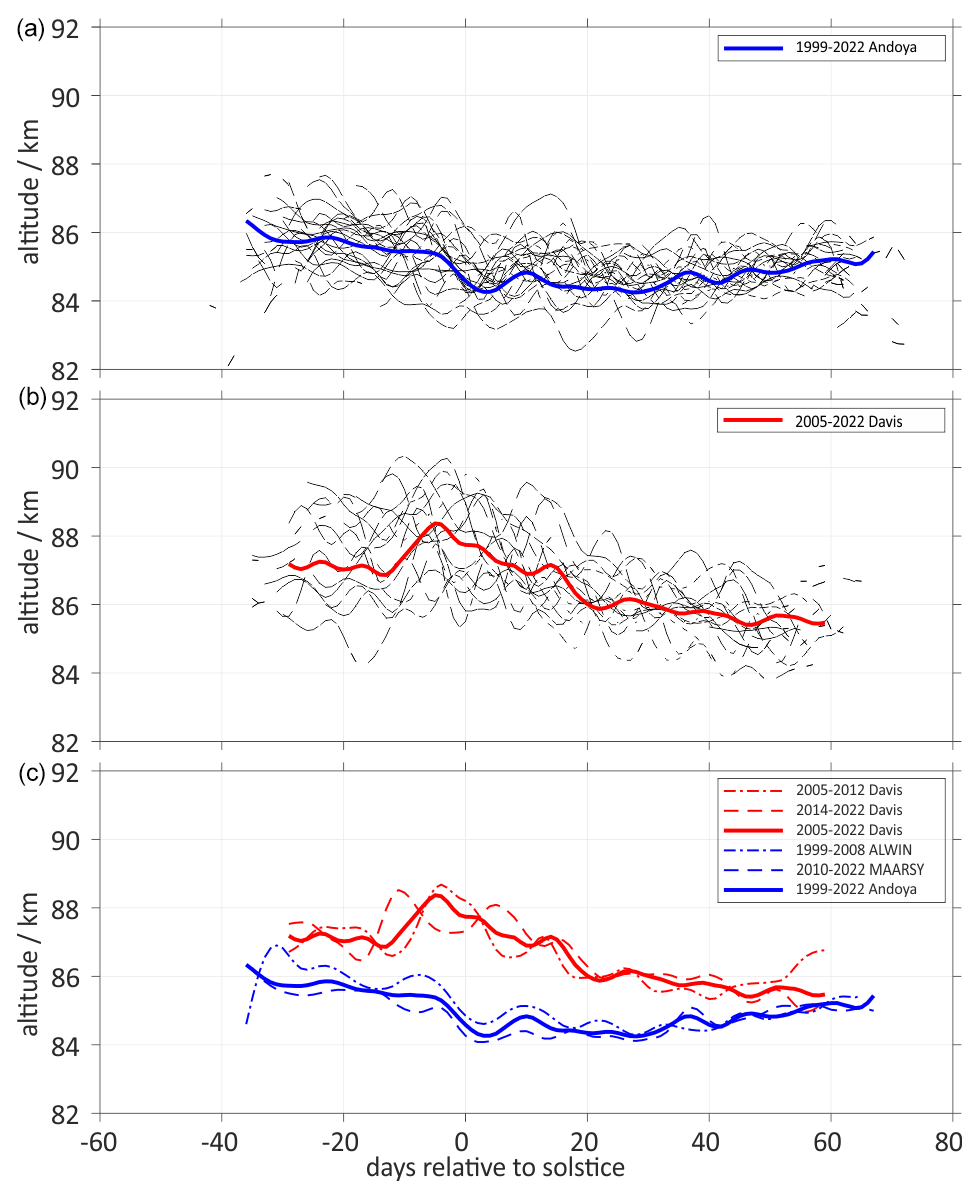
Figure 7Seasonal variations in mean altitude of PMSE occurrence at Andøya, 69° N (a), and Davis, 69° S (b), during the boreal summer period (May–August) of 1999–2022 and the austral summer period (November–February) of 2005–2022 respectively. The blue (Andøya) and red (Davis) solid curves represent the mean seasonal variation in peak height of PMSE occurrence over the entire observation period. Panel (c) compares these mean variations for the observations in Andøya and Davis for different time periods.
The individual profiles of the PMSE altitude distributions for Andøya are characterised by a nearly Gaussian shape, while for Davis they are not. The latter indicates an uneven height distribution of PMSE frequencies, which is also evident in Fig. 3b and which is subject to year-to-year variation. This fact is even more evident in the individual and climatological seasonal variations in the peak altitudes of PMSE occurrences, as shown in Fig. 7. The individual seasonal variations in peak altitudes over Andøya (dashed lines in Fig. 7a) show much less variation compared to peak altitudes over Davis (dashed lines in Fig. 7b). The mean seasonal variations in peak heights of PMSE occurrence calculated for the mean duration of each PMSE season (blue and red curves) illustrate, on the one hand, the difference in the mean distribution of peak heights already mentioned and, on the other hand, a non-uniform peak separation in the annual variation. Both mean curves of the PMSE peak heights (Fig. 7c) show an almost even spacing of about 1.2 km over a period of about 20 d at the beginning of the PMSE season. About 10 d before the solstice, the mean PMSE peak altitude over Davis jumps upward by about 1 km, while over Andøya it drops just before the solstice. As the season progresses, the PMSE peak altitude over Davis decreases uniformly, while over Andøya it remains nearly constant. About 20 d after solstice, the latter starts to increase slightly, so that the PMSE peak altitude at both sites has almost converged by the end of the season.
This paper gives an overview of continuous measurements of polar mesospheric summer echoes obtained with the VHF radars ALWIN (1999–2008) and MAARSY (2011–2022) on the northern Norwegian island of Andøya (69.30° N, 16.03° E) during 23 years of boreal summers and with the VHF radar at Davis (68.6° S, 78.0° E) during 15 years of austral summers (2005–2012 and 2014–2022). The fact that the radar systems at both sites have been regularly calibrated results in a unique data set that allows PMSE to be analysed and compared in terms of seasonal, diurnal, and altitudinal occurrence distributions, as well as in signal strength of the received backscattered echo.
4.1 Signal strength of PMSE
Since ALWIN and the Davis VHF radar are comparable both in the size of the antenna and in many technical parameters, the distributions of the volume reflectivity (Fig. 1) from the calibrated received signals of the mesospheric echoes are directly comparable in terms of their maximum values. Due to the system-related differences between the instruments (Table 1), the changes in the experiment setup in the course of the respective measurement campaigns, and the enhanced performance of MAARSY, the minimum signal detectability is not constant over the entire measurement period considered. This leads to differences in the increasing slopes of the individual as well as the mean distributions of the volume reflectivities (Fig. 2) calculated from the received signals of the radars.
The mean distributions of the volume reflectivity of the observed PMSE cover a range starting at the detection limit of the radars and extending to a maximum value of about m−1 for the Davis radar and m−1 for ALWIN and MAARSY, in terms of all values up to 99 % (see Q0.99 in Table 2). The ratio of the statistical maximum values of the PMSE observations of the Northern Hemisphere to the Southern Hemisphere is thus less than a factor of 4. Differences in observed maximum values of volume reflectivities at this order of magnitude were already found in the very first comparative study of PMSE observations at Davis and Andøya (Latteck et al., 2007), despite being based on only one measurement season of the Davis radar before its modification at the end of January 2004. The very strong differences of about 2 orders of magnitude between the Davis and Andøya PMSE observations described in Latteck et al. (2008), which are mainly based on the first two measurement periods of the Davis radar after its reconstruction, are not confirmed here and are likely due to inaccurate information about a system parameter in the receive path of the Davis radar after the modification at the time of the study (see Appendix A1). The results of the present study also do not confirm the conclusion of the very first observations of PMSE in the Southern Hemisphere (Woodman et al., 1999) that there are large differences between the strength of PMSE in the two hemispheres but confirm the earlier observation of Morris et al. (2004, 2006), Kirkwood (2007), and Latteck et al. (2007) that the volume reflectivity of PMSE in Antarctica is similar to that of PMSE in the Arctic.
4.2 Seasonal, diurnal, and altitudinal variations in PMSE
In order to obtain as unbiased a picture as possible of the seasonal and daily variations in the occurrence rates of the PMSE, which could be caused by the system and experiment-related differences in the detection limit of the radars (Table 2), a minimum threshold of m−1 was set for investigating the seasonal and diurnal variation in the occurrence of PMSE in both hemispheres. This threshold also allows for qualitative comparison of the current results with other studies (e.g. Kirkwood et al., 2007; Latteck and Bremer, 2013, 2017; Sato et al., 2017; Latteck et al., 2021).
4.2.1 Seasonal variation in PMSE occurrence
The PMSE season in Davis (69° S) is more variable compared to Andøya (69° N), both in terms of the length of the season and the occurrence frequency within the season. This is mainly due to the longer extent and greater variability in the collapse of the polar vortex in the SH compared to the NH (Lübken et al., 2015).
The shape of the mean seasonal variation in PMSE occurrence over Andøya (Fig. 3c) is similar and directly comparable to the results of previous studies (Bremer et al., 2009; Latteck and Bremer, 2013, 2017; Latteck et al., 2021). The direct comparison with the Davis measurements in Fig. 4c shows that significantly fewer PMSE were observed in the Southern Hemisphere during the 15 years under consideration. A qualitative comparison of the mean absolute daily occurrence frequency (Fig. 3c and d) shows that during the months with the highest PMSE occurrence frequencies (June/July in the Northern Hemisphere and December/January in the Southern Hemisphere), PMSE were observed with an average frequency of 82.2 % over Andøya but only 55.3 % over Davis.
On average, the PMSE season in the Southern Hemisphere starts 7 d later and ends 9 d earlier than in the Northern Hemisphere, resulting in a significantly shorter mean PMSE season of 88 d in the Southern Hemisphere compared to 104 d in the Northern Hemisphere. This feature was already noted in an earlier study by Latteck et al. (2008) and attributed to differences in the dynamic and thermal state of the mesopause region in both hemispheres. PMSE are present in both hemispheres in the summer as long as the equatorward winds transport cold air from higher to lower latitudes. These meridional winds support the transport of NLC particles from higher latitudes, as shown by 3-D modelling of the formation of noctilucent cloud particles (Berger and von Zahn, 2007). In this context, the shorter PMSE season of the SH is also reflected in the earlier transition of the meridional winds to winter conditions (Dowdy et al., 2001; Morris et al., 2006). The observed end of the PMSE season over Davis at day 59 rts coincides with an increase in mesospheric temperature measured by Lübken et al. (2004) with falling spheres over Rothera (67° S) in January/February 1998. The observed shorter PMSE season and especially the earlier end in the Southern Hemisphere was also predicted by Lübken and Berger (2007) with the LIMA/ice model. The model reproduces the main PMSE characteristics observed by several VHF radars in both the Northern Hemisphere and Southern Hemisphere.
4.2.2 Diurnal variation in PMSE occurrence
The mean daily variation in PMSE occurrence shown in Fig. 3e and f reflects similar signatures but also pronounced differences in both data sets. PMSE occur more frequently in the morning and midday hours at both sites over the range of 82 to 90 km, although the diurnal pattern of this occurrence shows differences when comparing the two observations.
The mean daily occurrence of PMSE over Andøya (Fig. 5, blue curves) shows a distinct pattern with large fluctuations around a mean value of about 20 % between midnight and 17:00 LMT. During this time, the pattern shows a pronounced maximum between 11:00 and 15:00 LMT, peaking on average at 13:09 LMT, and then continuously decreasing towards a minimum of about 10 % reached at 20:42 LMT.
The pattern of mean daily PMSE occurrence over Davis (Fig. 5, red curves) is similar to Andøya observations, but the maxima and minima are shifted by 1.5 and 2.7 h respectively. The curve starts with a pronounced minimum of about 3 % at 23:26 LMT (near midnight), then rises to a clear first maximum of about 16 % at 08:10 LMT, drops a bit to rise a second time to about 18 % at about 14:40 LMT, and thereafter drops continuously until midnight.
Both the position of the absolute (second) maximum and the minimum of the Andøya observations are consistent with results of previous studies (e.g. Hoffmann et al., 1999; Bremer et al., 2001; Latteck et al., 2021). Hoffmann et al. (1999) compared the diurnal variations in PMSE signal strength (signal-to-noise ratio) and the meridional wind component at PMSE heights and found that both parameters have similar extreme values but are offset in time. On the assumption that meridional winds can transport cold air from higher to lower latitudes and warm air from lower to higher latitudes and that cold temperatures are one of the necessary conditions for the formation of PMSE, they concluded temperature changes induced by meridional tidal winds transporting cold (warm) air from polar (equatorial) latitudes to the observation site can have a significant impact on the diurnal variation in PMSE. Murphy (2002) and Murphy et al. (2006) have measured short-term and seasonal variations in the amplitude and phase of tides in Antarctica. However, studies using the current data set based on monthly periods show that the daily variations present in Fig. 3e and f do not exhibit significant seasonal (monthly) changes in the positioning of maxima and minima but rather annual changes in intensity. This could imply that any local influence of tides on PMSE is due to migrating tides, which tend to be stable, rather than more variable non-migrating tides. Bremer et al. (2001) explained that the semi-diurnal variation in PMSE with maxima at noon and midnight was due to the influence of the diurnal variation in geomagnetic activity.
4.2.3 Altitudinal variation in PMSE occurrence
The peak of the PMSE altitude distribution over Davis is 86.1 km, which is about 1.5 km higher than the corresponding value at Andøya (84.6 km) (Fig. 6). This is consistent with a higher and colder mesopause along with warmer temperatures at lower heights (Lübken et al., 2015). The absolute value is slightly more than the 1 km difference reported in Latteck et al. (2007), which was in good agreement with observed polar mesospheric cloud (PMC) height differences (Wrotny and Russell, 2006). The analysis of Halogen Occultation Experiment (HALOE) data collected between 55 and 70° latitudes in both hemispheres revealed a mean height of the PMC distribution in the Southern Hemisphere of 84.2 km, which is 0.9±0.1 km higher than the mean height of the PMC distribution in the Northern Hemisphere of 83.3 km. According to Wrotny and Russell (2006), the observed interhemispheric differences in the vertical extent of PMCs could be attributed to temperatures colder by 4–7 K, as seen in the NH-HALOE temperature profiles between 75 and 86 km.
The thickness of the altitude distributions at the half maximum is about 6 km at both sites. The mean altitudes of the individual years show a significantly closer concentration around the mean value for the measurements above Andøya compared to the corresponding values at Davis. This is also reflected in the annual distribution of the peak altitudes (Fig. 7). The mean PMSE altitude observed in the NH shows an almost constant trend with a slight decrease towards the middle of the season shortly after the solstice, followed by a slight increase towards the end of the season (Fig. 7, blue curves). In the SH, the mean trend of peak heights tends to decrease over the course of the season, but it is significantly higher just before the solstice, at ∼89 km, than during the periods before or after (Fig. 7, red curves). Lübken et al. (2017) attribute this increase to mesopause jumps, occasional sudden mesopause height increases and associated mesopause temperature decreases, primarily but not only observed prior and close to the solstice in the SH. The conditions for mesopause jumps are associated with the late breakdown of the polar vortex when stratospheric winds are moderately eastward and mesospheric winds are strongly westward. Under these conditions, gravity waves with comparatively large eastward phase speeds can pass the stratosphere and propagate to the lower thermosphere because their vertical wavelengths in the mesosphere are rather large, implying enhanced dynamical stability. When finally breaking in the lower thermosphere, these waves drive an enhanced residual circulation that causes a cold and high-altitude mesopause (Lübken et al., 2017). The general downward trend of PMSE peak altitudes observed over Davis specifically after the summer solstice is accompanied by the observed downward propagation of the mesopause in the SH (Lübken et al., 2015), which was explained in Becker et al. (2015).
Continuous radar observations of the polar mesosphere were made at Andøya (69.30° N, 16.03° E) and Davis (68.6° S, 78.0° E) during 23 years of boreal summers (May–August) of 1999–2008 and 2011–2022 and 15 years of austral summers (November–February) of 2005–2012 and 2014–2022 respectively. This interhemispheric PMSE comparison incorporating more than 1 decade of observations confirmed that the SH PMSE are indeed more climatologically variable in terms of season, time of day, and altitude than their NH counterparts. The results of studies of PMSE in terms of the variation in their seasonal and daily occurrence as well as the volume reflectivity of the received backscattered echo power can be summarised as follows:
-
PMSE volume reflectivities observed at locations of comparable latitudes in the Northern and Southern hemispheres are similar. The maximum volume reflectivities of the measurements from Davis (69° S) have only a slightly lower peak volume reflectivity of about m−1 compared to m−1 over Andøya (69° N).
-
Fewer PMSE are observed in the Southern Hemisphere than in the Northern Hemisphere. The mean PMSE season based on 23 years of observations in Andøya begins on 16 May (day −35 rts), lasts 104 d, and ends on 27 August (day 68 rts). In contrast, the mean PMSE season based on 15 years of observations at Davis begins on 21 November (day −28 rts), lasts 88 d, and ends on 18 February (day 59 rts). The average occurrence of PMSE for volume reflectivities m−1 at 69° N in June/July is 82.3 % while the average occurrence of PMSE in December/January at 69° S is 55.3 %.
-
The mean diurnal variation in PMSE frequencies in the Northern Hemisphere shows a nearly continuous course between midnight and about 17:00 LMT with a maximum at 13:09 LMT, which then leads to a sharp decrease to a pronounced minimum at 20:42 LMT. The mean diurnal pattern of PMSE frequencies in the Southern Hemisphere, on the other hand, shows a nearly symmetrical pattern, starting and ending with a minimum near midnight and two pronounced maxima at 08:10 and 14:40 LMT.
-
The altitude distribution of the PMSE occurrence in the Southern Hemisphere reaches its mean value at ∼ 86.1 km about 1.5 km higher than at Andøya.
-
The mean PMSE altitude observed in the NH shows an almost constant trend with a slight decrease towards the middle of the season shortly after the solstice, followed by a slight increase towards the end of the season. In the SH the mean PMSE altitude tends to decrease over the course of the season but is significantly higher just before the solstice than during the periods before or after.
According to the results of the present study, the question raised by Balsley et al. (1993), “Southern-hemisphere PMSE: Where are they?”, could be answered as follows: they can be found on average further south and at higher altitudes but are more variable than those over the Northern Hemisphere.
A1 Radar calibration
The VHF radar systems on Andøya (ALWIN and MAARSY) and the Davis VHF radar were regularly calibrated according to the methods described in Latteck et al. (2008). For this purpose, the signal of a calibrated noise source and the attenuated transmit signal were fed directly into the receiving system, which usually consists of a front-end amplifier, a baseband receiver, and a digitiser. The basic setup of both methods is outlined in Fig. A1.
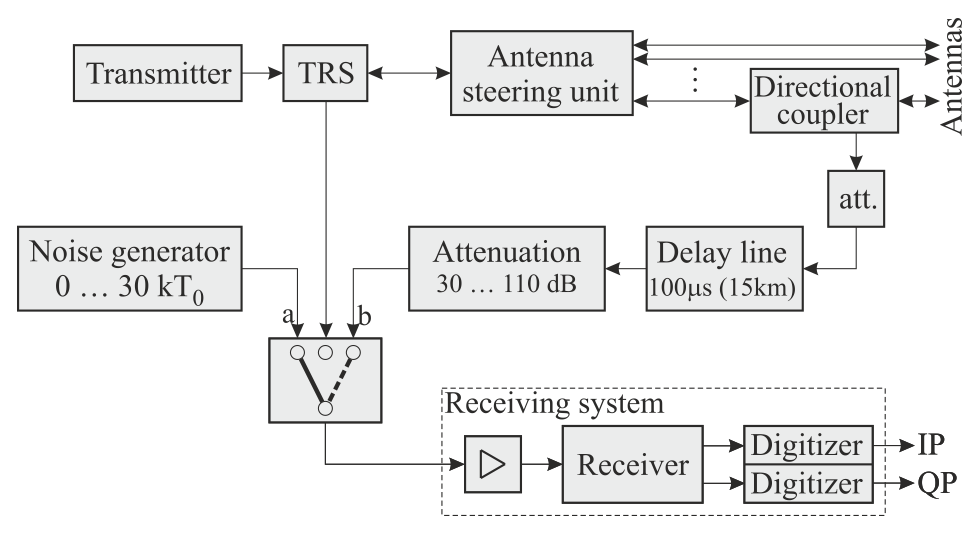
Figure A1Principle of radar calibration (Latteck et al., 2008) using (a) a calibrated noise source and (b) the delayed and attenuated transmitted signal.
Most of the calibration measurements of the Davis and the Andøya VHF radars were performed with setup b shown in Fig. A1, since this leads directly to the calibration factor cs for coherently received signals. The transmit signal is taken from the antenna port using a directional coupler, delayed by 100 µs using an ultrasonic delay line, corresponding to a virtual detection at 15 km at 53.5 MHz, and fed into the input port of the receiver. In the linear dynamic range of the receiver system, the calibration factor cs is obtained by comparing the output power Ps.out in arbitrary units with the injected input power Ps.inp in watts:
as listed in Table 1 for different measurements.
When the Davis VHF radar was upgraded on 22 January 2005, changes were also made to the beam steering unit (BSU), which assigns the signals of the six transmitter outputs and six receiver inputs and associated phase offsets to the 36 antenna groups for beam steering. These changes resulted in additional attenuation of the received signals, which is not captured by the calibration method described above. The resulting distribution of the determined volume reflectivities (dashed black line in Fig. A2) led to unrealistically small values compared to the measurements before the upgrade (black line in Fig. A2). This also becomes clear when comparing the solid black curve from Fig. A2 with the dash-dot curve in the left-hand figure of Fig. 1 in Latteck and Bremer (2017), which represents volume reflectivities of the ALWIN radar comparable at that time.
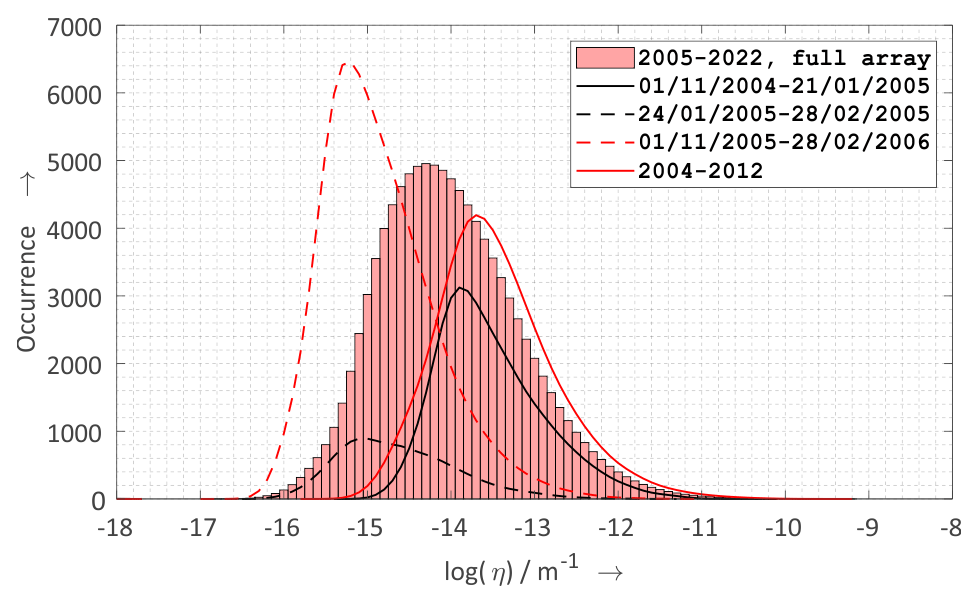
Figure A2Mean distributions of PMSE volume reflectivity obtained with the Davis VHF radar at 69° S during the austral summer periods (November–February) of various periods using 24 out of 144 antennas for receiving (lines). The red bars represent the mean annual distribution (2005–2022) of PMSE volume reflectivity obtained with the Davis VHF radar using all 144 antennas for receiving as used in this study.
From the comparison of the mean values of the volume reflectivities greater than Q0.99 of the distributions before the upgrade (solid black curve in Fig. A2) and the corresponding values for the same period of the 2005/2006 season (dashed red curve in Fig. A2), a correction factor to the calibration factor for after the upgrade was determined, which is the missing part describing the attenuation properties of the BSU. The solid red curve in Fig. A2 shows the distribution of PMSE volume reflectivities obtained from Davis PMSE measurements of one receive channel (24 antennas) with the corrected calibration factor for 2004–2012.
During the 2012/2013 PMSE season, further changes were made to the BSU on the Davis VHF radar, which resulted in the calibration method described above being applicable again. The comparison of the red curves in Fig. 2 shows the good agreement of the distributions before and after the 2012/2013 reconstruction. The red bars in Fig. A2 and the solid red curve in Fig. 2 represent the mean annual distribution (2005–2022) of PMSE volume reflectance obtained with the Davis VHF radar but using all 144 antennas for the reception as used in this study.
The occurrence rates determined from the radar measurements, which were used to create the figures presented in this article, can be found in MAT data format at the following address: https://doi.org/10.22000/1107 (Latteck, 2024).
RL and DJM had the main responsibility for the radar experiments in Andøya and Davis respectively. RL analysed the data and wrote the article. DJM helped with the interpretation of the results and the discussion. Both authors read, corrected, and agreed with the submitted version of the article.
The contact author has declared that neither of the authors has any competing interests.
Publisher’s note: Copernicus Publications remains neutral with regard to jurisdictional claims made in the text, published maps, institutional affiliations, or any other geographical representation in this paper. While Copernicus Publications makes every effort to include appropriate place names, the final responsibility lies with the authors.
This article is part of the special issue “Special issue on the joint 20th International EISCAT Symposium and 15th International Workshop on Layered Phenomena in the Mesopause Region”. It is a result of the Joint 20th International EISCAT Symposium 2022 and 15th International Workshop on Layered Phenomena in the Mesopause Region, Eskilstuna, Sweden, 15–19 August 2022.
This work was supported by the Federal Ministry for Education and Research (Germany) under grant no. 01 LG 1902A (project TIMA-2) in the framework of the Role of the Middle Atmosphere in Climate (ROMIC-II) programme. The authors are indebted to the staff of Andøya Space for their permanent support. Strategic science approval through Australian Antarctic Science projects 2325, 4025, 4445, and 4637 provides scientific support and logistical support for radar operation at Davis. The authors thank David Holdsworth, Ray Morris, and the wintering electronics engineers for their contributions to the Davis radar operation and optimisation.
The publication of this article was funded by the Open Access Fund of the Leibniz Association.
This paper was edited by Hiroatsu Sato and reviewed by four anonymous referees.
Balsley, B. B., Woodman, R. F., Sarango, M., Urbina, J., Rodriguez, R., Ragaini, E., and Carey, J.: Southern-hemisphere PMSE: Where are they?, Geophys. Res. Lett., 20, 1983–1985, https://doi.org/10.1029/93GL02244, 1993. a, b, c
Balsley, B. B., Woodman, R., Sarango, M., Rodriguez, R., Urbina, J., Ragaini, E., Carey, J., Huaman, M., and Giraldez, A.: On the lack of southern hemisphere polar mesosphere summer echoes, J. Geophys. Res., 100, 11685–11693, https://doi.org/10.1029/95JD00510, 1995. a
Becker, E., Knöpfel, R., and Lübken, F.-J.: Dynamically induced hemispheric differences in the seasonal cycle of the summer polar mesopause, J. Atmos. Sol.-Terr. Phy., 129, 128–141, https://doi.org/10.1016/j.jastp.2015.04.014, 2015. a
Berger, U. and von Zahn, U.: Three-dimensional modeling of the trajectories of visible noctilucent cloud particles: An indication of particle nucleation well below the mesopause, J. Geophys. Res.-Atmos., 112, D16204, https://doi.org/10.1029/2006JD008106, 2007. a
Bremer, J., Hansen, T. L., Hoffmann, P., and Latteck, R.: Dependence of polar mesosphere summer echoes on solar and geomagnetic activity, Adv. Space Res., 28, 1071–1076, 2001. a, b
Bremer, J., Hoffmann, P., Latteck, R., Singer, W., and Zecha, M.: Long-term changes of (polar) mesosphere summer echoes, J. Atmos. Sol.-Terr. Phy., 71, 1571–1576, https://doi.org/10.1016/j.jastp.2009.03.010, 2009. a, b
Cho, J. Y. N. and Röttger, J.: An updated review of polar mesosphere summer echoes: Observation, theory, and their relationship to noctilucent clouds and subvisible aerosols, J. Geophys. Res., 102, 2001–2020, 1997. a
Czechowsky, P., Schmidt, G., and Rüster, R.: The mobile SOUSY Doppler radar: Techical design and first results, Radio Sci., 19, 441–450, 1984. a
Dowdy, A., Vincent, R. A., Igarashi, K., Murayama, Y., and Murphy, D. J.: A comparison of mean winds and gravity wave activity in the northern and southern polar MLT, Geophys. Res. Lett., 28, 1475–1478, https://doi.org/10.1029/2000GL012576, 2001. a
Hocking, W. K.: Measurements of turbulent energy dissipation rates in the middle atmosphere by radar techniques: A review, Radio Sci., 20, 1403–1422, 1985. a
Hocking, W. K. and Röttger, J.: Studies of polar mesosphere summer echoes over EISCAT using calibrated signal strengths and statistical parameters, Radio Sci., 32, 1425–1444, 1997. a
Hoffmann, P., Singer, W., and Bremer, J.: Mean seasonal and diurnal variations of PMSE and winds from 4 years of radar observations at ALOMAR, Geophys. Res. Lett., 26, 1525–1528, https://doi.org/10.1029/1999GL900279, 1999. a, b
Huaman, M. M. and Balsley, B. B.: Differences in near-mesopause summer winds, temperatures, and water vapor at northern and southern latitudes as possible causal factors for inter-hemispheric PMSE differences, Geophys. Res. Lett., 26, 1529–1532, https://doi.org/10.1029/1999GL900294, 1999. a
Kirkwood, S.: Polar mesosphere winter echoes – A review of recent results, Adv. Space Res., 40, 751–757, https://doi.org/10.1016/j.asr.2007.01.024, 2007. a, b
Kirkwood, S., Wolf, I., Nilsson, H., Dalin, P., Mikhaylova, D., and Belova, E.: Polar mesosphere summer echoes at Wasa, Antarctica (73° S): First observations and comparison with 68° N, Geophys. Res. Lett., 34, l15803, https://doi.org/10.1029/2007GL030516, 2007. a, b
Latteck, R.: LatteckAG2024, Leibniz Institute of Atmospheric Physics at the University of Rostock [data set], https://doi.org/10.22000/1107, 2024. a
Latteck, R. and Bremer, J.: Long-term changes of polar mesosphere summer echoes at 69° N, J. Geophys. Res.-Atmos., 118, 10441–10448, https://doi.org/10.1002/jgrd.50787, 2013. a, b, c, d
Latteck, R. and Bremer, J.: Long-term variations of polar mesospheric summer echoes observed at Andøya (69° N), J. Atmos. Sol.-Terr. Phy., 163, 31–37, https://doi.org/10.1016/j.jastp.2017.07.005, 2017. a, b, c, d, e, f
Latteck, R., Singer, W., and Bardey, H.: The ALWIN MST radar – Technical design and performances, in: Proceedings of the 14th ESA Symposium on European Rocket and Balloon Programmes and Related Research, Potsdam, Germany, edited by Kaldeich-Schürmann, B., Vol. ESA-SP 437, 179–184, ESA Publications Devision, ESTEC, 31 May–3 June 1999 Noordwijk, the Netherlands, 1999. a
Latteck, R., Singer, W., Morris, R., Murphy, D., Holdsworth, D., and Hocking, W.: Observations of Polar Mesosphere Summer Echoes with absolute calibrated MST radars in the Northern and Southern hemisphere: Interhemispheric similarities and dissimilarities, in: Proceedings of the 11th International Workshop on Technical and Scientific Aspects of MST Radar (MST11), Gadanki/Tirupati, India, edited by: Anandan, V. K., 153–154, Macmillan India Ltd., R. Beri, 11–15 December 2006, New Delhi, India, 2007. a, b, c, d
Latteck, R., Singer, W., Morris, R. J., Hocking, W. K., Murphy, D. J., Holdsworth, D. A., and Swarnalingam, N.: Similarities and differences in polar mesosphere summer echoes observed in the Arctic and Antarctica, Ann. Geophys., 26, 2795–2806, https://doi.org/10.5194/angeo-26-2795-2008, 2008. a, b, c, d, e, f
Latteck, R., Singer, W., Rapp, M., and Renkwitz, T.: MAARSY – The new MST radar on Andøya/Norway, Adv. Radio Sci., 8, 219–224, https://doi.org/10.5194/ars-8-219-2010, 2010. a, b
Latteck, R., Singer, W., Rapp, M., Vandepeer, B., Renkwitz, T., Zecha, M., and Stober, G.: MAARSY – The new MST radar on Andøya: System description and first results, Radio Sci., 47, RS1006, https://doi.org/10.1029/2011RS004775, 2012. a
Latteck, R., Renkwitz, T., and Chau, J. L.: Two decades of long-term observations of polar mesospheric echoes at 69° N, J. Atmos. Sol.-Terr. Phy., 216, 105576, https://doi.org/10.1016/j.jastp.2021.105576, 2021. a, b, c, d, e
Lübken, F.-J. and Berger, U.: Interhemispheric comparison of mesospheric ice layers from the LIMA model, J. Atmos. Sol.-Terr. Phy., 69, 2292–2308, https://doi.org/10.1016/j.jastp.2007.07.006, 2007. a
Lübken, F.-J., Jarvis, M. J., and Jones, G. O. L.: First in situ temperature measurements at the Antarctic summer mesopause, Geophys. Res. Lett., 26, 3581–3584, https://doi.org/10.1029/1999GL010719, 1999. a
Lübken, F.-J., Müllemann, A., and Jarvis, M. J.: Temperatures and horizontal winds in the Antarctic summer mesosphere, J. Geophys. Res., 109, D24112, https://doi.org/10.1029/2004JD005133, 2004. a
Lübken, F.-J., Höffner, J., Viehl, T. P., Becker, E., Latteck, R., Kaifler, B., Murphy, D. J., and Morris, R. J.: Winter/summer transition in the Antarctic mesopause region, J. Geophys. Res.-Atmos., 120, 12394–12409, https://doi.org/10.1002/2015JD023928, 2015. a, b, c
Lübken, F.-J., Latteck, R., Becker, E., Höffner, J., and Murphy, D.: Using polar mesosphere summer echoes and stratospheric/mesospheric winds to explain summer mesopause jumps in Antarctica, J. Atmos. Sol.-Terr. Phy., 162, 106–115, https://doi.org/10.1016/j.jastp.2016.06.008, 2017. a, b, c
Morris, R. J., Murphy, D. J., Reid, I. M., Holdsworth, D. A., and Vincent, R. A.: First polar mesosphere summer echoes observed at Davis, Antarctica (68° S), Geophys. Res. Lett., 31, L16111, https://doi.org/10.1029/2004GL020352, 2004. a, b, c
Morris, R. J., Murphy, D. J., Vincent, R. A., Holdsworth, D. A., Klekociuk, A. R., and Reid, I. M.: Characteristics of the wind, temperature and PMSE field above Davis, Antarctica, J. Atmos. Sola.-Terr. Phy., 68, 418–435, https://doi.org/10.1016/j.jastp.2005.04.011, 2006. a, b
Murphy, D.: Variations in the phase of the semidiurnal tide over Davis, Antarctica, J. Atmos. Sol.-Terr. Phy., 64, 1069–1081, https://doi.org/10.1016/S1364-6826(02)00058-5, 2002. a
Murphy, D. J., Forbes, J. M., Walterscheid, R. L., Hagan, M. E., Avery, S. K., Aso, T., Fraser, G. J., Fritts, D. C., Jarvis, M. J., McDonald, A. J., Riggin, D. M., Tsutsumi, M., and Vincent, R. A.: A climatology of tides in the Antarctic mesosphere and lower thermosphere, J. Geophys. Res.-Atmos., 111, D23104, https://doi.org/10.1029/2005JD006803, 2006. a
Probert-Jones, J. R.: The Radar Equation in Meteorology, Q. J. Roy. Meteor. Soc., 88, 485–495, 1962. a
Rapp, M. and Lübken, F.-J.: Polar mesosphere summer echoes (PMSE): Review of observations and current understanding, Atmos. Chem. Phys., 4, 2601–2633, https://doi.org/10.5194/acp-4-2601-2004, 2004. a
Sato, K., Kohma, M., Tsutsumi, M., and Sato, T.: Frequency spectra and vertical profiles of wind fluctuations in the summer Antarctic mesosphere revealed by MST radar observations, J. Geophys. Res.-Atmos., 122, 3–19, https://doi.org/10.1002/2016JD025834, 2017. a, b
Singer, W., Keuer, D., Hoffmann, P., Czechowsky, P., and Schmidt, G.: The ALOMAR SOUSY radar: Technical design and further developments, in: Proceedings of the 12th ESA Symposium on European Rocket and Balloon Programmes and Related Research, 29 May–1 June 1995, Lillehammer, Norway (ESA SP–370), 409–415, 1995. a
Skolnik, M. (Ed.): Radar handbook, McGraw-Hill, ISBN 0-07-057913-X, 1990. a
von Zahn, U. and Bremer, J.: Simultaneous and common-volume observations of noctilucent clouds and polar mesosphere summer echoes, Geophys. Res. Lett., 26, 1521–1524, https://doi.org/10.1029/1999GL900206, 1999. a
Woodman, R. F., Balsley, B. B., Aquino, F., Flores, L., Vazquez, E., Sarango, M., Huamann, M. M., and Soldi, H.: First observations of polar mesosphere summer echoes in Antarctica, J. Geophys. Res., 104, 22577–22590, https://doi.org/10.1029/1999JA900226, 1999. a, b, c
Wrotny, J. E. and Russell III, J. M.: Interhemispheric differences in polar mesospheric clouds observed by the HALOE instrument, J. Atmos. Sol.-Terr. Phy., 68, 1352–1369, https://doi.org/10.1016/j.jastp.2006.05.014, 2006. a, b
- Abstract
- Introduction
- Observation of polar mesospheric summer echoes at Andøya (69.3° N) and Davis (68.6° S)
- Climatology of PMSE observed at Andøya (1999–2022) and Davis (2005–2022)
- Discussion
- Summary and Conclusions
- Appendix A
- Data availability
- Author contributions
- Competing interests
- Disclaimer
- Special issue statement
- Acknowledgements
- Financial support
- Review statement
- References