the Creative Commons Attribution 4.0 License.
the Creative Commons Attribution 4.0 License.
 | 01 Jul 2024
Observations of ionospheric disturbances associated with the 2020 Beirut explosion by Defense Meteorological Satellite Program and ground-based ionosondes
Pei-Chen Lai
A major explosion that released a significant amount of energy into the atmosphere occurred in Beirut on 4 August 2020. The energy released may have reached the upper atmosphere and generated some traveling ionospheric disturbances (TIDs), which can affect radio wave propagation. In this study, we used data from the Defense Meteorological Satellite Program (DMSP) and ground-based ionosondes in the Mediterranean region to investigate the ionospheric response to this historic explosion event. Our DMSP data analysis revealed a noticeable increase in the ionospheric electron density near the Beirut area following the explosion, accompanied by some wavelike disturbances. Some characteristic TID signatures were also identified in the shape of ionogram traces at several locations in the Mediterranean. This event occurred during a period of relatively quiet geomagnetic conditions, making the observed TIDs likely to have originated from the Beirut explosion, not from other sources such as auroral activities. These observational findings demonstrate that TIDs from the Beirut explosion were able to propagate over longer distances, beyond the immediate areas of Lebanon and Israel–Palestine, reaching the Mediterranean and eastern Europe.
- Article
(958 KB) - Full-text XML
-
Supplement
(654 KB) - BibTeX
- EndNote


A chemical explosion of approximately 2.75 kt of ammonium nitrate occurred in a storage warehouse at the Port of Beirut at ∼ 15:08 UTC on 4 August 2020 (Guglielmi, 2020; Pilger et al., 2021). This accidental anthropogenic explosion has been estimated to have had an effective yield of 0.8–1.1 kt of trinitrotoluene (TNT), generating powerful shock waves in the atmosphere (Pilger et al., 2021) and causing significant property damage and a tragic loss of lives. It was estimated that at least 135 people were killed and more than 5000 were injured (Singhvi et al., 2020). The estimated property damage, economic losses, and public reconstruction needs were between USD 8.5 and 10.1 billion (World Bank, 2020). The blast progression has also been analyzed using still frames and images from video surveillance footage overlooking the port (Diaz, 2021). With such an approach, the numerical fit for the size of the expanding fireball as a function of time provided an estimated TNT-equivalent energy yield of 0.6 kt. Meanwhile, analysis of videos that were posted on social media produced an estimate of the TNT-equivalent explosion strength of between 0.5 and 1.12 kt (Rigby et al., 2020). The scale of the Beirut explosion carried a sufficient amount of energy that could have propagated through the upper atmosphere and affected the ionosphere, potentially generating acoustic-gravity waves (AGWs) and traveling ionospheric disturbances (TIDs).
TIDs are wavelike disturbances that appear in the Earth's ionosphere in the form of periodic striations of electron and ion density (e.g., Hooke, 1968). Based on the scale size or wavelength of the striations, TIDs can be categorized into small-scale TIDs with a wavelength of <100 km, medium-scale TIDs (MSTIDs) with a wavelength of 100–300 km, and large-scale TIDs (LSTIDs) with a wavelength of ∼ 1000 km or larger (e.g., Hunsucker, 1982; Fedorenko et al., 2011; Ivanova et al., 2011; Habarulema et al., 2013; Boyde et al., 2022). TIDs can be a manifestation of AGWs at ionospheric or thermospheric altitudes, due to coupling or collisions between neutral particles and charged plasma particles (e.g., Hines, 1960; Yigit and Medvedev, 2015). Various natural sources of AGWs and TIDs exist, including solar flares (Zhang et al., 2019), geomagnetic storms (e.g., Nicolls et al., 2004; Pradipta et al., 2016; Zakharenkova et al., 2016; Jonah et al., 2018), volcanic eruptions (e.g., Cheng and Huang, 1992; Themens et al., 2022; Takahashi et al., 2023), meteor explosions (e.g., Yang et al., 2014; Perevalova et al., 2015; Pradipta et al., 2015), and earthquakes and tsunamis (e.g., Tsugawa et al., 2011; Chou et al., 2020; Pradipta et al., 2023). Sometimes there are also anthropogenic sources of TIDs, such as nuclear weapon detonation tests (e.g., Park et al., 2011; Huang et al., 2019), rocket launches (e.g., Chou et al., 2018; Liu et al., 2018), and major industrial accidents (e.g., Jones and Spracklen, 1974; Krasnov et al., 2003; Galushko et al., 2008). Depending on the scale of energy associated with a source, the distance traversed by the TIDs may vary, and the observed effects can be short-lived and localized (e.g., Nishioka et al., 2013) or long-lived and global (e.g., Lee et al., 2008). Ionospheric plasma density fluctuations associated with TIDs can affect high-frequency (HF) radio communications, navigation systems, and other technologies that depend on the radio wave propagation properties of the ionosphere (e.g., Belehaki et al., 2020; Zhang et al., 2022).
Lower and upper atmospheric disturbances associated with the 4 August 2020 Beirut explosion have been investigated in a number of recent research works. For example, the propagation of infrasonic waves near the Earth's surface from the Beirut explosion was characterized by Pilger et al. (2021) using Comprehensive Nuclear-Test-Ban Treaty Organization (CTBTO) sensors. It was estimated that the infrasonic waves propagated radially away from Beirut with a velocity of 344 m s−1. Seismometers located in the region surrounding Beirut also indicated the presence of impulsive signals from the explosion in the form of seismic, hydroacoustic, and acoustic waves within the 0.5–0.8 Hz frequency band (Pilger et al., 2021). Propagation of TIDs in the F-region ionosphere associated with the Beirut explosion has also been reported by Kundu et al. (2021) and Jonah et al. (2021). In the two aforementioned studies, total electron content (TEC) data from ground-based Global Navigation Satellite System (GNSS) receivers in the Lebanon and Israel–Palestine area shortly after the explosion were analyzed, and a TID propagation velocity in the 750–800 m s−1 range was found.
In this study, we investigated the TIDs associated with the Beirut explosion in more distant regions using in situ ion density measurements and ground-based ionosondes. This paper is organized as follows: in Sect. 2, we describe the methodology; in Sect. 3, we present the results and discussion; and we summarize the results and present the conclusions in Sect. 4.
In this study, we used data from a variety of sources, including the Defense Meteorological Satellite Program (DMSP) and ground-based ionosondes in the Mediterranean region. Data on solar wind and geomagnetic conditions were also examined to assess the background space weather conditions. Below, we present the details.
2.1 DMSP
The DMSP satellites fly in low-earth orbit (LEO) at approximately 840 km altitude along Sun-synchronous, near-circular polar-orbits with an inclination of 98.7° (Burke et al., 2004). The orbital period is ∼ 104 min and results in an average of 14 orbits per day. The ascending nodes are in the dusk sector, whereas the descending nodes are in the dawn sector. For space weather study, the Special Sensor for Ion and Electron Scintillation (SSIES) instrument aboard the DMSP spacecraft provides local information on number densities, temperatures, and drift motions of ionospheric ions and electrons. We specifically used 1 s Langmuir probe data from SSIES on DMSP F17, which provide measurements of heavy (O+) and light (He+ and H+) ion densities. The total ion density data are given with a 1 s time resolution. In contrast, the ion fraction data are originally given at a 4 s resolution, and they are interpolated onto a 1 s resolution time grid for our analysis. We focused on the data from DMSP F17 based on the timing of its ascending pass over the Mediterranean area on 4 August 2020 following the explosion event at the Port of Beirut. The ion densities were detrended using a 50-point moving average to reveal the presence of fluctuations indicative of ionospheric disturbances. At a 1 s time resolution, this setup corresponds to a 50 s window for the moving average. With an orbital velocity of ∼ 7.3 km s−1 at an altitude of ∼ 840 km, this 50 s window corresponds to a (50 s × 7.3 km s−1 =) 365 km spatial interval. As the DMSP orbital velocity (∼ 7.3 km s−1) is much faster than the typical MSTID propagation velocity of a few hundred meters per second, this 365 km spatial interval is suitable for capturing fluctuations associated with MSTIDs (100–300 km wavelength). The DMSP observation data were retrieved via the Madrigal Database: http://cedar.openmadrigal.org (last access: 14 June 2024).
Figure 1 shows a regional map containing the ascending orbit trajectories of the DMSP spacecraft near the Beirut sector on 4 August 2020 as well as the coordinates of a few key locations. The trajectories of different DMSP spacecraft are indicated by different colors. At the two ends of each orbit trajectory line segment, the coordinated universal time (UTC) values are shown. Given the time of the Beirut explosion (15:08 UTC), only the DMSP F17 spacecraft had the appropriate timing for its orbit to sample the ionosphere over Beirut's longitude sector shortly (∼ 1 h) after the explosion. Other DMSP spacecraft passed over the area too early (before the explosion occurred) and their subsequent ascending passes after the explosion were too far (≥ 20° longitude) west of Beirut's longitude sector. The location of the Port of Beirut is indicated by a red asterisk in Fig. 1; the approximate positions of ionospheric disturbances intercepted by DMSP F17 along its trajectory (details presented in Sect. 3) are shown as red circles; and red squares mark the location of ionosondes, which we describe next.
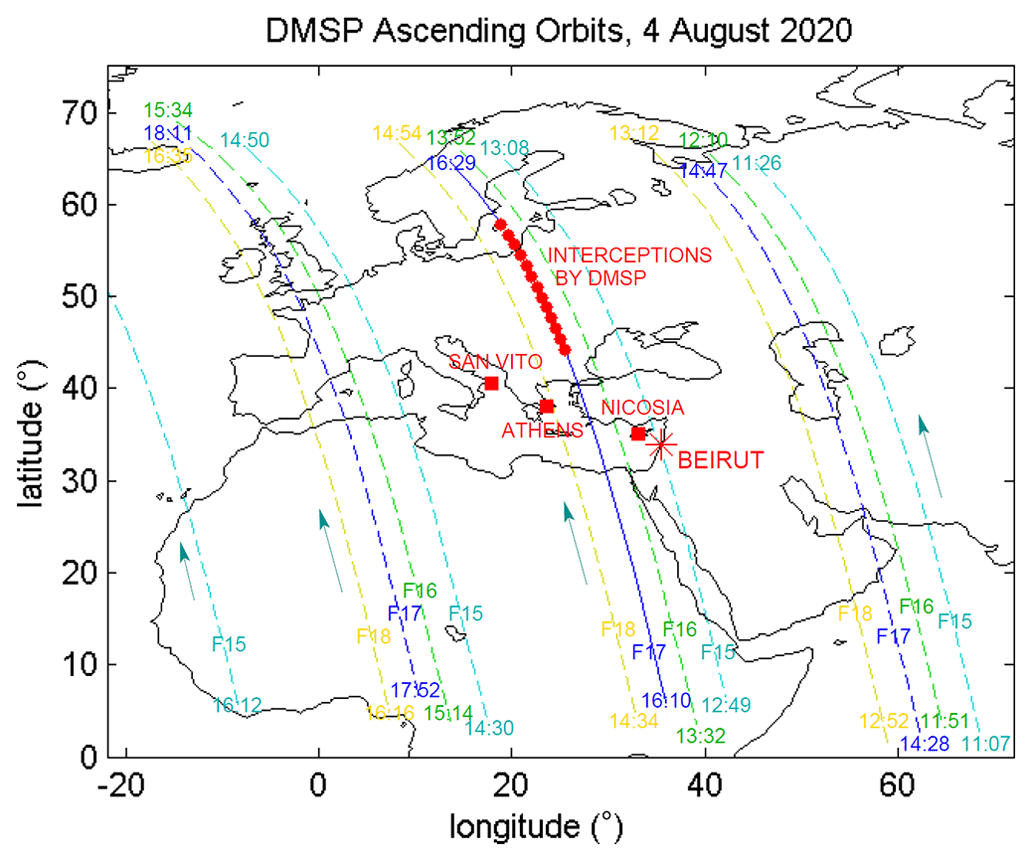
Figure 1Situational map of the explosion site at the Port of Beirut (red asterisk), nearby ionosonde stations (red squares), and ground tracks of DMSP spacecraft (various solid and dashed lines) around the area on 4 August 2020. Arrows indicate the general orbit direction. The start and end times (in UTC) of each satellite overpass are indicated on the ground tracks. The explosion occurred at 15:08 UTC.
2.2 Ionosondes
An ionosonde is a type of frequency-swept, high-frequency (HF) radar that transmits radio waves vertically to measure various layers in the ionosphere. The observations from an ionosonde are typically displayed in the form of ionograms. The characteristic TID signatures in ionosonde observations may be recognized as periodic time variations in foF2 or hmF2 (Klausner et al., 2009; Chernogor, 2015; Huang et al., 2016) or as special features in the shape of the traces in individual ionograms (Munro, 1950, 1953; Heisler, 1958). These special ionogram trace features include the following: Y-forking of the trace near foF2, Z-twisting of the trace, additional cusp(s) in the trace, and formation of round loop(s) in O-mode and/or X-mode traces.
In this study, we used three ionosondes: Nicosia (35.03° N, 33.16° E), Athens (38.00° N, 23.5° E), and San Vito (40.60° N, 17.80° E) stations (marked as red squares on the map in Fig. 1). The Nicosia, Athens, and San Vito stations are approximately 250, 1172, and 1730 km from Beirut (33.9° N, 35.52° E), respectively. At Nicosia and Athens, ionograms were recorded once every 5 min. Meanwhile, at San Vito, ionograms were recorded once every 7–8 min. We examined the time variation in the F2-layer virtual height h′F2 and critical frequency foF2 to try to identify periodic wavelike behavior. In addition, we also examined the shape of the traces in individual ionograms to identify anomalous special features that would indicate the presence of a TID passing over the ionosonde station. The ionogram data were retrieved from the University of Massachusetts Lowell (UML) Global Ionospheric Radio Observatory (GIRO) Digital Ionogram Database (DIDBase). The data can be downloaded from the UML GIRO Data Center (https://giro.uml.edu, last access: 14 June 2024) and can also be accessed using the SAO Explorer program.
2.3 Solar wind and geomagnetic activity data
To determine external factors that could affect space weather conditions during the time period of interest, we examined a number of variables provided by the NASA OMNIWeb service (https://omniweb.gsfc.nasa.gov, last access: 14 June 2024). For this study, we retrieved the solar wind parameters, which include the solar wind speed and the interplanetary magnetic field (IMF) components in Geocentric Solar Magnetospheric (GSM) coordinates; geomagnetic indices, which include the planetary K (Kp) and the disturbance storm time (Dst) indices; and the F10.7 solar flux index. In addition, we also examined the solar flare index data (Dodson and Hedeman, 1975), which are prepared by the Kandilli Observatory and Earthquake Research Institute at Boǧaziçi University. The solar flare index data were retrieved from the NOAA National Geophysical Data Center (NGDC): https://www.ngdc.noaa.gov/stp/space-weather/solar-data/solar-features/solar-flares/index/ (last access: 14 June 2024).
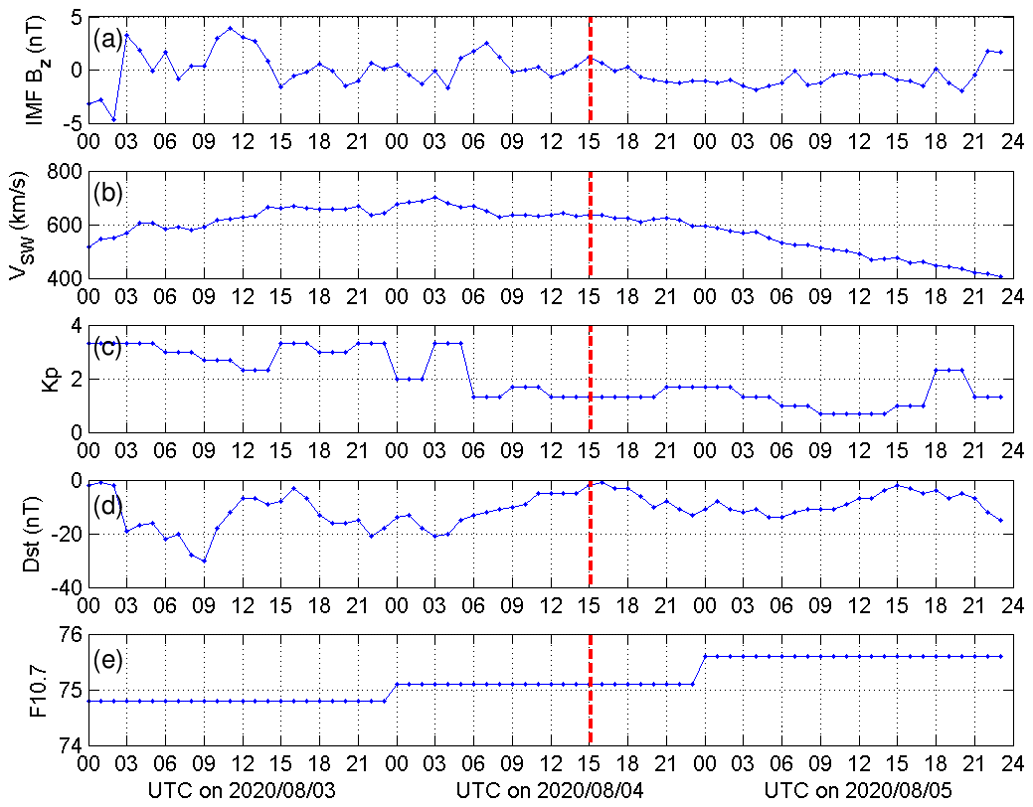
Figure 2Overview of solar and geomagnetic conditions on 3–5 August 2020. The time of the Beirut explosion (15:08 UTC on 4 August 2020) is indicated by the vertical dashed red line.
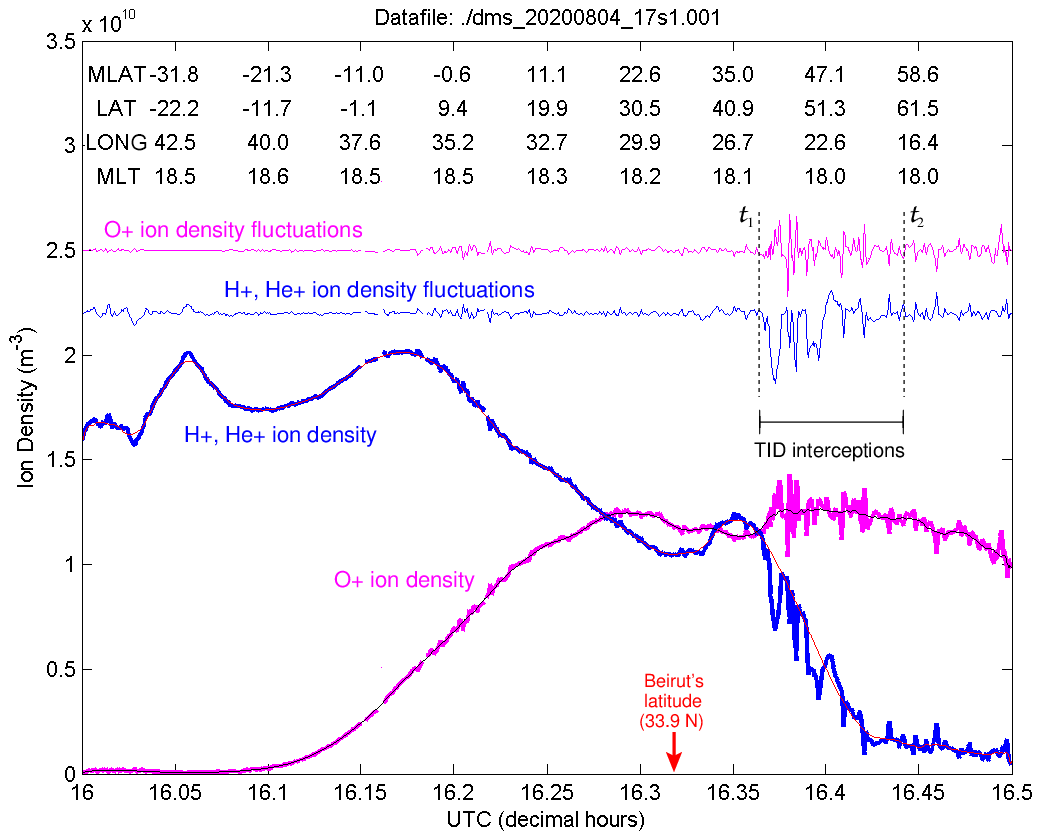
Figure 3Time series of ion density observations by DMSP F17 spacecraft between 16:00 and 16:30 UTC on 4 August 2020 over Beirut's longitude sector. The Beirut explosion occurred at 15:08 UTC, which was approximately 1 h before this particular satellite overpass.
Figure 2 shows a set of time series plots for basic solar wind parameters (IMF Bz and solar wind speed VSW), geomagnetic indices (Kp and Dst), and the F10.7 solar flux index on 3–5 August 2020. There was no significant southward turn of IMF Bz, and the solar wind speed was relatively steady between 400 and 600 km s−1. Kp was slightly elevated on 3 August 2020 but stayed under 4−, and it dropped below 2o at 06:00 UTC on 4 August 2020. Dst exhibited slight activity, reaching −30 nT on 3 August 2020, but it recovered quite quickly and hovered between 0 and −20 nT on 4–5 August 2020. The F10.7 solar flux index was stable at a relatively low value of around 75 sfu (solar flux units). Examination of solar flare index data also indicated the absence of solar flares during this time period. In summary, solar and geomagnetic activity around the time of the Beirut explosion was rather calm, with no geomagnetic storms or solar flares present. These quiet conditions help us to rule out potential contamination from space weather events.
Figure 3 shows a composite time series plot of ion density observations by the DMSP F17 spacecraft as it passed over Beirut's longitude sector between 16:00 and 16:30 UTC on 4 August 2020. Beirut's latitude is marked with a red arrow on the time axis. Numerical values of some basic information (magnetic latitude, MLAT; latitude, LAT; longitude, LONG; and magnetic local time, MLT) of the DMSP F17 spacecraft orbit during this ascending pass are printed on the top portion of the graph. The bold blue (magenta) curves represent the light ion (oxygen ion) density data recorded during this particular pass. The baseline trend lines (computed via moving averages) are superposed on top of these bold curves. The baseline for the light ion (oxygen ion) density is depicted as a thin red (black) curve. Subtracting these baselines from the original observations gives us the net ion density fluctuations. The light ion (oxygen ion) density fluctuations are represented by the thin magenta (blue) curves. The time interval during which a significant level of fluctuation is present is marked with a pair of dashed lines, designated as t1 and t2. More precisely, the numerical boundaries of this time interval are t1 = 16:22 UTC = 16.3650 h and t2 = 16:26 UTC = 16.4397 h. This highlighted interval corresponds to the red circles shown earlier on the regional map (see Fig. 1). The peak-to-peak amplitude of these ion density perturbations is in the order of 4 ×10⁹–5 × 10⁹ m−3.
Figure 4 shows a set of stacked line plots of oxygen ion density fluctuations recorded by the DMSP F17 spacecraft between the geographic latitudes of 0 and 70° N during ascending passes over Beirut's longitude sector at ∼ 18:00 MLT for different calendar dates from 4 June 2020 until 12 August 2020. The dates are selected such that all of the specified ascending passes would be as close as possible to the pass happening on 4 August 2020 (i.e., the day of the Beirut explosion), with an east–west spread of less than 500 km. As a reference, the day of the explosion is marked with a star sign. All of these DMSP F17 passes were at approximately the 18:00 MLT sector, which helps us establish if there were diurnally recurring TIDs near dusk for this longitude sector. In terms of the ion density fluctuation data, we found little or no sign of prominent TIDs that repeat diurnally around this area. In addition, the potential effects of geomagnetic activity are taken into account using the Kp index. Two separate Kp index values are listed for each line plot: one is the maximum Kp over the 24 h period on that calendar date; the other is the Kp value at 15:00 UTC on the same date. The specific hour of 15:00 UTC represents the approximate time of day when the explosion occurred on 4 August 2020. In these line plots, we found significant ion density fluctuations between geographic latitudes of 41 and 61° N on 4 August 2020 (i.e., the day of the explosion), whereas we found practically none on the remaining calendar dates. To help rule out possible contamination from geomagnetic activity, as max Kp was 3+ on 4 August 2020, we compared these fluctuations against two other dates (4 and 5 July 2020) with similar max Kp values of 3o and 3+. We found little or no significant fluctuation on these two dates, despite the slightly elevated max Kp values. This pattern suggests that the ion density fluctuation intercepted by the DMSP F17 spacecraft over the aforementioned interval on 4 August 2020 was not due to geomagnetic activity. It could, therefore, be related to the explosion at the Port of Beirut that occurred on that date approximately 1 h prior to the satellite pass over the area.
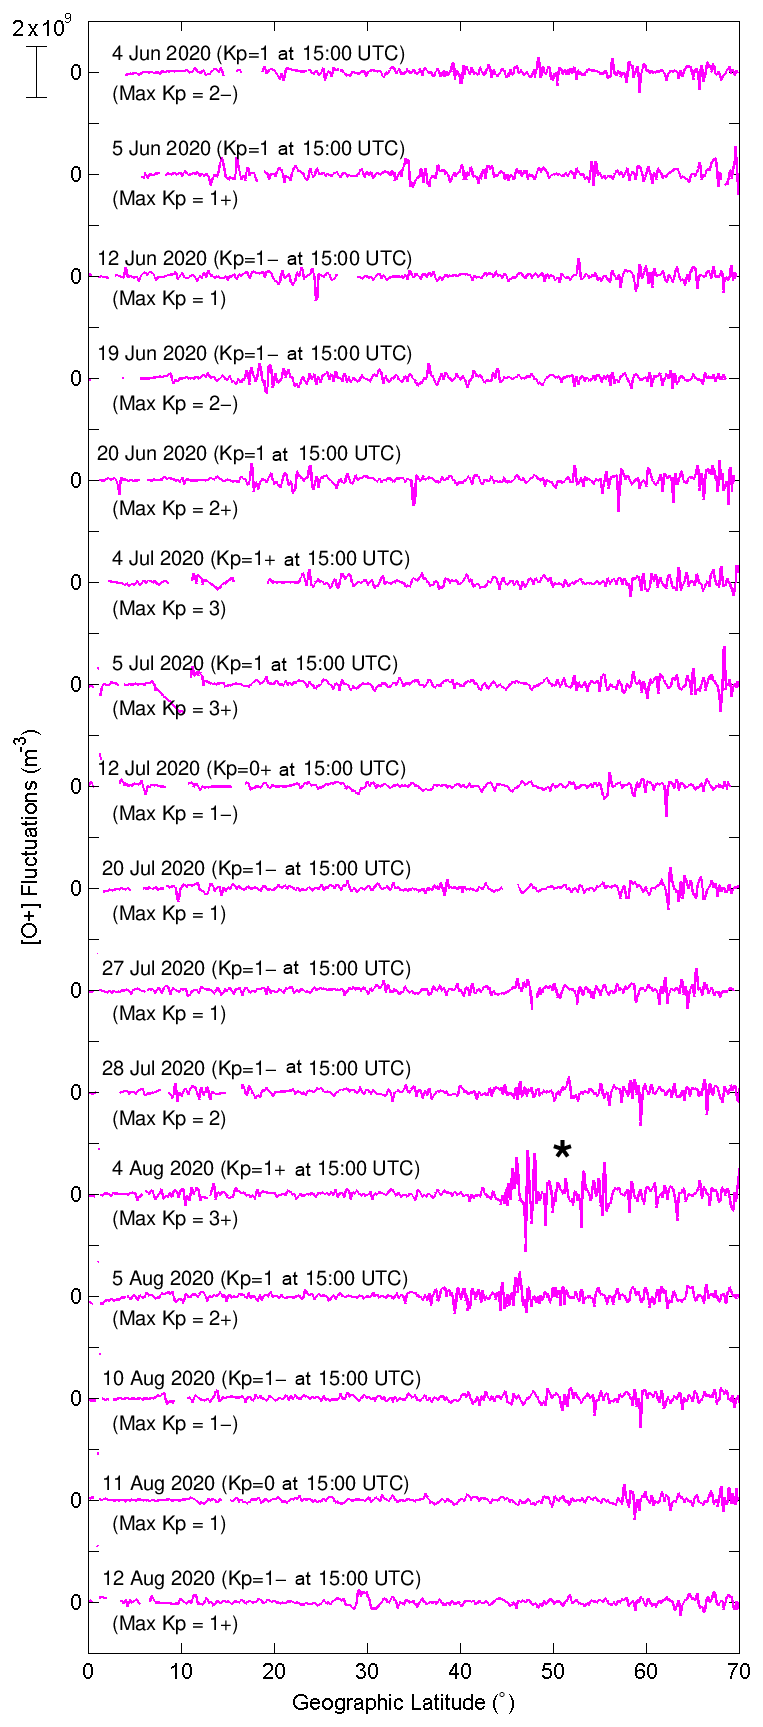
Figure 4Oxygen ion density fluctuations registered by the DMSP F17 spacecraft between 0 and 70° N geographic latitude over Beirut's longitude sector at ∼ 18:00 MLT for multiple dates before, on, and after the day of the explosion.
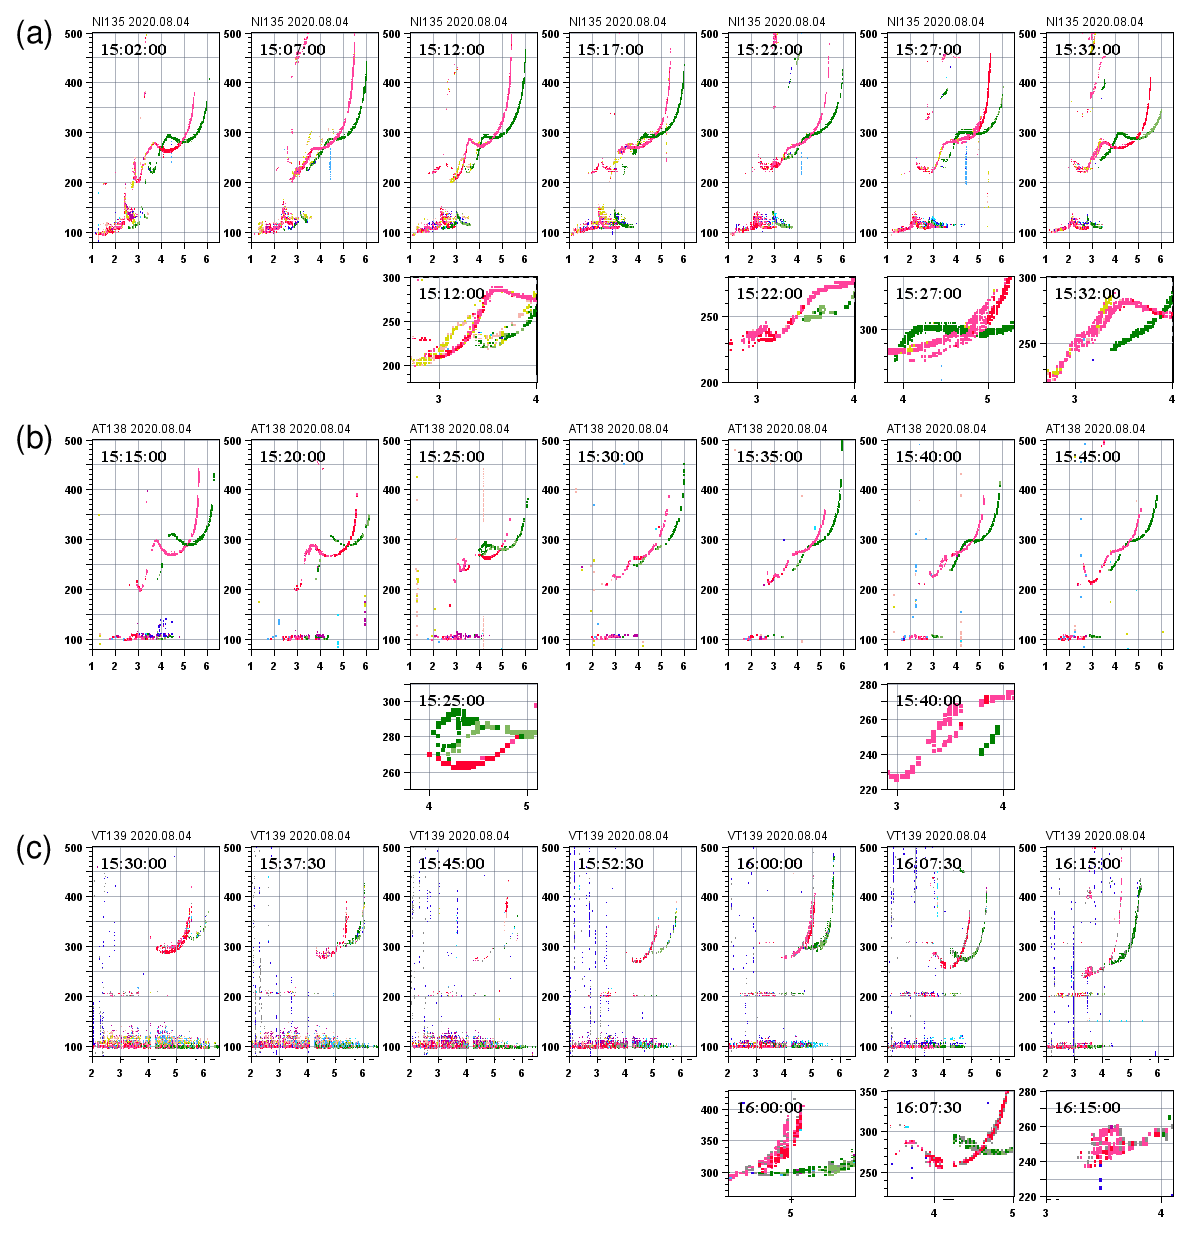
Figure 5Sample ionograms from (a) Nicosia, (b) Athens, and (c) San Vito stations on 4 August 2020. Characteristic TID signatures, recognized as peculiar distortions in ionogram traces, are highlighted with magnification in auxiliary panels below the corresponding ionograms.
Figure 5 shows several representative ionograms from the Nicosia, Athens, and San Vito digisonde stations on 4 August 2020. The timestamp (in UTC) is indicated in the top left-hand corner of each ionogram. Red or pink traces on these ionograms represent the O-mode echoes, whereas green traces represent the X-mode echoes. Traces with other colors represent O-mode echoes that arrive from oblique directions. For some ionograms, auxiliary panels are shown below the corresponding ionograms to highlight certain features (i.e., characteristic TID signatures) with magnification. Figure 5a shows a set of sequential ionograms recorded at the Nicosia station (codename NI135; 250 km from Beirut) during the 15:02–15:32 UTC interval. During this time interval, foF2 was relatively stable around 5.5 MHz, without any sharp or drastic changes. However, four ionograms are of interest to us due to some anomalies in their trace shape between 3 and 5 MHz, which are highlighted with magnification in their auxiliary panels. At 15:12, 15:22, and 15:32 UTC, the O-mode trace can be seen forming a loop near 3 MHz. At 15:27 UTC, we can see the O-mode trace forming a Z-shaped twist between 4 and 5 MHz. Figure 5b shows sequential ionograms recorded at the Athens station (codename AT138; 1172 km from Beirut) during the 15:15–15:45 UTC interval. During this time interval, there was a relatively thin (non-blanketing) sporadic-E layer, and we can see foF2 varying slowly from 5.5 to 5.0 MHz. While the foF2 variation appeared smooth, two ionograms are of interest to us due to some anomalies in their trace shape, which are highlighted with magnification in their auxiliary panels. At 15:25 UTC, the X-mode trace can be seen forming a loop. Later, at 15:40 UTC, we can see the O-mode trace forming a loop. Figure 5c shows sequential ionograms recorded at San Vito station (codename VT139; 1731 km from Beirut) during the 15:30–16:15 UTC interval. During this time interval, there were more significant changes in the ionogram traces around foF2. In fact, at 15:45 UTC, the F2 trace momentarily disappeared. There was a strong sporadic-E layer (with some spread-E echoes) during this interval, which might have contributed to the aforementioned F2 trace disappearance (by blanketing). Furthermore, three ionograms are of interest to us due to some anomalies in their trace shape, which are highlighted with magnification in their auxiliary panels. At 16:00 UTC, there was a Y-forking or bifurcation of the O-mode trace at foF2. At 16:07 UTC, there was an upward-facing bulge in the O-mode trace just below 4 MHz. At 16:15 UTC, the aforementioned bulge evolved into a complete loop in the O-mode trace at approximately 3.5 MHz.
All of the above features in the ionogram traces (i.e., loop/mouth, Z-twist, and Y-forking) are indicative of TIDs propagating overhead of (or near) the ionosonde stations (Munro, 1950, 1953; Heisler, 1958). Such anomalies in the ionogram traces arise from periodic undulations and curvatures in the isodensity contours of the F-region ionosphere due to AGWs/TIDs (Munro, 1953; Cervera and Harris, 2014). Specifically, these anomalous features are the result of concave indentation in the ionospheric isodensity contour overhead of the ionosonde station. This would be the situation when the ionosonde is located underneath a TID trough, with a pair of TID crests on opposing sides. The loop or twist feature can occur if the ionosonde is positioned asymmetrically with respect to the center of the indentation and if the TID wavefront has some slant or tilt from vertical. On the other hand, the Y-forking feature can occur if the ionosonde is positioned symmetrically with respect to the center of the indentation and if the TID wavefront has little or no tilt (i.e., close to vertical orientation). The presence of a Y-forking feature over San Vito (but not over Nicosia and Athens) may indicate an evolution of the TID wavefront from being slanted or tilted to more vertical as the AGW/TID phase velocity leveled out to become relatively more horizontal moving away from the source. A few additional diagrams to help visualize the formation of these anomalous ionogram features are provided in the Supplement.
Meanwhile, examination of ionograms on 4 August 2020 from two additional ionosonde stations located slightly further away, at Gibilmanna (1988 km from Beirut) and Rome (2199 km from Beirut), did not show any clear presence of the aforementioned characteristic TID signatures. Examination of ionograms from several ionosondes at even greater distances (Pruhonice: 2475 km; Juliusruh: 2874 km; Dourbes: 3095 km; and Roquetes: 3175 km) did not show any clear presence of such characteristic TID signatures on 4 August 2020 either. This may indicate that the bottomside ionospheric undulations due to the 4 August 2020 explosion were effectively dissipated at a distance of 2000–2200 km from Beirut.
In addition to the ionogram trace anomaly analysis, we also examined data time series of auto-scaled foF2 values from the GIRO DIDBase FastChar service for the three ionosonde stations (Nicosia, Athens, and San Vito) to look for ideal characteristic TID signatures in the form of ringing or sinusoidal signals. Unfortunately, we did not find any clear sign of long-lasting sinusoidal or oscillatory signals in the foF2 or hmF2 data time series that could be directly linked to AGWs/TIDs from the Beirut explosion. The impulsive nature of the phenomenon may be the primary reason why the TIDs could be detected in the form of ionogram trace anomaly/anomalies but not as long-lasting sinusoidal signals. As a reference, time series plots of foF2 and hmF2 on 1–6 August 2020 from these three ionosonde stations are provided in the Supplement.
Given the recorded time of the explosion at the Port of Beirut (15:08 UTC on 4 August 2020), we are able to determine the time delay from the explosion until the TIDs were either intercepted by the DMSP instruments or detected overhead by the ionosondes. Based on the first arrivals of the TIDs, the shortest time delays from the explosion to each respective ionosonde station are as follows: 4 min for Nicosia, 17 min for Athens, and 52 min for San Vito. In addition, great-circle distances of the interception or detection points relative to the Port of Beirut are also known. Using both the time delay and distance information, we are able to assemble a distance–time plot for the TIDs that we suspect to be caused by the explosion at the Port of Beirut. With the distance–time plot, kinematics analysis of the TID propagation is also possible.
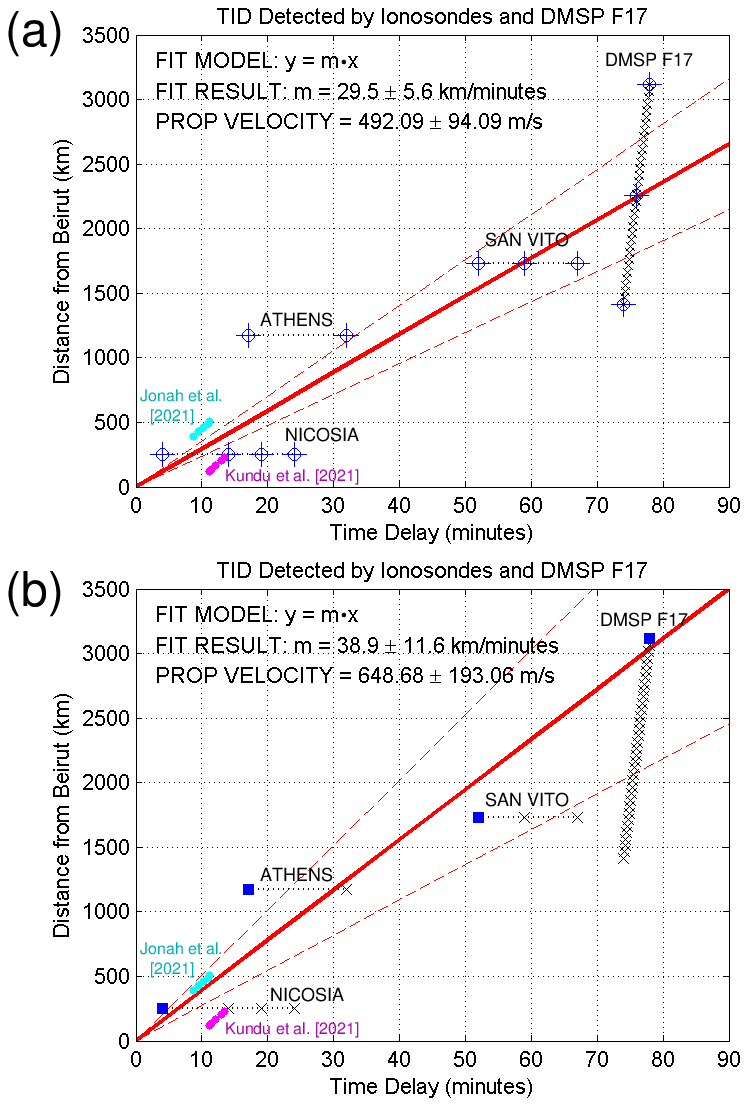
Figure 6Kinematics analysis of TID propagation away from the explosion site at the Port of Beirut on 4 August 2020 (a) with equal weight applied to all types of data points in the curve fitting and (b) with exclusive emphasis on data points associated with the leading wavefront in the curve fitting. Comparison with observations by Kundu et al. (2021) and Jonah et al. (2021) is included in the graphs.
Figure 6 shows a pair of distance–time plots for these TID interception or detection points, and the associated kinematics analysis of the TID propagation – with the explicit assumption that the TIDs had originated from Beirut. In each distance–time plot, great-circle distances from the Port of Beirut as a function of the time delay since the explosion, based on DMSP and ionosonde observations, are plotted. For comparison, auxiliary data points from previous works by Kundu et al. (2021) and Jonah et al. (2021) are also plotted. These auxiliary data points, shown in magenta and cyan, were obtained from a data figure in Kundu et al. (2021) and from a data table in Jonah et al. (2021). Least-squares fit lines to the DMSP and ionosonde data points using the model (where y is the distance and x is the time delay) are displayed, with the solid red line representing the main fit and the dashed red lines representing the 95 % confidence interval. In Fig. 6a, data points that were used in the fit are shown as blue crosshairs. For the ionosonde observations, this means all the data points. For the DMSP F17 observations, three data points were included from the t1−t2 time interval (see Fig. 3): two at the interval boundaries and one at the midpoint. Not all of the DMSP observation data points were used so as not to overpower the ionosonde data points in the fitting process. In Fig. 6b, data points that were used in the fit are shown as blue squares. These are the data points that represent the leading wavefront of the TIDs. For the ionosonde observations, these are the first ones to be detected after the explosion. Meanwhile for the DMSP F17 observations, it is the farthest data points from Beirut – i.e., data points intercepted at the t2 epoch (see Fig. 3). In both panels, data points that were not used in the fit are shown as light cross marks. The numerical fitting results are shown in the top left-hand corner of each panel. The slope m from the fitting provides information on the horizontal phase velocity of the TID propagating away from the source region. In the first treatment with roughly equal fitting weights for different observation types, shown in Fig. 6a, the estimated TID propagation velocity was 492±94 m s−1. Here, the main fit line falls almost exactly in between the measurement points from Kundu et al. (2021) and Jonah et al. (2021). The estimated TID velocity of ∼ 500 m s−1, however, is well below the 750–800 m s−1 range that Kundu et al. (2021) and Jonah et al. (2021) had previously reported. In the second treatment with a priority for the leading wavefront, shown in Fig. 6b, the estimated TID propagation velocity was 649±193 m s−1. In this case, the main fit line is more closely aligned with the measurements from Jonah et al. (2021), as it corresponds to a larger TID velocity that is generally closer to the aforementioned 750–800 m s−1 range, although one must note here that the statistical uncertainty is also larger.
From the data analysis, there are a few aspects of the present findings that we would like to highlight and elaborate on further: (1) the estimated TID propagation velocity, which is generally faster than the speed of sound in air at ground level; (2) the maximum radial range TID propagation away from the source at the Port of Beirut; (3) the absence of TIDs on the southern side of Beirut in the DMSP observation; and (4) the relative magnitude of the disturbances observed by different measurement types for this Beirut explosion event.
In comparison to the regular speed of sound of ∼ 330 m s−1 in air at ground level, the estimated TID propagation velocity in the range of 492–649 m s−1 from our kinematics analysis is significantly higher. The estimated TID propagation velocity of 750–800 m s−1 from previous studies based on GNSS TEC observations near the Beirut area (Kundu et al., 2021; Jonah et al., 2021) is higher still. This faster-than-expected TID propagation velocity may be due to several factors. At ionospheric or thermospheric altitudes, the background temperature Tn of neutral molecules is greater than that at ground level, which gives rise to a higher acoustic velocity that would allow a faster AGW/TID propagation velocity. Furthermore, the explosive nature of the source may also contribute to causing atmospheric disturbances that propagate at supersonic speed, even at ground level. From controlled explosive tests, it is known that the amount of overpressure determines the Mach number of the shock wave generated by the explosion (e.g., Kleine et al., 2003), with higher Mach numbers for greater overpressures. In the limit of a vanishingly small overpressure, the Mach number would approach 1.00 (e.g., Medici and Waite, 2016). HF radio measurements of wave disturbances in the lower ionosphere (i.e., at E-region altitudes) from explosive tests on the ground surface also yielded a propagation velocity in the order of ∼1 km s−1 (e.g., Fitzgerald and Carlos, 1997). As such, a TID propagation velocity in the range of 500–800 m s−1 associated with the Beirut explosion event is quite reasonable. Our estimate for the TID propagation velocity is lower than the estimates of Kundu et al. (2021) and Jonah et al. (2021), perhaps due to the fact that we are working with ionospheric disturbances detected at greater distances from the Port of Beirut.
In previous studies (Kundu et al., 2021; Jonah et al., 2021), the TIDs due to the Beirut explosion event were detected at distances ≤500 km from the source at the Port of Beirut. In those previous studies, the TIDs were observed in the TEC perturbation (TECP) signals, where the disturbance signal from the Beirut explosion was recognizable in the form of an N-shaped impulse. Beyond the immediate areas of Lebanon and Israel–Palestine, no TID from the explosion event was detected in the TECP data. It is likely that the TID amplitude had dropped below the level that can be detected in TECP data. Meanwhile, in our analysis of DMSP and ionosonde observation data, the TIDs were detected or intercepted at distances of up to 3000 km from the Port of Beirut, which comprise a considerably greater radial range. This greater range at which the TIDs can still be detected may come from a number of factors. In the case of ionosondes, the detectability of the TIDs might be due to strong ionospheric refraction or bending of HF radio waves, making them highly sensitive to undulations that are present in the isodensity contours of the bottomside ionosphere. This sensitivity would allow the ionosondes to be able to detect TIDs from the Beirut explosion up to a distance of ∼ 1700 km. In the case of DMSP, which is at an altitude of ∼ 840 km (i.e., topside ionosphere), the amplification of AGWs as they propagate to higher altitudes where the background atmospheric mass density is lower may help maintain the amplitude of the resulting TIDs over a large horizontal distance of up to ∼ 3000 km. In turn, this amplification increases the chance of their detectability by DMSP at this topside ionospheric altitude. Ultimately, we may expect that these topside TIDs would be dissipated as soon as they crossed the auroral oval into the polar region. Given the local time sector of the DMSP F17 orbit (∼ 18:00 MLT) and condition at that time, the equatorward boundary of the auroral oval in the Northern Hemisphere can be estimated to be at ∼ 75° MLAT (Starkov, 1994; Sigernes et al., 2011; Fiori et al., 2020), which was at a ∼ 4800 km distance from Beirut.
In the DMSP F17 measurements during its ascending pass between 16:00 and 16:30 UTC on 4 August 2020, TIDs were intercepted between a latitude of 41 and 61° N to the north of Beirut. However, there were no corresponding plasma density disturbances observed to the south of Beirut. If everything is symmetrical, it is expected that TIDs from the Beirut explosion would be detected in all directions. In fact, the TIDs reported in previous studies (Kundu et al., 2021; Jonah et al., 2021) were observed at point coordinates south of Beirut. There must be physical reasons that DMSP F17 did not intercept any TIDs to the south of Beirut at the altitude of its orbit. The reason might be related to the low ion-neutral collision frequency at the altitude of DMSP orbit, which makes the plasma behave as magnetized plasma much more strongly than it does around the main ionospheric F peak where the ion-neutral collision frequency is higher. The ion-neutral collision frequency νin at 850 km altitude is lower than that at 300 km altitude by a factor of ∼104 (e.g., Tu et al., 2011). With magnetized plasma behavior, plasma density irregularities would be more forced to be field-aligned. AGWs/TIDs that propagated southward from Beirut would arrive at a low-latitude region where the geomagnetic field is nearly horizontal. As a result of this near-horizontal magnetic field and the magnetized plasma behavior at the DMSP altitude, the plasma density striations that formed would be field-aligned with horizontally elongated wavefronts. Undulations in plasma density would only be detectable along a vertical cut, not along a horizontal cut, making it difficult for DMSP to detect them. On the other hand, AGWs/TIDs that propagated northward from Beirut would arrive at the upper midlatitude region where the magnetic dip angle is steeper. Under such a geomagnetic field geometry, the resulting field-aligned plasma density striations would still be visible along a horizontal cut, making their detection by DMSP much more feasible.
Finally, we can make some remarks regarding the relative amplitudes of TIDs detected after the Beirut explosion event. In the observations of Kundu et al. (2021), the detected TIDs had a peak-to-peak amplitude of 0.28 TECU (where TECU denotes TEC units). The background TEC was 13.4 TECU; thus, the relative peak-to-peak amplitude was ∼ 2.1 %. In the observations of Jonah et al. (2021), the TID amplitude was 0.06 TECU (the peak-to-peak amplitude would be 0.12 TECU). The background TEC was approximately 11 TECU; thus, the relative peak-to-peak amplitude was ∼ 1.1 %. In our analysis of the DMSP F17 observations, the peak-to-peak amplitude of the intercepted ionospheric disturbances was 4 ×10⁹–5 × 10⁹ m−3 with a background ion density of ∼1.2 × 10¹⁰ m−3. The relative peak-to-peak amplitude is, therefore, 3.3 %–4.2 %. If we adopt the relative TECP amplitudes of Kundu et al. (2021) and Jonah et al. (2021) of 1.1 %–2.1 %, then a similar relative amplitude value can be expected for foF2 fluctuations, as a major contribution to TEC is the F-region ionosphere. With a background foF2 value of ∼5 MHz, this implies a wave variation with an amplitude of 50–100 kHz in foF2. Given the frequency resolution of typical ionograms, foF2 variations with this magnitude are difficult to detect; this might explain why we could not see any coherent oscillatory signals in the foF2 time series associated with this Beirut explosion event.
In this study, we analyzed the TIDs associated with the explosion that occurred at the Port of Beirut on 4 August 2020. Observation data from DMSP spacecraft and ionosondes in the Mediterranean region were used in the analysis. Quiet solar and geomagnetic conditions on this date generally allowed us to rule out confounding factors from space weather activity. The DMSP F17 spacecraft intercepted ionospheric disturbances, in the form of ion density fluctuations, to the north of Beirut. The ionosondes detected ionospheric disturbances, in the form of anomalous ionogram trace shape (i.e., loop/mouth, Z-twist, and Y-forking), that propagated toward the west-northwest of Beirut. Two types of kinematics analysis based on the times of interception or times of arrival and the distance information yield TID propagation velocity estimates of 492±94 and 649±193 m s−1. These estimates were somewhat lower than the TID velocity estimates reported in two previous studies (Kundu et al., 2021; Jonah et al., 2021) of 750–800 m s−1. It was noted, however, that the TIDs were observed at distances much closer (≤500 km) to Beirut in the two previous studies. Meanwhile, the TIDs analyzed in the present study were detected or intercepted at varying distances of up to ∼ 3000 km from Beirut. The distinction between near-field and far-field properties of the wave disturbances might contribute to this difference. Overall, the present findings (based on DMSP and ionosonde data) show that the TIDs from the Beirut explosion were able to propagate over longer distances to reach the Mediterranean and eastern Europe, beyond the immediate areas of Lebanon and Israel–Palestine that were investigated (using GPS TECP data) in previous studies.
DMSP observation data used in this study are available from the Madrigal Database: http://cedar.openmadrigal.org/ (Rideout, 2024). Ionosonde data used in this study are available from the University of Massachusetts Lowell (UML) Global Ionospheric Radio Observatory (GIRO) Digital Ionogram Database (DIDBase) at https://giro.uml.edu/ (Galkin, 2024) or via the SAO Explorer program. Solar wind parameter, solar flux, and geomagnetic index data are available from NASA OMNIWeb service: https://omniweb.gsfc.nasa.gov (Papitashvili and King, 2020). The solar flare index data are available from NOAA NGDC: https://www.ngdc.noaa.gov/stp/space-weather/solar-data/solar-features/solar-flares/index/ (Kandilli Observatory and Earthquake Research Institute at the Bogazici University, 2024).
The supplement related to this article is available online at: https://doi.org/10.5194/angeo-42-301-2024-supplement.
RP conceptualized the study, analyzed the data, prepared the figures, and finalized the manuscript. PCL retrieved and analyzed the observation data, prepared the first manuscript draft, and proofread the finalized manuscript draft.
The contact author has declared that neither of the authors has any competing interests.
Publisher’s note: Copernicus Publications remains neutral with regard to jurisdictional claims made in the text, published maps, institutional affiliations, or any other geographical representation in this paper. While Copernicus Publications makes every effort to include appropriate place names, the final responsibility lies with the authors.
This research has been supported by the Air Force Office of Scientific Research (grant no. FA9550-20-1-0313).
This paper was edited by Ana G. Elias and reviewed by three anonymous referees.
Belehaki, A., Tsagouri, I., Altadill, D., Blanch, E., Borries, C., Buresova, D., Chum, J., Galkin, I., Juan, J. M., Segarra, A., Camilo Timoté, C., Tziotziou, K., Verhulst, T. G. W., and Watermann, J.: An overview of methodologies for real-time detection, characterisation and tracking of traveling ionospheric disturbances developed in the TechTIDE project, J. Space Weather Space Clim., 10, 42, https://doi.org/10.1051/swsc/2020043, 2020. a
Boyde, B., Wood, A., Dorrian, G., Fallows, R. A., Themens, D., Mielich, J., Elvidge, S., Mevius, M., Zucca, P., Dabrowski, B., Krankowski, A., Vocks, C., and Bisi, M.: Lensing from small-scale travelling ionospheric disturbances observed using LOFAR, J. Space Weather Space Clim., 12, 34, https://doi.org/10.1051/swsc/2022030, 2022. a
Burke, W. J., Gentile, L. C., Huang, C. Y., Valladares, C. E., and Su, S. Y.: Longitudinal variability of equatorial plasma bubbles observed by DMSP and ROCSAT-1, J. Geophys. Res., 109, A12301, https://doi.org/10.1029/2004JA010583, 2004. a
Cervera, M. A. and Harris, T. J.: Modeling ionospheric disturbance features in quasi-vertically incident ionograms using 3-D magnetoionic ray tracing and atmospheric gravity waves, J. Geophys. Res.-Space, 119, 431–440, https://doi.org/10.1002/2013JA019247, 2014. a
Cheng, K. and Huang, Y.-N.: Ionospheric disturbances observed during the period of Mount Pinatubo eruptions in June 1991, J. Geophys. Res., 97, 16995–17004, https://doi.org/10.1029/92JA01462, 1992. a
Chernogor, L. F.: Ionospheric effects of the Chelyabinsk meteoroid, Geomagn. Aeron., 55, 353–368, https://doi.org/10.1134/S0016793215030044, 2015. a
Chou, M.-Y., Lin, C. C. H., Shen, M.-H., Yue, J., Huba, J. D., and Chen, C.-H.: Ionospheric disturbances triggered by SpaceX Falcon Heavy, Geophys. Res. Lett., 45, 6334–6342, https://doi.org/10.1029/2018GL078088, 2018. a
Chou, M.-Y., Cherniak, I., Lin, C. C. H., and Pedatella, N. M.: The persistent ionospheric responses over Japan after the impact of the 2011 Tohoku earthquake, Space Weather, 18, e2019SW002302, https://doi.org/10.1029/2019SW002302, 2020. a
Diaz, J. S.: Explosion analysis from images: Trinity and Beirut, Eur. J. Phys., 42, 035803, https://doi.org/10.1088/1361-6404/abe131, 2021. a
Dodson, H. W. and Hedeman, E. R.: Experimental comprehensive solar flare indices for certain flares, 1970–1974, Report UAG 52, World Data Center A for Solar-Terrestrial Physics, https://repository.library.noaa.gov/view/noaa/1011 (last access: 14 June 2024), 1975. a
Fedorenko, Y. P., Fedorenko, V., and Lysenko, V.: Parameters of the medium-scale traveling ionospheric disturbances model deduced from measurements, Geomag. Aeron., 51, 88–104, https://doi.org/10.1134/S0016793210061015, 2011. a
Fiori, R. A. D., Trichtchenko, L., Balch, C., Spanswick, E., and Groleau, S.: Characterizing auroral-zone absorption based on global Kp and regional geomagnetic hourly range indices, Space Weather, 18, e2020SW002572, https://doi.org/10.1029/2020SW002572, 2020. a
Fitzgerald, T. J. and Carlos, R. C.: Effects of 450-kg surface explosions on HF radio reflection from the E layer, Radio Sci., 32, 169–180, https://doi.org/10.1029/96RS02989, 1997. a
Galkin, I. (Global Ionosphere Radio Observatory, University of Massachusetts Lowell): Digital Ionogram Database [data set], https://giro.uml.edu/, last access: 14 June 2024. a
Galushko, V. G., Kascheev, A. S., Paznukhov, V. V., Yampolski, Y. M., and Reinisch, B. W.: Frequency-and-angular sounding of traveling ionospheric disturbances in the model of three-dimensional electron density waves, Radio Sci., 43, RS4013, https://doi.org/10.1029/2007RS003735, 2008. a
Guglielmi, G.: Why Beirut's ammonium nitrate blast was so devastating, Nature, Springer, https://doi.org/10.1038/d41586-020-02361-x, 2020. a
Habarulema, J. B., Katamzi, Z. T., and McKinnell, L.-A.: Estimating the propagation characteristics of large-scale traveling ionospheric disturbances using ground-based and satellite data, J. Geophys. Res.-Space, 118, 7768–7782, https://doi.org/10.1002/2013JA018997, 2013. a
Heisler, L. H.: Anomalies in Ionosonde Records Due to Travelling Ionospheric Disturbances, Aust. J. Phys., 11, 79–90, https://doi.org/10.1071/PH580079, 1958. a, b
Hines, C. O.: Internal atmospheric gravity waves at ionospheric heights, Can. J. Phys., 38, 1441–1481, 1960. a
Hooke, W. H.: Ionospheric irregularities produced by internal atmospheric gravity waves, J. Atmos. Terr. Phys., 30, 795, https://doi.org/10.1016/S0021-9169(68)80033-9, 1968. a
Huang, X., Reinisch, B. W., Sales, G. S., Paznukhov, V. V., and Galkin, I. A.: Comparing TID simulations using 3-D ray tracing and mirror reflection, Radio Sci., 51, 337–343, https://doi.org/10.1002/2015RS005872, 2016. a
Huang, C. Y., Helmboldt, J. F., Park, J., Pedersen, T. R., and Willemann, R.: Ionospheric Detection of Explosive Events, Rev. Geophys., 57, 78–105, https://doi.org/10.1029/2017RG000594, 2019. a
Hunsucker, R. D.: Atmospheric gravity waves generated in the high-latitude ionosphere: A review, Rev. Geophys., 20, 293–315, https://doi.org/10.1029/RG020i002p00293, 1982. a
Ivanova, V., Kurkin, V., Polekh, N., Chistyakova, L., Brynko, I., Chuyev, V., Dumbrava, Z., and Poddelskii, I.: Studying large-scale traveling ionospheric disturbances according to the data of oblique-incidence sounding, Geomag. Aeron., 51, 1101–1104, https://doi.org/10.1134/S0016793211080196, 2011. a
Jonah, O. F., Coster, A., Zhang, S., Goncharenko, L., Erickson, P. J., de Paula, E. R., and Kherani, E. A.: TID observations and source analysis during the 2017 Memorial Day weekend geomagnetic storm over North America, J. Geophys. Res.-Space, 123, 8749–8765, https://doi.org/10.1029/2018JA025367, 2018. a
Jonah, O. F., Vergados, P., Krishnamoorthy, S., and Komjathy, A.: Investigating ionospheric perturbations following the 2020 Beirut explosion event, Radio Sci., 56, e2021RS007302, https://doi.org/10.1029/2021RS007302, 2021. a, b, c, d, e, f, g, h, i, j, k, l, m, n
Jones, T. B. and Spracklen, C. T.: Ionospheric effects of the Flixborough explosion, Nature, 250, 719–720, https://doi.org/10.1038/250719a0, 1974. a
Kandilli Observatory and Earthquake Research Institute at the Bogazici University: Solar Flare Index, NOAA National Geophysical Data Center (NGDC), https://www.ngdc.noaa.gov/stp/space-weather/solar-data/solar-features/solar-flares/index/ last access: 14 June 2024. a
Klausner, V., Fagundes, P. R., Sahai, Y., Wrasse, C. M., Pillat, V. G., and Becker-Guedes, F.: Observations of GW/TID oscillations in the F2 layer at low latitude during high and low solar activity, geomagnetic quiet and disturbed periods, J. Geophys. Res., 114, A02313, https://doi.org/10.1029/2008JA013448, 2009. a
Kleine, H., Dewey, J., Ohashi, K., Mizukaki, T., and Takayama, K.: Studies of the TNT equivalence of silver azide charges, Shock Waves 13, 123–138, https://doi.org/10.1007/s00193-003-0204-3, 2003. a
Krasnov, V., Drobzheva, Y. V., Venart, J., and Lastovicka, J.: A re-analysis of the atmospheric and ionospheric effects of the Flixborough explosion, J. Atmos. Sol.-Terr. Phy., 65, 1205–1212, https://doi.org/10.1016/j.jastp.2003.07.010, 2003. a
Kundu, B., Senapati, B., Matsushita, A., and Heki, A.: Atmospheric wave energy of the 2020 August 4 explosion in Beirut, Lebanon, from ionospheric disturbances, Sci Rep., 11, 2793, https://doi.org/10.1038/s41598-021-82355-5, 2021. a, b, c, d, e, f, g, h, i, j, k, l, m
Lee, M. C., Pradipta, R., Burke, W. J., Labno, A., Burton, L. M., Cohen, J. A., Dorfman, S. E., Coster, A. J., Sulzer, M. P., and Kuo, S. P.: Did Tsunami-Launched Gravity Waves Trigger Ionospheric Turbulence over Arecibo?, J. Geophys. Res., 113, A01302, https://doi.org/10.1029/2007JA012615, 2008. a
Liu, H., Ding, F., Yue, X., Zhao, B., Song, Q., Wan, W., Ning, B., and Zhang, K.: Depletion and traveling ionospheric disturbances generated by two launches of China's Long March 4B rocket, J. Geophys. Res.-Space, 123, 10319–10330, https://doi.org/10.1029/2018JA026096, 2018. a
Medici, E. F. and Waite, G. P.: Experimental laboratory study on the formation of multiple shock waves observed during volcanic eruptions, Geophys. Res. Lett., 43, 85–92, https://doi.org/10.1002/2015GL066426, 2016. a
Munro, G. H.: Travelling disturbances in the ionosphere, P. R. Soc. Lond. A, 202, 208–223, https://doi.org/10.1098/rspa.1950.0095, 1950. a, b
Munro, G. H.: Reflexions from irregularities in the ionosphere, P. R. Soc. Lond. A, 219, 447–463, https://doi.org/10.1098/rspa.1953.0159, 1953. a, b, c
Nicolls, M. J., Kelley, M. C., Coster, A. J., Gonzalez, S. A., and Makela, J. J.: Imaging the structure of a large-scale TID using ISR and TEC data, Geophys. Res. Lett., 31, L09812, https://doi.org/10.1029/2004GL019797, 2004. a
Nishioka, M., Tsugawa, T., Kubota, M., and Ishii, M.: Concentric waves and short-period oscillations observed in the ionosphere after the 2013 Moore EF5 tornado, Geophys. Res. Lett., 40, 5581–5586, https://doi.org/10.1002/2013GL057963, 2013. a
Papitashvili, N. E. and King, J. H.: OMNI Hourly Data, NASA Space Physics Data Facility [data set], https://doi.org/10.48322/1shr-ht18, 2020. a
Park, J., von Frese, R. R. B., Grejner-Brzezinska, D. A., Morton, Y., and Gaya-Pique, L. R.: Ionospheric detection of the 25 May 2009 North Korean underground nuclear test, Geophys. Res. Lett., 38, L22802, https://doi.org/10.1029/2011GL049430, 2011. a
Perevalova, N. P., Shestakov, N. V., Voeykov, S. V., Takahashi, H., and Guojie, M.: Ionospheric disturbances in the vicinity of the Chelyabinsk meteoroid explosive disruption as inferred from dense GPS observations, Geophys. Res. Lett., 42, 6535–6543, https://doi.org/10.1002/2015GL064792, 2015. a
Pilger C., Gaebler, P., Hupe, P., Kalia, A. C., Schneider, F. M., Steinberg, A., Sudhaus, H., and Ceranna, L.: Yield estimation of the 2020 Beirut explosion using open access waveform and remote sensing data, Sci. Rep., 11, 14144, https://doi.org/10.1038/s41598-021-93690-y, 2021. a, b, c, d
Pradipta, R., Valladares, C. E., and Doherty, P. H.: Ionosonde observations of ionospheric disturbances due to the 15 February 2013 Chelyabinsk meteor explosion, J. Geophys. Res.-Space, 120, 9988–9997, https://doi.org/10.1002/2015JA021767, 2015. a
Pradipta, R., Valladares, C. E., Carter, B. A., and Doherty, P. H.: Interhemispheric propagation and interactions of auroral traveling ionospheric disturbances near the equator, J. Geophys. Res.-Space, 121, 2462–2474, https://doi.org/10.1002/2015JA022043, 2016. a
Pradipta, R., Carter, B. A., Currie, J. L., Choy, S., Wilkinson, P., Maher, P., and Marshall, R.: On the propagation of traveling ionospheric disturbances from the Hunga Tonga-Hunga Ha'apai volcano eruption and their possible connection with tsunami waves, Geophys. Res. Lett., 50, e2022GL101925, https://doi.org/10.1029/2022GL101925, 2023. a
Rideout, W.: CEDAR Madrigal Database [data set], http://cedar.openmadrigal.org/, last access: 14 June 2024. a
Rigby, S. E., Lodge, T. J., Alotaibi, S., Barr, A. D., Clarke, S. D., Langdon, G. S., and Tyas, A.: Preliminary yield estimation of the 2020 Beirut explosion using video footage from social media, Shock Waves 30, 671–675, https://doi.org/10.1007/s00193-020-00970-z, 2020. a
Sigernes, F., Dyrland, M., Brekke, P., Chernouss, S., Lorentzen, D. A., Oksavik, K., and Deehr, C. S.: Two methods to forecast auroral displays, J. Space Weather Space Clim., 1, A03, https://doi.org/10.1051/swsc/2011003, 2011. a
Singhvi, A., Reinhard, S., McCann, A., Leatherby, L., and Migliozzi, B.: Mapping the Damage From the Beirut Explosion, The New York Times, https://www.nytimes.com/interactive/2020/08/04/world/middleeast/beirut-explosion-damage.html (last access: 14 June 2024), 2020. a
Starkov, G. V.: Mathematical model of the auroral boundaries, Geomag. Aeron., 34, 331–336, 1994. a
Takahashi, H., Figueiredo, C. A. O. B., Barros, D., Wrasse, C. M., Giongo, G. A., Honda, R. H., Vital, L. F. R., Resende, L. C. A., Nyassor, P. K., Ayorinde, T. T., Carmo, C. S., Padua, M. B., and Otsuka, Y.: Ionospheric disturbances over South America related to Tonga volcanic eruption, Earth Planets Space, 75, 92, https://doi.org/10.1186/s40623-023-01844-1, 2023. a
Themens, D. R., Watson, C., Zagar, N., Vasylkevych, S., Elvidge, S., McCaffrey, A., Prikryl, P., Reid, B., Wood, A., Jayachandran, P. T.: Global propagation of ionospheric disturbances associated with the 2022 Tonga volcanic eruption, Geophys. Res. Lett., 49, e2022GL098158, https://doi.org/10.1029/2022GL098158, 2022. a
Tsugawa, T., Saito, A., Otsuka, Y., Nishioka, M., Maruyama, T., Kato, H., Nagatsuma, T., and Murata, K. T.: Ionospheric disturbances detected by GPS total electron content observation after the 2011 off the Pacific coast of Tohoku Earthquake, Earth Planet Sp, 63, 66, https://doi.org/10.5047/eps.2011.06.035, 2011. a
Tu, J., Song, P., and Vasyliunas, V. M.: Ionosphere/thermosphere heating determined from dynamic magnetosphere‐ionosphere/thermosphere coupling, J. Geophys. Res., 116, A09311, https://doi.org/10.1029/2011JA016620, 2011. a
World Bank: Beirut Rapid Damage and Needs Assessment (RDNA), World Bank Group, https://www.worldbank.org/en/country/lebanon/publication/beirut-rapid-damage-and-needs-assessment-rdna---august-2020 (last access: 14 June 2024), 2020. a
Yang, Y.-M., Komjathy, A., Langley, R. B., Vergados, P., Butala, M. D., and Mannucci, A. J.: The 2013 Chelyabinsk meteor ionospheric impact studied using GPS measurements, Radio Sci., 49, 341–350, https://doi.org/10.1002/2013RS005344, 2014. a
Yigit, E. and Medvedev, A. S.: Internal wave coupling processes in Earth's atmosphere, Adv. Space Res., 55, 983–1003, https://doi.org/10.1016/j.asr.2014.11.020, 2015. a
Zhang, S.-R., Coster, A. J., Erickson, P. J., Goncharenko, L. P., Rideout, W., and Vierinen, J.: Traveling ionospheric disturbances and ionospheric perturbations associated with solar flares in September 2017, J. Geophys. Res.-Space, 124, 5894–5917, https://doi.org/10.1029/2019JA026585, 2019. a
Zhang, X., Ren, X., Chen, J., Zuo, X., Mei, D., and Liu, W.: Investigating GNSS PPP–RTK with external ionospheric constraints, Satell. Navig., 3, 6, https://doi.org/10.1186/s43020-022-00067-1, 2022. a
Zakharenkova, I., Astafyeva, E., and Cherniak, I.: GPS and GLONASS observations of large-scale traveling ionospheric disturbances during the 2015 St. Patrick's Day storm, J. Geophys. Res.-Space, 121, 12138–12156, https://doi.org/10.1002/2016JA023332, 2016. a