the Creative Commons Attribution 4.0 License.
the Creative Commons Attribution 4.0 License.
 | 04 Jun 2024
Does high-latitude ionospheric electrodynamics exhibit hemispheric mirror symmetry?
Heikki Vanhamäki
Karl Magnus Laundal
Jone Peter Reistad
Johnathan K. Burchill
Levan Lomidze
David J. Knudsen
Michael Madelaire
Habtamu Tesfaw
Ionospheric electrodynamics is a problem of mechanical stress balance mediated by electromagnetic forces. Joule heating (the total rate of frictional heating of thermospheric gases and ionospheric plasma) and ionospheric Hall and Pedersen conductances comprise three of the most basic descriptors of this problem. More than half a century after identification of their central role in ionospheric electrodynamics, several important questions about these quantities, including the degree to which they exhibit hemispheric symmetry under reversal of the sign of dipole tilt and the sign of the y component of the interplanetary magnetic field (so-called “mirror symmetry”), remain unanswered. While global estimates of these key parameters can be obtained by combining existing empirical models, one often encounters some frustrating sources of uncertainty: the measurements from which such models are derived, usually magnetic field and electric field or ion drift measurements, are typically measured separately and do not necessarily align. The models to be combined moreover often use different input parameters, different assumptions about hemispheric symmetry, and/or different coordinate systems. We eliminate these sources of uncertainty in model predictions of electromagnetic work J⋅E (in general not equal to Joule heating ηJ2) and ionospheric conductances by combining two new empirical models of the high-latitude ionospheric electric potential and ionospheric currents that are derived in a mutually consistent fashion: these models do not assume any form of symmetry between the two hemispheres; are based on Apex magnetic coordinates (denoted Apex), spherical harmonics, and the same model input parameters; and are derived exclusively from convection and magnetic field measurements made by the Swarm and CHAMP satellites. The model source code is open source and publicly available. Comparison of high-latitude distributions of electromagnetic work in each hemisphere as functions of dipole tilt and interplanetary magnetic field clock angle indicates that the typical assumption of mirror symmetry is largely justified. Model predictions of ionospheric Hall and Pedersen conductances exhibit a degree of symmetry, but clearly asymmetric responses to dipole tilt and solar wind driving conditions are also identified. The distinction between electromagnetic work and Joule heating allows us to identify where and under what conditions the assumption that the neutral wind corotates with the Earth is not likely to be physically consistent with predicted Hall and Pedersen conductances.
- Article
(15845 KB) - Full-text XML
-
Supplement
(10173 KB) - BibTeX
- EndNote


At high latitudes, the Earth's ionosphere is electrodynamically coupled to the magnetosphere and the solar wind via the Earth's magnetic field, and it is mechanically coupled to the neutral atmosphere via collisions. When the interplanetary magnetic field (IMF) carried by the solar wind points southward, for example, the IMF reconnects with Earth's magnetic field lines on the dayside and drags these reconnected field lines over the Earth's polar cap to the nightside. These field lines reconnect in the magnetotail and circulate back to the dayside.
Because collisions between charged particles are very infrequent in the magnetosphere, magnetospheric plasma is frozen to the Earth's field lines as it undergoes convection. In contrast, the overlapping ionosphere–thermosphere region at lower altitudes is highly collisional. Here, ionospheric plasma is dragged through the neutral thermospheric gas at speeds of several hundred meters to several kilometers per second, resulting in energy dissipation via plasma-neutral friction that can reach nearly a terawatt globally (Billett et al., 2018). This frictional heating, which is often referred to as “Joule dissipation” or “Joule heating”, represents one of the most important processes by which energy is transferred from the solar wind to the ionosphere–thermosphere system.
Heelis and Maute (2020), Sarris (2019), and Richmond (2021) have all recently pointed out aspects of energy transfer from the solar wind via Joule heating that remain poorly understood. One of the most significant of these is ionospheric conductivity, which is central to understanding magnetosphere–ionosphere coupling and is a required input for many empirical and numerical models but is, as Weimer and Edwards (2021) have stated, arguably one of the least measured and estimated parameters. More generally, there are overall far fewer estimates of quantities that are central in describing magnetosphere–ionosphere–thermosphere (MIT) coupling in the Southern Hemisphere (SH) relative to the Northern Hemisphere (NH). One is therefore often left to assume that a quantity measured in the SH is the same as the quantity measured in the NH at a magnetically conjugate point when the signs of the y component of the IMF (By) and the tilt angle of the Earth's dipole( Ψ) are flipped. This assumption of hemispheric symmetry is typically formulated as
where Q is a quantity such as Joule heating at conjugate points in the two hemispheres, and the choice of sign depends on which quantity is being considered.
This assumption has played a major role in global empirical models of high-latitude ionospheric convection: since the 1980s, at least 15 such empirical models have been created (see, for example, review in Cousins and Shepherd, 2010), and the major datasets from which these models are derived lack comprehensive observations in one (typically the Southern Hemisphere) or both hemispheres. Hence many of these models assume some form of hemispheric symmetry of necessity, even though differences in ionospheric convection and current patterns exist between the two hemispheres (Cousins and Shepherd, 2010; Förster and Haaland, 2015; Hatch et al., 2022).
One problem with the assumption of hemispheric symmetry is that it obscures other sources of uncertainty. For example, Weimer and Edwards (2021) used three separate empirical models that all make different assumptions about hemispheric symmetry to estimate critical ionospheric parameters such as Pedersen conductance ΣP, Hall conductance ΣH, Joule heating, and perturbation Poynting flux Sp. They report that the resulting estimates of ΣP and ΣH are in some places unphysical (too high or negative). While they were not able to determine the source of these unphysical estimates, possible sources of error include the assumption of hemispheric symmetry and the combination of different empirical models that are not necessarily derived in a mutually consistent fashion. By “mutually consistent derivation” we mean that the coordinate systems, model parameters, and physical assumptions are, as much as possible, the same in the derivation of each model.
One of the purposes of this study is to derive an appropriate set of empirical models for high-latitude ionospheric electrodynamics that treats the two hemispheres independently but equally and that are derived in a mutually consistent fashion. The primary challenge for such a set of models is a comprehensive set of observations in both hemispheres. The magnetic field measurements and recently released multi-year ion drift measurements made by the Swarm satellites in each hemisphere are appropriate for meeting this challenge. In this study we use these measurements to derive the first such set of mutually consistently derived empirical models.
In Sect. 2 we describe our approach and define the quantities that we aim to estimate. In Sect. 3 we outline the derivation of an empirical model, hereafter referred to as the Swarm High-latitude Convection (Swarm Hi-C) model, of the high-latitude electric potential Φ, the convection electric field , and the plasma convection
A central goal in creation of the Swarm Hi-C model is consistency with the Average Magnetic field and Polar current System (AMPS) model presented by Laundal et al. (2018). We also describe the Swarm measurements and other datasets that are used. In Sect. 4 we compare Swarm Hi-C model ionospheric electric potentials in the Northern Hemisphere and Southern Hemisphere for different IMF clock angles and dipole tilts, and we compare Swarm Hi-C cross-polar cap potential (CPCP) values with CPCP values reported in previous convection studies. In Sect. 5 we combine outputs from the Swarm Hi-C model and the AMPS model (i.e., the Swarm Ionospheric Polar Electrodynamics, or Swipe, model; see Hatch, 2023) to estimate height-integrated electromagnetic work and Hall and Pedersen conductances ΣH and ΣP at high latitudes. In Sect. 6 we discuss our findings. We then summarize and conclude.
The goal of this study is to empirically estimate and make interhemispheric comparisons of three quantities that are central to describing MIT coupling: height-integrated electromagnetic work W (which is not necessarily the same as the height-integrated Joule heating rate WJ as we describe below) and height-integrated Hall and Pedersen conductivities (Hall and Pedersen conductances) ΣH and ΣP.
Our starting point for deriving these quantities is the perpendicular component of the height-resolved ionospheric Ohm's law in steady state (that is, assuming steady-state stress balance between Lorentz and collisional drag forces and neglecting all other forces in the ion momentum equation; see Sect. 3.2.1 in Vasyliunas, 2012):
with σP and σH being Pedersen and Hall conductivities, E⟂ and B0 the ionospheric electric field and background geomagnetic field, and vn the neutral wind. The corresponding local Joule heating rate is
The definition of Joule heating is in some studies omitted or imprecise (see discussions in Vasyliunas and Song, 2005; Strangeway, 2012; Mannucci et al., 2022), and one occasionally encounters statements in the literature about “the neutral wind contribution to Joule heating” or “the effect of neutral winds on Joule heating”. This language arises from the typically used expressions for height-resolved and height-integrated Joule heating, Eqs. (4) and (8), from which one may get the incorrect impression that the Joule heating rate is divided into separate contributions from the electric field and the neutral winds and magnetic field, respectively (electromagnetic work) and . The latter is sometimes referred to as the “neutral wind dynamo term”. While it is true that Joule heating in Eq. (4) may be mathematically expressed as the sum of these terms,
one must nonetheless be aware that these two terms are frame dependent and in general can be negative or positive (see discussion in, for example, Matsuo and Richmond, 2008; Richmond, 2010; Cai et al., 2013). In contrast the left-hand side (Joule heating) represents the sum total of the heating rates of all neutral and plasma populations (Strangeway, 2012), and it is therefore necessarily non-negative and frame-invariant under Galilean relativity (specifically “magnetic” Galilean relativity; see Mannucci et al., 2022). That this is true is seen in the expression given for Joule heating by Mannucci et al. (2022), their Eq. (26):
where vi and ve are respectively the ion and electron drift velocities, νin and νen are the ion- and electron-neutral collision frequencies for momentum exchange, and η is a resistivity. This expression for Joule heating is equivalent to Eq. (4) but has the advantage of underscoring that (i) Joule heating is frame-invariant and non-negative, and (ii) it makes little sense to speak of a “neutral wind contribution” to Joule heating, since the definition of Joule heating is intrinsically tied to the reference frame of the neutrals.
Proceeding with the derivation, under the assumptions that
-
magnetic field lines are approximately radial, such that ;
-
the electric field E⟂ is independent of altitude over ionospheric E- and F-region altitudes (∼ 100–250 km);
-
the neutral wind is constant over ionospheric E- and F-region altitudes in Earth's rotating frame of reference;
integration of Eqs. (3) and (4) over altitude yields
The first assumption is a decent approximation at high latitudes in both hemispheres, though less so in the Southern Hemisphere where the geomagnetic field inclination and field strength vary more strongly with latitude and longitude (see Fig. 2 in Laundal et al., 2017). The second assumption is likewise a decent approximation at altitudes over which the electron mobility exceeds 1, generally true above the D region. The third assumption is in general not justified because of the near-permanent presence of vertical shears in neutral wind altitude profiles (Larsen, 2002), but it is made here of necessity because otherwise a distinction between the average neutral wind weighted by Hall and Pedersen conductivity altitude profiles must be retained and addressed. While outside the scope of this study, investigating this topic is a future priority.
Taking the dot product and cross product of the height-integrated Ohm's law (Eq. 7) with E⟂, one finds (Amm, 2001)
where the upper and lower signs of the right-hand side in the expression for ΣH are respectively for the Northern Hemisphere and Southern Hemisphere.
Lacking an appropriate model of the neutral wind, we must assume that the contribution of the term vn×B0 in Eqs. (9)–(10) is small compared to that of E⟂ to estimate these conductances. We therefore estimate height-integrated electromagnetic work and ionospheric conductances via the expressions
We do not refer to the height-integrated electromagnetic work W in Eq. (11) as an estimate of the height-integrated Joule heating WJ since W can be negative, whereas Joule heating as defined above is always positive. This distinction is not trivial, as it represents information that enables us to assess where our estimates of the Hall and Pedersen conductance may be valid, as we show in Sect. 5.2 and 5.3.
Throughout this study, the height-integrated perpendicular currents (where ΔB is the perturbation magnetic field) and the convection electric field are respectively calculated from the AMPS model (Appendix B in Laundal et al., 2018) and the Swarm High-latitude Convection, or Swarm Hi-C, model (Sect. 3). Thus, estimates of these two quantities, and consequently also height-integrated electromagnetic work , do not rely on Ohm's law and are unaffected by the third assumption listed above (i.e., neutral wind vn does not vary with altitude).
One could also use the models we present to estimate the perturbation Poynting flux:
We plan to address this in a possible future study but observe for completeness that the Poynting flux and height-integrated Joule heating are sometimes used almost interchangeably (e.g., Rastätter et al., 2016; Weimer, 2005, and references therein). That these quantities do not always correspond in a point-by-point fashion has been shown using both synthetic data (Vanhamäki et al., 2012) and at least one set of empirical models (Weimer and Edwards, 2021). Richmond (2010) has pointed out the precise conditions under which the Poynting flux “may be used to estimate the field-line-integrated electromagnetic energy dissipation” (roughly height-integrated Joule heating W). The neutral wind vn notably does not appear in Eq. (14), as the Poynting flux is frame dependent and arises in connection with the well-known energy conservation (Poynting) theorem.
The input data for the Swarm Hi-C model are Swarm TII (Thermal Ion Imager) measurements of the cross-track ion drift velocity . The unit vector points along the y component of the coordinate system defined by the satellite track: is in the direction of the satellite velocity, and , where is the unit vector pointing radially outward in geocentric coordinates. In the most recent release (version 0302) of the Swarm TII 2 Hz cross-track flow dataset, this is the quantity “Viy”. We use available data from 1 May 2014 (i.e., after the Swarm commissioning period) to 15 April 2023. We additionally apply the following constraints.
-
We only use measurements of vi,y that are flagged as calibrated, as indicated by the second bit of the quantity “Quality_flags” being set to 1 in v0302 of the TII cross-track flow dataset; see Burchill and Knudsen (2022) or Sect. 3.4.1.1 in “EFI TII Cross-Track Flow Data Release Notes” (Burchill and Knudsen, 2020). (Lomidze et al., 2021, showed that statistical maps of high-latitude ion convection derived from v0302 of Swarm TII cross-track data are consistent with corresponding estimates from the Weimer, 2005, model.)
-
We exclude measurements made equatorward of quasi-dipole latitudes ±44°, as this is the low-latitude boundary used for calibration (see Sect. 3.2).
-
For each individual 2 Hz TII NASA CDF (Common Data Format) file, we retain every 10th measurement such that the effective measurement cadence is 5 s or approximately every 40 km. This choice is made because we find that increasing the effective measurement cadence (i.e., including more measurements) does not visibly affect the shape of the potential patterns presented in Sect. 4.1.
Each vi,y measurement is associated with 1 min OMNI data that are time shifted to the bow shock and averaged over the preceding 20 min. We have chosen this averaging window for the reasons given by Laundal et al. (2018): (i) the high-latitude pattern of currents and energy input take tens of minutes to adapt to a recent change in driving conditions at the magnetopause (Snekvik et al., 2017; Billett et al., 2022; Pedersen et al., 2023), (ii) small-scale spatial variations and turbulence within the solar wind may render the instantaneously measured solar wind conditions an inappropriate indicator of the larger-scale solar wind conditions, and (iii) the time shift from the solar wind monitor to the magnetopause is not perfect. This choice has the additional advantage of being consistent with the treatment of solar wind and IMF measurements in the derivation of the AMPS model.
Figure 1 shows the distributions of solar wind and IMF conditions (top row); F10.7 and dipole tilt (middle row); and Swarm satellite magnetic latitude (MLat), magnetic local time (MLT), and altitude (bottom row). Unless otherwise specified, throughout this study magnetic coordinates are given in Modified Apex coordinates at a reference altitude hR=110 km (hereafter denoted MA-110 coordinates), since in this coordinate system the magnetic latitude is constant along a given field line such that convection velocity and electric field may be mapped along field lines. In the top four panels, the black lines indicate the weighted distribution using the Huber weights of the last model iteration (see Sect. 3.4 for more information about Huber weights). As stated by Laundal et al. (2018), “If the model representation was flawed for more extreme conditions, the Huber weighted distributions would be expected to more strongly peak at the most frequent conditions and go to zero at the ends where the data fit would be poor.” That this is not the case indicates that the Swarm Hi-C model generally gives a good average representation of the ionospheric convection.
Regarding the distribution of measurements, although MLT coverage is fairly uniform (bottom left panel in Fig. 1), the Swarm satellite orbits are biased in their coverage of MA-110 magnetic longitudes (not shown; see Fig. 11 in Hatch et al., 2022). The regions of highest measurement density (> 1.5 measurements km−2) in the NH are located between approximately 135 and 225° magnetic longitude (MLon) and in the SH between 0 and 45° MLon. This sampling issue is not likely to bias the model in the Northern Hemisphere since the field inclination is generally very high in the NH polar region, but it could be an issue for the SH measurements where the field inclination varies relatively much more with magnetic longitude and latitude. On the other hand, to the extent that this bias is directly and only related to local distortions of the geomagnetic field geometry, it is accounted for by our use of Apex coordinates.
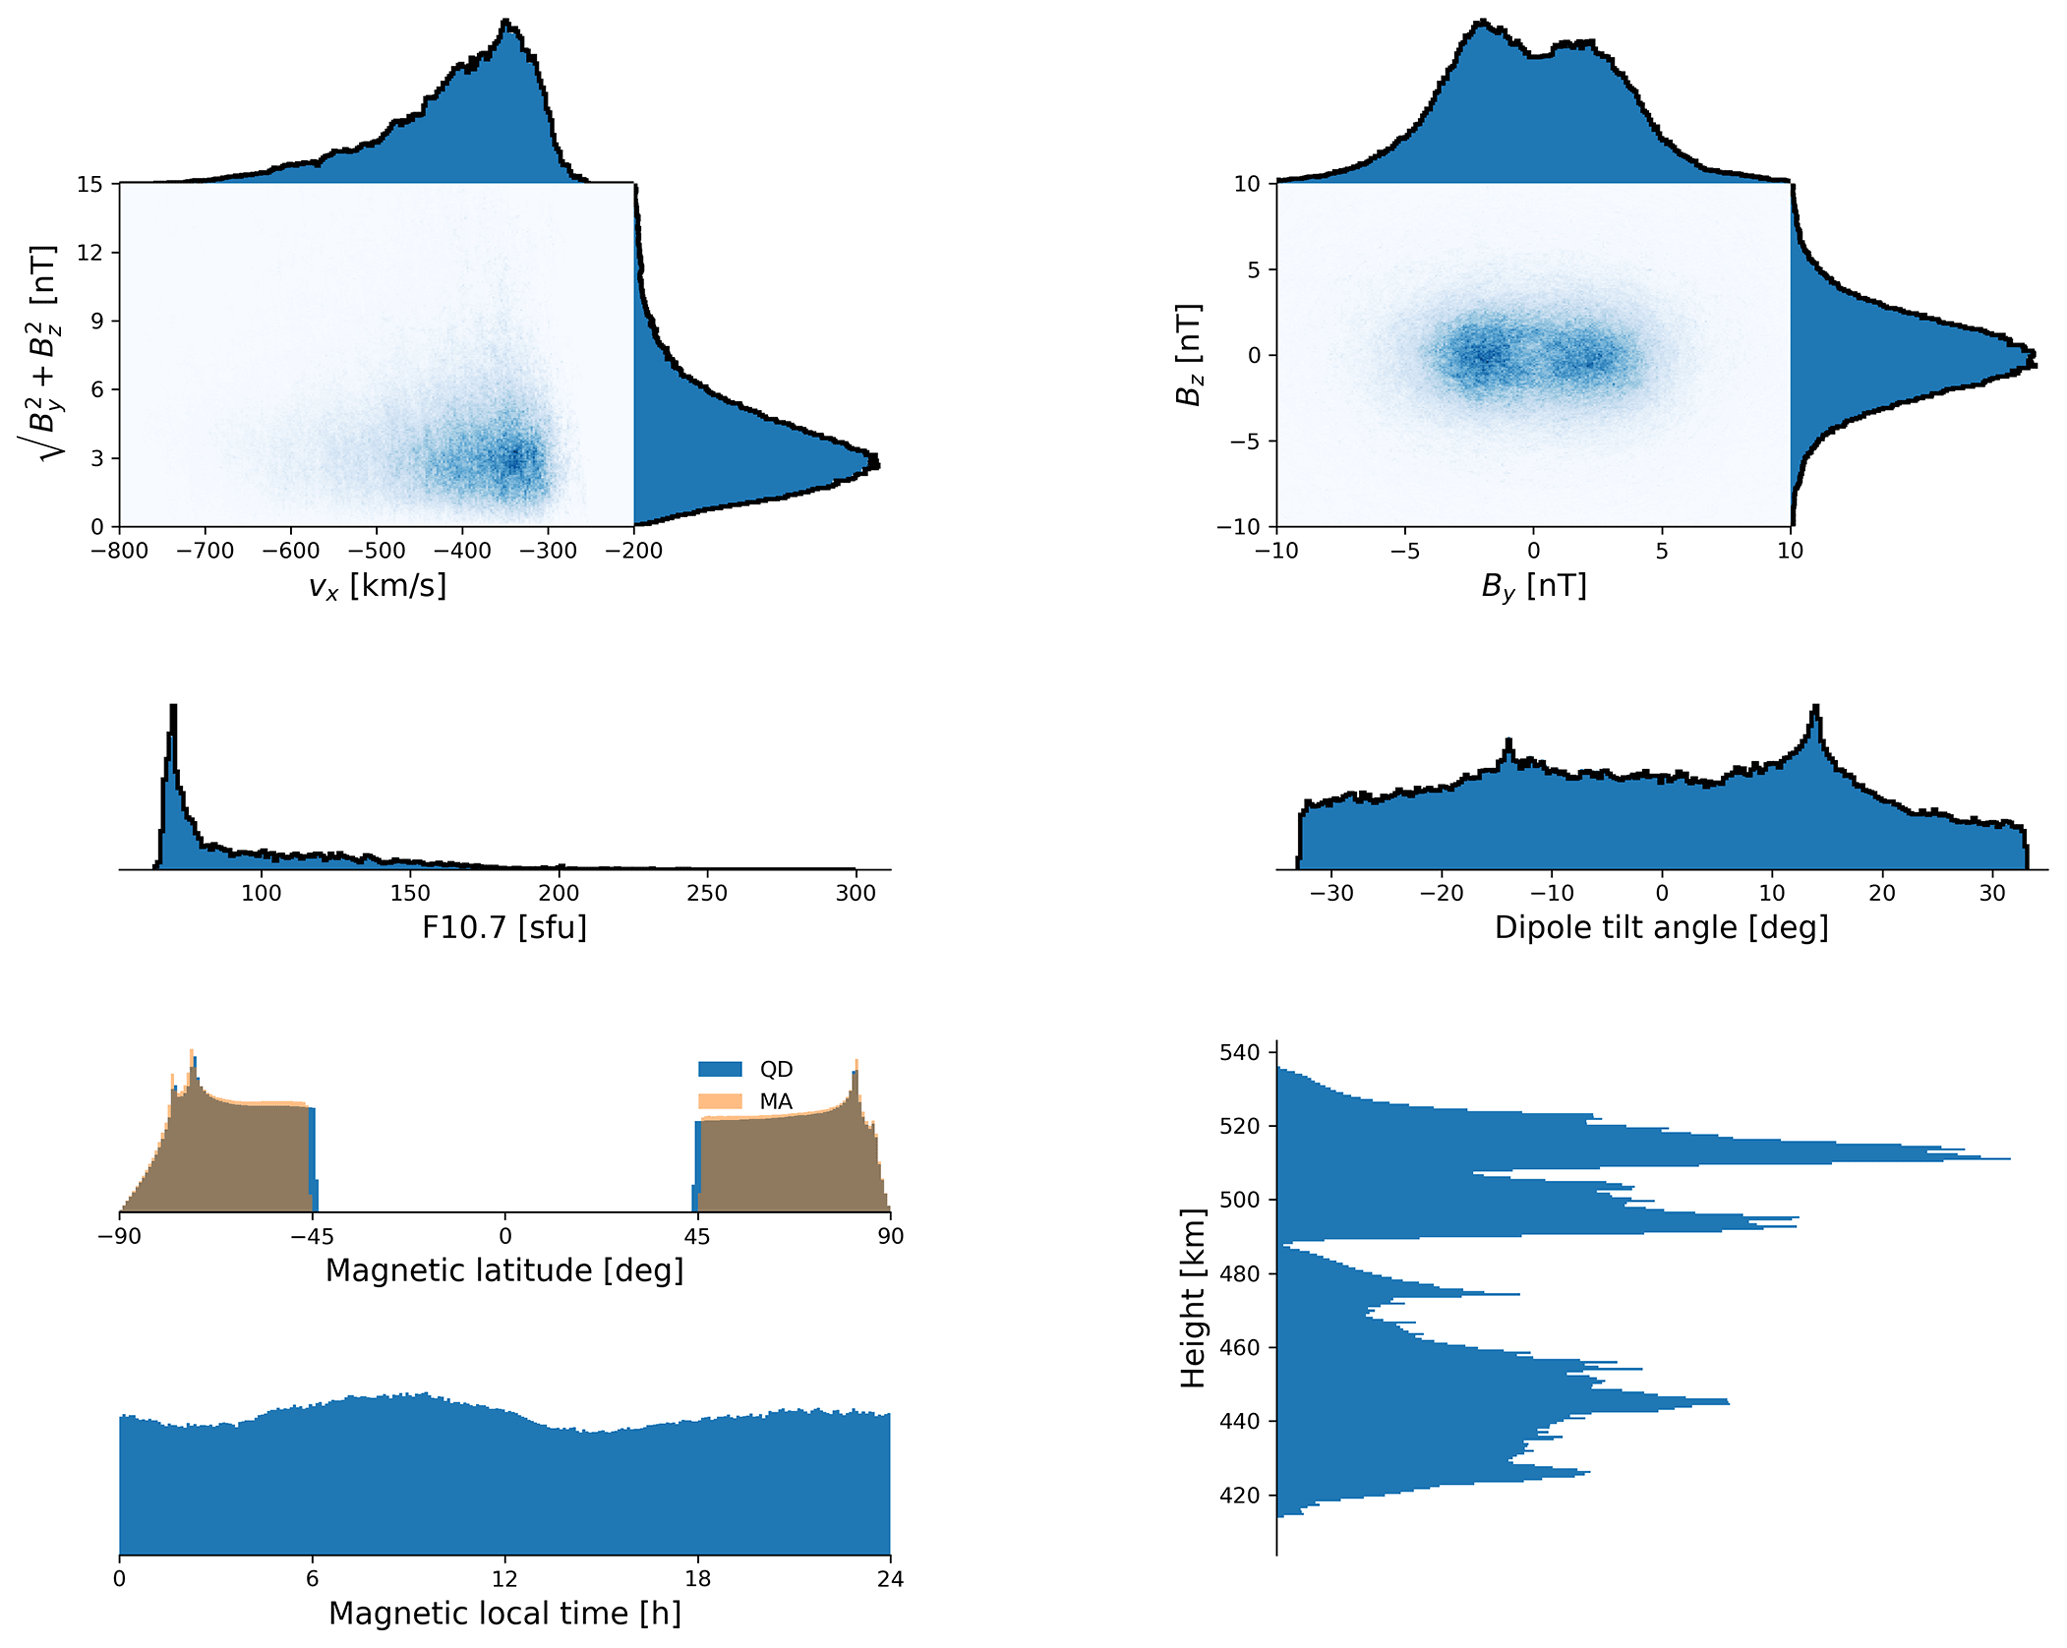
Figure 1Data distribution for ∼ 19 million Swarm TII cross-track convection velocity measurements in the same format as Fig. 1 in Laundal et al. (2018). The black lines indicate the weighted distribution using the Huber weights of the last model iteration.
Using MA-110 coordinates the electric field may be written as
where d1 and d2 are non-orthogonal basis vectors that point, respectively, more or less in the magnetic eastward and equatorward directions. Then (Eqs. 4.8–4.9 in Richmond, 1995),
where Φ is the electric potential; the radius is RE+hR, with RE=6371.2 km being the radius of Earth; ϕ is the magnetic local time (MLT) in degrees (e.g., 1 h MLT = 15°); and λ is MA-110 latitude. The quantity , with Im being the field inclination, and , with hA being the apex altitude of the field line in question.
Similar to E⟂, the convection velocity
with
and e1 and e2 being non-orthogonal vectors that respectively approximately point in the magnetic eastward and equatorward directions. Laundal et al. (2018) used CHAOS-6 to get B0, whereas we use the value of the magnetic field provided in the Swarm TII cross-track flow dataset, which is the magnetic field measured by Swarm at 1 Hz upsampled by interpolation to 2 Hz.
We observe that the coefficients , , , and in Eqs. (16) and (18) are explicitly constant along field lines, regardless of the degree to which the field lines themselves depart from dipolarity. We also observe that, poleward of ± 60° MA-110 latitude, the angles between the non-orthogonal basis vectors d1 and d2 do not deviate from orthogonality by more than 15° in either hemisphere. The same is true for the basis vectors e1 and e2. Additional properties of Apex basis vectors and representations of the electric field and convection in terms of them are discussed by Richmond (1995), Emmert et al. (2010), and Laundal and Richmond (2017).
We wish to use Eq. (17) together with Swarm EFI ion drift measurements to model ionospheric convection at 110 km altitude, which is the reference height of MA-110 coordinates. When only one component of vE is measured along a unit vector , we have from Eq. (17) (Eq. 8.2 in Richmond, 1995)
Care must be taken in relating this expression to Swarm EFI measurements since the ion drift measured along the EFI instrument's y axis, , can and often does include a (typically small) component along B0, whereas the convection velocity vE in Eq. (17) has no component along B0. (The magnitude of is 0.07 or less for 50 % of all measurements and is 0.26 or less for 90 % of all measurements.) To address this we define a new unit vector that does not have a component along (the unit vector pointing in the direction of B0):
We may then make the identification .
As explained in Sect. 8 of Richmond (1995), the mapping of measured convection velocities (or equivalently electric fields by virtue of Eq. 17) from the measurement altitude to the reference altitude hR=110 km is handled by the definitions of the MA-110 basis vectors d1, d2, e1, and e2. In summary our representation of the ionospheric potential Φ defined in Sect. 3.1 is constant along magnetic field lines, as are its partial derivatives in Eq. (16), along with the coefficients and in Eq. (16) and and in Eq. (18). Consequently all dependence on altitude is contained in the definition of the MA-110 basis vectors, and information about the mapping from the Swarm altitude of measurement to hR is represented by the dot products and in Eq. (19).
3.1 Definition of potential Φ and model coefficients
Assuming the ionospheric electric potential Φ does not vary along magnetic field lines (i.e., field lines are equipotential points), we may represent Φ via Eq. (A3) in Laundal et al. (2018):
where represents the Schmidt semi-normalized associated Legendre functions, and μ=sin λ. We use MKS (meter–kilogram–second) units such that the coefficients and are given in V m−1. Expressing Φ in this way assumes that the (non-orthogonal) MA-110 coordinate system is spherical. While we cannot rigorously justify this assumption, we point the interested reader to the numerical test performed by Laundal et al. (2016) in which they calculate the total energy content of spherical harmonic fits to a synthetic magnetic potential represented in both geocentric spherical coordinates and (assumed orthogonal) Apex coordinates, and they find that the total energy content differs by less than 0.1 % between the two representations.
We wish to derive the Swarm Hi-C model in as consistent a manner as possible with the derivation of the AMPS model. We follow Laundal et al. (2018) in expanding each spherical harmonic coefficient, for example , as a function of 19 external parameters:
Here Ψ is the dipole tilt angle, is the IMF clock angle, and
is the Newell et al. (2007) coupling function, with the x component of the GSM (geocentric solar magnetospheric) solar wind speed in km s−1 and IMF components (in GSM coord.) in nT. The quantity
is defined by analogy with Eq. (23), and it maximizes for strictly northward IMF. In contrast to, for example, the ionospheric potential models of Weimer (2005) and Zhu et al. (2021), we have not implemented any saturation of the effect of ϵ or τ for extreme events.
3.2 Constraining the potential Φ at ± 47° MA-110 latitude
Swarm TII ion drift measurements are calibrated by setting the average drift between quasi-dipole (QD) latitudes of 44 and 50° in the Northern Hemisphere (−44 and −50° in the Southern Hemisphere) to zero (Burchill and Knudsen, 2022). Calibrated measurements of vi,y over these latitudes therefore generally have magnitudes of a few tens of m s−1, and we find that these calibrated measurements are effective in constraining the east–west () component of model convection velocities at these latitudes. The model convection in the north–south direction is, in contrast, essentially unconstrained by measurements. We therefore analytically impose the constraint on the model. This constraint forces the approximately east–west electric field component (and therefore the approximately north–south convection velocity component ) at ±47° MA latitude to be zero, and it modifies the spherical harmonic expansion given by Eq. (21).
Our procedure for imposing this constraint may be summarized as follows. We begin by writing the contribution to the total potential Φ from a particular spherical harmonic order m:
where , and .
Using Eq. (A6) from Appendix A, the second line of Eq. (25) may be written
where the matrix Am enforces the constraints by specifying the two lowest-degree model coefficients for a particular model order m in terms of the remaining order-m model coefficients of higher degree, represented by and . The potential from Eq. (21) can then be expressed as
To be consistent with the derivation of the AMPS model, we also use a maximum spherical harmonic degree N=65 and order M=3, corresponding to a total of 8531 model coefficients or spherical harmonic coefficients. These constraints reduce the number of independent spherical harmonic coefficients by 14 from 449 to 435: a total of eight coefficients (two for each model order m=0–3), and six coefficients (two for each model order m=1–3).
3.3 Matrix equation
Equation (27) can be related to Eq. (19) using the partial derivatives of Φ:
where .
Inserting Eq. (16) into Eq. (19) with partial derivatives of Φ in the former given by Eq. (28), finally yields
with , , and
Equation (29) is linear in the model coefficients and , which means that given a sufficient number of measurements of we may solve a matrix equation of the form
for the model coefficients, with d and Xk respectively the left- and right-hand sides of Eq. (29) stacked vertically for multiple measurements.
3.4 Cost function and inversion procedure
Lowes (1966) (but see also Sect. 5 in Sabaka et al., 2010) shows that for a potential of the form
the average energy contained in the field at r=RE is
We use this result to define a cost function that minimizes both the model-measurement error and total energy of the electric field:
which we then minimize with respect to k to obtain an initial estimate of the model coefficients:
The model regularization matrix L is zero everywhere except for the diagonal elements κ(n+1), which correspond to and . This matrix represents a constraint on the total energy contained in the model field, such that (i) the model field energy is the minimum required to fit the Swarm electric field measurements, and (ii) the higher the order n of the model coefficient, the more regularization is applied. The value of κ is chosen to be the smallest value for which XTX+L is invertible, starting with κ=102 followed by increments of powers of . Equation (36) is identical in form to Laundal et al. (2018) Eq. (A8), although the elements of L here differ from those given by Laundal et al. (2018).
Regarding the need for regularization, given that the number of measurements (tens of millions) far exceeds the number of model coefficients (thousands), Eq. (32) is highly overdetermined. We nevertheless find that the inverse problem is ill-conditioned in practice, in that convergence is not achieved without some regularization being applied.
After obtaining an initial estimate of the model coefficients, we iteratively reweight the measurements using Huber weights. Quoting from Laundal et al. (2018), “In each step, each equation is reweighted according to how well the corresponding data point fits the model prediction from the previous iteration. The purpose of this procedure …. is to reduce the effect of outliers and to enable the final solution to better represent typical values rather than simple mean values”.
As previously mentioned, we truncate the spherical harmonics expansion at maximum degree N=65 and maximum order M=3. The truncation of N affects the resolution of the model by constraining the wavelength of the spherical harmonic surface waves. The fact that M is much less than N indicates that the longitudinal resolution of the model is much lower than the latitudinal resolution. This choice reflects both a desire to avoid overfitting and the common understanding that large-scale high-latitude ionospheric currents tend to align along magnetic east/west. Similar choices were made by Laundal et al. (2018) and Friis-Christensen et al. (1985) and has an effect similar to regularization of east/west gradients (Madelaire et al., 2023). After ∼ 20 iterations, the model vector magnitude changes by less than 3.9 % relative to the magnitude of the initial estimate . Given that Laundal et al. (2018) used a threshold of 1 % to terminate their iterative estimation of AMPS model coefficients, this percentage may seem high, but the design of our model is such that the lowest-degree model coefficients, which typically have the largest magnitudes by virtue of the regularization of 〈E2〉 in Eq. (34), are precisely the coefficients that are eliminated by the constraint matrices Am in Eqs. (29) and (32). These coefficients are not included in the calculation of during each iteration, because they depend on the values of all other coefficients (cf. Eqs. A3 and A5) and on the model input parameters listed in Eq. (22). In practice, the model predictions for model coefficients produced after reaching a relative change of ∼ 4 % (i.e., after iteration 20) are very similar; for example, the cross-polar cap potential values discussed in Sect. 4 and shown in each panel of Figs. 2–4 typically vary by less than 0.01 kV.
We also derived a model with maximum degree and order of respectively N=60 and M=5, which had 11 742 model coefficients as opposed to 8531 model coefficients for the N=65 and M=3 model. The overall reduction in average misfit with this expanded model was less than 0.1 %.
Concerning the analytic constraint, we have chosen to represent the lowest-degree model coefficients n′ and for a particular order as a sum of the remaining higher-degree model coefficients (see Eqs. A3 and A5). This is done because the constraint Eq. (34) placed on the E-field power is such that power in higher-degree coefficients is more constrained than power in coefficients of lower degree. (For example, the amount of regularization applied to N=65 terms is times more than the regularization applied to N=3 terms.) The higher-degree coefficients therefore tend to be smaller in magnitude than the lower-degree coefficients, unless the measurements dictate otherwise.
On this basis we hypothesized that if we had instead represented the highest-degree coefficients and n=N for a particular order as sums of the remaining lower-degree coefficients using expressions analogous to Eqs. (A3) and (A5), the magnitude of the resulting model coefficients for degrees and n=N would have been too large and would introduce would high-amplitude meridional oscillations into the potential maps presented in Sect. 4. We derived an according alternative set of model coefficients and used them to produce potential maps similar to those shown in Figs. 2–4. We confirmed that the electric potential patterns were contaminated by high-amplitude meridional oscillations that corresponded to the spherical harmonics of degree and n=N.
Here we compare Northern Hemisphere and Southern Hemisphere potentials for different IMF clock angles and dipole tilts, and we compare Swarm Hi-C cross-polar cap potential (CPCP) values with CPCP values reported previously.
4.1 Comparison of ionospheric potentials in each hemisphere
Figure 2 shows the ionospheric potentials in the NH (colored contours) over 50–90° MLat for a transverse IMF component nT and a solar wind speed vSW=450 km s−1 during local winter (). To facilitate assessment of how well the assumption of mirror symmetry (Eq. 1) holds, the ionospheric potentials in the SH are also shown (black contour lines) with the signs of By and Ψ reversed. We have chosen these solar wind and IMF conditions to approximately match those chosen in the other studies whose reported cross-polar cap potential (CPCP) values we compare with in Sect. 4.2 (see Table 1).
The assumption of mirror symmetry generally holds well for potential patterns in the two hemispheres during local winter, but there are also relatively large deviations. These are most apparent in the panels for which the ratio of CPCP values in each hemisphere depart from 1 by more than a few percent – e.g., for θc=0° (Bz=5 nT, By=0) and θc=135° ( nT). For the eight panels shown, the average CPCP value for both the NH and SH is 51 kV.
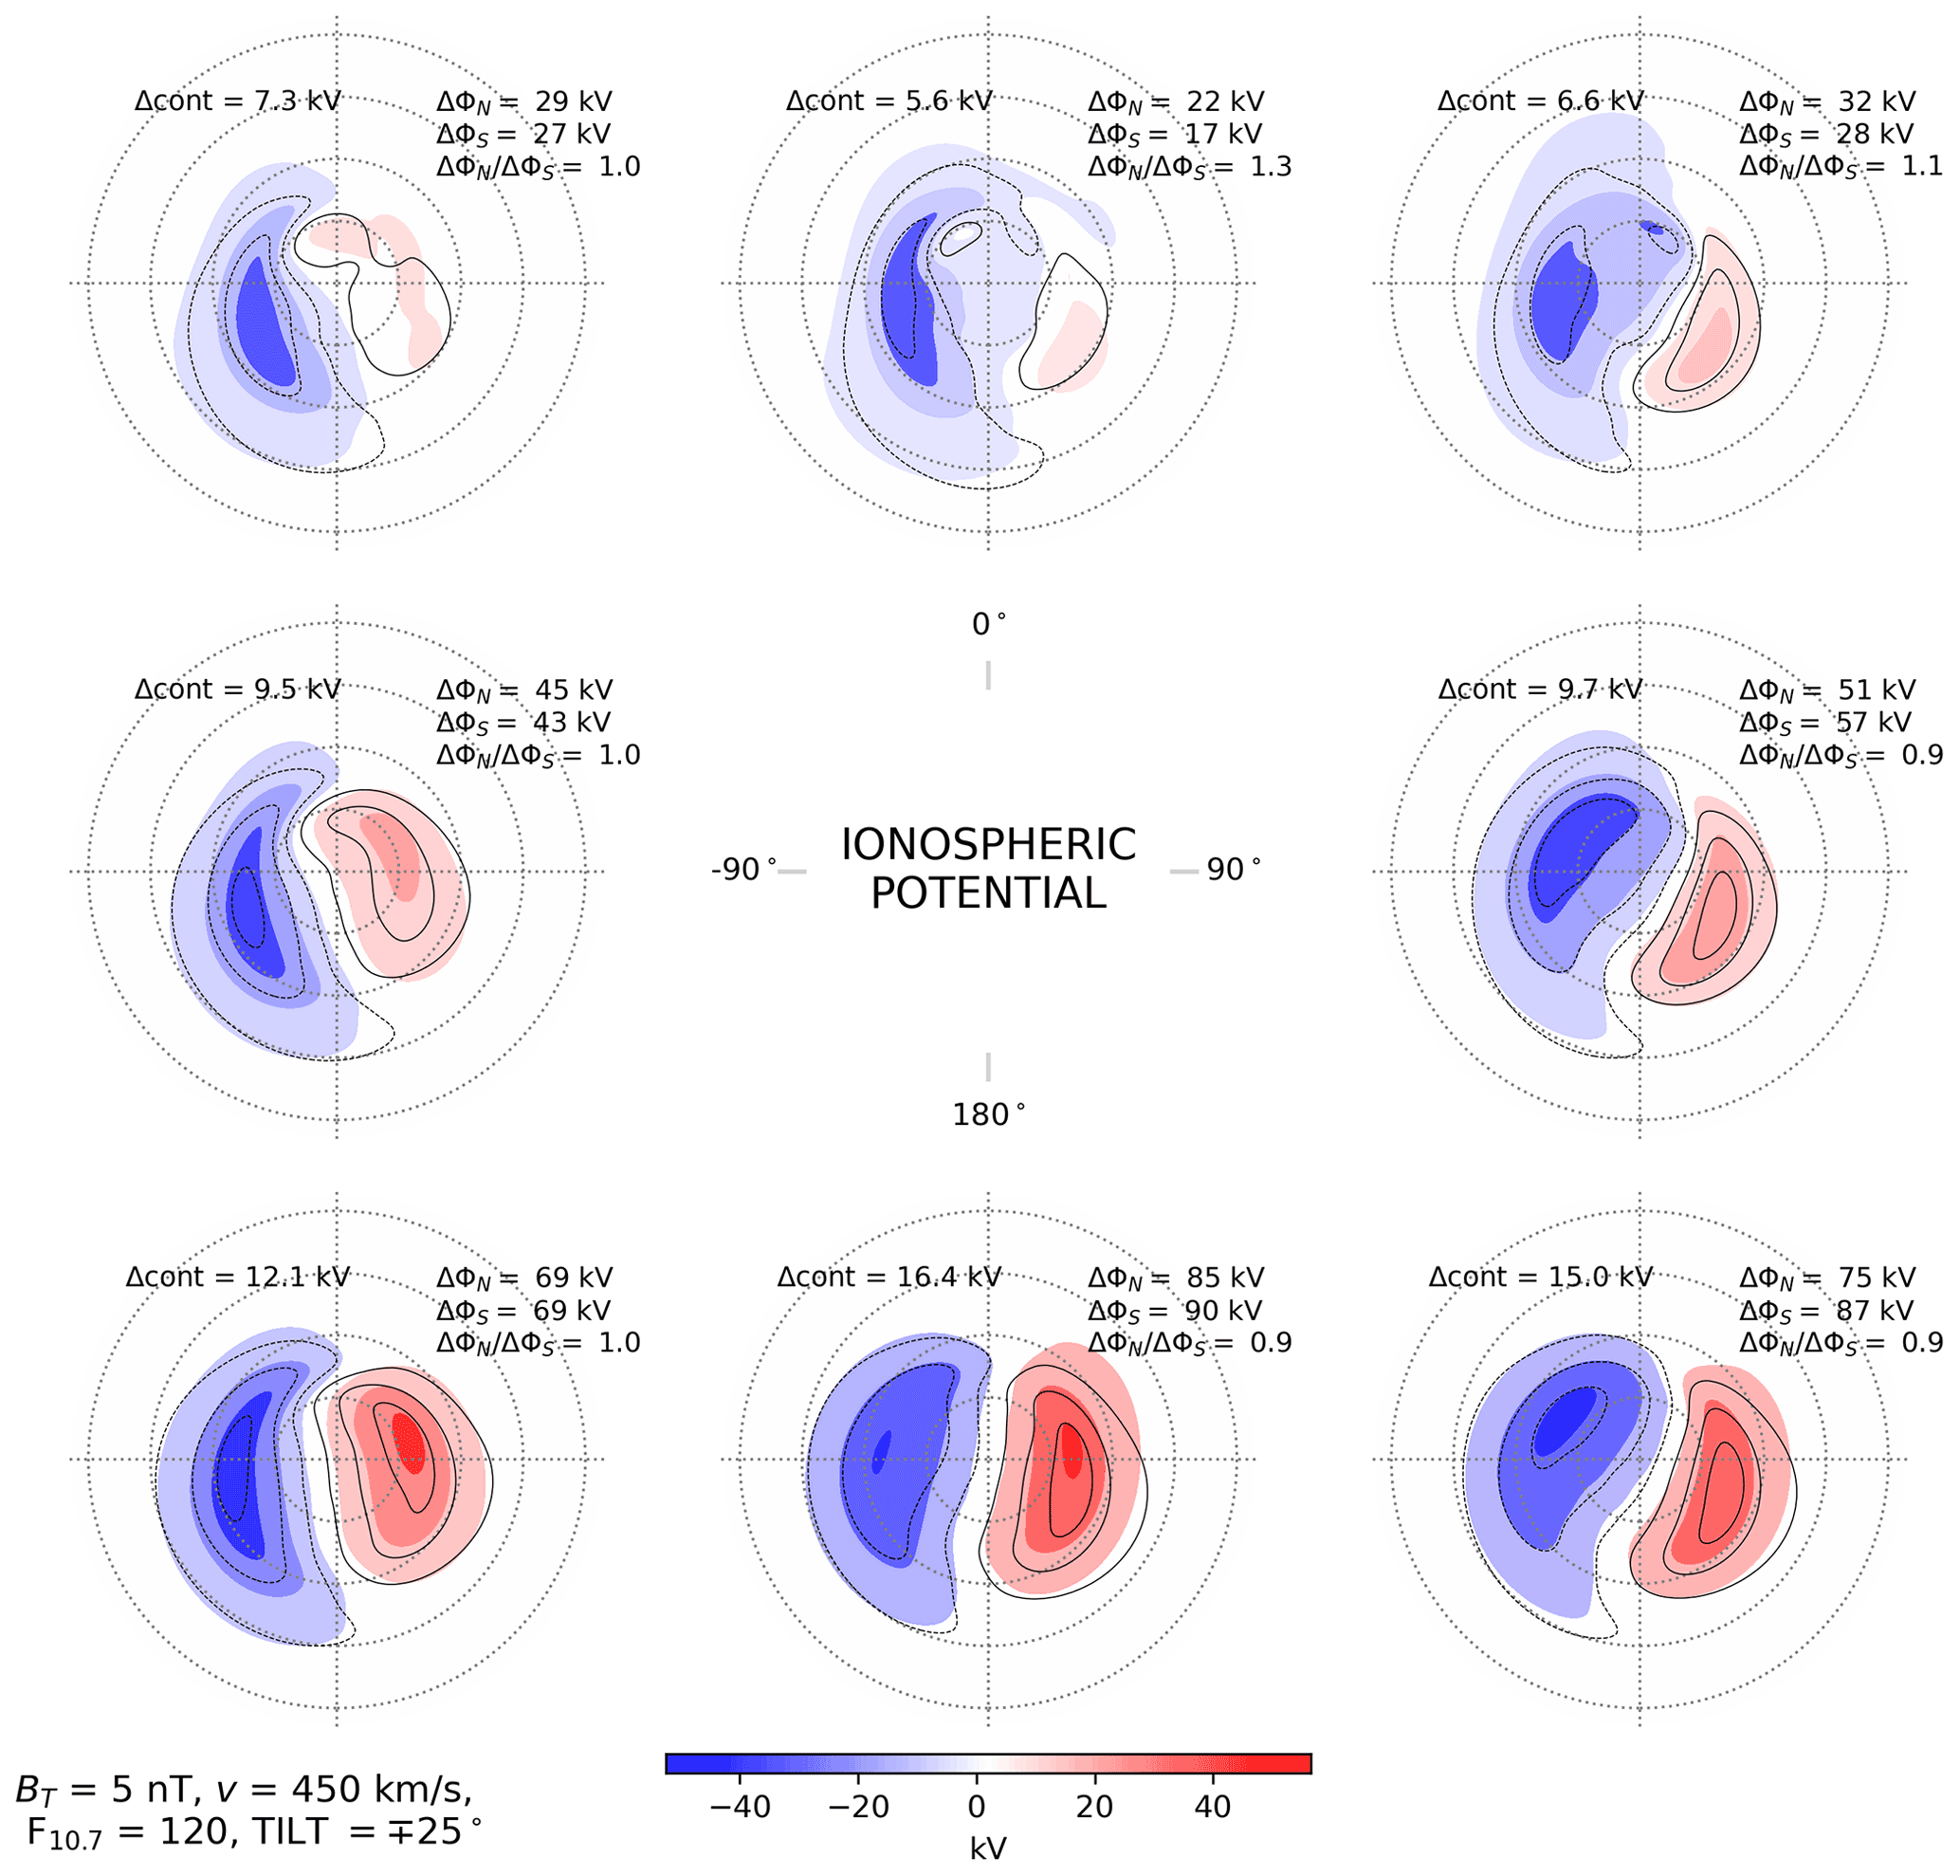
Figure 2Ionospheric potential in the Northern Hemisphere (colored contours) and Southern Hemisphere (black contour lines) as a function of IMF clock angle for dipole tilt angle (local winter), where the signs of By and Ψ are reversed for the Southern Hemisphere (local winter). In each panel the spacing between contours and contour lines (indicated by “Δcont”) is fixed to facilitate comparison between hemispheres, and is such that no more than seven contour levels are shown. The spacing therefore varies from panel to panel. The colors of all contour levels are nonetheless scaled to the color bar shown at bottom. In this figure, the mean of all eight CPCP values (shown in top right corner of each panel) for the Southern Hemisphere is 2 % greater than for the Northern Hemisphere.
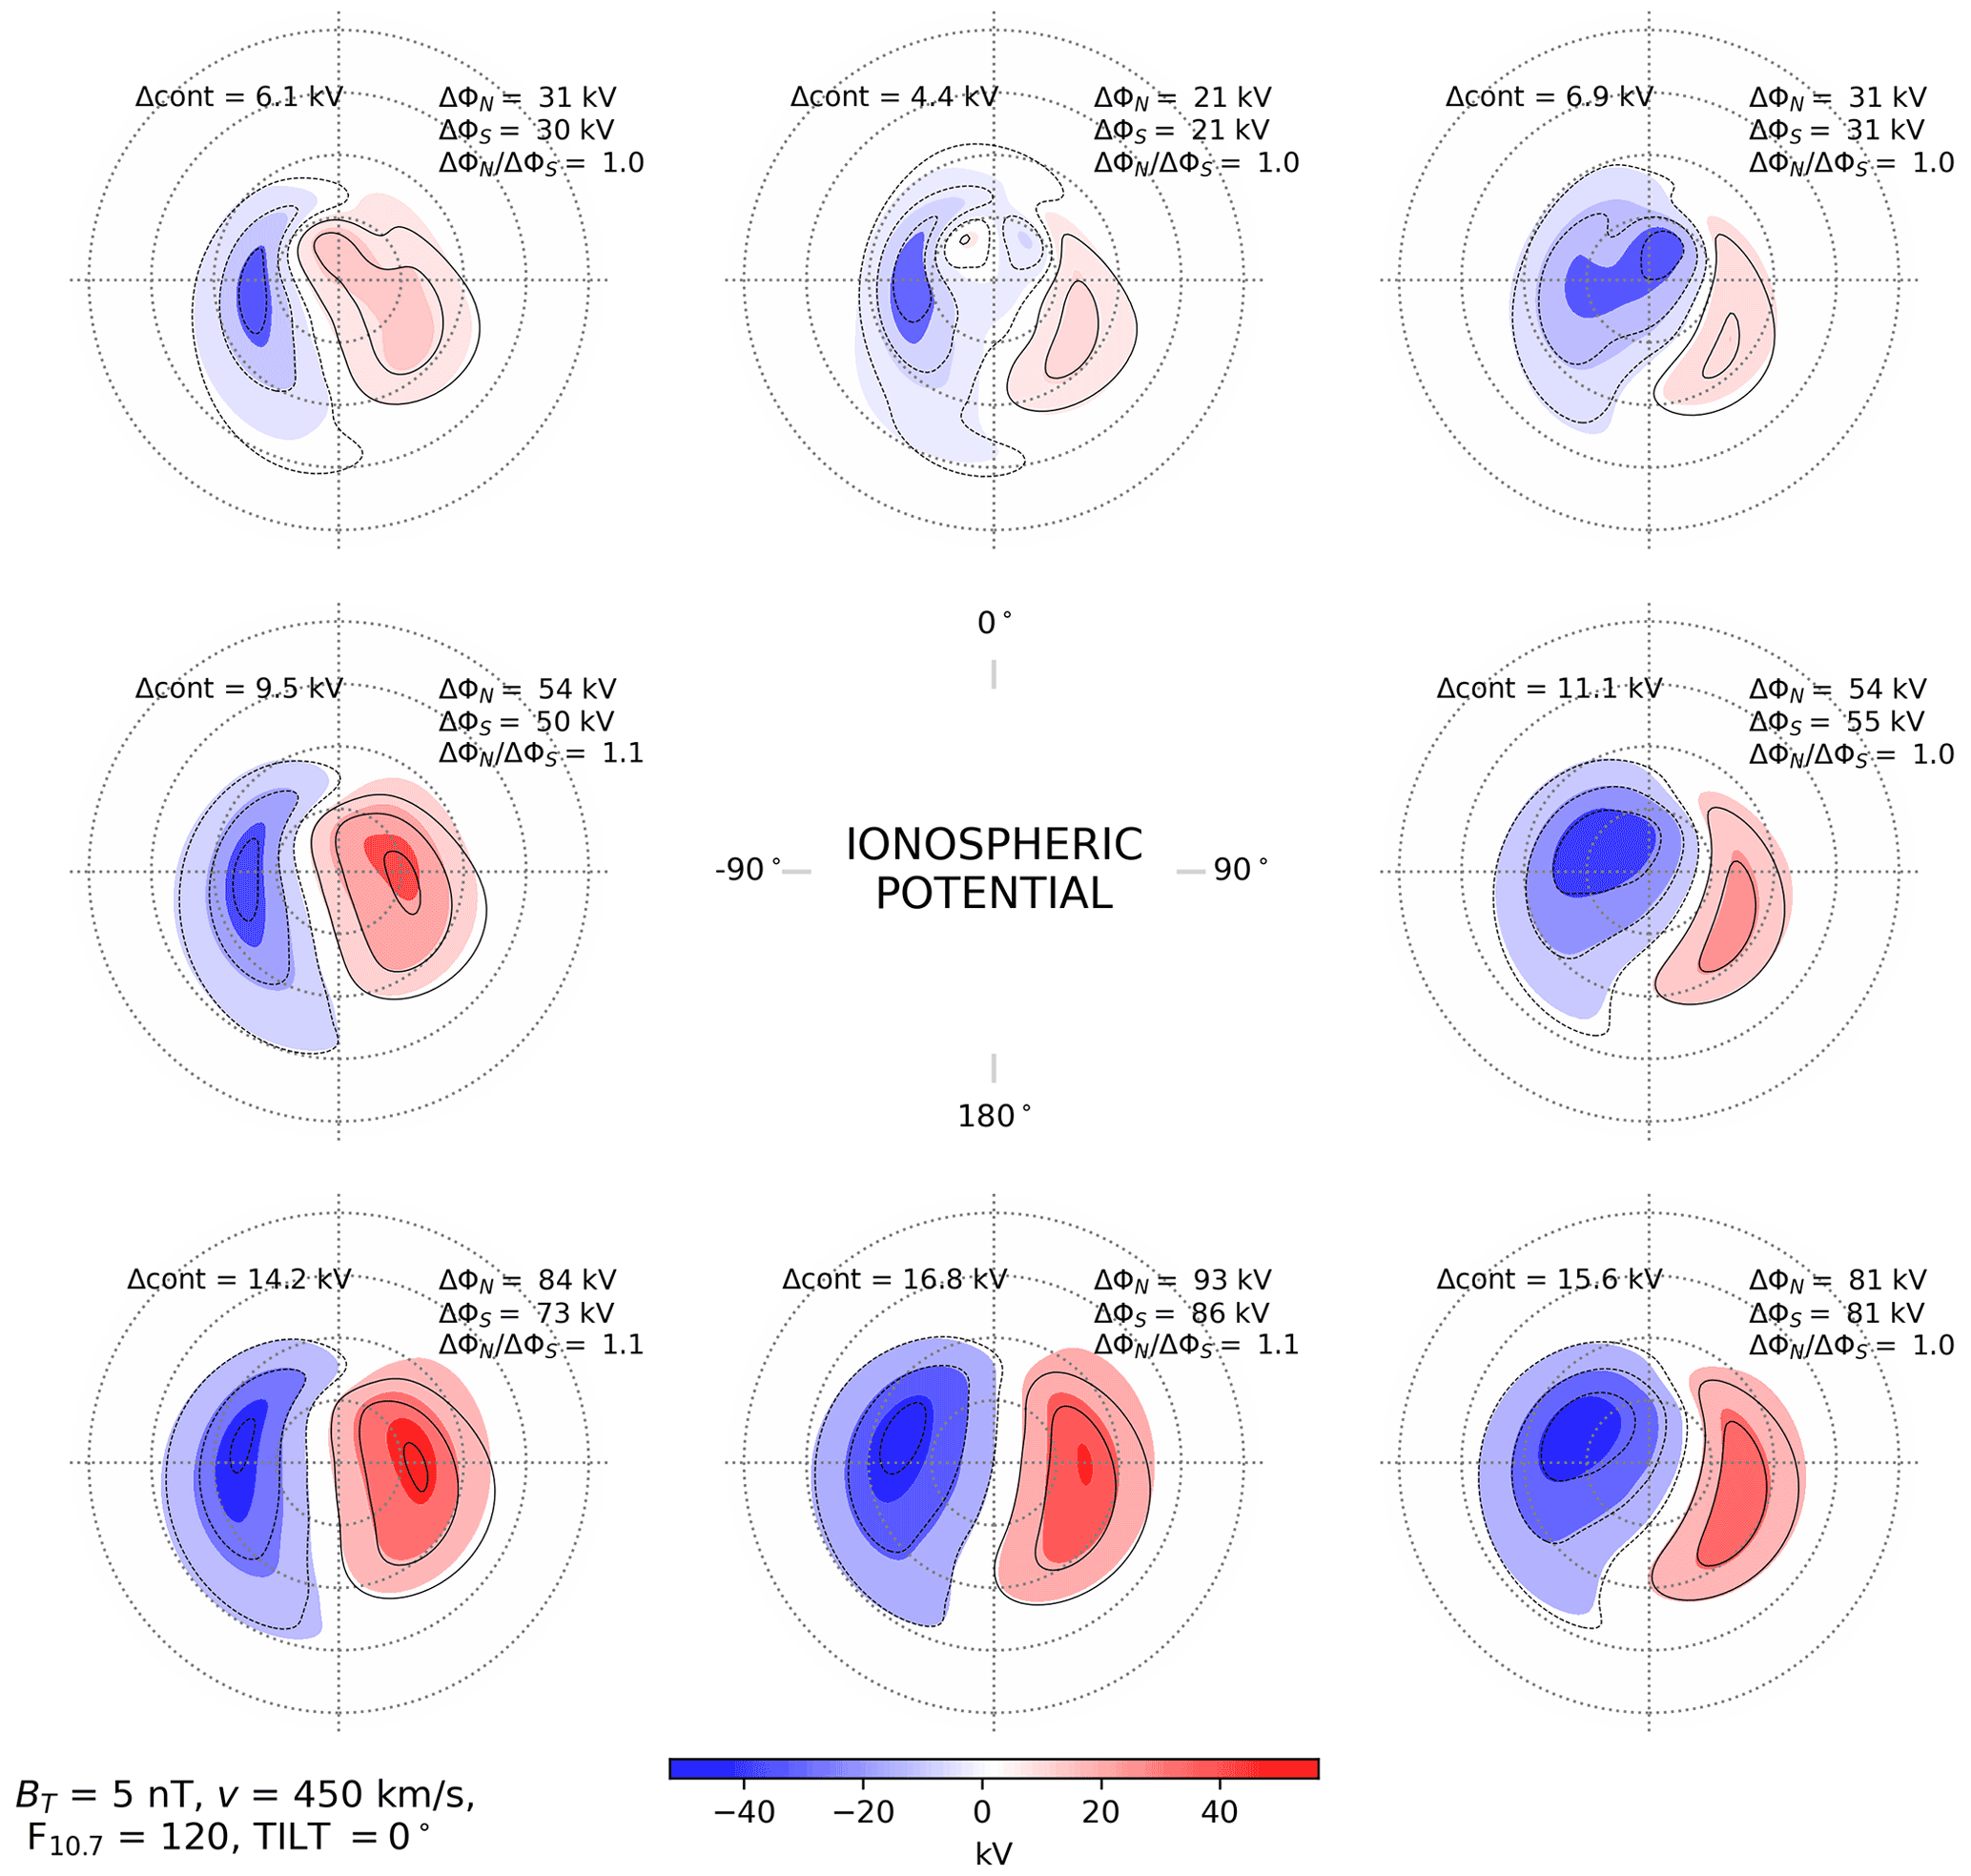
Figure 3Ionospheric potential in the Northern Hemisphere (colored contours) and Southern Hemisphere (black contour lines) as a function of IMF clock angle for dipole tilt angle Ψ=0° (∼ equinoxes), in the same layout as Fig. 2. In this figure, the mean CPCP (top right corner of each panel) for the Northern Hemisphere is 5 % greater than for the Southern Hemisphere.
Figures 3 and 4 show the ionospheric potentials in the two hemispheres during equinox (Ψ=0°) and local summer (Ψ=25° for the NH and for the SH) for the same solar wind and IMF conditions used in Fig. 2. As during local winter, during equinox and local summer the most apparent differences in the convection patterns between hemispheres occur for θc orientations having a positive Bz component. The four-cell lobe reconnection pattern is also visible in both hemispheres for θc=0° during local summer (top center panel in Fig. 4).
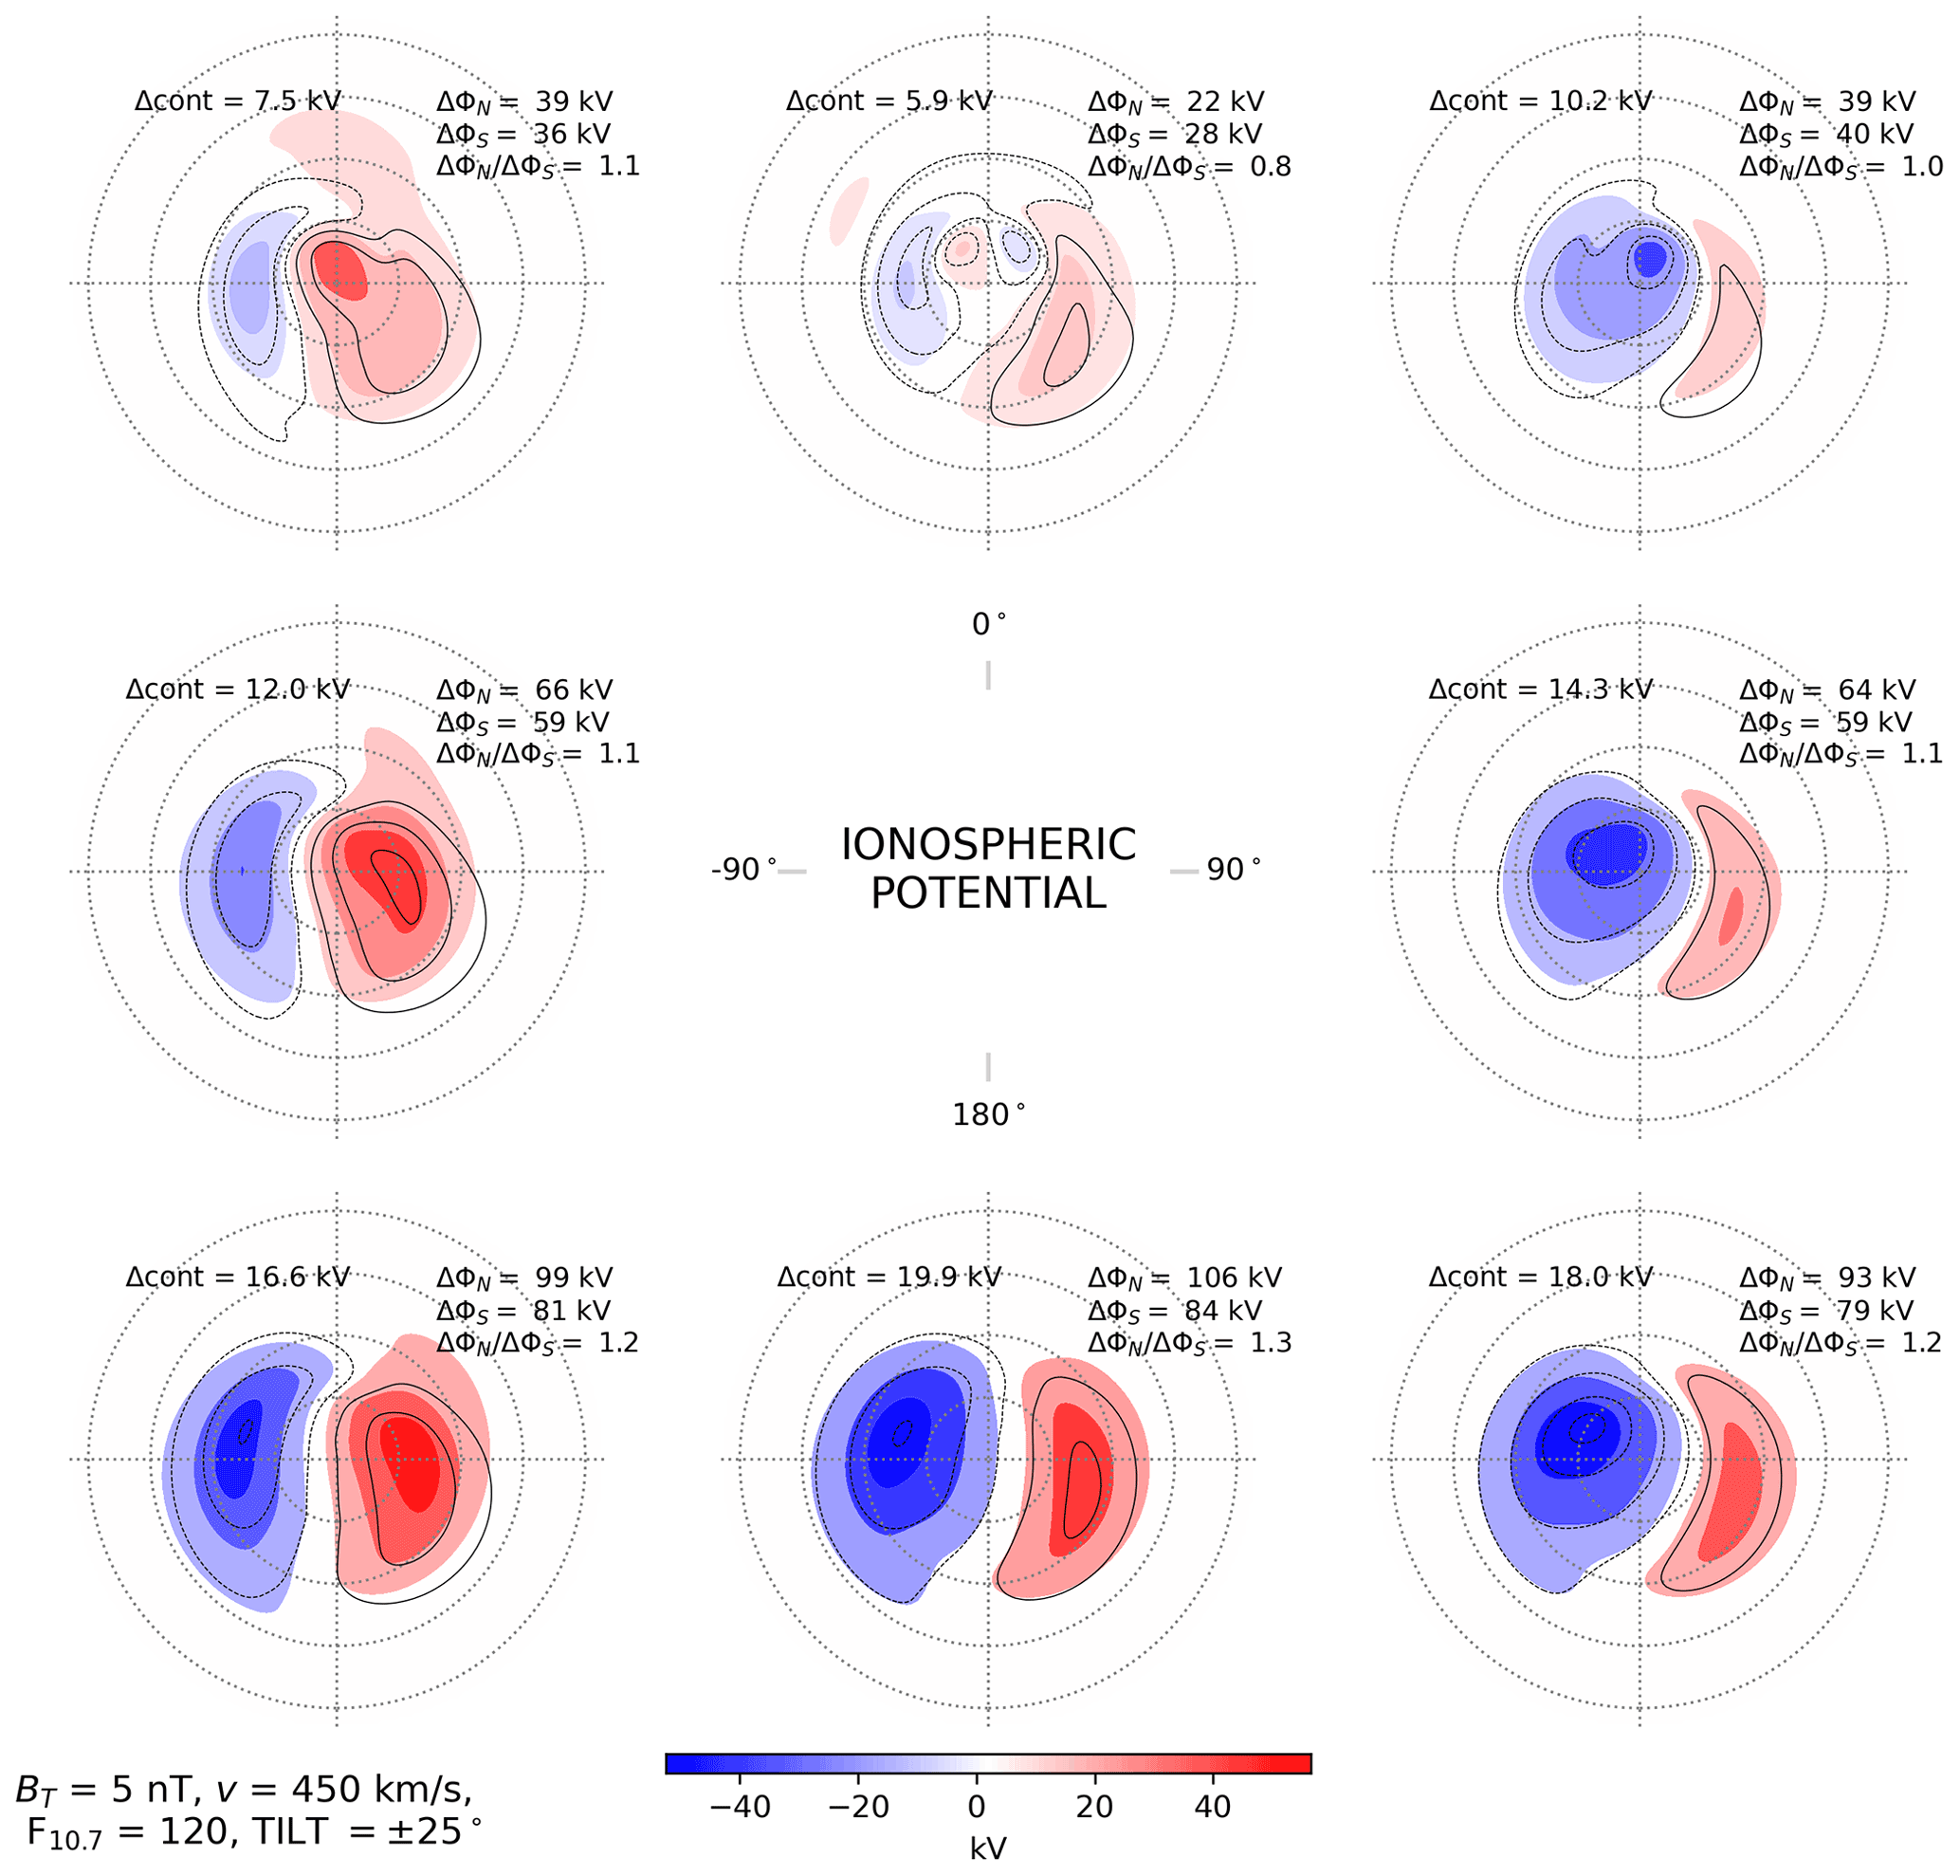
Figure 4Ionospheric potential in the Northern Hemisphere (colored contours) and Southern Hemisphere (black contour lines) as a function of IMF clock angle for dipole tilt angle (local summer), in the same layout as Figs. 2 and 3. In this figure, the mean CPCP (top right corner of each panel) for the Northern Hemisphere is 13 % greater than for the Southern Hemisphere.
4.2 Cross-polar cap potential comparison
Figure 5 compares cross-polar cap potential values derived from the Swarm Hi-C model (thick solid lines) with results from the four other studies listed in Table 1, which also gives the solar wind and dipole tilt conditions used for deriving CPCP values in each study. In the four previous studies referenced in this figure, CPCP estimates were only given for the eight IMF clock angles indicated by the dots. Hence the curves for these studies are obtained by linear interpolation between these dots, with the linear interpolation carried out in polar coordinates. This is the cause of the cusp-like feature at θc=0° for the curves representing these studies. This cusp-like feature does not appear in the Swarm Hi-C curve (thick solid line) in each panel because these curves are directly calculated from the Swarm Hi-C model at a resolution of Δθc=0.1°.
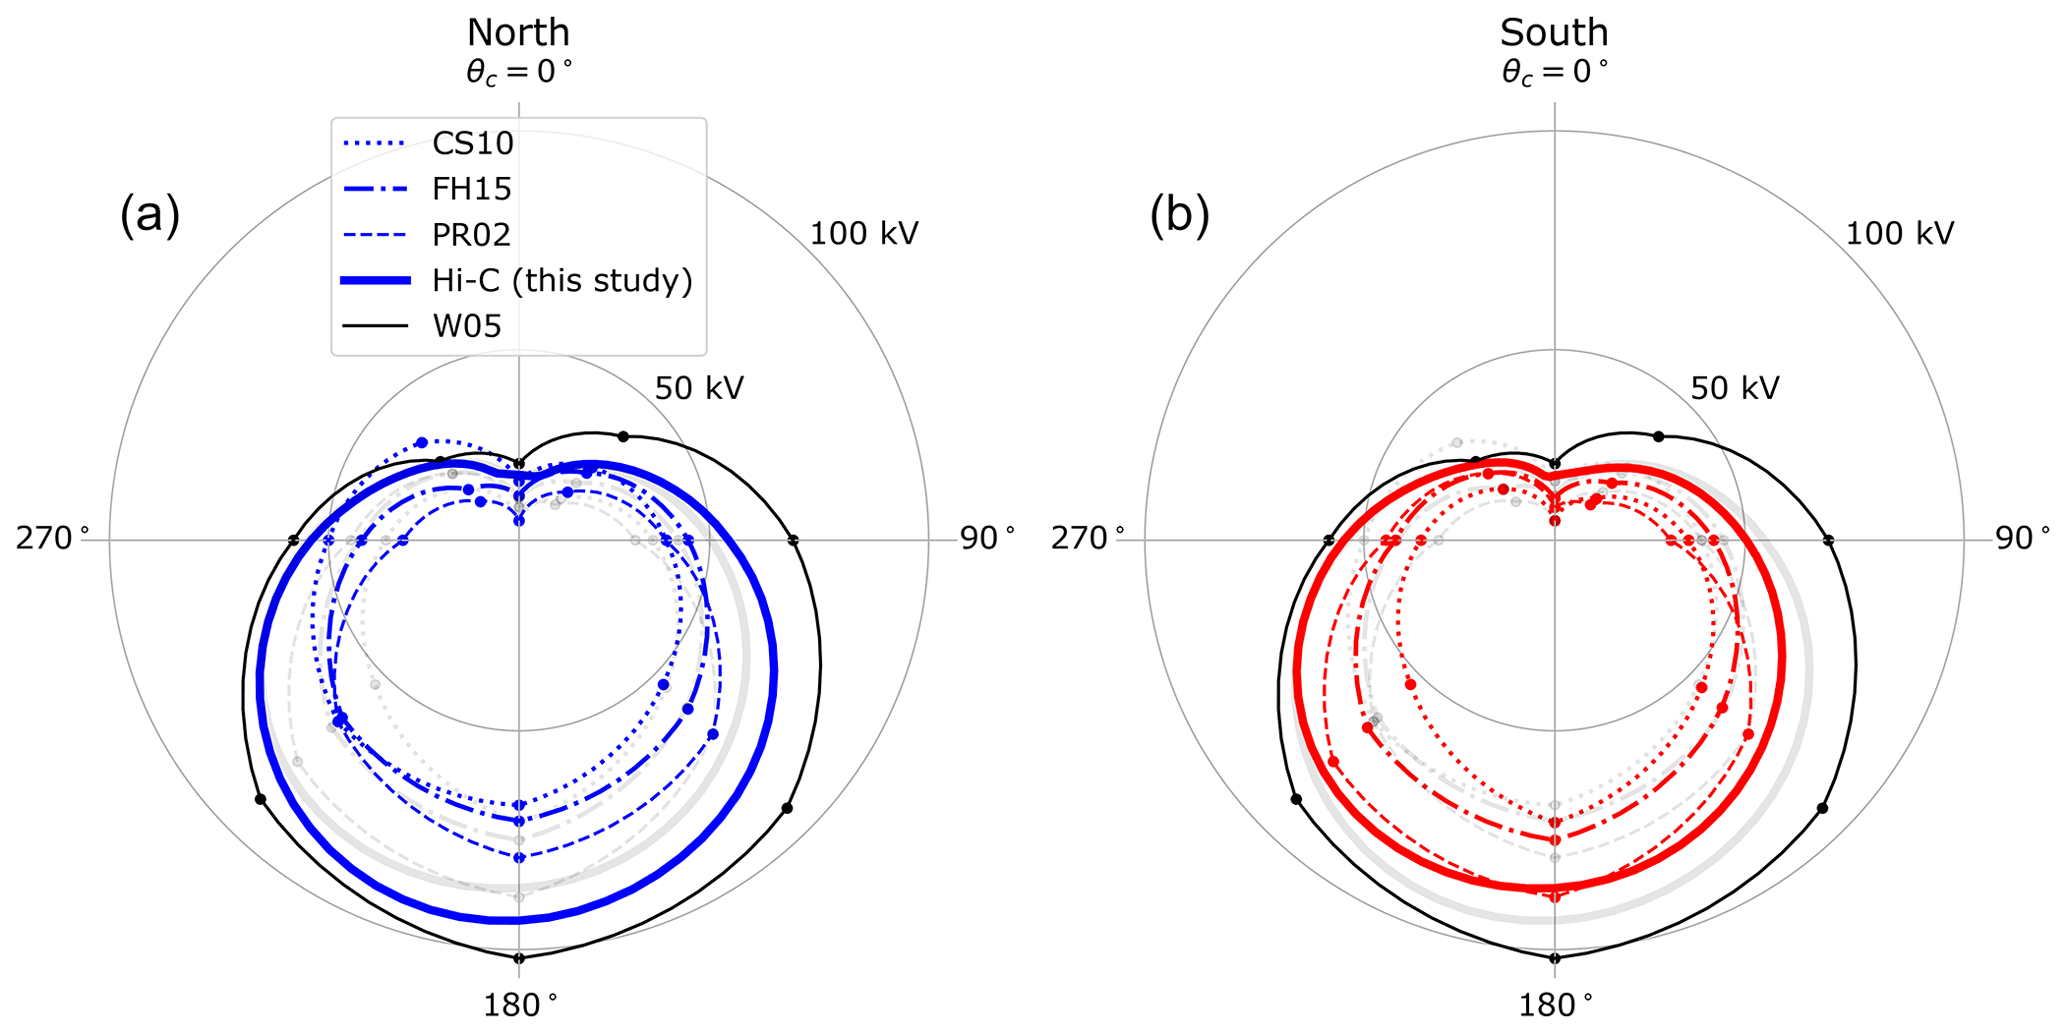
Figure 5Cross-polar cap potential in the Northern Hemisphere (a) and Southern Hemisphere (b) Hemisphere as a function of IMF clock angle θc. The clock angle is defined such that corresponds respectively to nT, and so forth. Results from the Swarm Hi-C model (this study) are shown as thick solid lines. The other studies included for comparison are shown in the legend. Table 1 gives the solar wind and dipole tilt conditions used in each study. To facilitate comparison between hemispheres, the light gray line with matching line style in each panel shows CPCP values from the opposite hemisphere for the same model; the only exception is CPCP values from the W05 model (thin black line), which does not distinguish between hemispheres. CS10: Cousins and Shepherd (2010); FH15: Förster and Haaland (2015); PR02: Papitashvili and Rich (2002); W05: Weimer (2005).
Table 1Solar wind, IMF, and dipole tilt conditions used by studies shown in Fig. 5 to produce CPCP estimates.
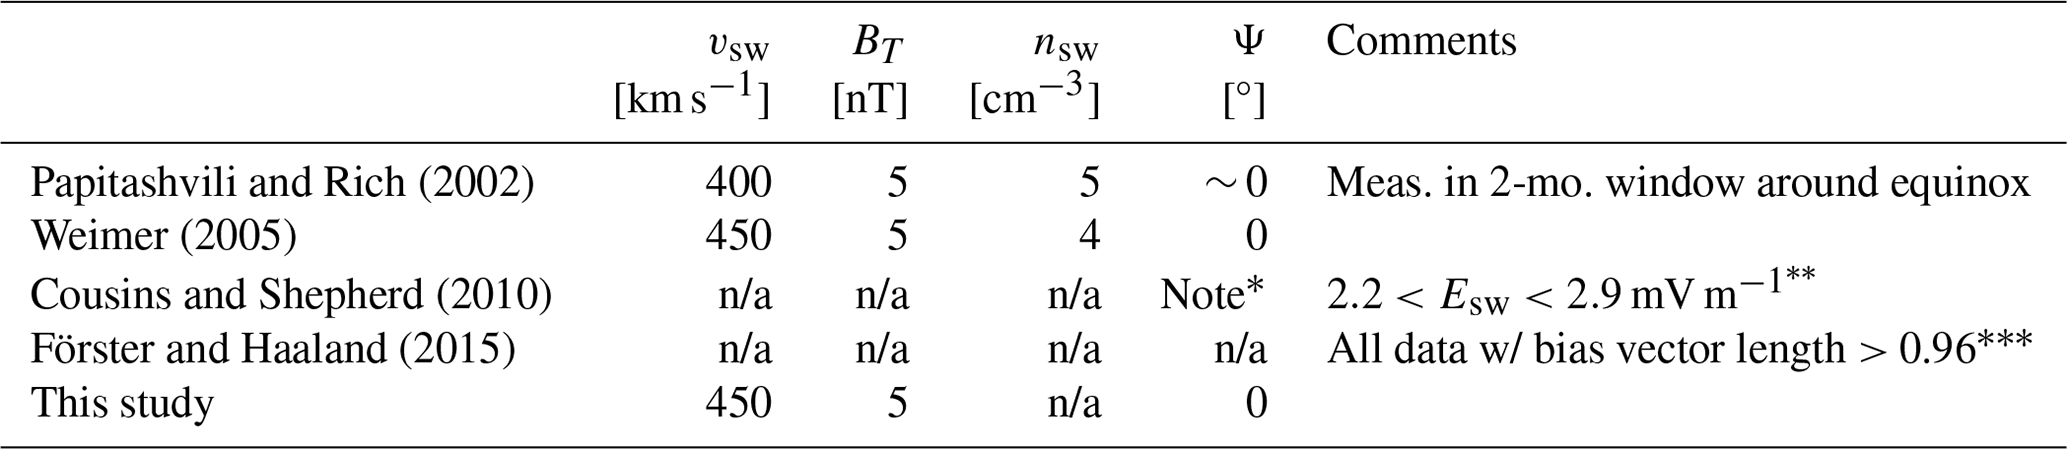
* Ψ>10° NH, in SH. mV m−1 for km s−1 and BT=5 nT, for example. cf. their Sect. 3. n/a: not applicable.
In general Swarm Hi-C CPCP values are more or less similar to those yielded by other models. The SuperDARN-based model of Cousins and Shepherd (2010) generally yields the smallest CPCP, but Thomas and Shepherd (2018) have shown that convection measurements from the midlatitude SuperDARN radars, which have become available more recently and were not used by Cousins and Shepherd (2010), are important to get the correct potential during intense solar wind driving. The Swarm Hi-C CPCP results otherwise seem to suggest that the CPCP values presented by Papitashvili and Rich (2002) and Förster and Haaland (2015) might be subject to some seasonal bias toward a preference for local winter patterns: the CPCP values for northward IMF orientations presented by these studies tend to be greater in the NH than in the SH, as is the case for the ratio of CPCP values during local winter for Swarm Hi-C (Fig. 2). The highly elliptical orbit of the Cluster satellites, measurements from which were used by Förster and Haaland (2015), might indeed have generated some seasonal imbalance of the mapped high-latitude drift patterns. This should be investigated independently.
In this section we present a comparison of Swipe estimates of electromagnetic work and Hall and Pedersen conductances in each hemisphere. This comparison is carried out using the same dipole tilt, solar wind, and IMF conditions as were used in Sect. 4.1. The same figure format is also used, with NH distributions plotted as colored contours and SH distributions as black contour lines, and the sign of IMF By and dipole tilt Ψ is inverted for SH distributions to facilitate assessment of mirror symmetry (see Eq. 1). Distributions of Swipe estimates in this section are however only shown over 60–90° MLat in the NH (−60 to −90° MLat in the SH) since equatorward of ± 60° MLat the estimates of electromagnetic work are essentially zero, and the estimates of Hall and Pedersen conductances are typically invalid as described below.
Some preliminary comments are in order. In Sect. 2 we arrived at the estimates of Hall and Pedersen conductances given by Eqs. (12)–(13) by assuming that the electric field in the reference frame of the neutral wind does not substantially differ from the electric field E in an Earth-fixed frame of reference. Under this assumption, Eq. (5) indicates that and correspondingly that . We may therefore be confident that at any location where either the height-integrated electromagnetic work W<0 or the Hall conductance ΣH<0, Swipe estimates of ΣH and ΣP are either inconsistent with this assumption or are related to differences between the Swarm Hi-C and AMPS models despite our best attempt to derive them in a consistent fashion. In Figs. 10–15 we therefore only show portions of the distributions of ΣH and ΣP where the following criteria are met:
The first criterion is most important in that where it is not met (typically within the polar cap and equatorward of ± 60° MLat) the conductance estimates are in many places negative or unphysically large, or exhibit sharp gradients. The second criterion is primarily relevant above 70° MLat where the Hall conductance estimates are in some places negative (typically no less than −1 mho but for some tilt/solar wind/IMF configurations as low as −6 mho). The threshold 0.5 mW m−2 is obtained via a rough estimate of the typical contribution of the height-integrated second term on the right-hand side of Eq. (5), , given typical values m s−1, nT, and mA m−1. In practice we find that for threshold values below 0.5 mW m−2 very sharp gradients in the conductance distributions appear. An example showing the conductance distributions when no screening criteria are applied is given by Fig. S7 in the Supplement.
We also note that model predictions represent “average” large-scale electrodynamics for a given set of model input parameters and that ideally one would also take stock of the uncertainty of model predictions in assessing physical consistency. None of the studies referenced in Table 1 address model uncertainty, nor do we directly address it in this study. This topic deserves more attention as part of a dedicated study.
5.1 work
Figures 6–8 show distributions of electromagnetic work given by Eq. (11). As with the electric potentials in Figs. 2–4, the distributions of electromagnetic work in the two hemispheres are in general highly similar. The largest differences appear during local summer for θc orientations with a negative IMF Bz component (bottom row of panels in Fig. 8), for which the NH distributions are overall more intense and electromagnetic work in the polar cap is greater, consistent with the CPCP values shown in the bottom row of Fig. 4. On the other hand, the hemispheric ratios of integrated work (indicated in the top right corner of each panel) are largest for θc orientations having a positive IMF Bz component, although the magnitudes of integrated work are generally very small for these θc orientations. This appears to hold in particular for local winter.
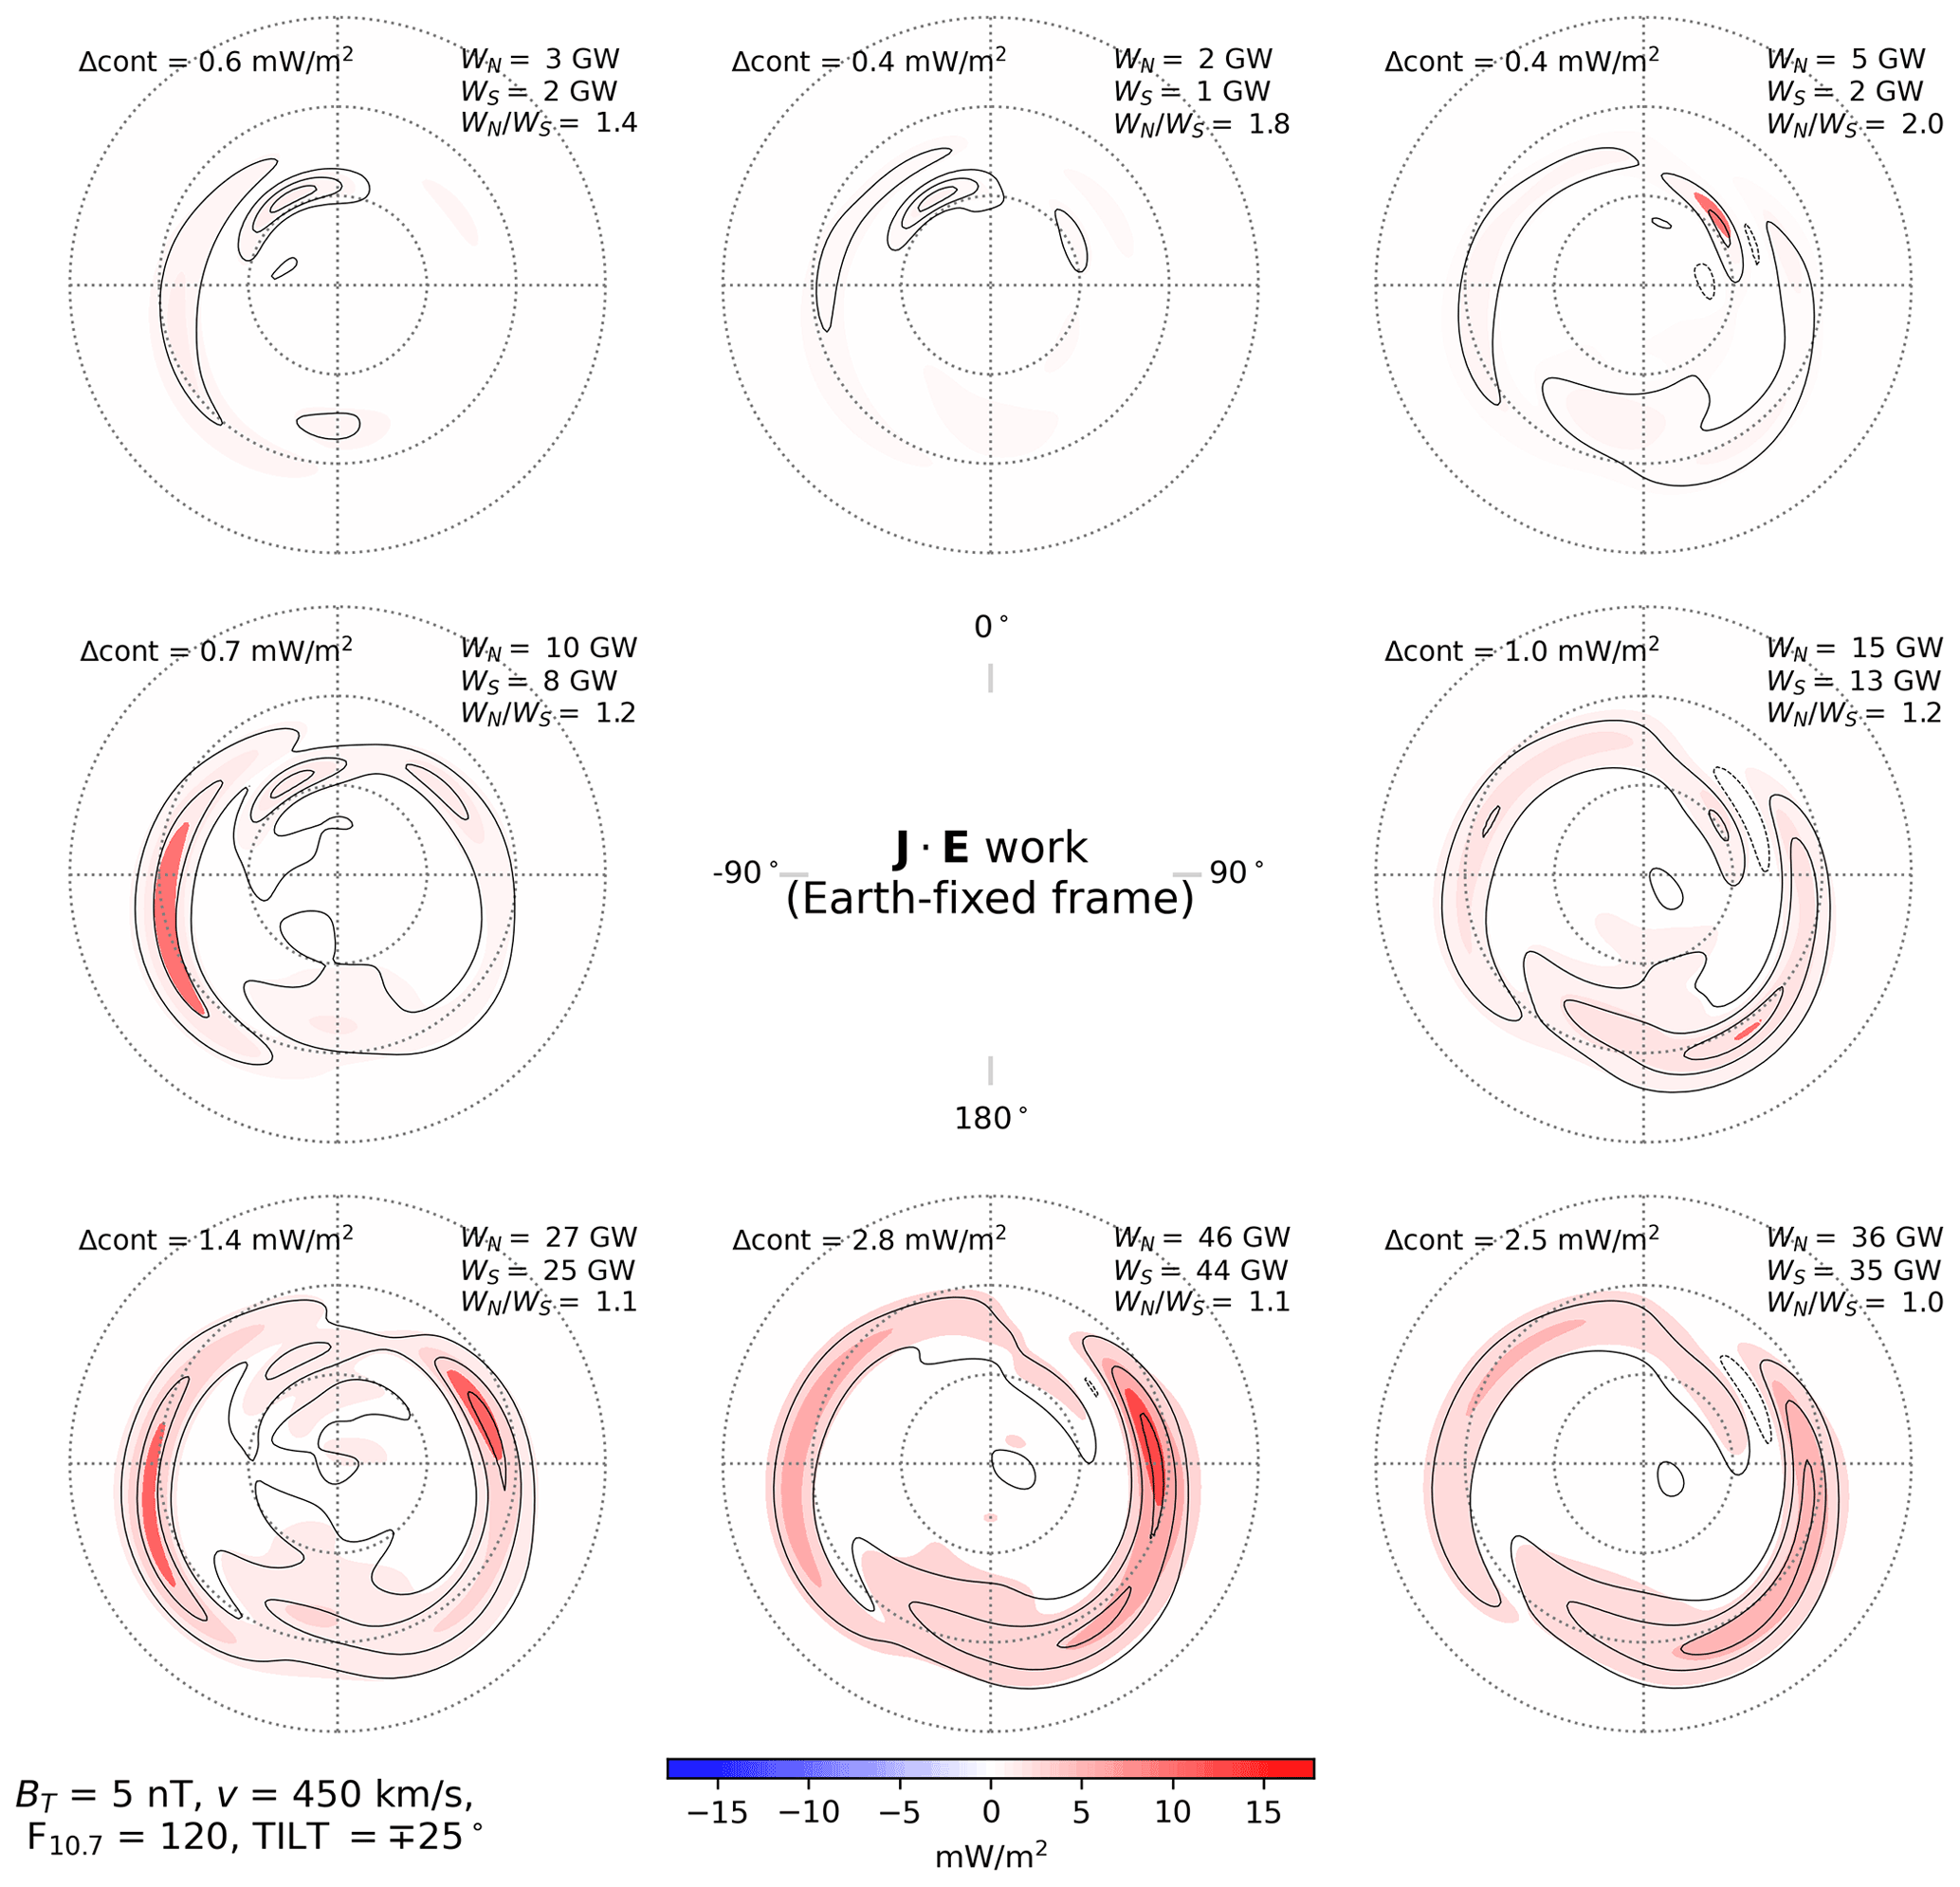
Figure 6Electromagnetic work in the Northern Hemisphere (colored contours) and Southern Hemisphere (black contour lines) as a function of IMF clock angle for dipole tilt angle (local winter), in the same layout as Fig. 2. In each panel the spacing between contours and contour lines (indicated by “Δcont”) is fixed to facilitate comparison between hemispheres, and is such that no more than four contour levels are shown. The spacing therefore varies from panel to panel. The color of all contour levels are nonetheless scaled to the color bar shown at bottom.
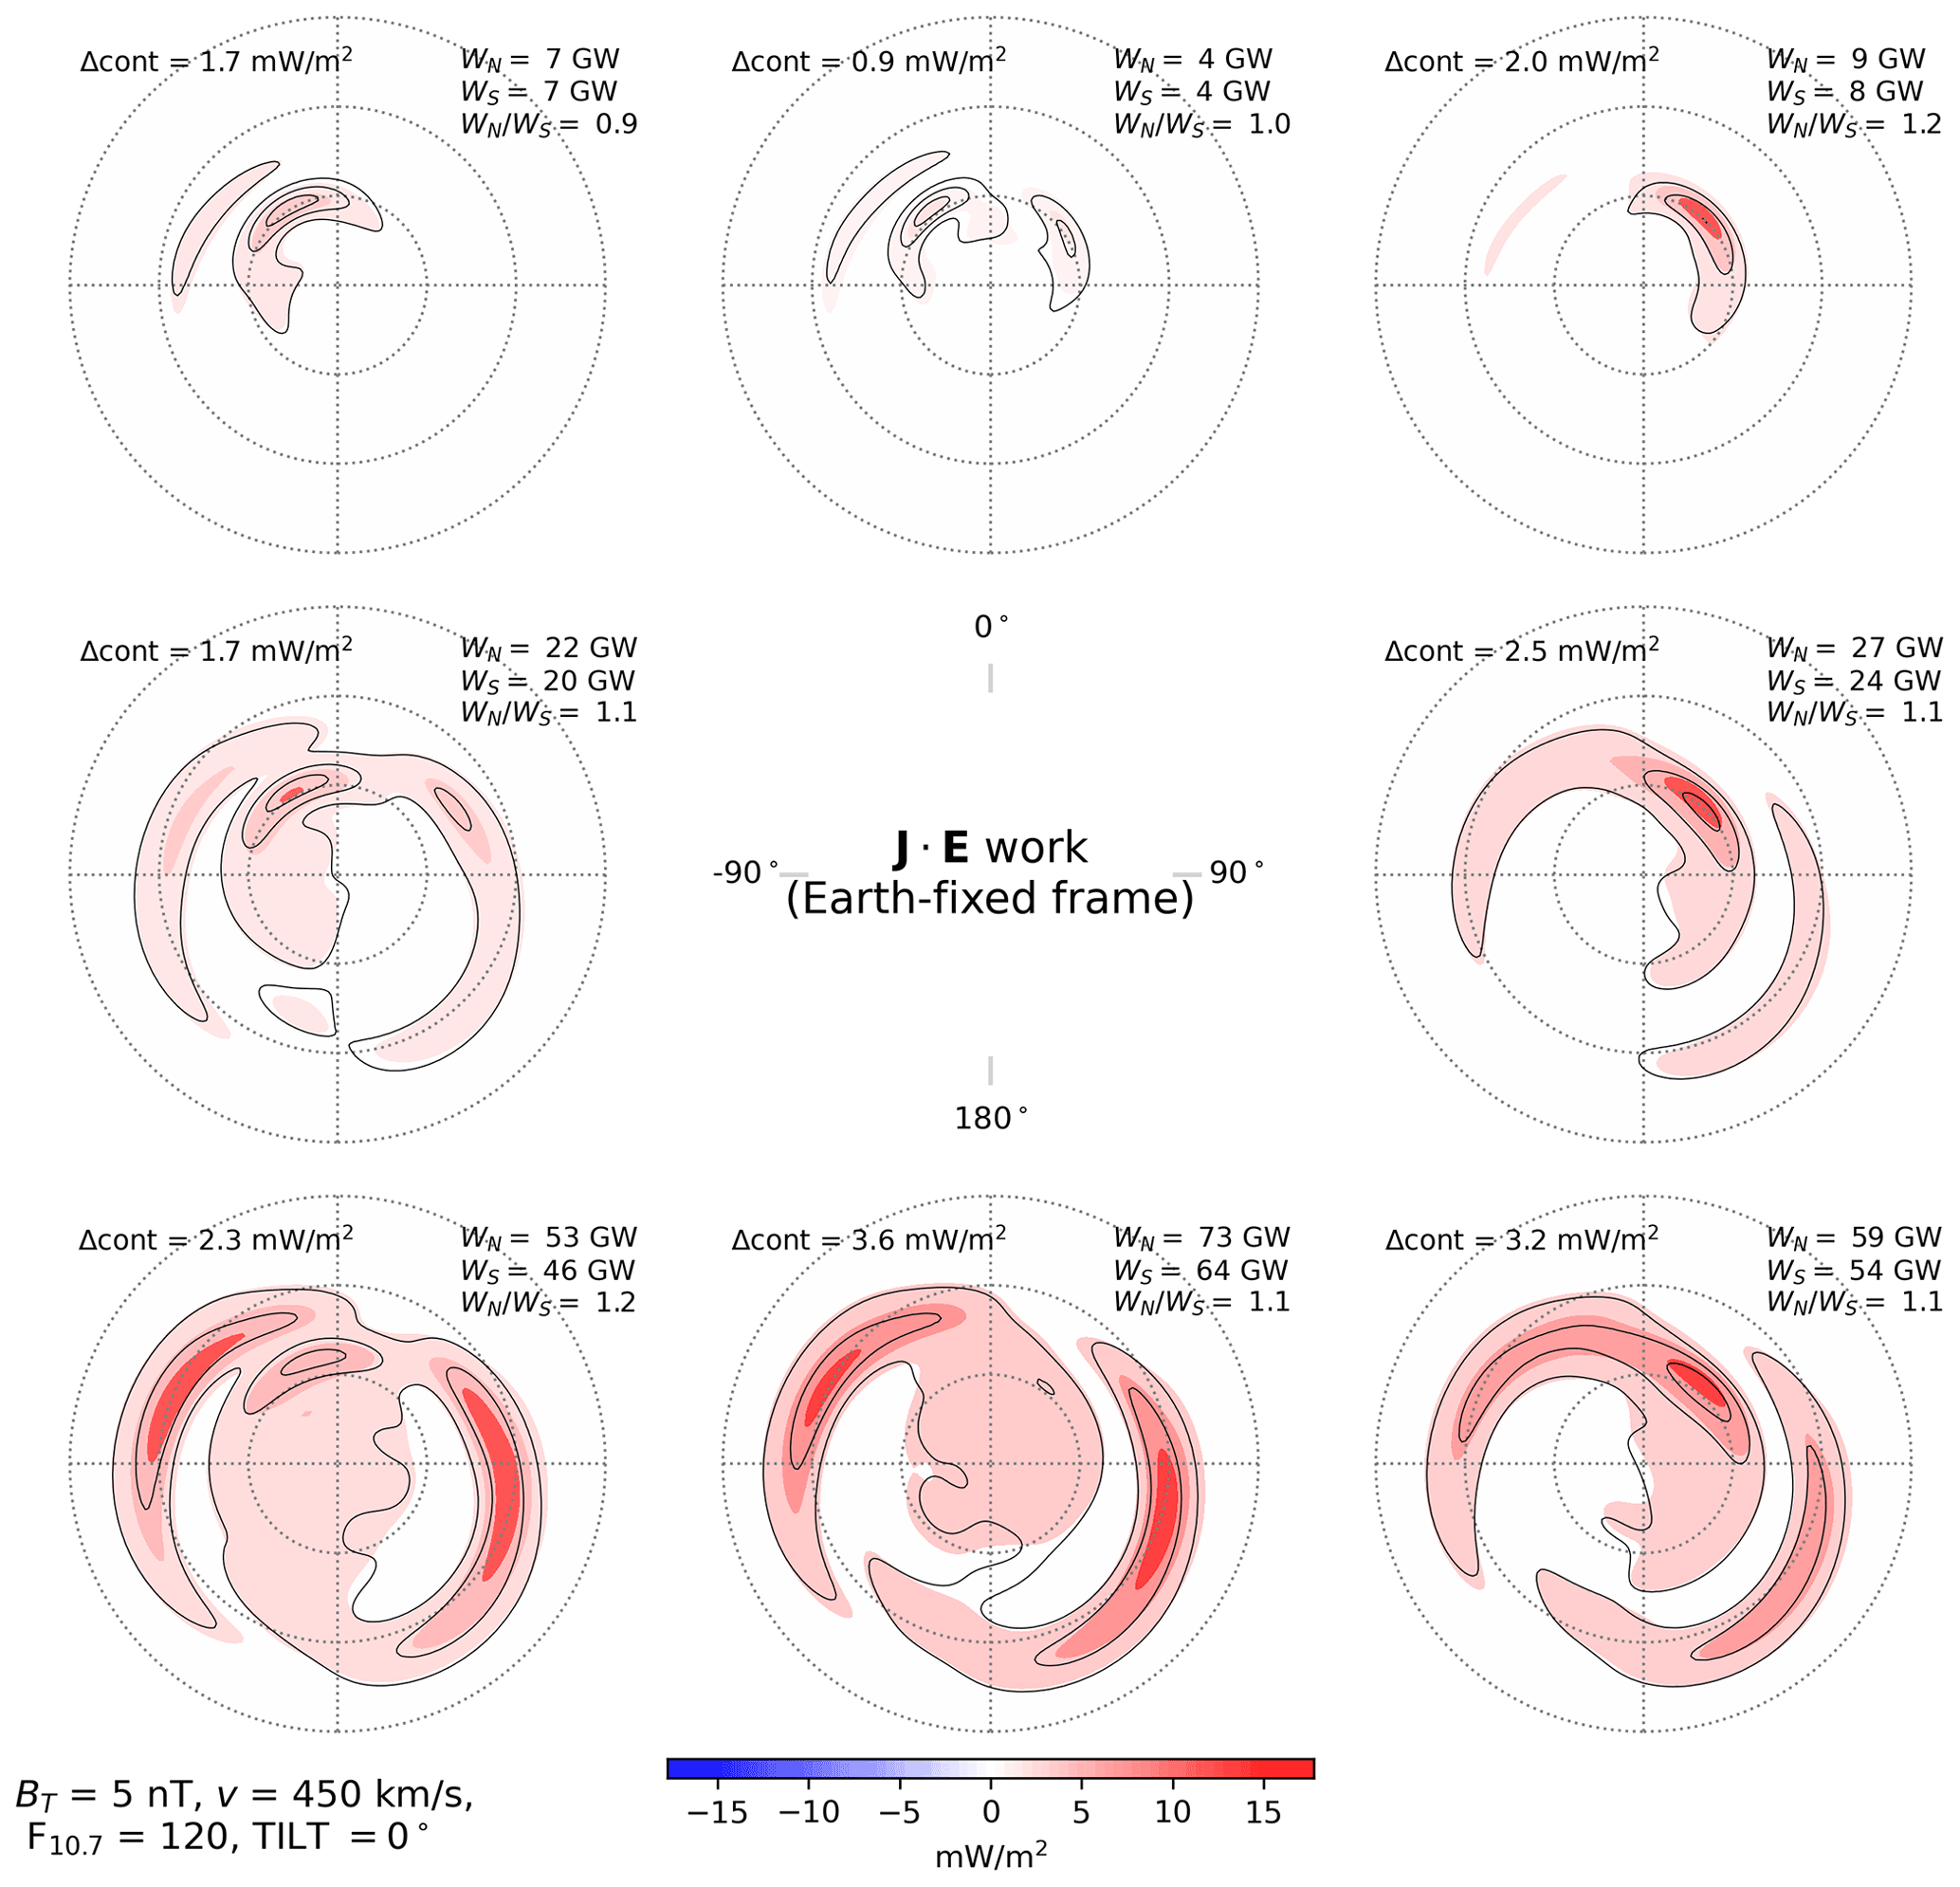
Figure 7Electromagnetic work in the Northern Hemisphere (colored contours) and Southern Hemisphere (black contour lines) as a function of IMF clock angle for dipole tilt angle Ψ=0° (equinox), in the same layout as Fig. 2.
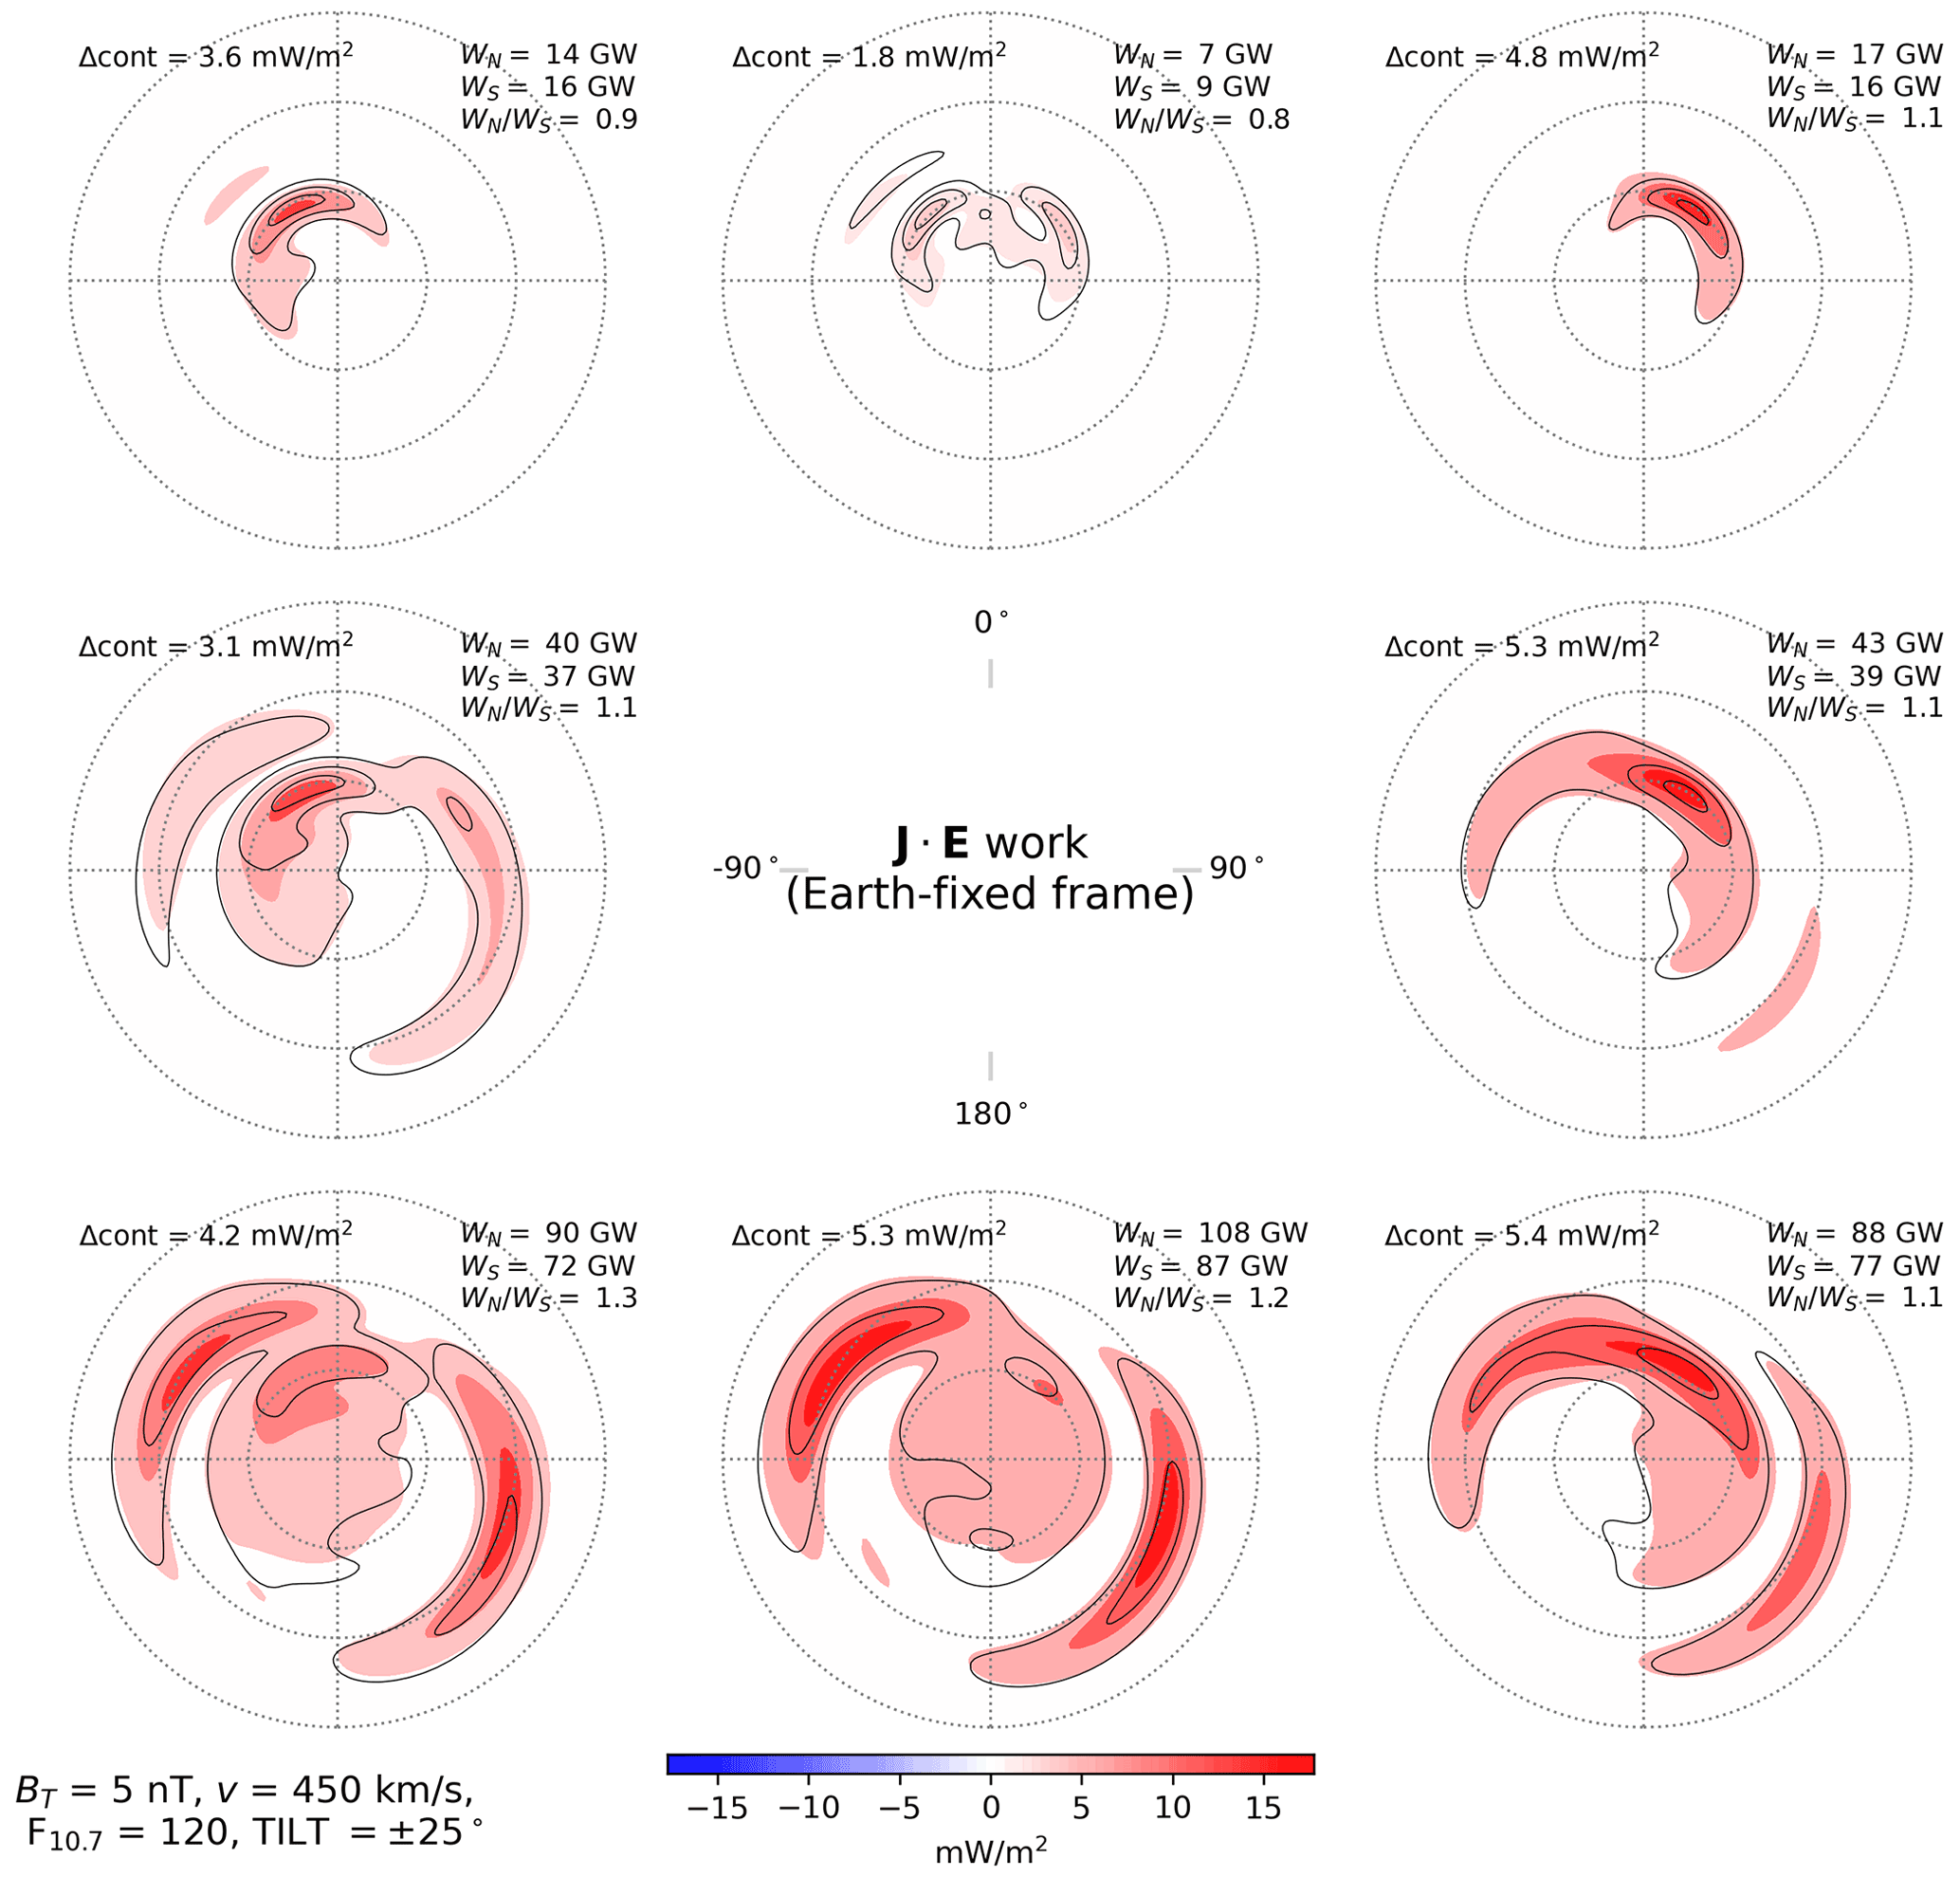
Figure 8Electromagnetic work in the Northern Hemisphere (colored contours) and Southern Hemisphere (black contour lines) as a function of IMF clock angle for dipole tilt angle , in the same layout as Fig. 2.
In each panel of each of these figures the electromagnetic work integrated over the entire polar ionosphere for each hemisphere is indicated in the top right corner. Comparison of these values for a given IMF orientation and different seasons indicates that the integrated electromagnetic work strictly increases from local winter to local summer (where equinox is strictly between winter and summer): during local winter conditions (, Fig. 6) integrated work ranges between 1 and 46 GW, whereas during local summer conditions (, Fig. 8) integrated work ranges between 7 and 108 GW.
For all seasons and for IMF Bz>0 configurations (top three panels in each figure), the locus of enhanced work on the dayside depends on the sign of IMF By. In particular, in the top left corner (By<0 in the NH, By>0 in the SH) the enhancement is greatest over post-noon MLTs, and in the top right corner (By>0 in the NH, By<0 in the SH) the enhancement is greatest over pre-noon MLTs on the dayside. This dependence on IMF By is the same as the dependence exhibited by Alfvénic energy deposition (e.g., Fig. 2 in Hatch et al., 2018) and opposite the dependence exhibited by the polar cusp (Zhang et al., 2013, and references therein). Regarding the latter, for increasingly negative By the NH polar cusp tends to shift to increasingly early MLTs, and vice versa for increasingly positive By (Zhou et al., 2000; Zhang et al., 2013). (Note however the report of Wing et al., 2001, on the existence of a double cusp during strong, dominant By solar wind conditions.)
In contrast, the maps of electric potential in Figs. 2–4 indicate no clear pre- or post-noon asymmetry of the magnitude of dayside ionospheric flows inside the polar cap, depending on the sign of IMF By. From looking at the corresponding maps of the horizontal ionospheric currents during the same conditions in Figs. 9–11 in Laundal et al. (2018), it is evident that the asymmetry in the electromagnetic work seen is related to the asymmetries in the horizontal currents. The mentioned opposite asymmetry compared to the cusp location can be understood by the direction of the direct forcing from the IMF due to a dominant By component, which tends to have a more direct influence during local summer conditions (Reistad et al., 2021). We note that for a neutral wind field corotating with the Earth, this direct By forcing on the dayside will for IMF By>0 in the NH go against the corotation wind field, while for IMF By<0 in the NH it will point along the corotation, reducing the electric field in Earth’s rotating frame of reference. This effect may be an important cause of the asymmetries pointed out here in the electromagnetic work and horizontal current maps in the dayside polar cap, especially during local summer.
Regardless of IMF By and dipole tilt Ψ, integrated electromagnetic work tends to increase with increasingly negative IMF Bz as is well known from previous studies (e.g., Fig. 5 in Weimer, 2005). The ratio of integrated electromagnetic work in the NH and SH, respectively WN and WS, for θc orientations involving a negative IMF Bz component (bottom three panels in Figs. 6–8) shows a general tendency to increase from local winter ( 1.03–1.08) to local summer ( 1.15–1.25). There is also a general tendency for integrated work to be greater for IMF By>0 in the NH (IMF By<0 in the SH), with some exceptions visible for the NH in the bottom row of Fig. 8 and in the top rows of Figs. 6–7.
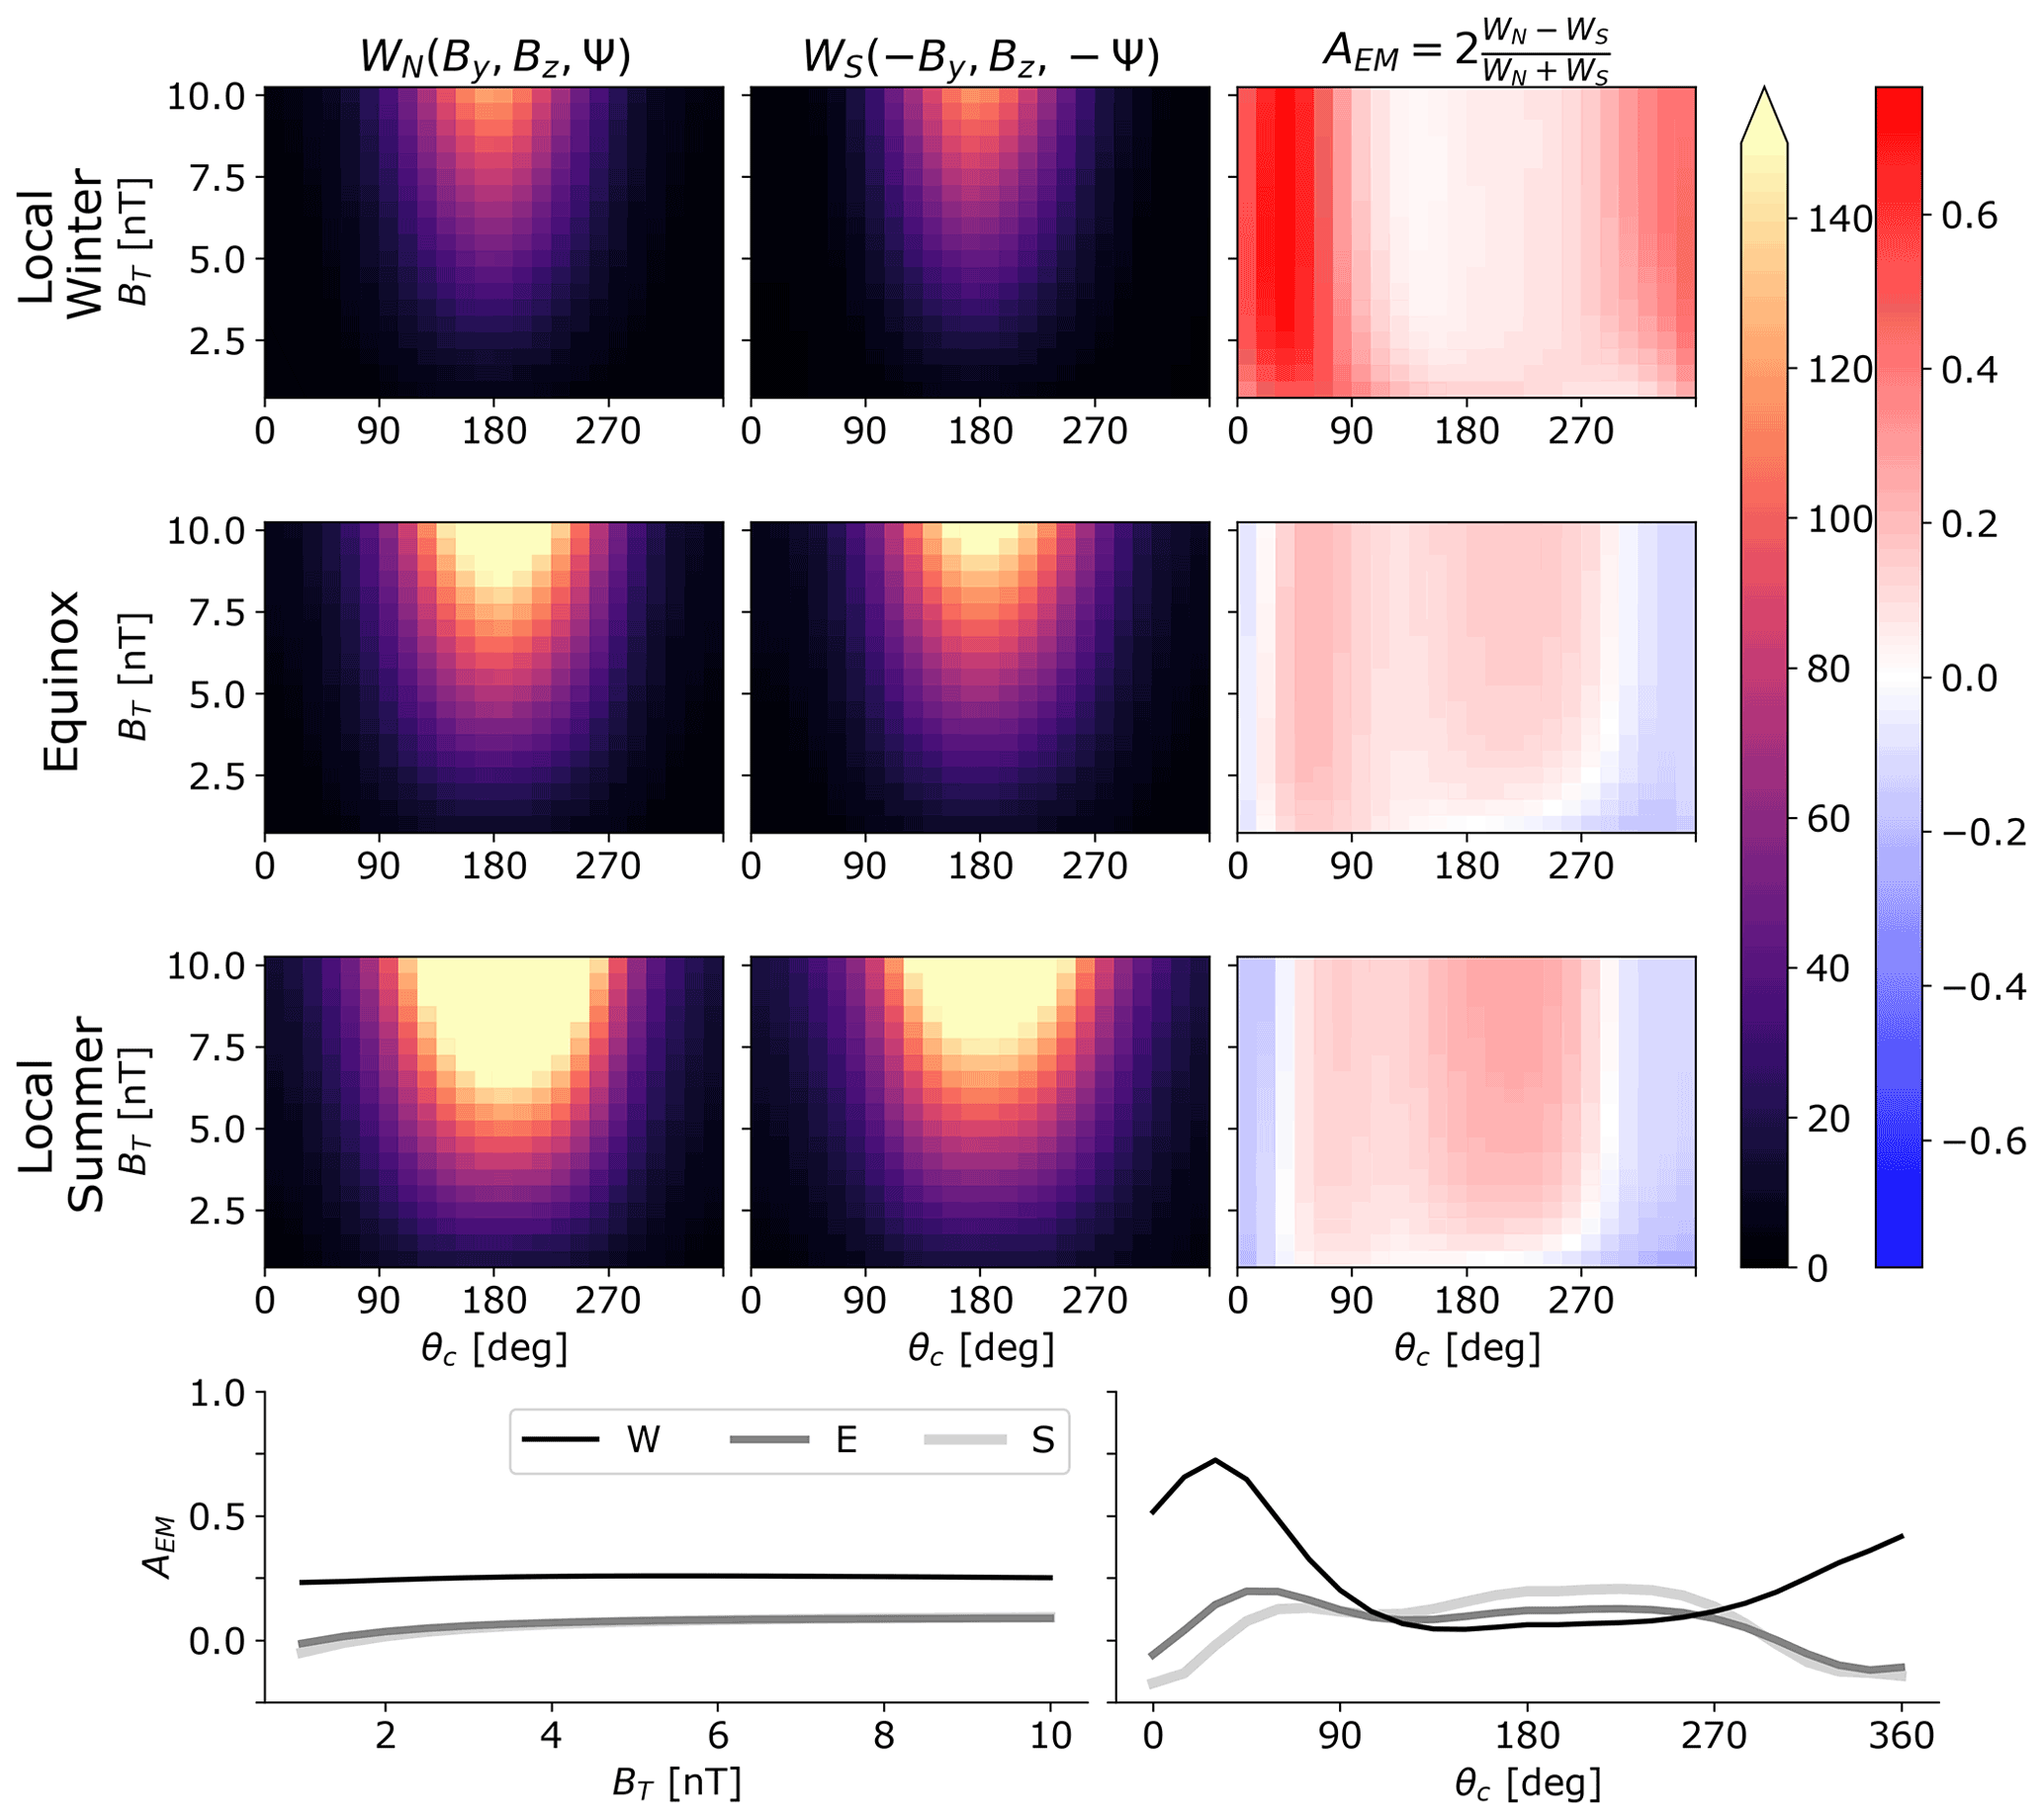
Figure 9Top three rows: integrated hemispheric electromagnetic work in the Northern Hemisphere (left column, WN) and Southern Hemisphere (middle column, WS), as well as hemispheric asymmetry coefficient (right column), as a function of transverse IMF component magnitude BT (y axis) and IMF clock angle θc (x axis). Results for the Southern Hemisphere are shown with the sign of IMF By and dipole tilt Ψ reversed. Results for local winter, equinox, and local summer conditions are respectively shown in the top, middle, and bottom rows. The color bar for WN and WS is in GW, and the color bar for AEM is unitless. Bottom row: the line plots at bottom show the hemispheric asymmetry coefficient AEM from the right column of the top three rows averaged over θc as a function of BT (left) and averaged over BT as a function of θc; local winter, equinox, and local summer are respectively indicated by the lines labeled “W”, “E”, and “S”.
All of the foregoing figures are based on IMF BT=5 nT. To elucidate the relationship between the magnitude of IMF BT and integrated NH and SH electromagnetic work (respectively WN and WS) for different seasons, the top three rows of Fig. 9 show WN (left column) and WS (middle column) as functions of BT and IMF clock angle θc, with the sign of By and dipole tilt Ψ reversed according to Eq. (1). We also define a hemispheric asymmetry coefficient , which is shown in the right column. The bottom row of Fig. 9 shows AEM averaged over θc as a function of BT (left) and averaged over BT as a function of θc.
The first two columns of the top three rows show that WN and WS tend to maximize for θc configurations dominated by negative IMF Bz, as expected, and there is an overall trend toward increasing WN and WS for increasing BT. The right column of the top three rows shows that during equinox and local summer conditions the asymmetry coefficient AEM also tends to maximize for θc configurations dominated by negative IMF Bz. In contrast, during local winter AEM instead maximizes for θc configurations dominated by positive IMF Bz. It is however apparent from Fig. 6 that during local winter for such θc configurations WN and WS are typically no more than a few GW, which is approximately the same order of magnitude as the uncertainty of WN and WS (see Appendix B). The reliability of AEM during local winter for positive Bz-dominated configurations is therefore unclear, although we note the finding of Workayehu et al. (2021) that the largest NH/SH asymmetries in field-aligned and ionospheric currents occur during positive Bz and By during local winter and fall. Regardless of BT, AEM is mostly between 0.05 and 0.3 for θc between approximately 90 and 270°, which corresponds to 1.05–1.35. This confirms that the trend toward higher values of moving from local winter to local summer seen in Figs. 6–8 applies to a wide range of BT values.
In summary Fig. 9 indicates that (i) AEM is mostly independent of BT; (ii) WN and WS maximize and AEM>0 for negative Bz-dominated θc orientations, with a general tendency for AEM to increase from local winter to local summer for BT>=1.5 nT; (iii) averaging over θc, AEM>0 (i.e., the NH is dominant) for most seasons and values of BT; and (iv) AEM shows a weak tendency to increase with increasing BT. Regarding the third point, Workayehu et al. (2020) have reported that the strength of NH ionospheric and field-aligned currents tend to be greater than those in the SH almost irrespective of season.
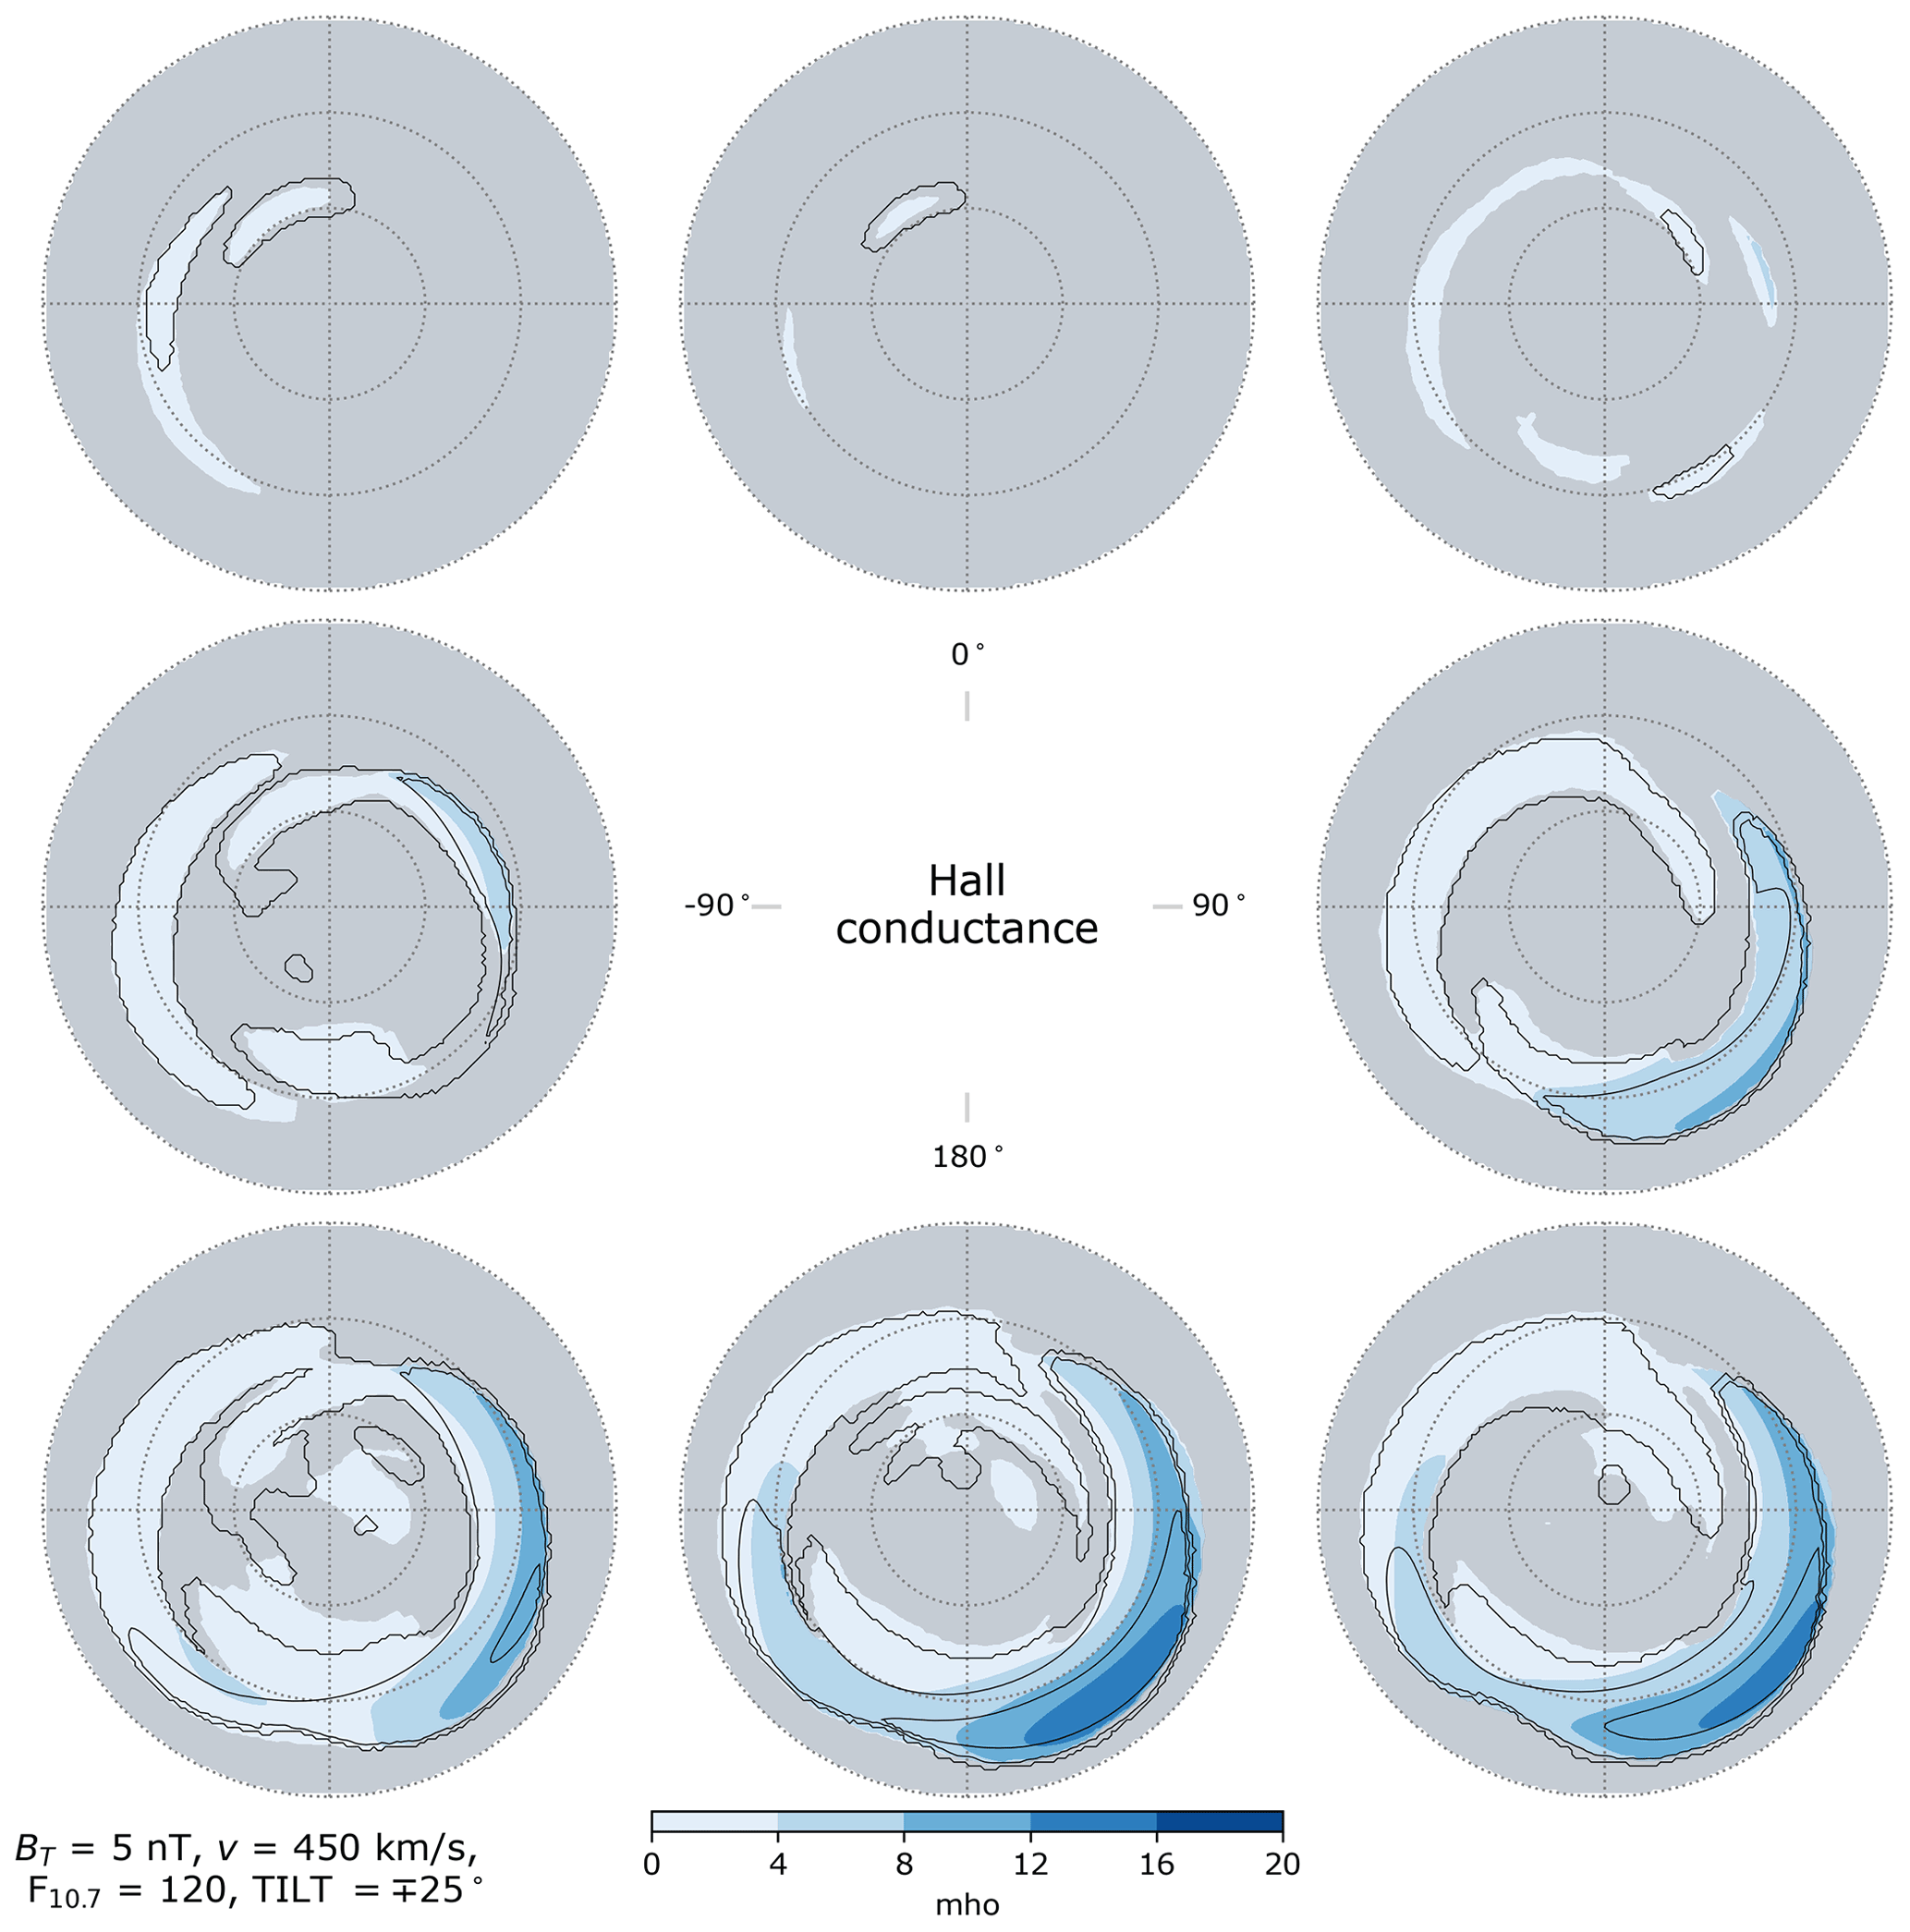
Figure 10Hall conductance in the Northern Hemisphere (colored contours) and Southern Hemisphere (black contour lines) as a function of IMF clock angle for dipole tilt angle (local winter), in the same layout as Fig. 2. Areas where the criteria (Eq. 37) are not met in the Northern Hemisphere are indicated in gray. In contrast to Figs. 2–4 and 6–8, in this figure the contour spacing indicated by the color bar is identical for all panels.
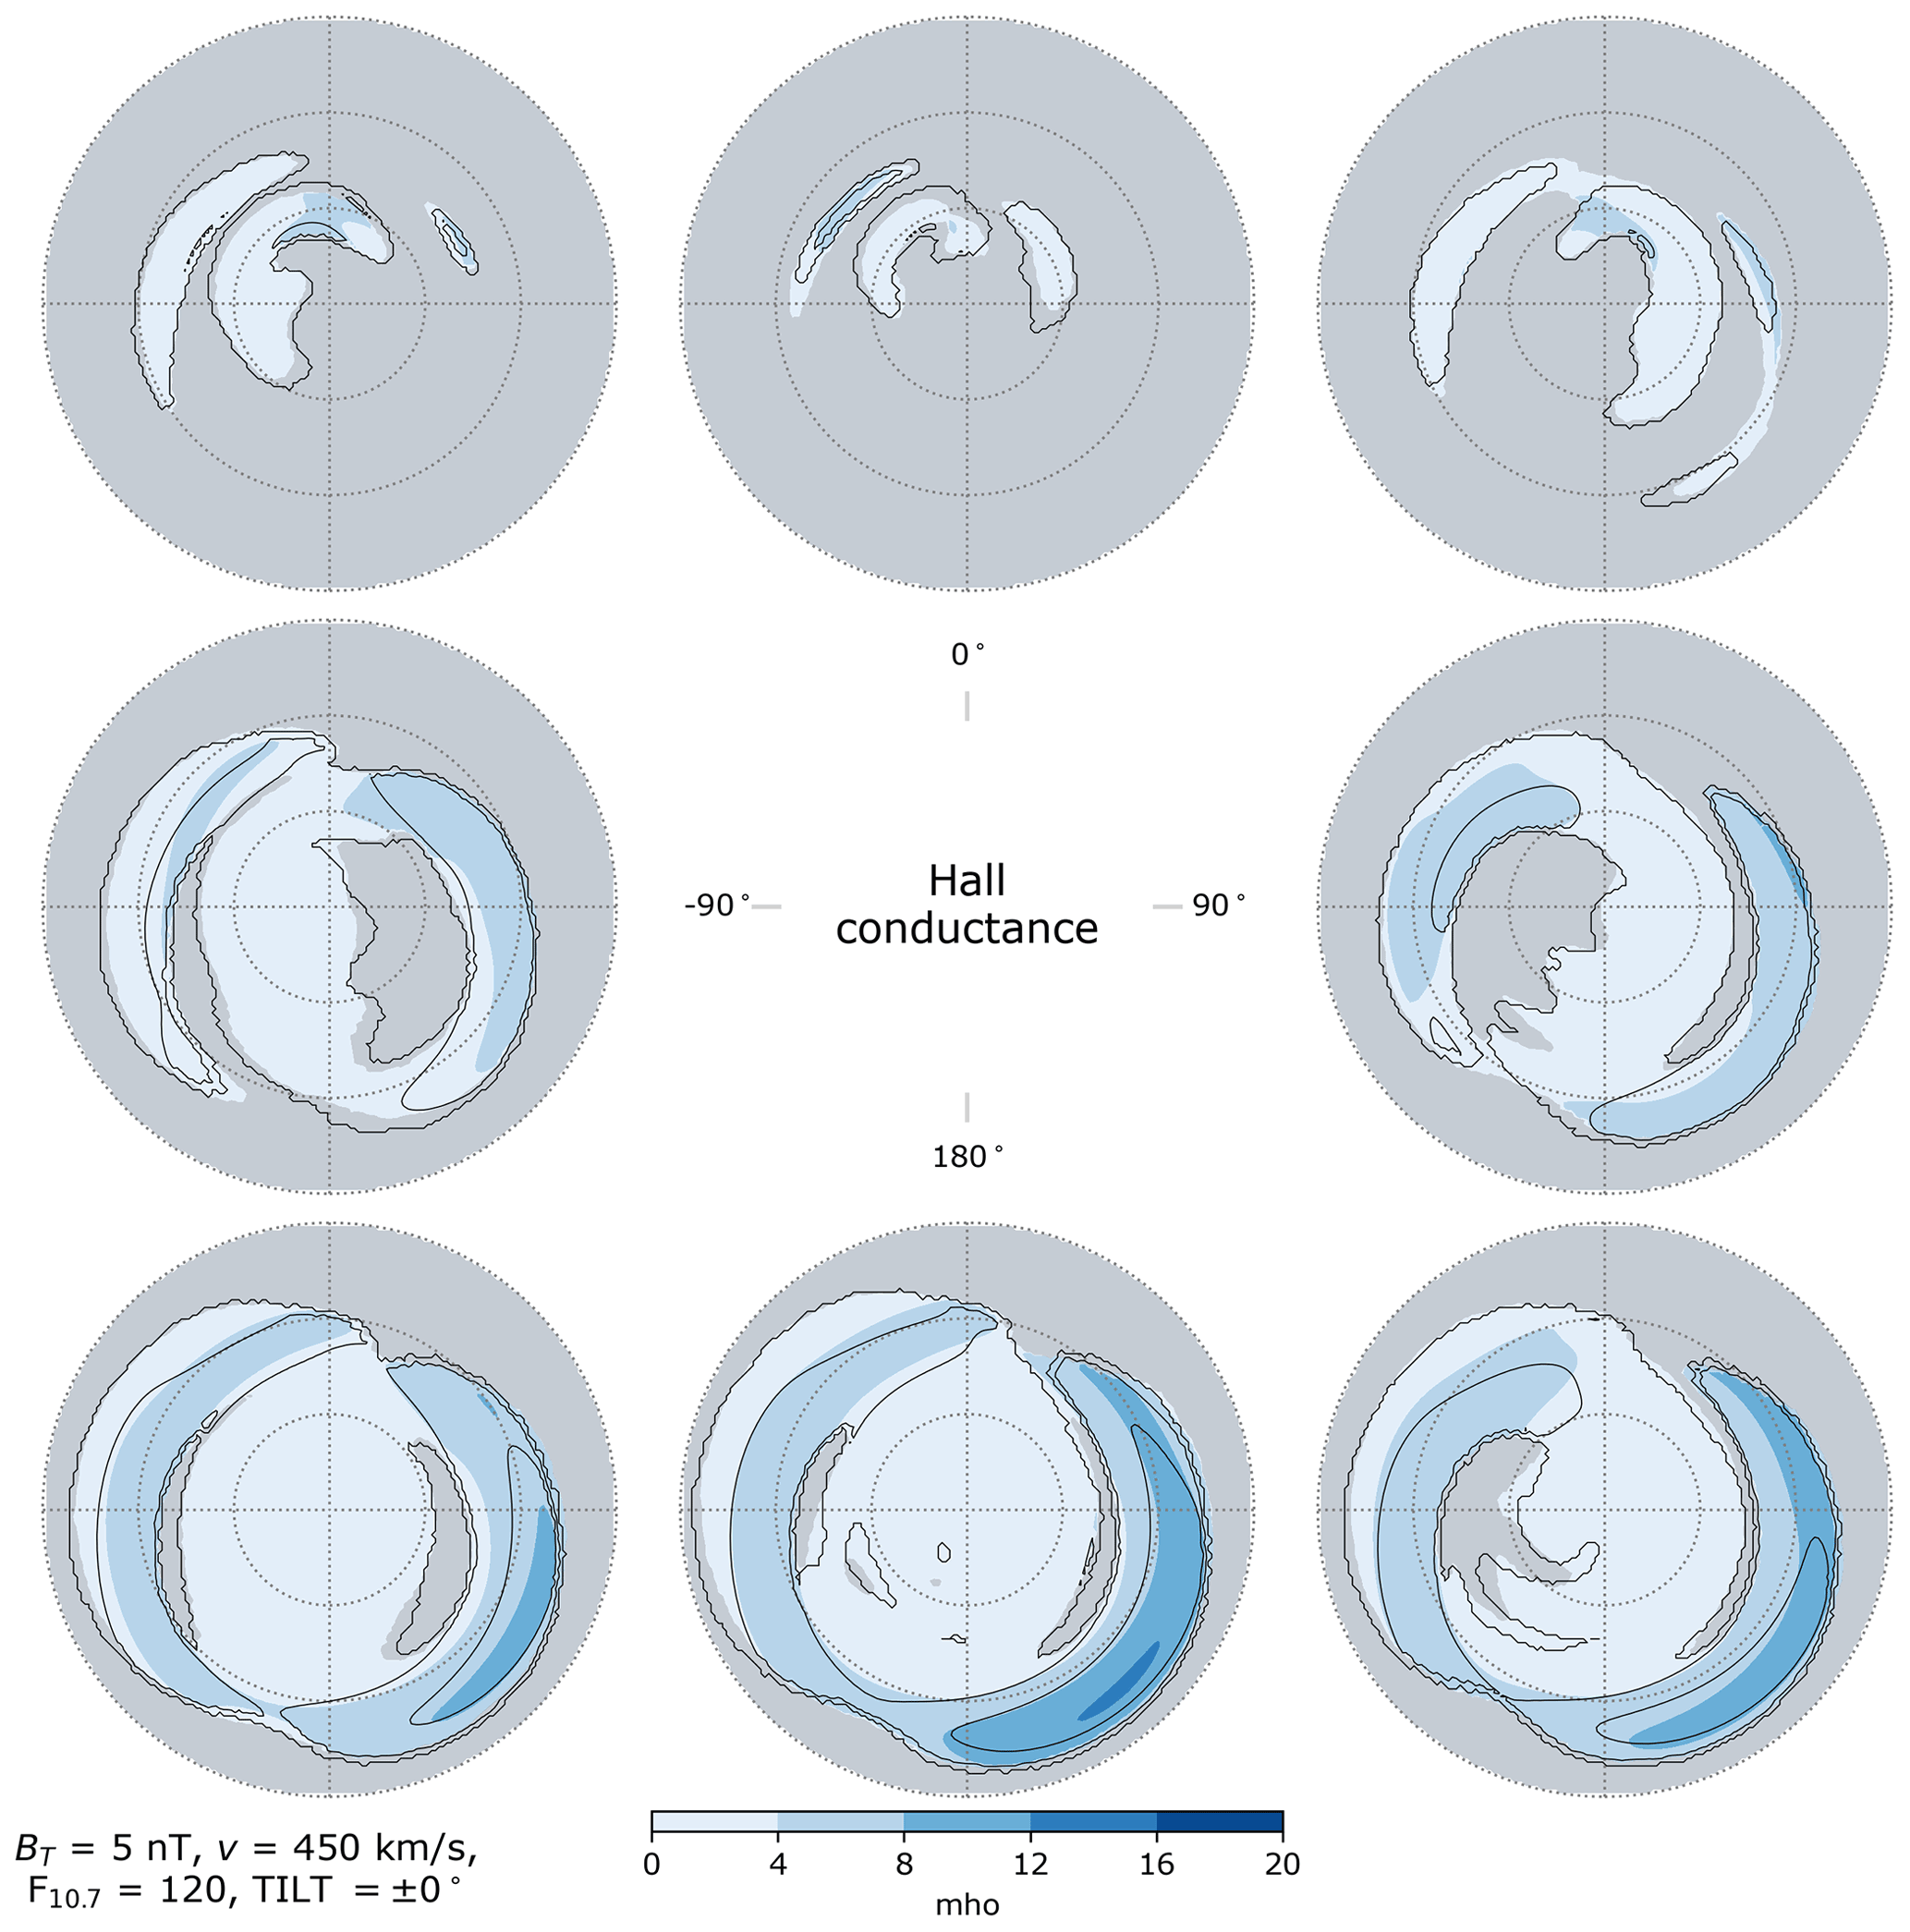
Figure 11Hall conductance in the Northern Hemisphere (colored contours) and Southern Hemisphere (black contour lines) as a function of IMF clock angle for dipole tilt angle Ψ=0° (equinox), in the same layout as Fig. 2. Areas where the criteria (Eq. 37) are not met in the Northern Hemisphere are indicated in gray.
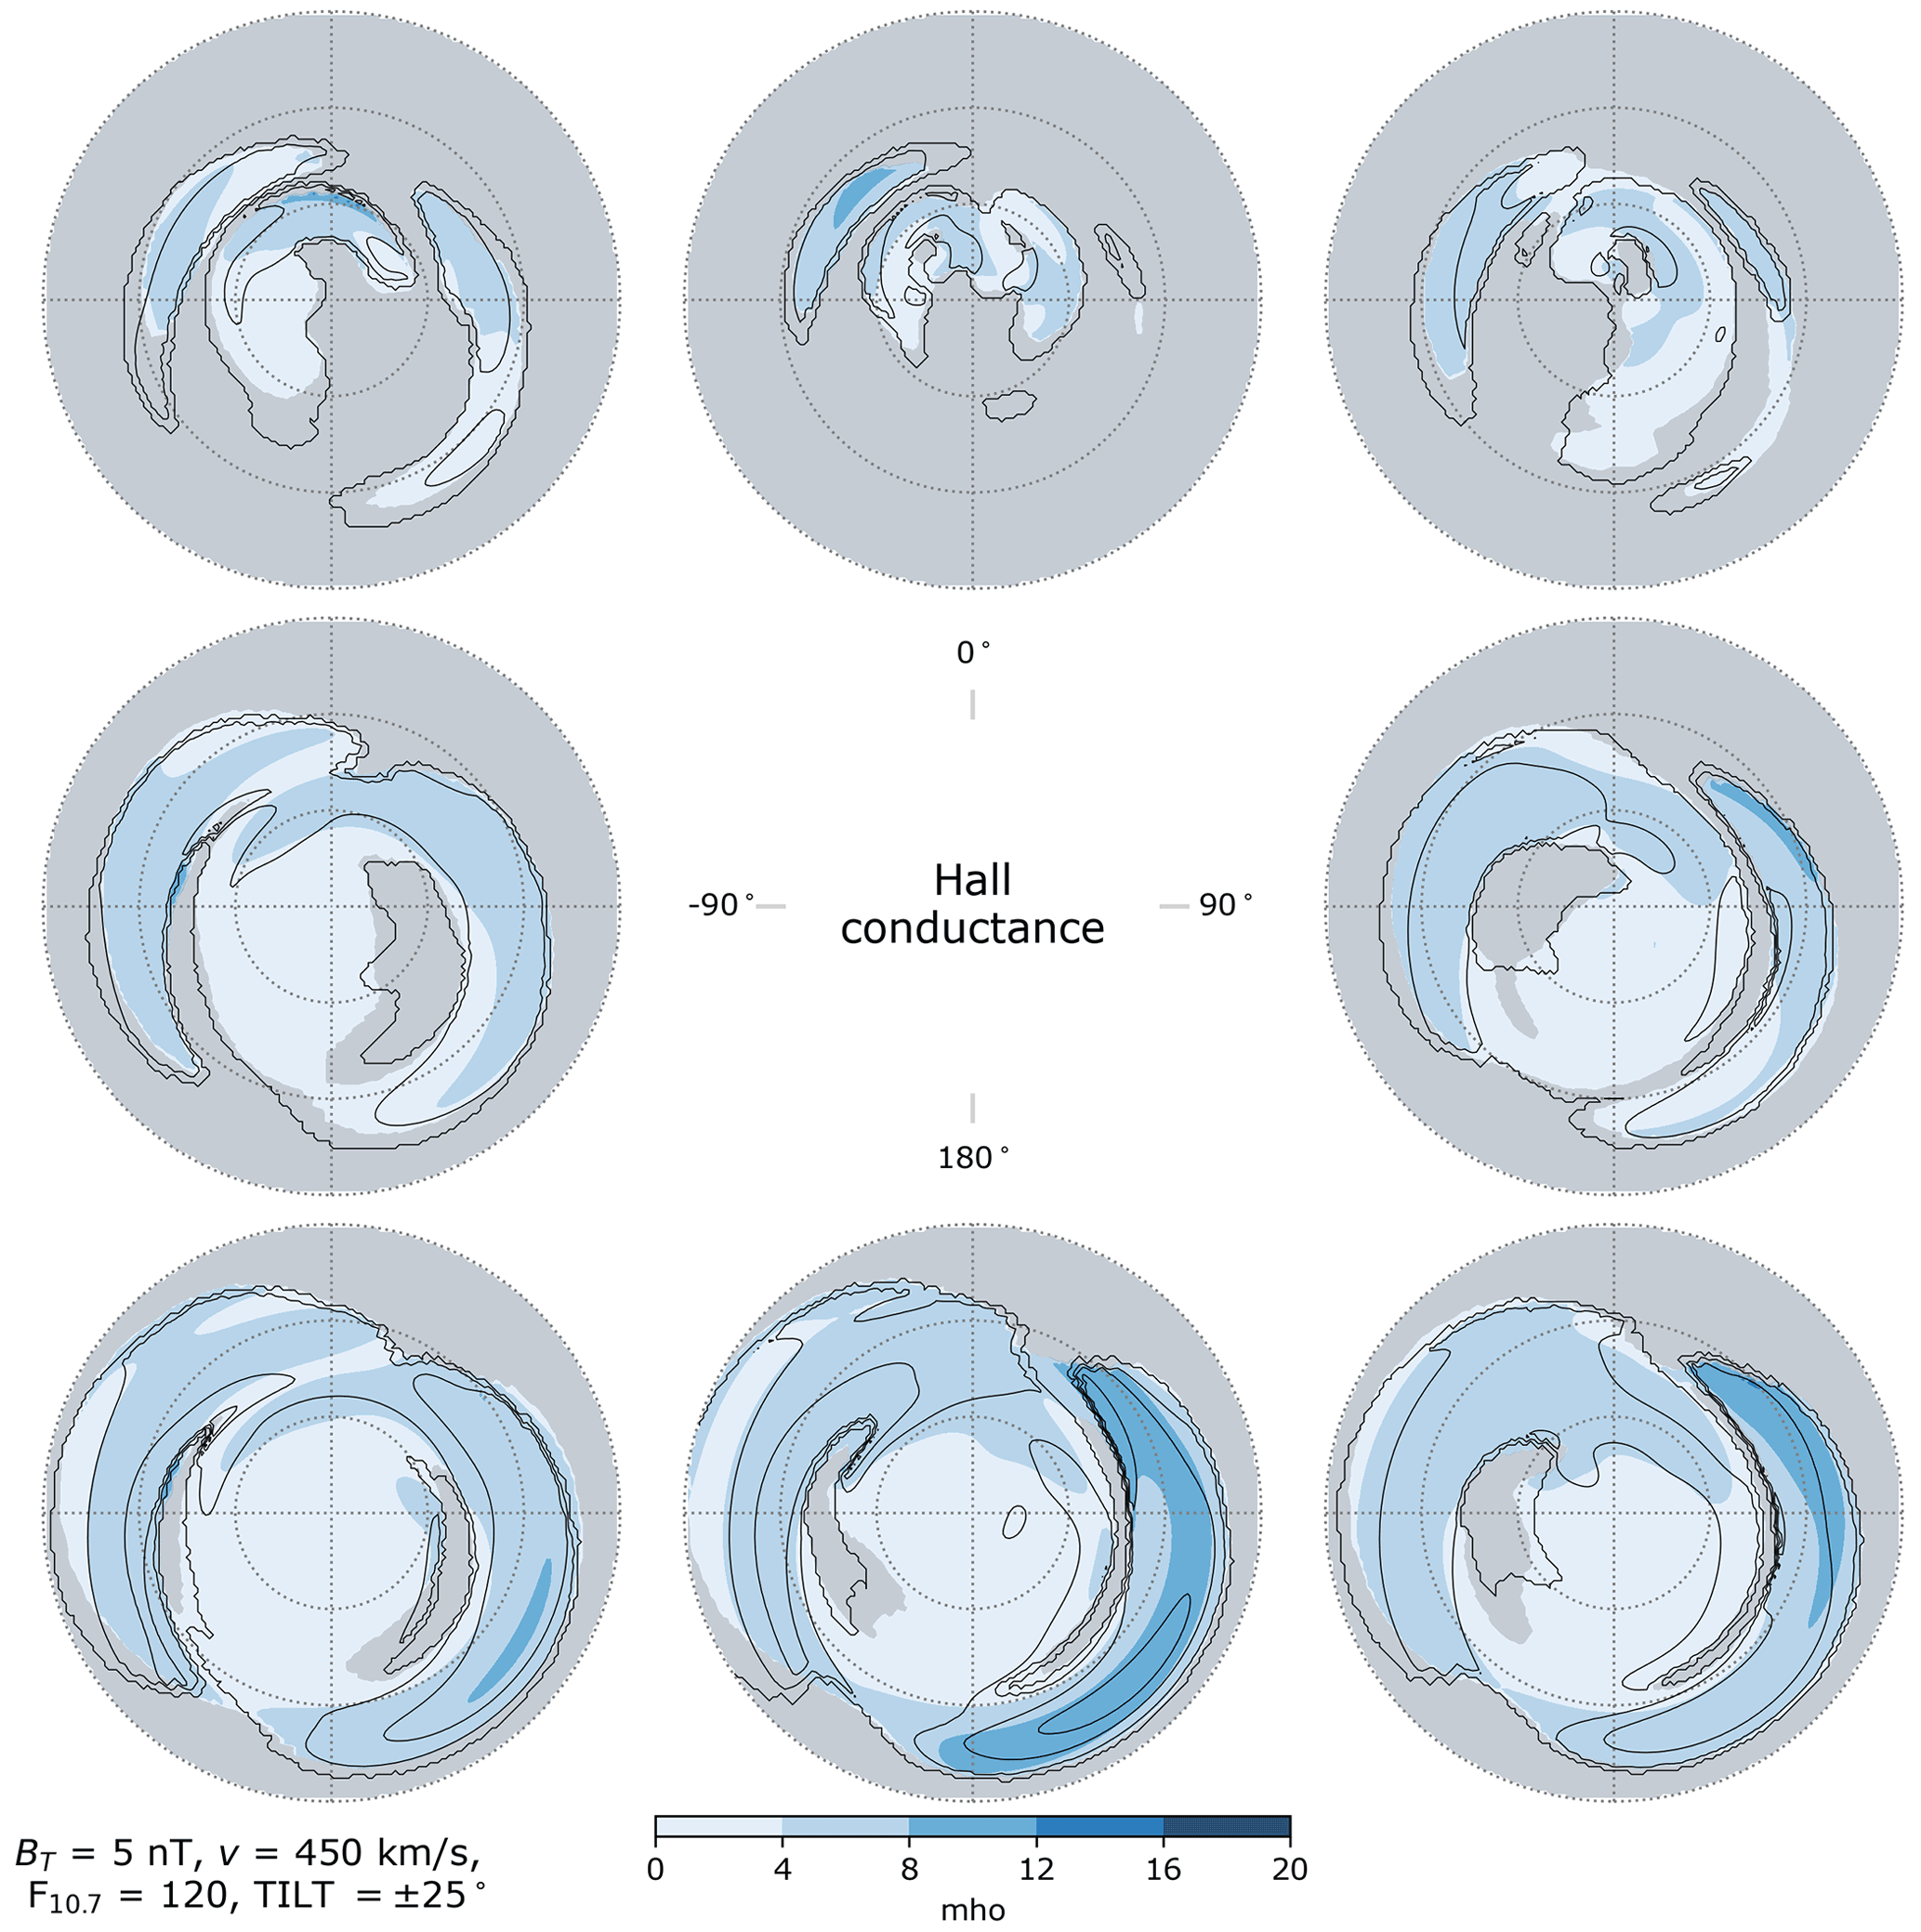
Figure 12Hall conductance in the Northern Hemisphere (colored contours) and Southern Hemisphere (black contour lines) as a function of IMF clock angle for dipole tilt angle (local summer), in the same layout as Fig. 2. Areas where the criteria (Eq. 37) are not met in the Northern Hemisphere are indicated in gray.
5.2 Hall conductance
Figures 10–12 show distributions of Hall conductance in each hemisphere. Regions where the criteria (Eq. 37) are not met in the NH are indicated in gray. (Regions where these criteria are not met in the SH are similar to those in the NH and are shown in Figs. S1–S3 of the Supplement.) In examining these figures one must observe that within the gray regions where the criteria (Eq. 37) are not met, the conductances are not necessarily low and indeed may maximize. Furthermore, since the regions where the criteria are met in general reflect the regions where the electromagnetic work exceeds 0.5 mW m−2, the outermost contours in both NH and SH distributions therefore primarily indicate the boundary of where the criteria are met. These contours are therefore not useful for assessing hemispheric differences.
Bearing the foregoing in mind, we observe a general tendency in predicted distributions of ΣH in both hemispheres to increase with increasingly negative Bz-dominated θc configurations, regardless of season, i.e., in all three of Figs. 10–12. There is also a general tendency toward increased ΣH on the dayside as the season shifts from local winter to local summer.
We now turn to the response of the NH and SH distributions of ΣH on the nightside (18:00–06:00 MLT) over auroral latitudes (60–75° MLat) to different IMF orientations. In the NH, for θc orientations involving either zero or positive IMF By and either zero or negative IMF Bz (middle right, bottom right, and bottom center panels in Figs. 10–12), both the average Hall conductance and the spatial variability of Hall conductances within this region are highest during winter and lowest during summer. It is primarily during local winter that Hall conductances above 10 mho occur on the nightside in the NH. In contrast, for the θc orientations shown in the middle left and lower left panels of Figs. 10–12 (negative By in the NH and positive By in the SH, and either zero or negative Bz), the average nightside Hall conductance between 60 and 75° MLat is lowest during local winter and highest during local summer in both hemispheres.
In the SH, for all θc orientations for which IMF Bz is zero or negative the average nightside Hall conductance between −60° and −75° MLat is generally less responsive to changes in season, but tends to increase moving from local winter to local summer. The standard deviation of Hall conductances for these θc orientations within this same region (18:00–06:00 MLT and −75 to −60° MLat) is likewise lowest during local winter and highest during local summer. We obtain the standard deviation by first calculating the Hall conductances at points on a spherical grid with spacing of approximately 0.24 MLT and 0.3° MLat; the standard deviation is then calculated from all points within this region at which the criteria (Eq. 37) are met.
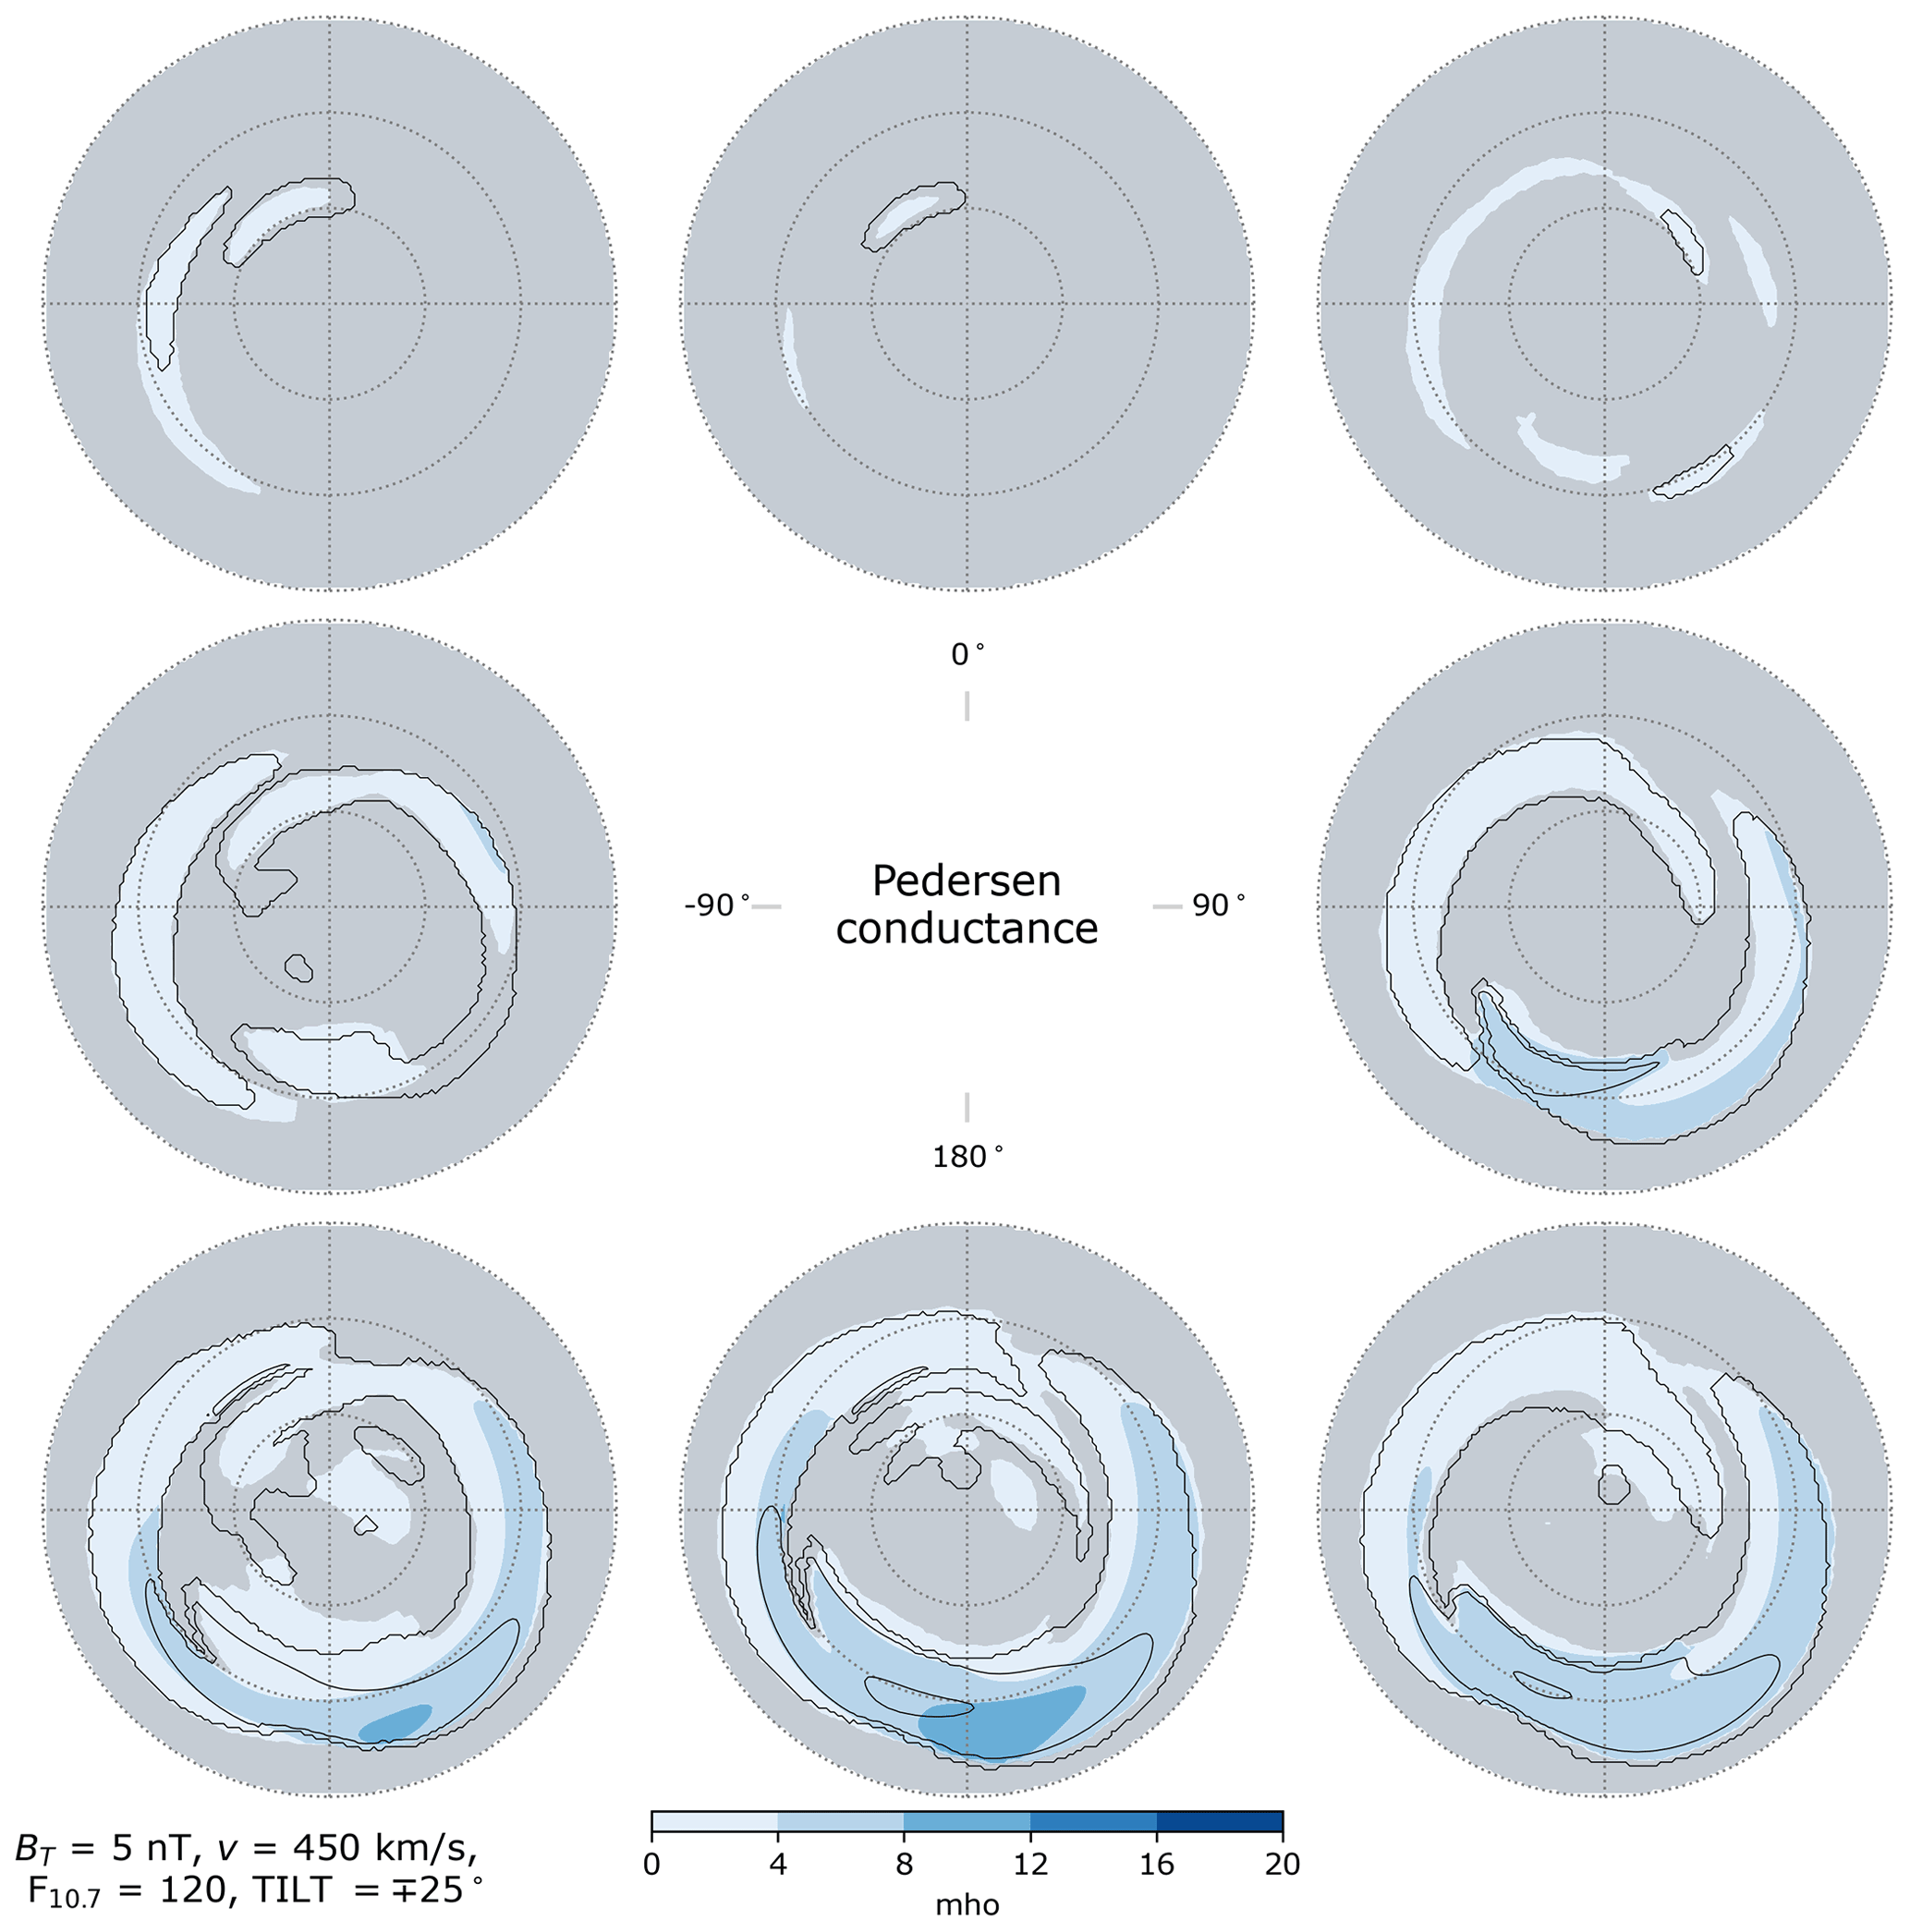
Figure 13Pedersen conductance in the Northern Hemisphere (colored contours) and Southern Hemisphere (black contour lines) as a function of IMF clock angle for dipole tilt angle (local winter), in the same layout as Fig. 2. Areas where the criteria (Eq. 37) are not met in the Northern Hemisphere are indicated in gray. In contrast to Figs. 2–4 and 6–8, in this figure the contour spacing indicated by the color bar is identical for all panels.
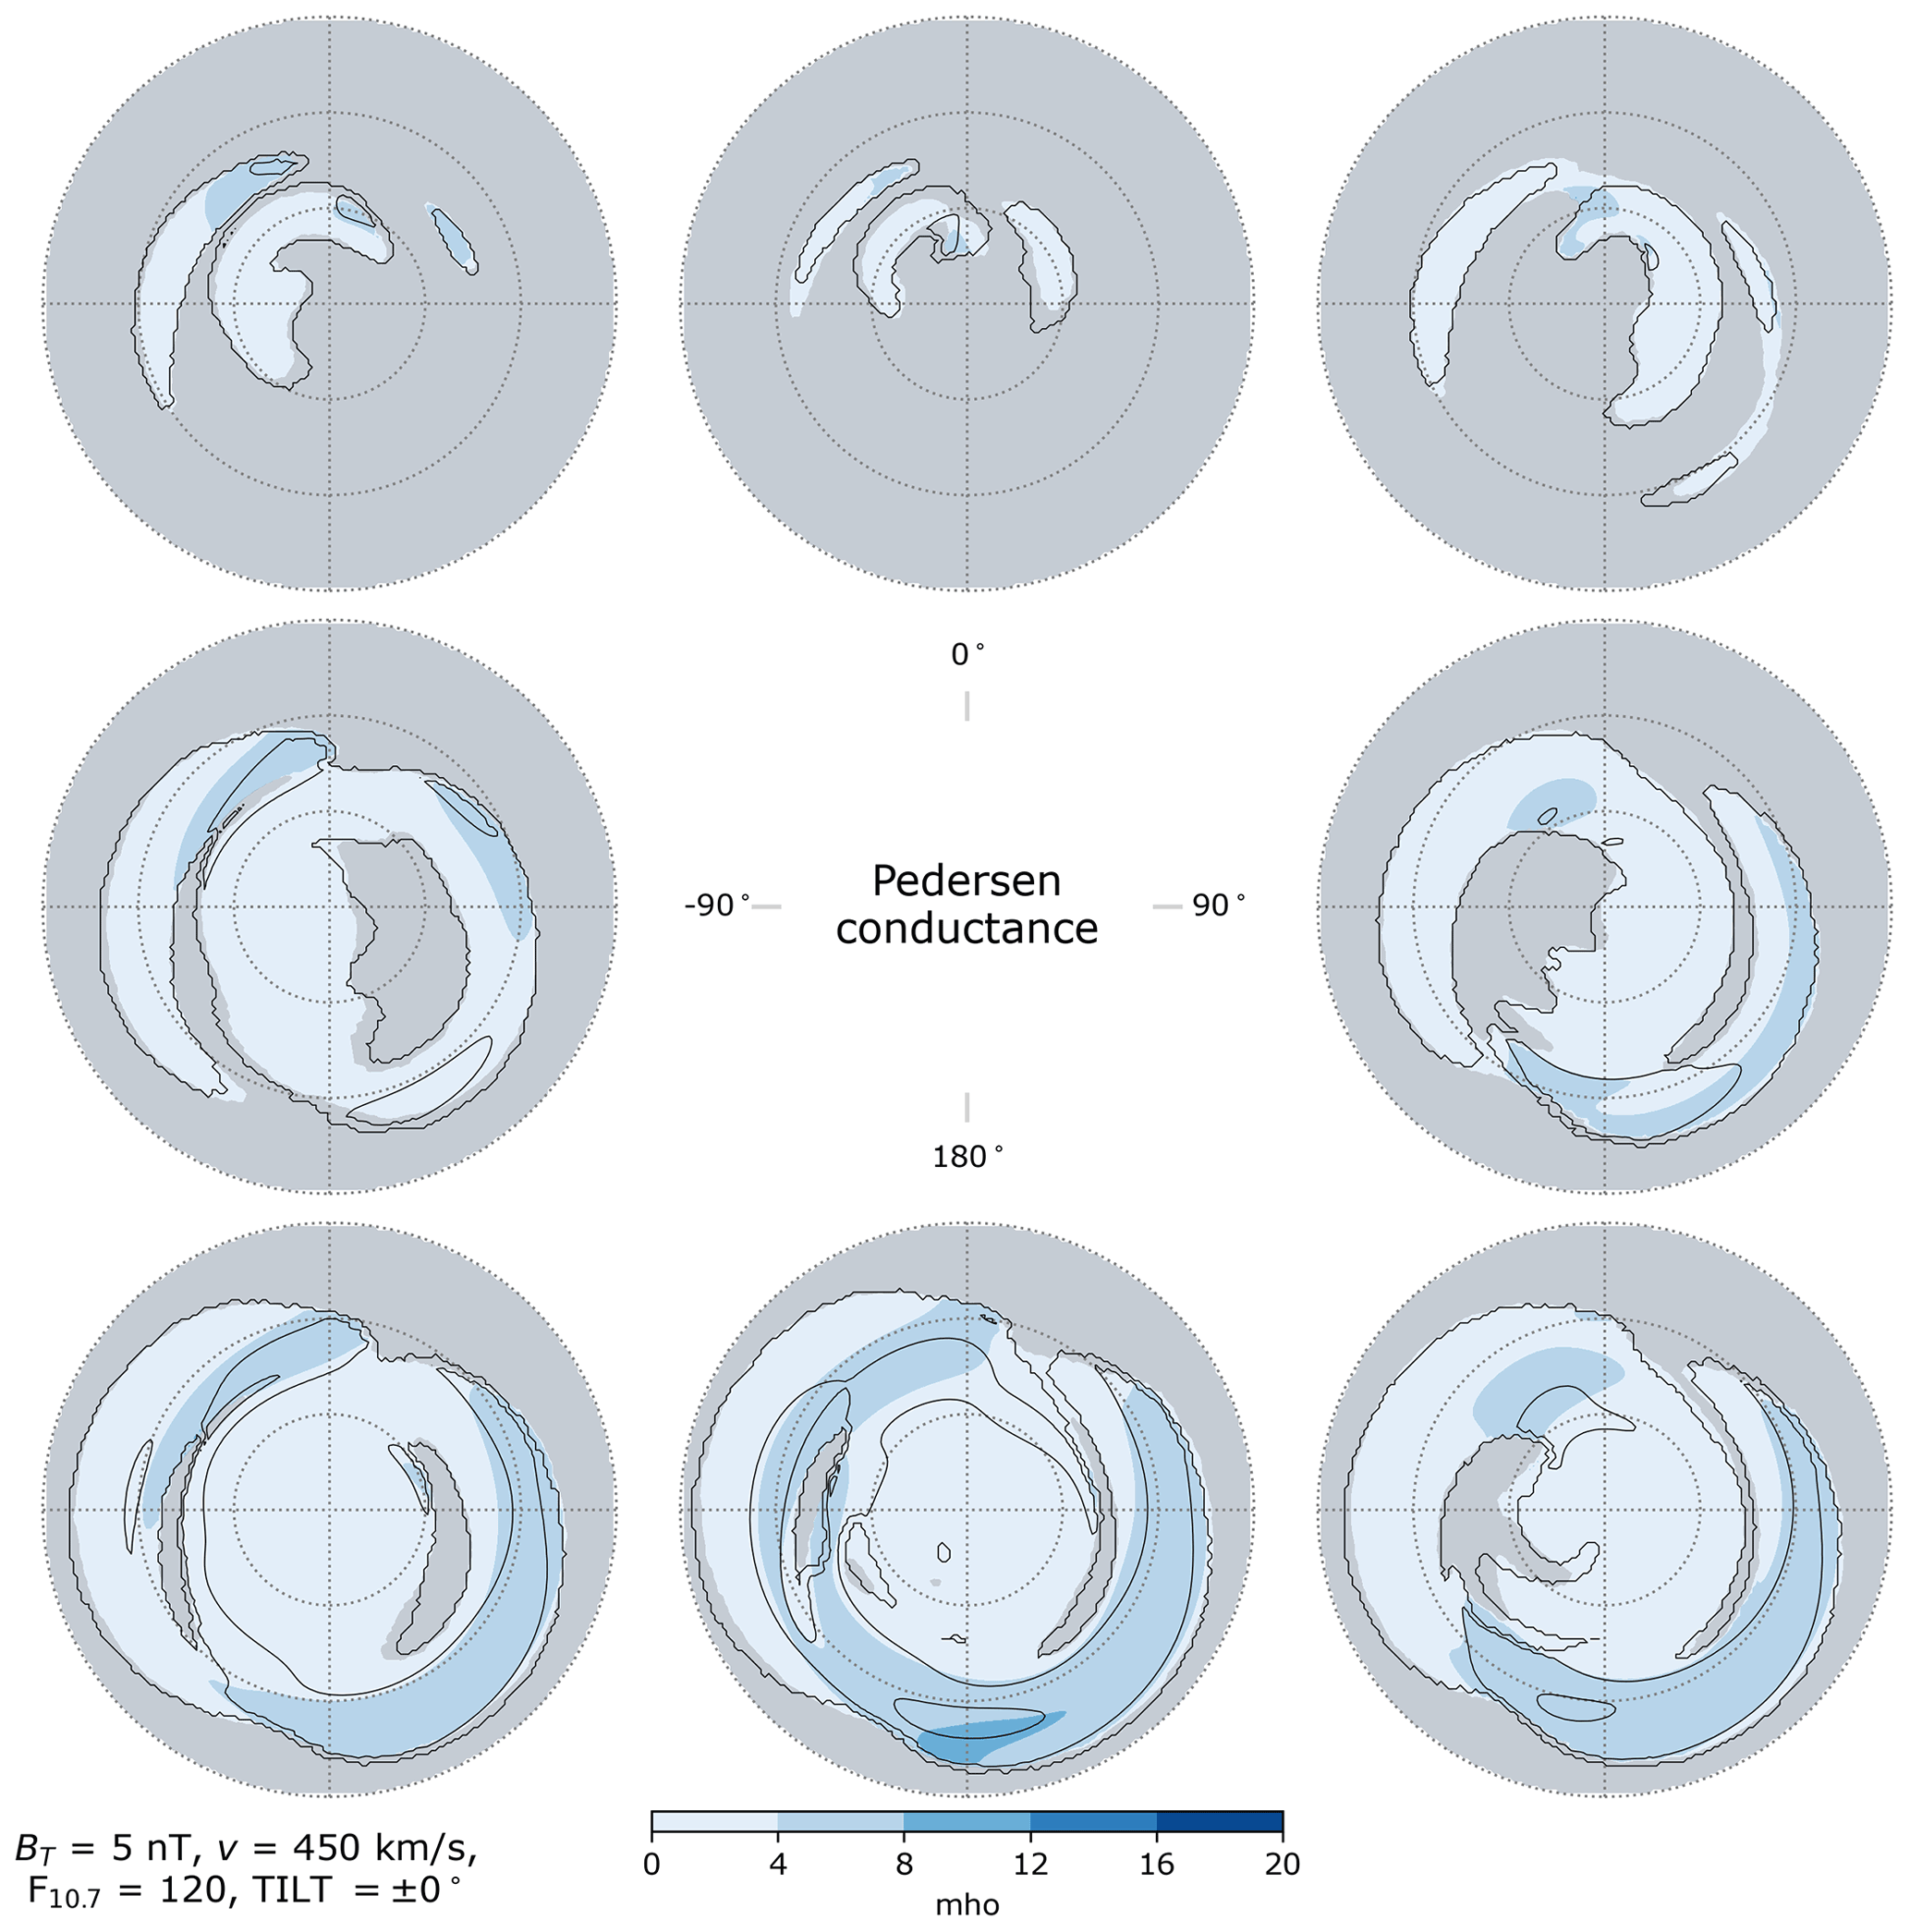
Figure 14Pedersen conductance in the Northern Hemisphere (colored contours) and Southern Hemisphere (black contour lines) as a function of IMF clock angle for dipole tilt angle Ψ=0° (equinox), in the same layout as Fig. 2. Areas where the criteria (Eq. 37) are not met in the Northern Hemisphere are indicated in gray.
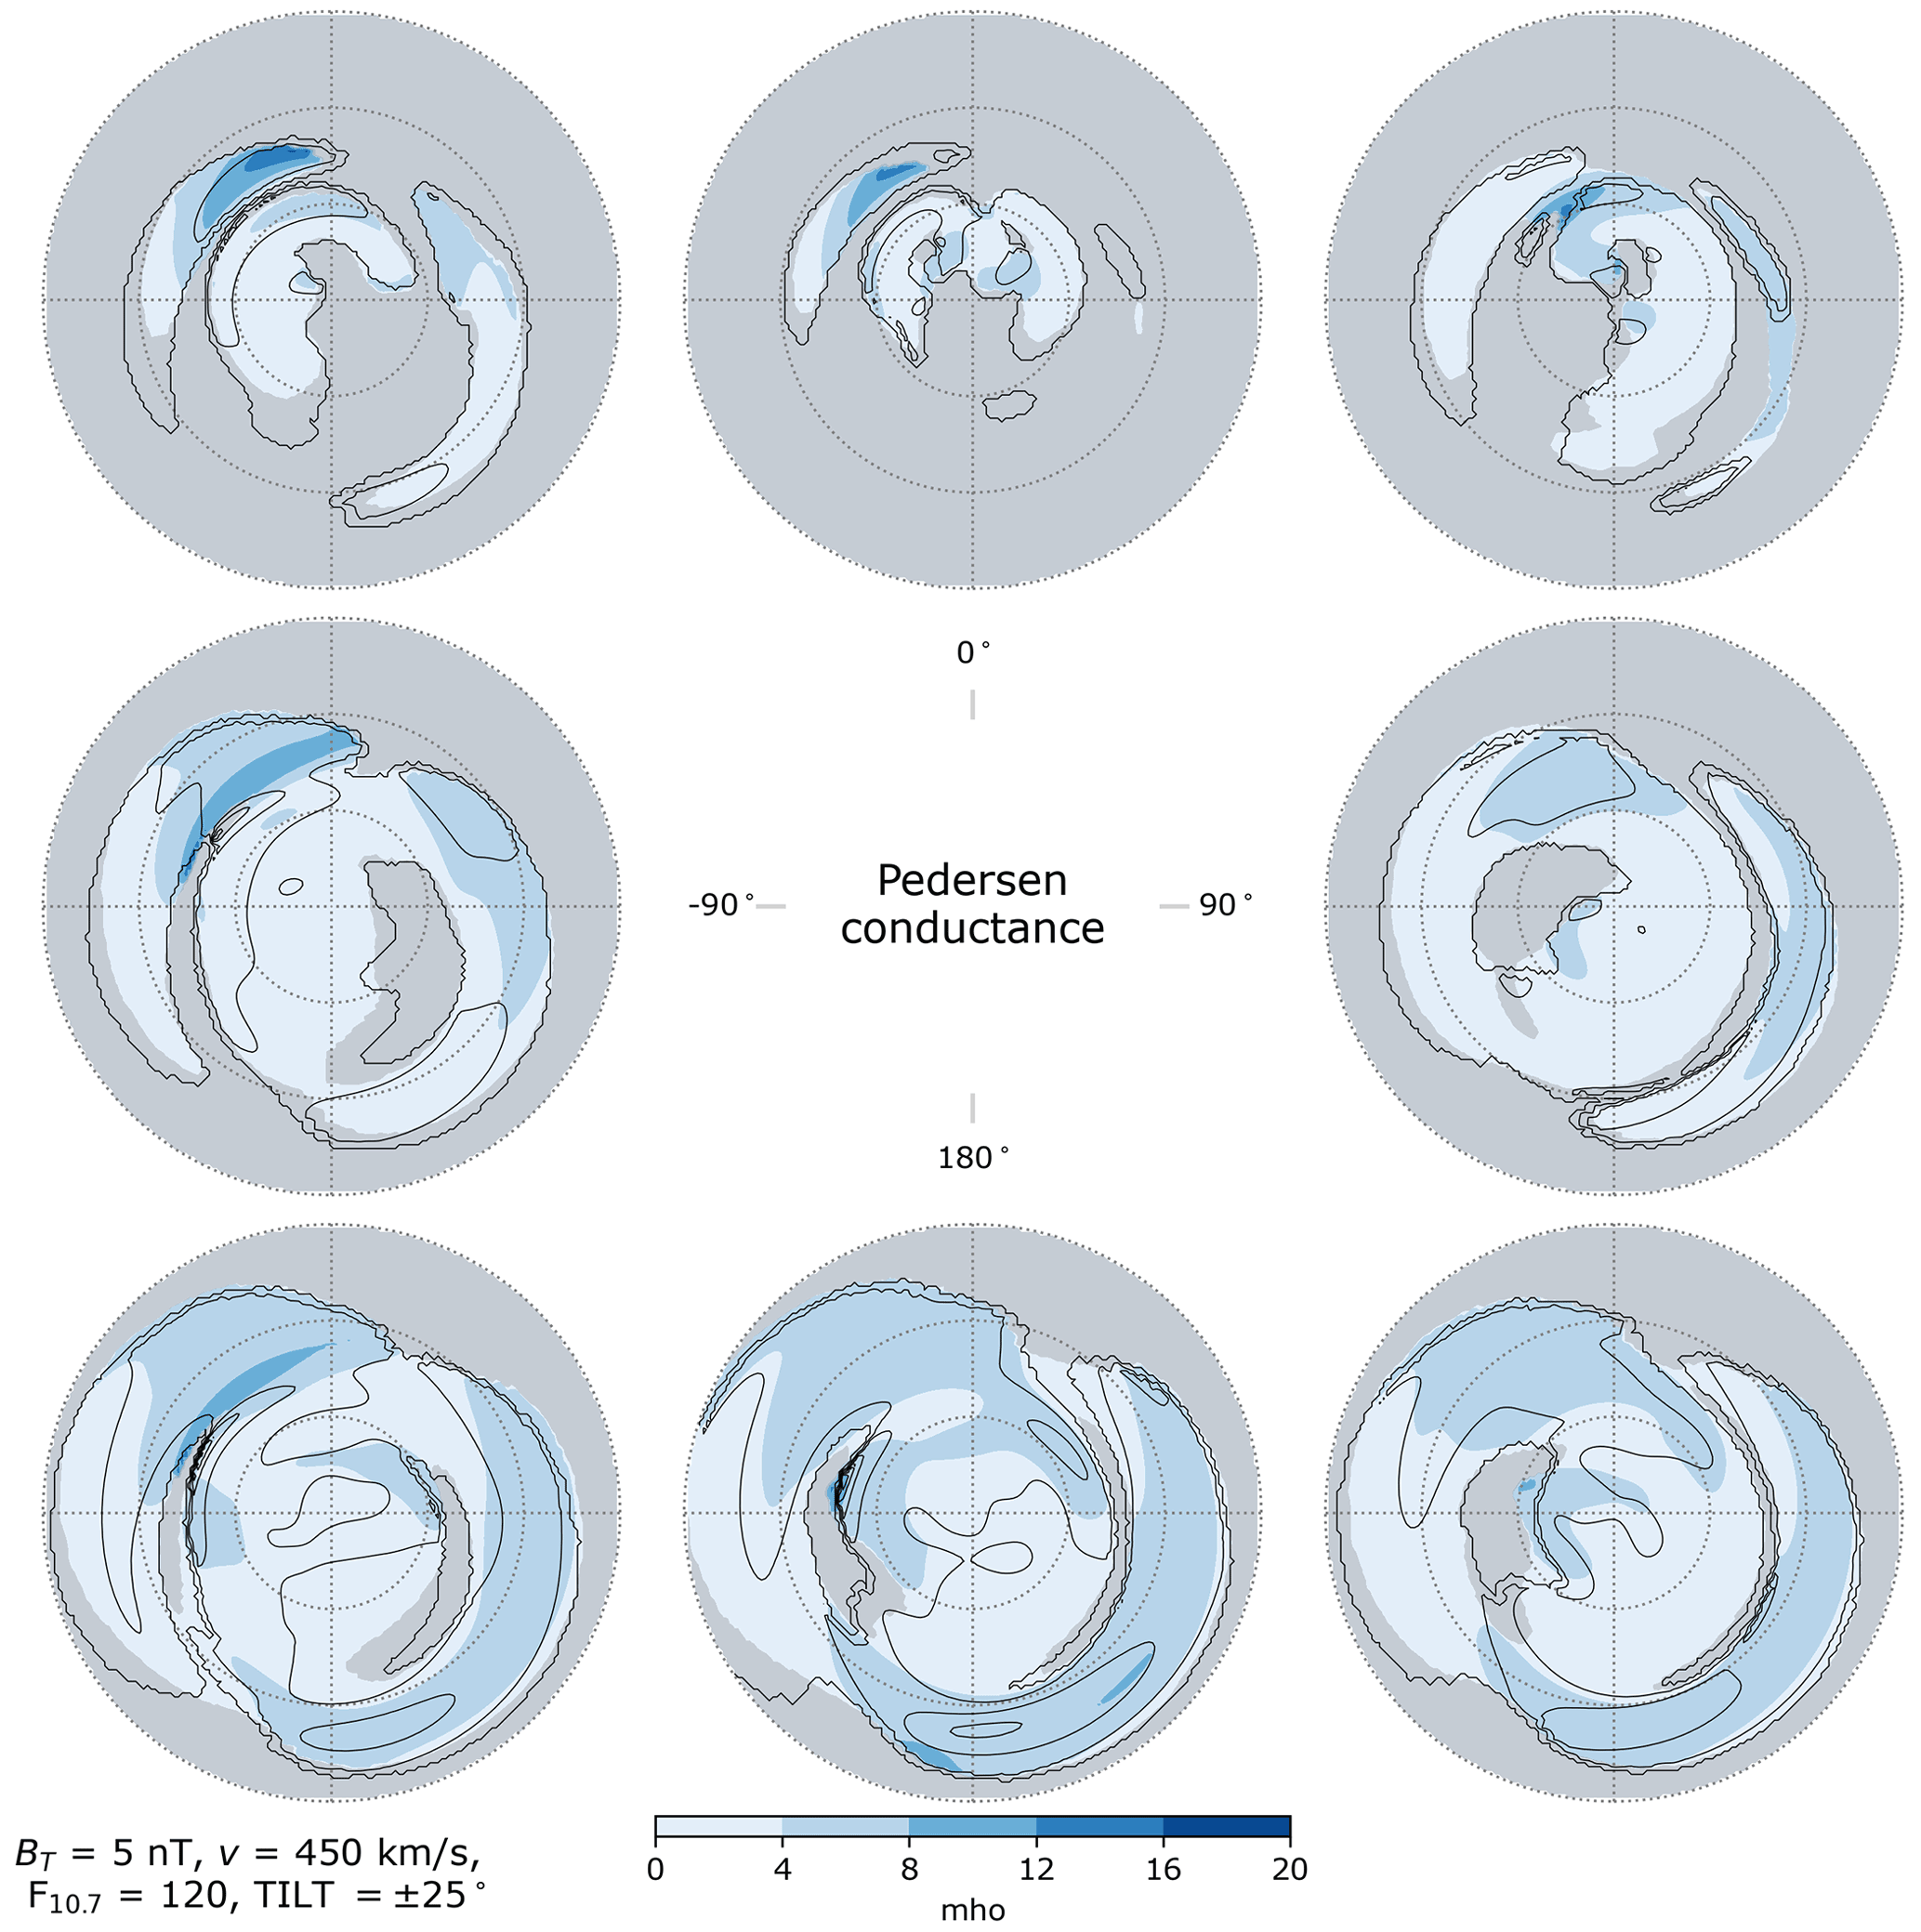
Figure 15Pedersen conductance in the Northern Hemisphere (colored contours) and Southern Hemisphere (black contour lines) as a function of IMF clock angle for dipole tilt angle (local summer), in the same layout as Fig. 2. Areas where the criteria (Eq. 37) are not met in the Northern Hemisphere are indicated in gray.
5.3 Pedersen conductance
Figures 13–15 show distributions of Pedersen conductance in each hemisphere. As in Figs. 10–12, regions where the criteria (Eq. 37) are not met in the NH are indicated in gray. The same word of caution in examining the distributions of Hall conductances applies to examination of the distributions of Pedersen conductances.
For purely positive IMF By (middle right) and for all three orientations of θc involving a negative Bz component (three bottom panels), the average nightside Pedersen conductance over auroral latitudes in the NH is highest during local winter (Fig. 13) and lowest during local summer (Fig. 15). The exception is purely negative IMF By (middle left), for which the nightside Pedersen conductance shows a slight tendency to increase moving from local winter to local summer
In contrast, over the corresponding region in the SH the average Pedersen conductance is lowest during local winter and highest during local summer; the interested reader is referred to Figs. S4–S6 in the Supplement, where the variation in the SH distributions of Pedersen conductance is shown more clearly than in Figs. 13–15.
We also observe that on the dayside the Swipe model predicts that the highest Pedersen conductances tend to occur at post-noon MLTs poleward of ± 70°, particularly for positive IMF Bz and negative IMF By in the NH (positive IMF By in the SH). Dayside Pedersen conductances also tend to be higher for negative IMF By in the NH (positive IMF By in the SH) regardless of the sign of IMF Bz. These enhanced Pedersen conductances could be related to the frequently appearing afternoon hot spot in Joule heating reported by Cai et al. (2016); they might also suggest that such hot spots are related to the effects of IMF By.
In the literature one encounters different approaches to the topic of symmetry between the two hemispheres that may be roughly separated into two categories: those that examine asymmetries in the NH and SH under complementary conditions of tilt angle and IMF By and those that concentrate on instantaneous asymmetries that are driven, to a large extent, by differences in conductance between the summer and winter hemispheres (but also by tilt angle Ψ and IMF By, whose values are not mirrored). This study belongs to the former category. The goal of this study is to determine to what extent key descriptors of ionosphere–thermosphere electrodynamics, such as the ionospheric potential, the cross-polar cap potential, electromagnetic work, and ionospheric conductances, obey the mirror symmetry condition given by Eq. (1). To achieve this goal, we have developed a new empirical model of ionospheric convection based on Swarm TII cross-track measurements in an Earth-fixed frame, and we combined the outputs of this model with outputs from the empirical AMPS model that is based on Swarm and CHAllenging Mini-satellite Payload (CHAMP) magnetometer measurements.
Regarding the suitability of Swarm TII measurements for development of an empirical ionospheric convection model, Lomidze et al. (2019, 2021) showed that Swarm TII cross-track measurements and corresponding model outputs from the Weimer (2005) empirical model are very similar in a climatological sense. On the other hand, Lomidze et al. (2021) found that the along-track drifts measured by vertical and horizontal TII sensors in general do not agree and are significantly different from the along-track drifts predicted by the Weimer (2005) model, which, among other things, clearly show anti-sunward flow across the polar cap. They concluded, “Overall, the results for the TII along-track indicate that some large-scale features in that component of ion convection cannot be captured by the current version of the Swarm along-track drift measurements, and data from the [vertical and horizontal] sensors can be different”. For these reasons, we have chosen to exclude along-track drift measurements in deriving the Swarm Hi-C model. The predicted along-track component of ionospheric convection therefore relies heavily on our assuming a potential electric field (Eq. 21) and by imposing the constraint discussed in Sect. 3.2, and it should here be emphasized that we have not explicitly validated Swarm Hi-C model predictions of along-track convection. Since the along-track component is not constrained by measurements (see Sect. 3), the uncertainty of the along-track convection predicted by Swarm Hi-C must of necessity be larger. A more complete discussion of issues with along-track ion drift measurements is given by Lomidze et al. (2021).
Astute readers will notice in Sect. 3.2 that Swarm TII ion drift measurements are calibrated based on QD coordinates, while the zero-potential constraint applied to the Swarm Hi-C model is based on MA-110 coordinates. We use MA-110 coordinates because these coordinates are constant along Earth's magnetic field lines, whereas QD coordinates are not. Laundal and Richmond (2017) explain that, in practice, the difference is essentially the reference height to which the dipole mapping is done, and the interested reader is referred to their review. For our purposes, it is sufficient to note that at Swarm altitudes of 400–500 km, an MA-110 latitude of 47° corresponds to QD latitudes of ∼ 45.4–45.8°.
The only other study of which we are aware that presents global empirical models of these descriptors of ionosphere–thermosphere (IT) electrodynamics is the work of Weimer and Edwards (2021) (hereafter WE21). An important difference between the Swarm Hi-C and AMPS models and the empirical models that they use is that the former do not assume any form of hemispheric asymmetry, whereas the ionospheric potential model used by WE21 does assume hemispheric mirror symmetry, and the Weimer (2013) model of divergence-free currents used by WE21 is based solely on NH ground magnetometer measurements. Thus while the results presented by WE21 represent an important step toward a fuller understanding of high-latitude IT electrodynamics, the empirical models they use cannot be employed for testing the degree to which the abovementioned descriptors of IT electrodynamics exhibit mirror symmetry between hemispheres.
In Sect. 4.1 we found that the most apparent deviations from mirror symmetry between the two hemispheres tend to occur under θc orientations for which Bz>0. There is also a general tendency for the CPCP in the NH to exceed the CPCP in the SH by several percent, as shown primarily in Fig. 5 but also in Figs. 2–4. Since Apex coordinates take stock of geometric differences such as the different polar cap areas in the two hemispheres, these deviations may be attributable to real differences in polar cap convection speeds due to hemispheric differences in, for example, lobe reconnection, as described by both Reistad et al. (2021) and Pettigrew et al. (2010) as well as references in those studies. Regardless of the explanation, the CPCP is primarily useful as a general diagnostic, the interpretation of which can be complicated.
Our finding that the potentials in the two hemispheres do not exactly obey the mirror symmetry condition (Eq. 1) is not new; it has been pointed out by at least Pettigrew et al. (2010) and Förster and Haaland (2015). One important difference between these two earlier studies and our results, however, is that although Pettigrew et al. (2010) and Förster and Haaland (2015) both find that the SH CPCP exceeds the NH CPCP for purely negative IMF Bz conditions – in the former study by 0–12 kV and in the latter by ∼ 5 kV – we find that for purely negative IMF Bz conditions the SH CPCP only exceeds the NH CPCP during local winter.
Besides the comparison of distributions of electromagnetic work that we have carried out in Sect. 5, we are not aware of any work that directly examines how well the assumption of mirror symmetry holds for electromagnetic work in each hemisphere. We have concluded on the basis of Figs. 6–8 that mirror symmetry mostly holds in the two hemispheres, with hemispheric differences having more to do with differences in the intensity of the distributions of electromagnetic work rather than differences in the shapes of the distributions.
Several related studies that instead examine hemispheric asymmetries in Poynting flux have been performed (Cosgrove et al., 2022; Pakhotin et al., 2021; Knipp et al., 2021); each presents evidence that the electromagnetic energy input to the high-latitude ionosphere is on average greater in the NH than in the SH. These studies are of relevance to this study because of the connection between the divergence of Poynting flux and electromagnetic work given by Poynting's theorem (e.g. Thayer and Semeter, 2004, and references therein) and the “Equipotential Boundary Poynting Flux theorem” presented by Richmond (2010). Of particular relevance to the present study is the finding of Cosgrove et al. (2022) that the overall preference for electromagnetic energy input into the NH may be reversed during local winter. While the Swipe model does not yield evidence in direct support of the hypothesis, the Swipe model does predict that the hemispheric imbalance of energy input is least during local winter for θc orientations dominated by negative IMF Bz (bottom right panel of Fig. 9).
While it would be natural to present Swipe model distributions of Poynting flux and compare them to Swipe model distributions of electromagnetic work, an exercise suggested by Richmond (2010) and carried out using synthetic data and empirical models by Vanhamäki et al. (2012) and WE21 respectively, we deem a full comparison outside the scope of the present study. The interested reader may nevertheless refer to the limited comparison performed in the Swipe validation report produced by two of us (Heikki Vanhamäki and Habtamu Tesfaw) for the European Space Agency that is included in the Supplement. This validation report also presents a comparison of Swipe electromagnetic work, Poynting flux, and conductances with outputs from a number of other empirical models and simulations for the 14–16 December 2006 geomagnetic storm that was the subject of a GEM-CEDAR challenge (Rastätter et al., 2016).
Regarding the role of neutral winds, we find that the criteria given in Eq. (37) allow us to determine locations where Swipe model predictions are inconsistent with the assumption that vn=0 in an Earth-fixed frame. These enforce the basic physical requirement that the height-integrated conductances be positive (note however that in a dusty plasma the Hall conductance may be negative; see, for example, Shebanits et al., 2020, and references therein). They have nevertheless arisen heuristically in the course of this study as a means of screening out the negative or unphysically large conductances and sharp conductance gradients that otherwise appear. It would be greatly preferable to enforce positive conductances (i.e., physical consistency) as part of the model design and to include relevant neutral wind measurements. Such improvements deserve attention in future studies.
Therefore, when the criteria given in Eq. (37) are met it does not necessarily mean that Swipe model predictions are consistent with the assumption that vn=0. These criteria do however seem sufficient to identify some trends in NH and SH distributions of Hall and Pedersen conductances predicted by the Swipe model (Fig. 10–15) which we summarize below. If we do not enforce these criteria, we find that the conductance distributions predicted by Swipe suffer from the same issues that the small selection of conductance distributions presented by WE21 are subject to, namely, negative or unphysically large conductances and sharp conductance gradients.
Perhaps the most basic characteristic of distributions of conductance not attributable to solar extreme ultraviolet (EUV) radiation that have been presented in previous studies is that the Hall and Pedersen conductances are highest on the nightside (Ahn et al., 1998; McGranaghan et al., 2015; Hardy et al., 1987; Wallis and Budzinski, 1981). Results from a subset of these previous studies also suggest a tendency for Hall conductances to be highest over post-midnight MLTs, while the locations of the highest Pedersen conductances tend to be shifted to relatively earlier local times (Ahn et al., 1998; Hardy et al., 1987).
These characteristics are also present in the conductance distributions predicted by Swipe, primarily for θc orientations involving predominant IMF By or negative IMF Bz and regardless of season, and in the conductance distributions presented by WE21 for nT. This is noteworthy, as Swipe and WE21 conductance distributions do not distinguish between contributions to the conductances from solar EUV and auroral precipitation. (We note, however, that the nightside peaks in Pedersen conductance distributions presented by WE21 partially coincide with negative Hall conductances.) There is a general tendency for Swipe model conductances on the dayside to increase from local winter to local summer, as expected based on the increasing exposure to solar EUV radiation from local winter to local summer.
Regarding the tendency of Swipe-predicted NH nightside Hall conductance to decrease moving from local winter to local summer, this prediction seems to be in line with the finding that the occurrence of discrete aurora is suppressed by sunlight (Newell et al., 1996). If this interpretation is correct, it is unclear why Swipe-predicted average SH nightside Hall conductances do not change with season. This model prediction deserves further investigation, although it is likely difficult to test given the general sparsity of SH measurements, both in terms of sheer numbers and in terms of available measurement types.
In this study we have presented a new set of empirical models for describing variations in ionosphere–thermosphere electrodynamics in both hemispheres as a function of season as well as prevailing solar wind and interplanetary magnetic field conditions. These models are primarily based on measurements of magnetic field perturbations and ionospheric plasma drift made by the Swarm satellites. The chief advantage of these models is that they are the first empirical models of high-latitude ionospheric electrodynamic quantities in both hemispheres that are consistently derived in the sense that they (i) take stock of distortions of the Earth’s magnetic field via our use of Apex coordinates; (ii) do not assume any form of hemispheric symmetry; and (iii) are based on sets of measurements with similar data coverage distributions. Both the model forward (Hatch and Laundal, 2023a) and inverse (Hatch and Laundal, 2023b) codes are open source and publicly available.
Using these models, we find that model predictions of high-latitude ionospheric potentials and distributions of electromagnetic work in each hemisphere evince a high degree of symmetry when the signs of IMF By and dipole tilt Ψ are reversed. In contrast, model predictions of distributions of ionospheric conductances exhibit IMF- and season-dependent hemispheric asymmetries. Ionospheric conductances are generally highest on the nightside. Predicted distributions of ionospheric conductances exhibit very sharp gradients and/or are negative where the magnitude of the electromagnetic work is small. In these areas the assumption that the electric field in the reference frame of the neutral wind does not substantially differ from the electric field in an Earth-fixed frame of reference may break down.
It is straightforward to show via Eq. (25) that can be enforced by setting
with . In other words, we can rewrite the lowest-degree (for a given value of the order m) coefficient in terms of the remaining higher-degree coefficients (and similarly for ). Inserting Eq. (A1) into Eq. (25) and rearranging reduces the number of terms in each series in Eq. (25) by one:
with . In particular .
To enforce , we proceed from Eq. (A2) in analogous fashion, obtaining
and a similar expression for , with . Inserting these expressions into Eq. (A2) then yields
with . Note that .
While we do not use expressions Eqs. (A2) and (A4) to calculate the potential model coefficients, we present them to illustrate how enforcing effectively reduces the number of terms in each series in Eq. (25) by two. To calculate the model coefficients, we insert the expression for in Eq. (A3) into Eq. (A1) to obtain
with .
Using Eqs. (A3) and (A5), we may rewrite the vector of order-m coefficients
where the first two rows of the matrix Am correspond to Eqs. (A3) and (A5), and the remaining rows comprise an identity matrix.
Given the expression
for height-integrated electromagnetic work, from standard uncertainty propagation we may write the corresponding uncertainty as
To get a feel for the values of W and δW, let us assume somewhat larger magnitudes of the relevant quantities (e.g., mA m−1, mV m−1, α=0°) and their uncertainties ( mA m−1, 10 mV m−1, δα= 30°). With these we obtain mW m−2. Taking this value of W to be the average over all latitudes above 60° MLat, the hemispheric integrated EM work is ∼ 320 GW for a polar cap area of 3.54×10⁷ km2.
To get the uncertainty in the hemispheric integrated EM work WN, we divide the polar cap into area segments having an area δA=r2cos θ Δθ Δϕ with r=6480 km and Δθ and Δϕ being constant. We then have the uncertainty
Taking mW m−2 for all i, this becomes
For the grid used in Figs. 6–8 for which Δϕ≈0.242 MLT and Δθ=0.3°, km2. Thus δWN=1.7 GW. From this example, we see that a conservative estimate of the uncertainty of height-integrated electromagnetic work is on the order of a few gigawatts (GW).
The model forward (Hatch and Laundal, 2023a) and inverse (Hatch and Laundal, 2023b) codes are open source and publicly available. The Level 1B Swarm TII data are publicly accessible at https://swarm-diss.eo.esa.int/#swarm/Advanced/Plasma_Data/2Hz_TII_Cross-track_Dataset (European Space Agency, 2023). The Penticton Solar Radio Flux at 10.7 cm (F10.7 index) data are available at https://lasp.colorado.edu/lisird/data/penticton_radio_flux (National Research Council Canada, 2023). Solar wind and IMF measurements are available via the NASA OMNI database: https://omniweb.gsfc.nasa.gov/form/dx1.html (NASA/Goddard Space Flight Center, Space Physics Data Facility, 2023).
The supplement related to this article is available online at: https://doi.org/10.5194/angeo-42-229-2024-supplement.
SMH conceived of the study, prepared the manuscript, compiled the measurement databases, produced all figures, and derived the model coefficients. HV and KML gave advice on model definition, study design, and definition of model outputs. KML also contributed the AMPS inversion code, which SMH adapted for deriving the Swarm Hi-C model. JPR helped with study design and presentation and wrote portions of the manuscript. JKB, LL, and DJK provided guidance on Swarm EFI measurements and provided feedback on model design and the manuscript. MM provided guidance on model definition and inverse theory and wrote a part of the model description. HT carried out comparisons of the Swarm Hi-C and Swipe models with multiple existing models for validation and provided feedback on the manuscript.
The contact author has declared that none of the authors has any competing interests.
Publisher’s note: Copernicus Publications remains neutral with regard to jurisdictional claims made in the text, published maps, institutional affiliations, or any other geographical representation in this paper. While Copernicus Publications makes every effort to include appropriate place names, the final responsibility lies with the authors.
Views and opinions expressed are however those of the authors only and do not necessarily reflect those of the European Union or the European Research Council. Neither the European Union nor the granting authority can be held responsible for them. The authors also gratefully acknowledge many useful suggestions from the reviewers that have improved the paper. The results presented in this document rely on data collected by the Solar Radio Monitoring Program (https://www.spaceweather.gc.ca/forecast-prevision/solar-solaire/solarflux/sx-en.php, last access: 3 August 2023) operated by the National Research Council and Natural Resources Canada. These data are available at https://www.spaceweather.gc.ca/forecast-prevision/solar-solaire/solarflux/sx-5-en.php, last access: 3 August 2023. These data were accessed via the LASP Interactive Solar Irradiance Datacenter (LISIRD) (https://lasp.colorado.edu/lisird/, last access: 3 August 2023).
This research has been supported by the Trond Mohn stiftelse, the European Space Agency (grant no. 4000109587/13/I-NB), the Norges Forskningsråd (grant nos. 300844 and 223252/F50), the Research Council of Finland (grant no. 354521), the European Research Council, Horizon Europe European Research Council (grant no. 101086985), and the Canadian Space Agency (grant no. 21SUSTSHLE).
This paper was edited by Georgios Balasis and reviewed by Daniel Weimer, Octav Marghitu, and Matthias Förster.
Ahn, B., Richmond, A. D., Kamide, Y., Kroehl, H. W., Emery, B. A., de la Beaujardiére, O., and Akasofu, S.: An ionospheric conductance model based on ground magnetic disturbance data, J. Geophys. Re.-Space, 103, 14769–14780, https://doi.org/10.1029/97JA03088, 1998. a, b
Amm, O.: The elementary current method for calculating ionospheric current systems from multisatellite and ground magnetometer data, J. Geophys. Res.-Space, 106, 24843–24855, https://doi.org/10.1029/2001JA900021, 2001. a
Billett, D. D., Grocott, A., Wild, J. A., Walach, M.-T., and Kosch, M. J.: Diurnal Variations in Global Joule Heating Morphology and Magnitude Due To Neutral Winds, J. Geophys. Res.-Space, 123, 2398–2411, https://doi.org/10.1002/2017JA025141, 2018. a
Billett, D. D., McWilliams, K. A., Perry, G. W., Clausen, L. B. N., and Anderson, B. J.: Ionospheric Energy Input in Response to Changes in Solar Wind Driving: Statistics From the SuperDARN and AMPERE Campaigns, J. Geophys. Res.-Space, 127, e2021JA030102, https://doi.org/10.1029/2021JA030102, 2022. a
Burchill, J. K. and Knudsen, D. J.: EFI TII Cross-Track Flow Data Release Notes, Rev. 7, Tech. Rep., Swarm DISC, https://earth.esa.int/eogateway/ (last access: 4 December 2023), 2020. a
Burchill, J. K. and Knudsen, D. J.: Swarm Thermal Ion Imager measurement performance, Earth Planet. Space, 74, 181, https://doi.org/10.1186/s40623-022-01736-w, 2022. a, b
Cai, L., Aikio, A. T., and Nygrén, T.: Height-dependent energy exchange rates in the high-latitude E region ionosphere, J. Geophys. Res.-Space, 118, 7369–7383, https://doi.org/10.1002/2013JA019195, 2013. a
Cai, L., Aikio, A. T., and Milan, S. E.: Joule heating hot spot at high latitudes in the afternoon sector, J. Geophys. Res.-Space, 121, 7135–7152, https://doi.org/10.1002/2016JA022432, 2016. a
Cosgrove, R. B., Bahcivan, H., Chen, S., Sanchez, E., and Knipp, D.: Violation of Hemispheric Symmetry in Integrated Poynting Flux via an Empirical Model, Geophys. Res. Lett., 49, e2021GL097329, https://doi.org/10.1029/2021GL097329, 2022. a, b
Cousins, E. D. P. and Shepherd, S. G.: A dynamical model of high-latitude convection derived from SuperDARN plasma drift measurements, J. Geophys. Res.-Space, 115, A12329, https://doi.org/10.1029/2010JA016017, 2010. a, b, c, d, e, f
Emmert, J. T., Richmond, A. D., and Drob, D. P.: A computationally compact representation of Magnetic-Apex and Quasi-Dipole coordinates with smooth base vectors, J. Geophys. Res.-Space, 115, A08322, https://doi.org/10.1029/2010JA015326, nULL, 2010. a
European Space Agency: Swarm TII 2 Hz cross-track dataset, European Space Agency [data set], https://swarm-diss.eo.esa.int/#swarm/Advanced/Plasma_Data/2Hz_TII_Cross-track_Dataset, last access: 3 August 2023. a
Förster, M. and Haaland, S.: Interhemispheric differences in ionospheric convection: Cluster EDI observations revisited, J. Geophys. Res., 120, 5805–5823, https://doi.org/10.1002/2014JA020774, 2015. a, b, c, d, e, f, g
Friis-Christensen, E., Kamide, Y., Richmond, A. D., and Matsushita, S.: Interplanetary magnetic field control of high-latitude electric fields and currents determined from Greenland Magnetometer Data, J. Geophys. Res.-Space, 90, 1325–1338, https://doi.org/10.1029/JA090iA02p01325, 1985. a
Hardy, D. A., Gussenhoven, M. S., Raistrick, R., and McNeil, W. J.: Statistical and functional representations of the pattern of auroral energy flux, number flux, and conductivity, J. Geophys. Res., 92, 12275, https://doi.org/10.1029/JA092iA11p12275, 1987. a, b
Hatch, S. M.: pySwipe: Python implementation of Swarm Ionospheric Polar Electrodynamics empirical model, Zenodo [code], https://doi.org/10.5281/zenodo.10148940, 2023. a
Hatch, S. M. and Laundal, K. M.: python implementation of the Swipe model (pySwipe), Zenodo [code], https://doi.org/10.5281/zenodo.10148940, https://github.com/Dartspacephysiker/pyswipe (last access: 4 December 2023), 2023a. a, b
Hatch, S. M. and Laundal, K. M.: Swarm Hi-C inversion toolkit, Zenodo [code], https://doi.org/10.5281/zenodo.10245816, https://github.com/Dartspacephysiker/swarm_hi-c_inversion (last access: 4 December 2023), 2023b. a, b
Hatch, S. M., LaBelle, J., and Chaston, C.: Storm phase–partitioned rates and budgets of global Alfvénic energy deposition, electron precipitation, and ion outflow, J. Atmos. Sol.-Terr. Phys., 167, 1–12, https://doi.org/10.1016/j.jastp.2017.08.009, 2018. a
Hatch, S. M., Laundal, K. M., and Reistad, J. P.: Testing the mirror symmetry of Birkeland and ionospheric currents with respect to magnetic latitude, dipole tilt angle, and IMF By, Front. Astron. Space Sci., 9, 958977, https://doi.org/10.3389/fspas.2022.958977, 2022. a, b
Heelis, R. and Maute, A.: Challenges to Understanding the Earth's Ionosphere and Thermosphere, J. Geophys. Res.-Space, 125, e2019JA027497, https://doi.org/10.1029/2019JA027497, 2020. a
Knipp, D., Kilcommons, L., Hairston, M., and Coley, W. R.: Hemispheric Asymmetries in Poynting Flux Derived From DMSP Spacecraft, Geophys. Res. Lett., 48, e2021GL094781, https://doi.org/10.1029/2021GL094781, 2021. a
Larsen, M. F.: Winds and shears in the mesosphere and lower thermosphere: Results from four decades of chemical release wind measurements, J. Geophys. Res.-Space, 107, SIA 28-1–SIA 28-14, https://doi.org/10.1029/2001JA000218, 2002. a
Laundal, K. M. and Richmond, A. D.: Magnetic Coordinate Systems, Space Sci. Rev., 206, 27–59, https://doi.org/10.1007/s11214-016-0275-y, 2017. a, b
Laundal, K. M., Finlay, C. C., and Olsen, N.: Sunlight effects on the 3D polar current system determined from low Earth orbit measurements, Earth Planet. Space, 68, 142, https://doi.org/10.1186/s40623-016-0518-x, 2016. a
Laundal, K. M., Cnossen, I., Milan, S. E., Haaland, S. E., Coxon, J., Pedatella, N. M., Förster, M., and Reistad, J. P.: North-South asymmetries in Earth's magnetic field - Effects on high-latitude geospace, Space Sci. Rev., 206, 225–257, https://doi.org/10.1007/s11214-016-0273-0, 2017. a
Laundal, K. M., Finlay, C. C., Olsen, N., and Reistad, J. P.: Solar wind and seasonal influence on ionospheric currents from Swarm and CHAMP measurements, J. Geophys. Res., 123, 4402–4429, https://doi.org/10.1029/2018JA025387, 2018. a, b, c, d, e, f, g, h, i, j, k, l, m, n
Lomidze, L., Burchill, J. K., Knudsen, D. J., Kouznetsov, A., and Weimer, D. R.: Validity Study of the Swarm Horizontal Cross-Track Ion Drift Velocities in the High-Latitude Ionosphere, Earth Space Sci., 6, 411–432, https://doi.org/10.1029/2018EA000546, https://doi.org/10.1029/2018EA000546, 2019. a
Lomidze, L., Burchill, J. K., Knudsen, D. J., and Huba, J. D.: Estimation of Ion Temperature in the Upper Ionosphere Along the Swarm Satellite Orbits, Earth Space Sci., 8, e2021EA001925, https://doi.org/10.1029/2021EA001925, 2021. a, b, c, d
Lowes, F. J.: Mean-square values on sphere of spherical harmonic vector fields, J. Geophys. Res., 71, 2179–2179, https://doi.org/10.1029/JZ071i008p02179, 1966. a
Madelaire, M., Laundal, K., Gjerloev, J., Hatch, S., Reistad, J., Vanhamäki, H., Waters, C., Ohma, A., Mesquita, R., and Merkin, V.: Spatial Resolution in Inverse Problems: The EZIE satellite mission, J. Geophys. Res.-Space, 128, e2023JA031394, https://doi.org/10.1029/2023JA031394, 2023. a
Mannucci, A. J., McGranaghan, R., Meng, X., and Verkhoglyadova, O. P.: An Analysis of Magnetosphere-Ionosphere Coupling That Is Independent of Inertial Reference Frame, J. Geophys. Res.-Space, 127, e2021JA030009, https://doi.org/10.1029/2021JA030009, 2022. a, b, c
Matsuo, T. and Richmond, A. D.: Effects of high-latitude ionospheric electric field variability on global thermospheric Joule heating and mechanical energy transfer rate, J. Geophys. Res.-Space, 113, A07309, https://doi.org/10.1029/2007JA012993, 2008. a
McGranaghan, R., Knipp, D. J., Matsuo, T., Godinez, H., Redmon, R. J., Solomon, S. C., and Morley, S. K.: Modes of high-latitude auroral conductance variability derived from DMSP energetic electron precipitation observations: Empirical orthogonal function analysis, J. Geophys. Res.-Space, 120, 1111–1331, https://doi.org/10.1002/2015JA021828, 2015. a
NASA/Goddard Space Flight Center, Space Physics Data Facility: https://omniweb.gsfc.nasa.gov/form/dx1.html [data set], last access: 3 August 2023. a
National Research Council Canada: Penticton Solar Radio Flux at 10.7 cm, LISIRD [data set], https://lasp.colorado.edu/lisird/data/penticton_radio_flux, last access: 3 August 2023. a
Newell, P. T., Meng, C.-I., and Lyons, K. M.: Suppression of discrete aurorae by sunlight, Nature, 381, 766–767, https://doi.org/10.1038/381766a0, 1996. a
Newell, P. T., Sotirelis, T., Liou, K., Meng, C.-I., and Rich, F. J.: A nearly universal solar wind-magnetosphere coupling function inferred from 10 magnetospheric state variables, J. Geophys. Res.-Space, 112, A01206, https://doi.org/10.1029/2006JA012015, 2007. a
Pakhotin, I. P., Mann, I. R., Xie, K., Burchill, J. K., and Knudsen, D. J.: Northern preference for terrestrial electromagnetic energy input from space weather, Nat. Commun., 12, 199, https://doi.org/10.1038/s41467-020-20450-3, 2021. a
Papitashvili, V. O. and Rich, F. J.: High-latitude ionospheric convection models derived from Defense Meteorological Satellite Program ion drift observations and parameterized by the interplanetary magnetic field strength and direction, J. Geophys. Res., 107, 1198, https://doi.org/10.1029/2001JA000264, 2002. a, b, c
Pedersen, M. N., Vanhamäki, H., and Aikio, A. T.: Comparison of Field-Aligned Current Responses to HSS/SIR, Sheath, and Magnetic Cloud Driven Geomagnetic Storms, Geophys. Res. Lett., 50, e2023GL103151, https://doi.org/10.1029/2023GL103151, 2023. a
Pettigrew, E. D., Shepherd, S. G., and Ruohoniemi, J. M.: Climatological patterns of high-latitude convection in the Northern and Southern hemispheres: Dipole tilt dependencies and interhemispheric comparison, J. Geophys. Res., 115, A07305, https://doi.org/10.1029/2009JA014956, 2010. a, b, c
Rastätter, L., Shim, J. S., Kuznetsova, M. M., Kilcommons, L. M., Knipp, D. J., Codrescu, M., Fuller-Rowell, T., Emery, B., Weimer, D. R., Cosgrove, R., Wiltberger, M., Raeder, J., Li, W., Tóth, G., and Welling, D.: GEM-CEDAR challenge: Poynting flux at DMSP and modeled Joule heat, Space Weather, 14, 113–135, https://doi.org/10.1002/2015SW001238, 2016. a, b
Reistad, J. P., Laundal, K. M., Østgaard, N., Ohma, A., Burrell, A. G., Hatch, S. M., Haaland, S., and Thomas, E. G.: Quantifying the Lobe Reconnection Rate During Dominant IMF By Periods and Different Dipole Tilt Orientations, J. Geophys. Res.-Space, 126, e2021JA029742, https://doi.org/10.1029/2021JA029742, 2021. a, b
Richmond, A.: Joule Heating in the Thermosphere, in: Space Physics and Aeronomy, Vol. 4, Upper Atmosphere Dynamics and Energetics, edited by: Wang, W., Zhang, Y.-L., and Paxton, L. J., Chap. 1, American Geophysical Union, Washington, D.C., ISBN 978-1-119-50756-7, 2021. a
Richmond, A. D.: Ionospheric electrodynamics using magnetic apex coordinates, J. Geomag. Geoelectr., 47, 191–212, https://doi.org/10.5636/jgg.47.191, 1995. a, b, c, d
Richmond, A. D.: On the ionospheric application of Poynting's theorem, J. Geophys. Res.-Space, 115, A10311, https://doi.org/10.1029/2010JA015768, 2010. a, b, c, d
Sabaka, T. J., Hulot, G., and Olsen, N.: Handbook of Geomathematics, Mathematical Properties Relevant to Geomagnetic Field Modeling, 503–538, Springer Berlin Heidelberg, Berlin, Heidelberg, ISBN 978-3-642-01546-5, https://doi.org/10.1007/978-3-642-01546-5_17, 2010. a
Sarris, T. E.: Understanding the ionosphere thermosphere response to solar and magnetospheric drivers: status, challenges and open issues, Philos. T. R. Soc. A, 377, 2148, https://doi.org/10.1098/rsta.2018.0101, 2019. a
Shebanits, O., Hadid, L. Z., Cao, H., Morooka, M. W., Hunt, G. J., Dougherty, M. K., Wahlund, J.-E., Waite, J. H., and Müller-Wodarg, I.: Saturn’s near-equatorial ionospheric conductivities from in situ measurements, Sci. Rep., 10, 7932, https://doi.org/10.1038/s41598-020-64787-7, 2020. a
Snekvik, K., Østgaard, N., Tenfjord, P., Reistad, J. P., Laundal, K. M., Milan, S. E., and Haaland, S. E.: Dayside and nightside magnetic field responses at 780 km altitude to dayside reconnection, J. Geophys. Res., 122, 1670–1689, https://doi.org/10.1002/2016JA023177, 2017. a
Strangeway, R. J.: The equivalence of Joule dissipation and frictional heating in the collisional ionosphere, J. Geophys. Res.-Space, 117, A02310, https://doi.org/10.1029/2011JA017302, 2012. a, b
Thayer, J. P. and Semeter, J.: The convergence of magnetospheric energy flux in the polar atmosphere, J. Atmos. Sol.-Terr. Phys., 66, 807–824, https://doi.org/10.1016/j.jastp.2004.01.035, 2004. a
Thomas, E. G. and Shepherd, S. G.: Statistical Patterns of Ionospheric Convection Derived From Mid-latitude, High-Latitude, and Polar SuperDARN HF Radar Observations, J. Geophys. Res.-Space, 123, 3196–3216, https://doi.org/10.1002/2018JA025280, 2018. a
Vanhamäki, H., Yoshikawa, A., Amm, O., and Fujii, R.: Ionospheric Joule heating and Poynting flux in quasi-static approximation, J. Geophys. Res., 117, A08327, https://doi.org/10.1029/2012JA017841, 2012. a, b
Vasyliūnas, V. M.: The physical basis of ionospheric electrodynamics, Ann. Geophys., 30, 357–369, https://doi.org/10.5194/angeo-30-357-2012, 2012. a
Vasyliunas, V. M. and Song, P.: Meaning of ionospheric Joule heating, J. Geophys. Res., 110, A02301, https://doi.org/10.1029/2004JA010615, 2005. a
Wallis, D. D. and Budzinski, E. E.: Empirical models of height integrated conductivities, J. Geophys. Res., 86, 125–137, https://doi.org/10.1029/JA086iA01p00125, 1981. a
Weimer, D. and Edwards, T.: Testing the electrodynamic method to derive height-integrated ionospheric conductances, Ann. Geophys., 39, 31–51, https://doi.org/10.5194/angeo-39-31-2021, 2021. a, b, c, d
Weimer, D. R.: Improved ionospheric electrodynamic models and application to calculating Joule heating rates, J. Geophys. Res., 110, A05306, https://doi.org/10.1029/2004JA010884, 2005. a, b, c, d, e, f, g
Weimer, D. R.: An empirical model of ground-level geomagnetic perturbations, Space Weather, 11, 107–120, https://doi.org/10.1002/swe.20030, 2013. a
Wing, S., Newell, P. T., and Ruohoniemi, J. M.: Double cusp: Model prediction and observational verification, J. Geophys. Res., 106, 25571–25593, https://doi.org/10.1029/2000JA000402, 2001. a
Workayehu, A. B., Vanhamäki, H., and Aikio, A. T.: Seasonal effect on hemispheric asymmetry in ionospheric horizontal and field-aligned currents, J. Geophys. Res.-Space, 125, e2020JA028051, https://doi.org/10.1029/2020JA028051, 2020. a
Workayehu, A. B., Vanhamäki, H., Aikio, A. T., and Shepherd, S. G.: Effect of Interplanetary Magnetic Field on Hemispheric Asymmetry in Ionospheric Horizontal and Field-Aligned Currents During Different Seasons, J. Geophys. Res.-Space, 126, e2021JA029475, https://doi.org/10.1029/2021JA029475, 2021. a
Zhang, B., Brambles, O., Lotko, W., Dunlap-Shohl, W., Smith, R., Wiltberger, M., and Lyon, J.: Predicting the location of polar cusp in the Lyon-Fedder-Mobarry global magnetosphere simulation, J. Geophys. Res.-Space, 118, 6327–6337, https://doi.org/10.1002/jgra.50565, 2013. a, b
Zhou, X. W., Russell, C. T., Le, G., Fuselier, S. A., and Scudder, J. D.: Solar wind control of the polar cusp at high altitude, J. Geophys. Res.-Space, 105, 245–251, https://doi.org/10.1029/1999JA900412, 2000. a
Zhu, Q., Deng, Y., Maute, A., Kilcommons, L. M., Knipp, D. J., and Hairston, M.: ASHLEY: A New Empirical Model for the High-Latitude Electron Precipitation and Electric Field, Space Weather, 19, e2020SW002671, https://doi.org/10.1029/2020SW002671, 2021. a
- Abstract
- Introduction
- Background
- Methodology and data for the Swarm Hi-C model
- Swarm Hi-C model results
- Swarm Ionospheric Polar Electrodynamics (Swipe): the combined AMPS and Swarm Hi-C models
- Discussion
- Conclusions
- Appendix A: Derivation of analytic constraint matrix Am
- Appendix B: Estimate of hemispheric integrated EM work uncertainty
- Code and data availability
- Author contributions
- Competing interests
- Disclaimer
- Acknowledgements
- Financial support
- Review statement
- References
- Supplement