the Creative Commons Attribution 4.0 License.
the Creative Commons Attribution 4.0 License.
 | 28 Jan 2022
Complex analysis of the ionosphere variations during the geomagnetic storm at 20 January 2010 performed by Detection of Ionosphere Anomalies (DIA) software and DEMETER satellite data
Anatoliy Lozbin
Viktor Fedun
Olga Kryakunova
The Detection of Ionosphere Anomalies (DIA) software was developed and used for ionosphere research in the Institute of Space Technique and Technology of the National Center of Space Research and Technology (Almaty, Republic of Kazakhstan). The software was designed for ionosphere anomalies detection, identification, and analysis from satellite spectral and wave data from scientific payloads installed on the DEMETER (Detection of Electro-Magnetic Emissions Transmitted from Earthquake Regions) satellite. The main task of DIA software is to provide the researcher with a convenient package for detection and identification of the sources of electromagnetic radiation, variations of the ionic and electronic components of the ionosphere, and other ionosphere parameters from satellite data. Using this software, a complex research of the state of the medium-latitude ionosphere during a geomagnetic storm on 20 January 2010 was done. Electric and magnetic components of the field in ultralow frequency (ULF), extremely low frequency (ELF), and very low frequency (VLF) bands are processed and analyzed, as well as temperature, velocity, and density of ionic and electronic plasma components and fluxes of energetic electrons at satellite altitude during a storm.
- Article
(5736 KB) - Full-text XML
- BibTeX
- EndNote


One of the most informative ways of performing ionosphere research is by using onboard spacecraft measurements. Such measurements have a number of advantages and disadvantages. The main advantage of satellite experiments is the possibility of measurements directly inside the studied object. Using a set of measuring instruments on a satellite, a number of ionosphere parameters can be obtained to study their connection with the atmosphere, lithosphere, solar activity, etc. If the satellite is at a sun-synchronous orbit (altitude of 600–700 km), it makes about 15 orbit passes around the Earth per day, which provides the opportunity to explore the ionosphere over almost the entire Earth's surface. However, this is also a problem, since the possibility of monitoring short-term variations over certain regions of the Earth's surface is practically excluded. Also, due to the fact that the satellite passes over different parts of the Earth, it is impossible to take into account the diurnal variation of ionospheric parameters over some particular point of observation. The last point is rather important when searching for an irregular parameter behavior.
Earth's artificial satellites (one or constellation), depending on the payload, accumulate and transmit to ground a huge amount of data in their different forms (raw data, partially processed data, waveforms, spectrograms, etc.). The size of these data can reach tens of gigabytes. Scientific satellite mission developers often provide scientists with data in a raw form, e.g., only time, coordinate and parameter values. Therefore, further research requires a great deal of time for scientific data processing by various software packages, especially if it concerns complex research.
One of the interesting satellite projects for the study of the ionosphere and ionosphere–lithosphere coupling was the French satellite DEMETER (Cussac et al., 2006), whose active period was more than 6 years (2004–2010). In the Scientific Space Systems Laboratory of the Institute of Space Technique and Technology (ISTT) of the National Center for Space Research and Technology (Almaty, Republic of Kazakhstan), the development of software for complex analysis of ionosphere parameters from satellite data was initiated. This activity was started within the framework of the project for creation of a Kazakhstan Satellite System for Scientific Purposes (Moldabekov et al., 2011). Later, this software was adapted for DEMETER data analysis.
Thus, the developed DIA (Detection of Ionosphere Anomalies) software package and data sets from scientific instruments aboard DEMETER satellite allow users to analyze the various disturbances in the ionosphere and associate them with natural and human-induced events.
It is known that geomagnetic storms, as a powerful change in the Earth's magnetic field due to the ejection of a huge number of high-speed streams (solar wind, shockwave, charged particles from space) during an increase in solar activity, somehow affect many parameters of the ionosphere. In this paper the state of the medium-latitude ionosphere, according to its various parameters from the DEMETER Satellite, and data processed using the DIA software during a geomagnetic storm on 20 January 2010 are considered.
In Sect. 2 we review the DEMETER satellite and its scientific payload. In Sect. 3 we develop a new software for complex analysis of ionosphere anomalies based on input data from DEMETER scientific instruments. The example of DIA software implementation for scientific research of ionosphere parameters during a geomagnetic storm on 20 January 2010 is given in Sect. 4, and main results are outlined in Sect. 5.
DEMETER (Detection of Electro-Magnetic Emissions Transmitted from Earthquake Regions) investigated the Earth's ionosphere variations due to seismic and volcanic activities, and it was developed by the French National Centre for Space Studies (CNES) in collaboration with scientific institutes in Poland, Japan, USA, etc.
Of particular interest to DEMETER is that it was the first satellite to provide a complex analysis of ionosphere variations associated with natural and artificial hazards on Earth.
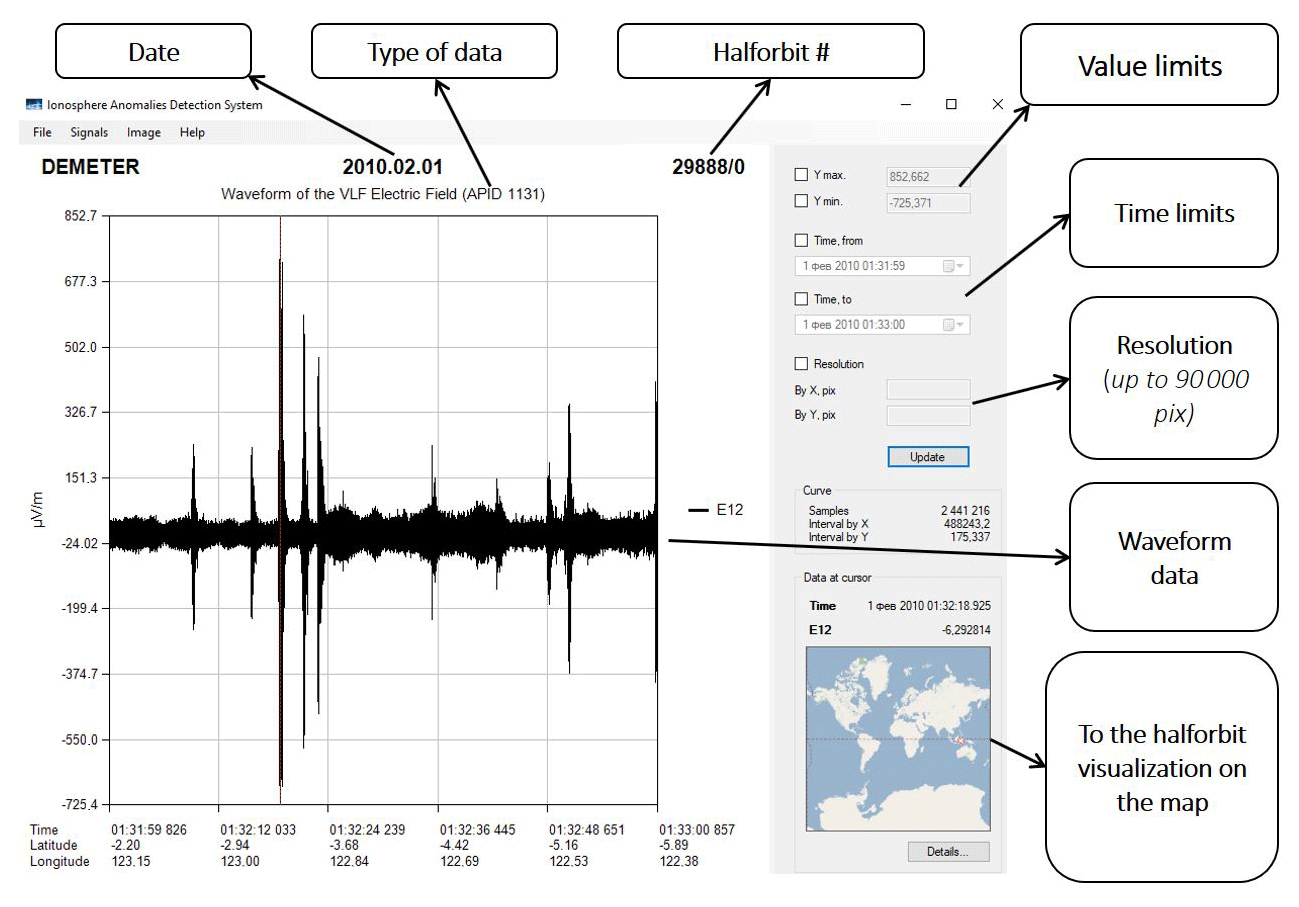
Figure 1The screenshot of the main window of the DIA package with an example of graph of electric field in VLF band.
The satellite weight was 130 kg, and it was launched on 29 June 2004 from the Baikonur launch site into a sun-synchronous orbit of the Earth with a height of 710 km and an inclination of 98.3∘. According to the mission program, the onboard scientific experiments were stopped on 9 December 2010.
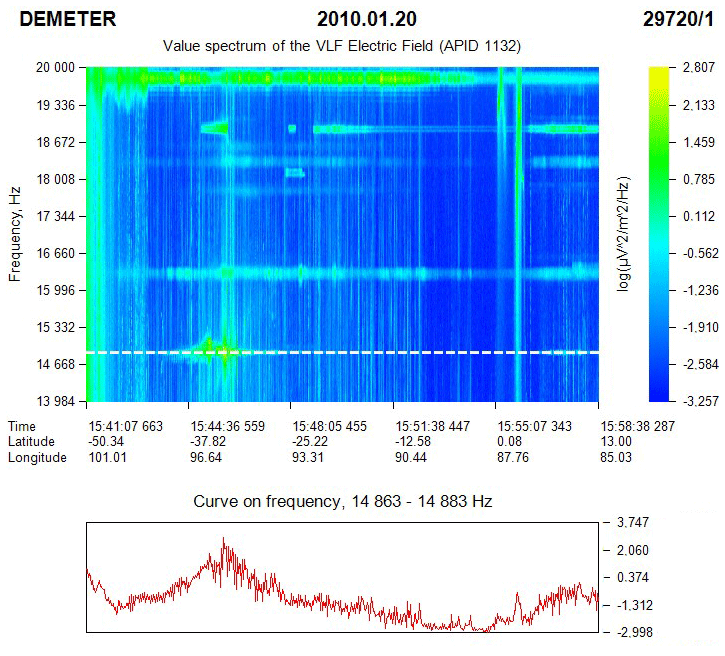
Figure 2Spectrum of the electric component of the electromagnetic field and amplitude (bottom graph) at the operational frequency 14 881 Hz (dashed line) of the VLF transmitters of the Alpha (RSDN-20) radio system.
The science payload was composed of five instruments:
-
Instrument Champ Electrique (ICE), which is composed of three electric sensors from DC up to 3.5 MHz (Berthelier et al., 2006);
-
Instrument Magnetometre Search Coil (IMSC), which is composed of three magnetic sensors from a few hertz up to 18 kHz (Parrot et al., 2006);
-
Instrument Analyseur de Plasma (IAP), which is an ion analyzer (Berthelier et al., 2006);
-
Instrument Detecteur de Plasma (IDP), which is an energetic particle detector (Sauvaud et al., 2006);
-
Instrument Sonde de Langmuir (ISL), which is a Langmuir probe (Merikallio, 2006).
ICE is designed to measure variations of electric field in the ionosphere in the ultralow-frequency (ULF) band (0–20 Hz), extremely low frequency (ELF) band (0–1250 Hz), very low frequency (VLF) band (0.02–20 kHz), and high-frequency (HF) band (0–3.3 MHz). The IMSC magnetometer is designed to measure magnetic field variations in the ionosphere. The instrument consists of three orthogonal magnetic antennas connected to the preamplifier with a shielded cable 80 cm long. At the output of the IMSC device, the researcher is provided with magnetic data in ELF band (0–1250 Hz) and VLF band (0–40 kHz). The IAP ion analyzer is designed to measure the composition of H+, He+, and O+ ions, as well as their density, temperature, and velocity. The charged particle detector IDP is designed to detect weak flows of electrons in the range from 70 to 1000 keV. The output of the IDP for seismic regions of the Earth is the energy spectrum of electrons (cm2/s/sr/keV). For the rest of the Earth's surface, the electron fluxes for three energy ranges (90.7–526.8, 526.8–971.8, and 971.8–2342.4 keV) are provided. The ISL is designed to measure the density of electrons and their temperature.
The DEMETER project team developed different modules and software to extract and analyze data from output files, but all were not very convenient for the researcher. Therefore, it became necessary to create a universal tool that is simple and accessible to any user. The main task of the DIA software is to provide the researcher with a convenient tool for satellite data processing and analyses for detection and identifying the sources of various disturbances in the ionosphere.
The main functions of the system are
-
visualization of all types of scientific data from the DEMETER satellite,
-
data mapping on different types of maps,
-
data multiupload (simultaneous upload of large amount of data),
-
construction of a spectrogram from a time series data row,
-
signal-to-noise ratio calculation for studying how the radiation from the transmitters affects the ionosphere.
3.1 Input data
The DIA package uses data files with different APIDs (where APID represents Application Process IDentifier – DEMETER project file identifiers):
-
waveform of three components of the electric field in the ULF band (APID 1129),
-
waveform of three components of the electric field in the ELF band (APID 1130),
-
waveform of one component of the electric field in the VLF band (APID 1131),
-
spectrum of electric field in the VLF band (APID 1132),
-
waveform of one component of electric field in HF band (APID 1133),
-
spectrum of the electric field in the HF band (APID 1134),
-
waveform of three magnetic field components in the ELF band (APID 1135),
-
waveform of one component of the magnetic field in the VLF band (APID 1136),
-
magnetic field spectrum in the VLF band (APID 1137),
-
ion parameters (density, temperature, and velocity) in “Burst” mode (APID 1139),
-
ion parameters (density, temperature, and velocity) in “Survey” mode (APID 1140),
-
spectrum of energetic electrons in Burst mode (APID 1141),
-
spectrum of energetic electrons in Survey mode (APID 1142),
-
parameters of electrons (density, temperature, and potential) in Burst mode (APID 1143),
-
ion parameters (density, temperature, and potential) in Survey mode (APID 1144).
These files can be obtained from the DEMETER project web page: http://demeter.cnrs-orleans.fr/, last access: 2 December 2021.
3.2 Data series operation mode
In data series operation mode the graph is plotted as shown in Fig. 1. For multicomponent measurements, all graphs are displayed in the same field in different colors with the ability to select the row of interest.
The main window consists of three parts:
-
main menu on top,
-
control panel to the right,
-
the graphics display area.
The main menu (top) of the software allows the researcher to work with data files, selected signals, and images. The user can open, print, or preview the data. It is possible to open one or several data files, print the resulting chart from the graphic display area, and preview the image before printing or saving. When you click the “Signals” button, a row action window appears. Researchers can perform the following actions on data series:
-
choose to display or hide a series of data in the chart,
-
save the necessary data row as time series,
-
build an autospectrogram for the selected data row using the fast Fourier transform algorithm,
-
perform HF or low-frequency (LF) row smoothing,
-
save a data row as a *.wav audio file.
LF smoothing is performed as follows: for a given window there is an average value of the parameter, which is entered in the first point of the new row. The window is shifted by 1 point, and the action is repeated. Then, its LF component is subtracted from the initial data row. The HF component is the difference between the original data row and its LF component.
In addition, for the selected time series, the software builds a spectrogram – the spectrum module in the sliding windows is calculated. The length of the spectrogram is equal to the length of the original data row. Each column of the histogram is a spectrum that has a length equal to half the length of the window. When the cursor moves along the spectrogram field, time (horizontally), frequency (vertically), and spectrum amplitude values are shown. The control panel (on the right) in time series data operation mode is intended for control and operations with values loaded into the software.
-
The top two fields “Y max.” and “Y min.” are used to scale along the Y axis.
-
The two following fields, “Time, from” and “Time, to”, are used to scale along the X axis.
-
The “Resolution” feature allows users to set arbitrary values for the chart size as desired.
-
The “Curve” information field displays the service information about the chart, i.e., the number of points and grid spacing along the X and Y axes.
-
The small map in the “Data at cursor” field displays the position of the satellite for the loaded data on the world map, and it also acts as a link for map window opening.
By pressing the “Details” button, the “Details” section gives detailed information for each graph point. The composition of parameters varies depending on the type of data.
The data service information is contained in each data file and consists of four blocks:
-
Block 1 – general header,
-
Block 2 – orbital and geomagnetic parameters,
-
Block 3 – attitude parameters,
-
Block 4 – measured values.
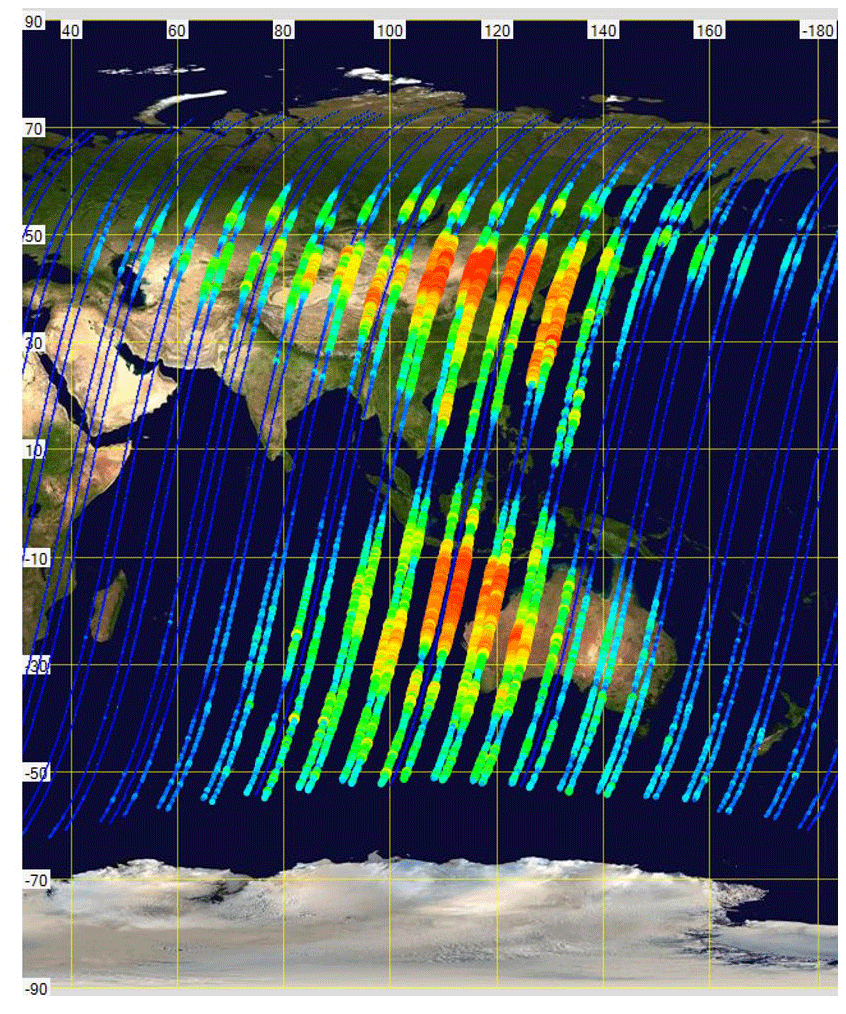
Figure 3The electric field disturbance (signal-to-noise ratio) in the southern and northern magneto-conjugate regions above the Naval Communication Station Harold E. Holt (denoted NWC) VLF transmitter with operational frequency 19.8 kHz.
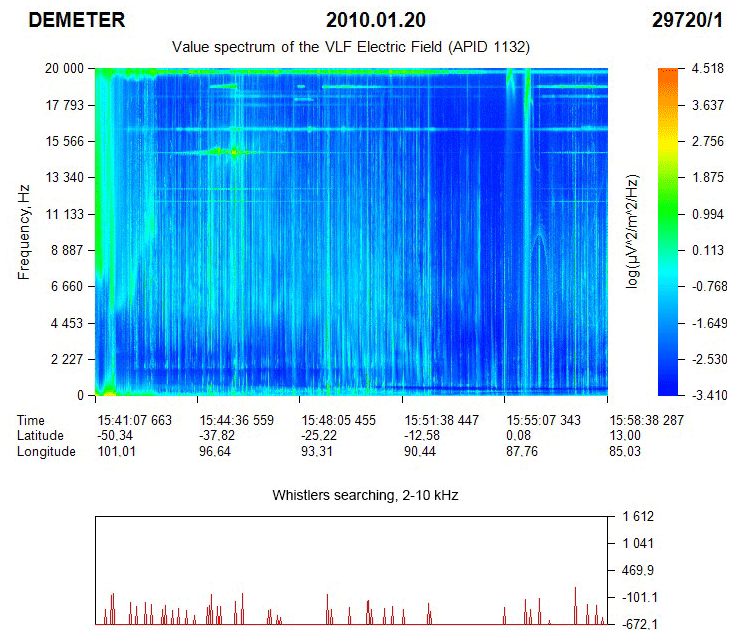
Figure 4Spectrogram of the electric field in the VLF band with the result of searching for whistlers (vertical red lines on bottom graph) with a coefficient of 3.
3.3 Spectral data operation mode
Some of the data files (APID 1132, APID 1134, APID 1137, and APID 1141) contain spectral information which is displayed as spectrogram in the central window of the software. The examples of such spectral data visualization will follow.
Similarly as in time series row mode, the software window in the spectral data mode is also divided into three parts: the upper main menu, control panel to the right, and the graphic display area.
In the display area, a spectrogram is displayed, where time and geographical coordinates of the satellite position are given for electromagnetic data on the X axis; for the Y axis, frequency in hertz is given, and on the Z axis in the color scale the measured values are presented with a log scale, i.e., log(µV2/m2/Hz) for electrical measurements or log(nT2/Hz) for magnetic measurements. For the spectrum of energetic electrons along the X axis, time and geographical coordinates of the satellite position are also given; for the Y axis, the electron energy is given (in keV), and for the Z axis measured values are given in the color scale (in units part./cm2/sr/keV).
The following information can be obtained from spectrograms:
-
amplitude of the spectrum at a certain frequency,
-
spectral density,
-
signal-to-noise ratio for disturbances at radio transmitter operating frequencies,
-
search for “whistlers” caused by lightning discharges.
It is possible to plot values at a certain frequency (“Curve on frequency”; see Fig. 2). Similarly, the “Spectral density” option allows users to display the spectral density for a given frequency range as a graph.
The “Signal-to-Noise Ratio” function provides a diagram for a given ratio for a particular transmitter. The “Base Frequency” field indicates the frequency of the transmitter, and the “Frequency df” window indicates the frequency range over which the radiation is propagated from the base frequency. The algorithm described in Molchanov et al. (2006) was used for this option. Here, the signal-to-noise ratio (SNR) was determined by the following formula: SNR . Here, A(F0) is the spectral density amplitude at transmitter operating frequency F0, and A(F+) and A(F−) are amplitudes of spectral density of disturbance width higher and lower than base frequency of the transmitter respectively.
The result of such an analysis can be a spatial distribution of the electric field intensity in the southern and northern magneto-conjugate regions above the VLF transmitter Naval Communication Station Harold E. Holt (NWC) at 19.8 kHz (see Fig. 3). NWC is located on the northwest coast of Australia and is used for submarine communication. The DIA allows for displaying the amplitude of the analyzed parameter in color along the trajectory of the satellite, which makes the visual evaluation of the changes in ionosphere over the studied territory possible.
The “Whistlers Searching” function allows users to analyze the disturbance of the ionosphere caused by lightning discharges using vertical structures on a spectrogram (thin vertical lines – whistlers). The DIA analyses the spectrogram of the electric and magnetic field in the frequency band from 2 to 10 kHz and finds whistles corresponding to the coefficients set by the user. The coefficients control the spectral width of the whistle search, i.e., its sensitivity. The result of the analysis is given at the bottom of the spectrogram, as shown in Fig. 4.
Also, it is possible to export the amplitude of the spectrogram for the selected time point in the *.csv format.
To study the low-energy electron precipitation at the height of low-orbit satellites, in addition to displaying spectrograms, it is also possible to obtain a graph for the selected energy, energy range (spectral density), and for a time point. An example of such a spectrogram is shown in Fig. 5. In Fig. 5, below the spectrogram window, a graph is shown for electrons with an energy of 108.5 keV for the DEMETER half orbit no. 29720/1, on 20 January 2010.
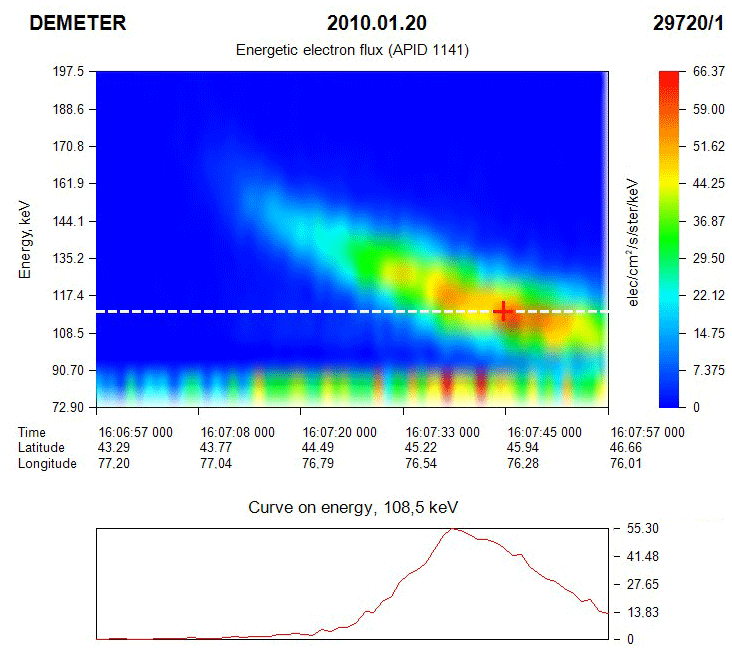
Figure 5The energetic electrons spectrogram and graph for electrons with an energy of 108.5 keV for the ascending half orbit of the DEMETER satellite no. 29720/1, 20 January 2010.
3.4 Data mapping
Another function of the DIA package is data mapping – showing data location and value on different map types. The software supports six types of maps: four offline maps (geographic, topographic, tectonic, and contour) and two online maps (Google Maps (satellite, political, and terrain) and Bing Maps).
The software allows users to operate the different visual effects of the satellite track and user-defined objects on the maps. The user can see the satellite track and show or hide the visualization of the south and north magnetically conjugate points at the altitude of 110 km.
Also, the researcher can display on the map along the orbit track the values of the graph at frequency, spectral density, and signal-to-noise ratio. The amplitude is displayed as circles with different diameters and colors depending on its value – from a small point of blue color with minimum values to a circle of larger size of red color at maximum (Fig. 3).
3.5 Data multiupload
Another advantage of DIA is the data multiupload, i.e., the simultaneous loading and processing of a large amount of similar data types. Some scientific tasks require the analysis of data over a geographical area of the Earth (the impact of LF transmitters on the ionosphere, the study of earthquakes precursors, etc.), and since the satellite passes through the same territory about once every 3 d, scientists face the task of choosing the half orbits that passed under the region of interest and a complex analysis of data from these half orbits.
The DIA allows you to simultaneously load data with the same APID. It is allowed to load data together with APIDs 1143 and 1144, as well as APIDs 1139 and 1140, since these are the same data type but with different measurement frequencies.
On 20 January 2010, various geomagnetic observatories of the world detected a geomagnetic storm (see Fig. 6). The deviation of the Earth's magnetic field from normal during a 3 h interval is defined by the K index. Kp index is calculated as the average value of K indices determined at 13 geomagnetic observatories located between 44 and 60∘ of north and south geomagnetic latitudes. Its range is from 0 to 9. Kp reached its maximum value between 15:00 and 18:00 UT. According to the Alma-Ata geomagnetic observatory, at the same time, magnetic field disturbances were observed in all three magnetic field components (see Fig. 7).
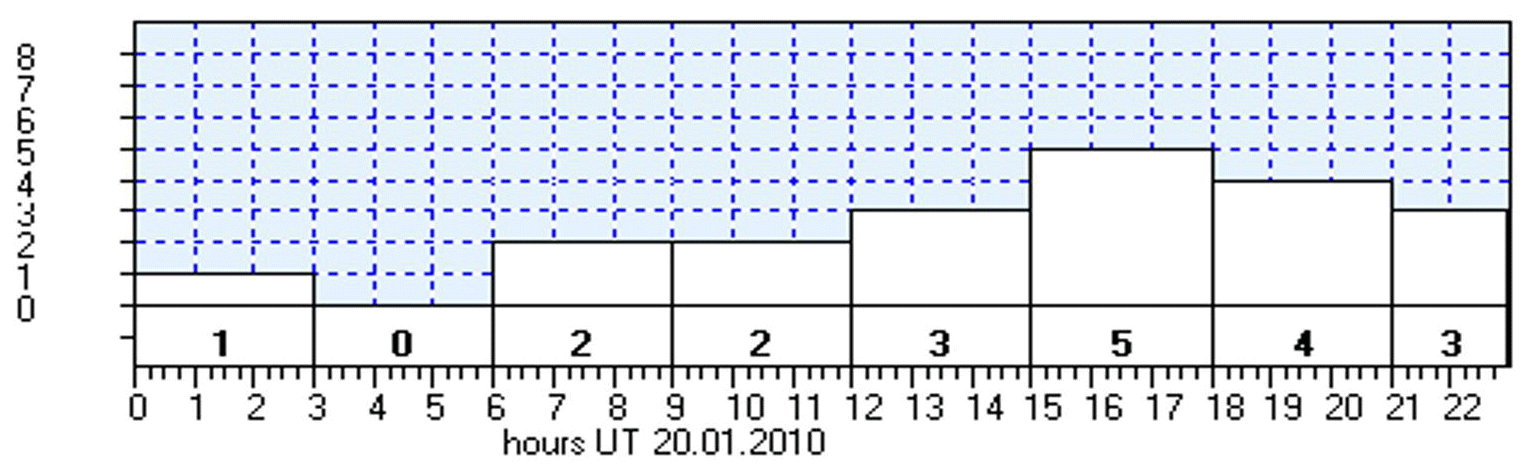
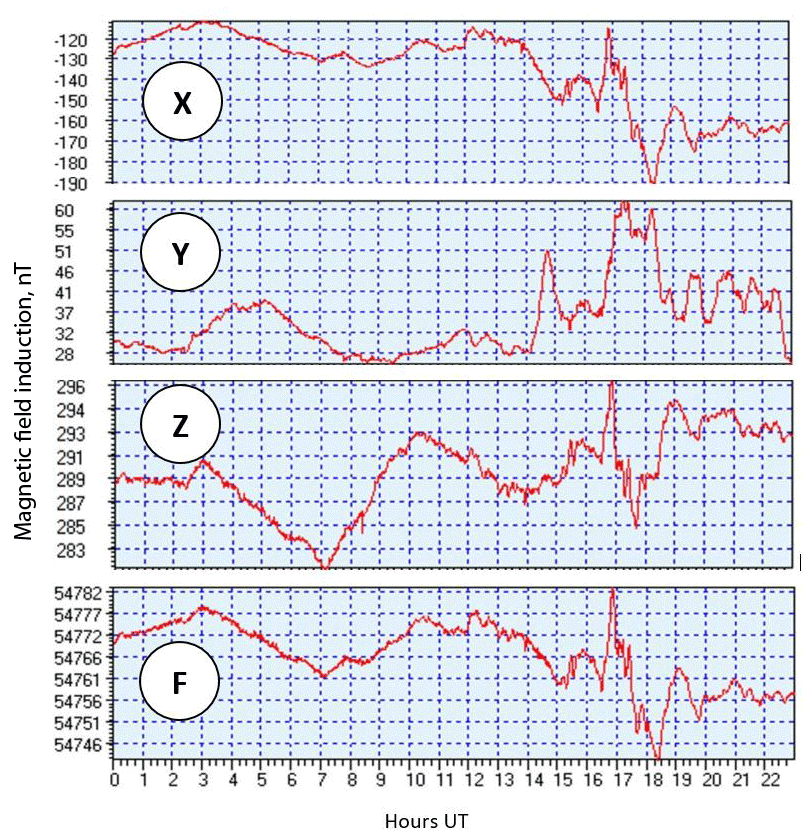
Figure 7The intensity of the geomagnetic field at the Alma-Ata observatory on 20 January 2010. The X, Y, and Z components and full field (F) are shown.
At the same time, according to the website https://www.spaceweatherlive.com (last access: 2 December 2021), there was an increase in the parameters of the solar wind and the intensity of the interplanetary magnetic field (Fig. 8).
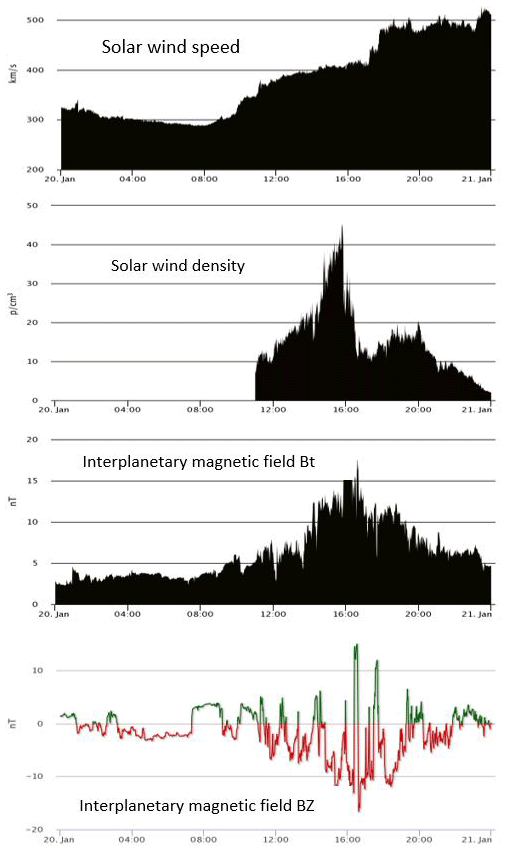
Figure 8Parameters of solar wind (speed and density) and interplanetary magnetic field strength on 20 January 2010.
During the maximum of these events (∼16:00 UT), the ascending orbit of the DEMETER satellite passed over the territory of Kazakhstan. The initial half-orbit time is 15:40 UT, and the final time is 16:15 UT. No obvious disturbances were observed in the ULF electric field band (0–20 Hz). Analysis of the electric field in the ELF band at satellite altitude showed the presence of low-frequency electrostatic vibrations on the spectrum (horizontal structures in the left part of the spectrum in Fig. 9). These are bursts of electrical oscillations at 100–400 Hz frequencies, which are usually observed by the satellite in the zone of aurora polaris at various altitudes. Most often, these bursts are explained either by the crossing of small-scale spatial disturbances by satellite or by the current generation of ion–sound or ion–cyclotron oscillations (Molchanov, 1985). However, in our case, these disturbances are observed at medium latitudes (32–47∘ N), but it is quite difficult to associate them with a geomagnetic storm, since for other similar half orbits under calm geomagnetic conditions, such fluctuations were also observed.
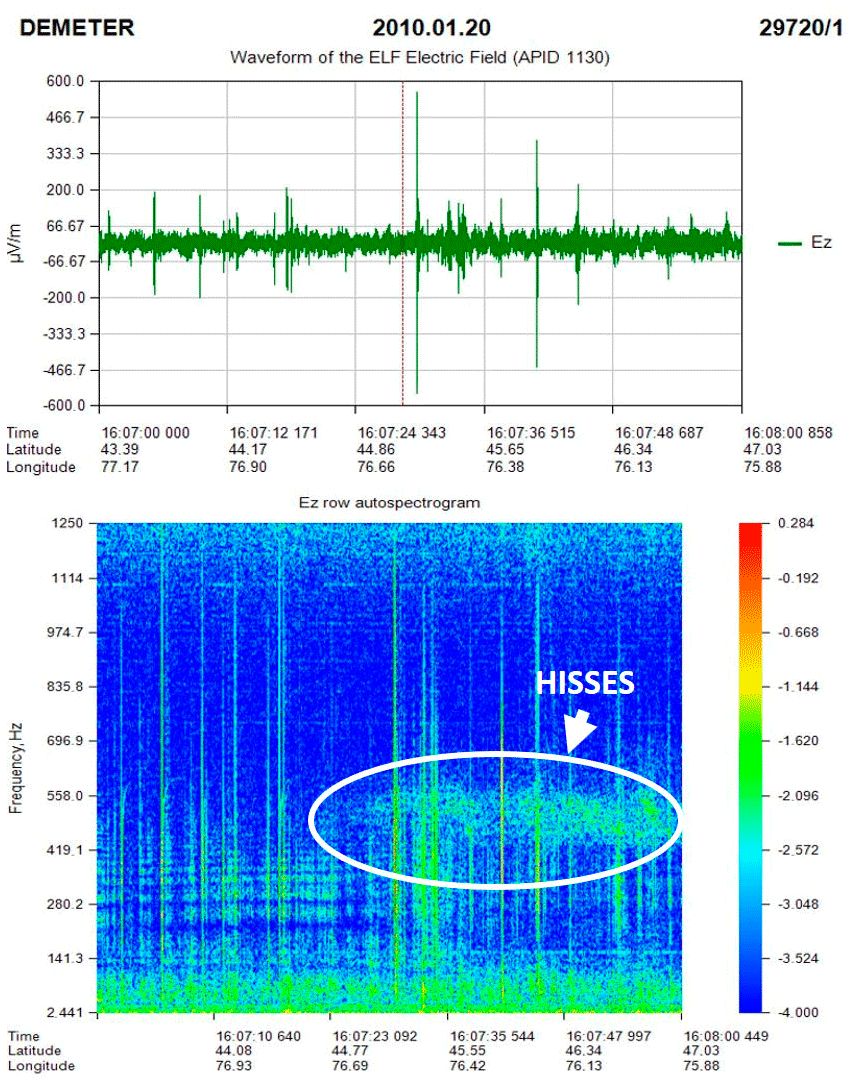
Figure 9Graph and spectrum of electric field strength in the ELF band for the ascending half orbit no. 29720.
In the right part of the spectrogram in Fig. 9, plasmaspheric hisses are apparently observed in the frequency band ∼ 450–550 Hz. These radiation signals occur quite often and are dispersed throughout the plasmasphere with minor variations in intensity. In our case, probably, these noises were amplified just by electron precipitation. The vertical structures on this spectrogram are electronic whistles caused by lightning discharges in the atmosphere.
Data from the IMSC magnetometer is quite “noisy”, and it is not possible to analyze fine structures in this case.
According to data from IAP (Fig. 10), we can see that there was an increase in the temperature and velocity of ions from 16:03 to 16:08 UT with a maximum at 16:05:40 UT, over the central Tien Shan area (∼ 41–42∘ N). Also, there was a significant decrease in the concentration of oxygen ions and its alignment over the area of the Gobi desert at the level of 30–40 part./cm3. In the helium and hydrogen ion densities, minor variations and a general increasing tendency to north in latitude were observed.
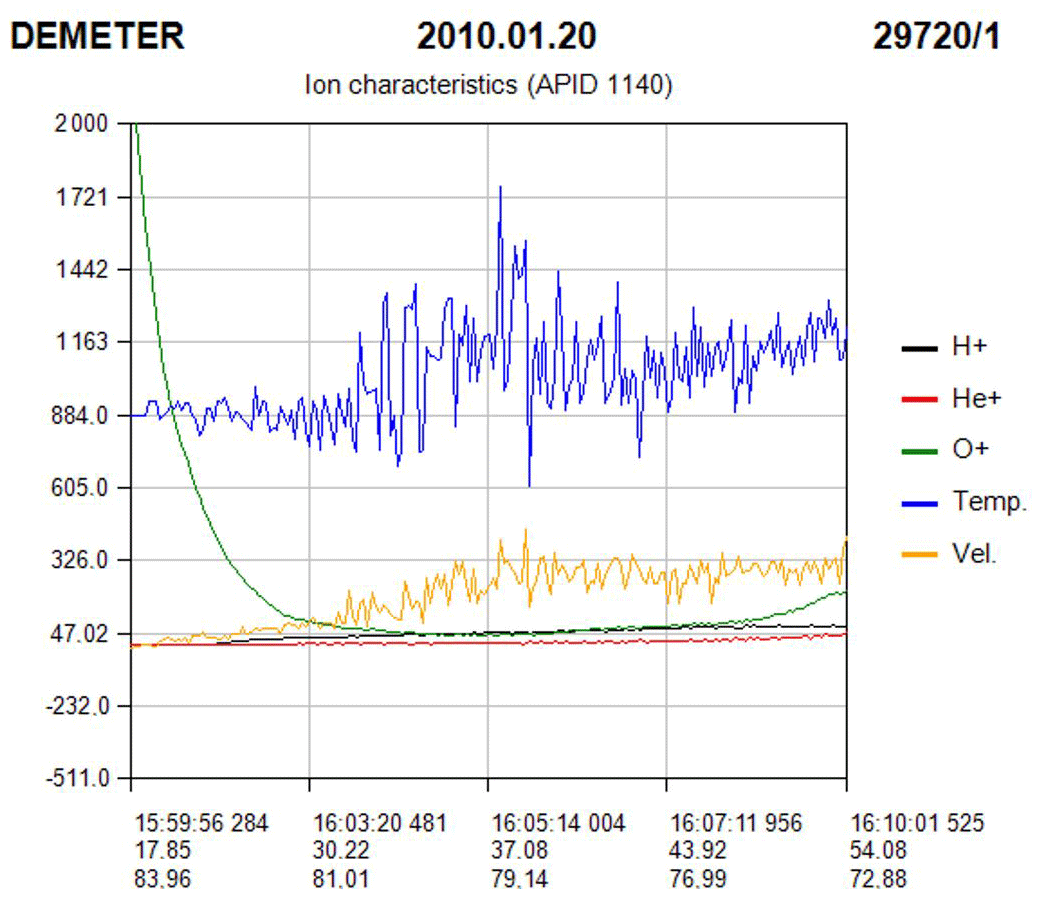
Figure 10Temperature, velocity and density and of ions at satellite height for half orbit no. 29720.
The spectrogram of IDP (Fig. 5) shows that from 16:07:15 to 16:08:33 UT electrons with an energy of 160 keV from the Earth's internal radiation belt are precipitated. The length of that precipitation at the satellite altitude is about 300 km with maximum at ∼ 46∘ N.
The behavior of energetic electrons trapped in the Earth's Van Allen radiation belts has been extensively studied, through both experimental and theoretical techniques. During quiet periods, energetic radiation-belt electrons are distributed into two belts divided by the electron slot at L∼2.5, near which there is relatively low energetic electron flux.
It is well known that large-scale injections of energetic particles into the outer radiation belts are associated with geomagnetic storms which can increase trapped electron population up to 105 times (Li and Temerin, 2001). In most cases, these injections do not penetrate into the inner radiation belt. Only in case of biggest storms, the inner belt gain a new population of energetic electrons (e.g. Baker et al., 2004).
Observations by the DEMETER near the powerful VLF transmitter NWC have shown that this transmitter causes heating of electrons and ions in the ionosphere at the satellite altitude (700 km), affecting around 500 000 km2 area (Parrot et al., 2007). There was shown increases in energetic electrons in the range 91–527 keV caused to NWC. Further experiments based on DEMETER wave and particle data show the significance of NWC upon electrons in the inner radiation belt and enhancements in the 100–600 keV drift-loss cone electron fluxes at low L values are linked to NWC operation and to ionospheric absorption (Sauvaud et al., 2008). Such enhancements, termed “wisps” and looking like those in Fig. 5, are only detected eastward of the transmitter location projection on the satellite high, as expected from the electron drift motion, and at energies that are consistent with first-order equatorial cyclotron resonance between the NWC transmissions and electrons interacting in the vicinity of the magnetic equatorial plane (Gamble et al., 2008). These authors conclude that the NWC transmitter have a good position for potential influence upon inner radiation-belt >100 keV electrons.
In our case, the region in which an increasing of energetic electrons has been observed is the northern magneto-conjugate region of the NWC transmitter, and it may well be that the observed electron precipitation is related to the operation of the NWC transmitter and the effects of a magnetic storm.
An original DIA package for detection, identification, and analysis of ionosphere anomalies from satellite spectrograms and time series row data from instruments aboard the DEMETER satellite was created. Using this software, the analyses of ionosphere parameter variations caused by various artificial and natural factors are provided in the ISTT.
The scientific data processing and visualization technologies used in the development of DIA can be used in the creation of software for other scientific space missions.
The application of the developed software on the example of complex analysis of the state of the medium-width latitude ionosphere according to its various parameters based on satellite data during a geomagnetic storm on 20 January 2010 is considered. According to these data, the presence of electrostatic vibrations in the frequency range of 100–400 Hz, which are quite difficult to connect directly with the geomagnetic storm, was revealed in the ELF spectrum of electric field strength. Also, there was variations in the temperature and velocity of ions; however, they fall at lower latitudes, and it is also quite difficult to connect them with the effects of a geomagnetic storm, since similar variations were observed for quite half orbits. During the maximum of the geomagnetic storm, electrons with an energy of 160 keV from the Earth's internal radiation belt are precipitated.
A certificate of the Republic of Kazakhstan on the entry of information into the state register of rights to objects protected by copyright no. 11767 of 26 August 2020 was received for the developed package.
The DIA package code is available on: https://drive.google.com/drive/folders/1qwFEMWCqotXnhKZ2at9ZUFLHarmQaKw8?usp=sharing (last access: 2 December 2021, Lozbin et al., 2021).
Data sets from DEMETER Instruments are available at mission website: http://demeter.cnrs-orleans.fr/, last access: 2 December 2021, (Berthelier et al., 2006; Parrot et al., 2006; Cussac et al., 2006).
AL proposed the idea and concept of the paper, made analytical calculations, wrote the initial version of the paper, and took part in the revision of the paper. VF and OK contributed to the data analysis and paper writing. All the authors took part in the results analysis, developing the concept of the paper and writing the initial version of the paper. AL and VF contributed to the preparation of the final version of the paper.
The contact author has declared that neither they nor their co-authors have any competing interests.
Publisher’s note: Copernicus Publications remains neutral with regard to jurisdictional claims in published maps and institutional affiliations.
This research was performed as part of a doctoral project of a PhD student of Al-Farabi Kazakh National University.
This paper was edited by Dalia Buresova and reviewed by three anonymous referees.
Baker, D. N., Kanekal, S. G., Li, X., Monk, S. P., Goldstein, J., and Burch, J. L.: An extreme distortion of the Van Allen belt arising from the “Halloween” solar storm in 2003, Nature, 432, 878–881, https://doi.org/10.1038/nature03116, 2004. a
Berthelier, J. J., Godefroy, M., Leblanc, F., Malingre, M., Menvielle, M., Lagoutte, D., Brochot, J. Y., Colin, F., Elie, F., Legendre, C., Zamora, P., Benoist, D., Chapuis, Y., Artru, J., and Pfaff, R.: ICE, the electric field experiment on DEMETER, [data set], Planet. Space Sci., 54, 456–471, https://doi.org/10.1016/j.pss.2005.10.016, 2006. a, b, c
Cussac, T., Clair, M.-A., Ultré-Guerard, P., Buisson, F., Lassalle-Balier, G., Ledu, M., Elisabelar, C., Passot, X., and Rey, N.: The Demeter microsatellite and ground segment, [data set], Planet. Space Sci., 54, 413–427, https://doi.org/10.1016/j.pss.2005.10.013, 2006. a, b
Gamble, R. J., Rodger, C. J., Clilverd, M. A., Sauvaud, J.-A., Thomson, N. R., Stewart, S. L., McCormick, R. J., Parrot, M., and Berthelier, J.-J.: Radiation belt electron precipitation by man-made VLF transmissions, J. Geophys. Res.-Space, 113, A10211, https://doi.org/10.1029/2008JA013369, 2008. a
Li, X. and Temerin, M. A.: The Electron Radiation Belt, Space Science Reviews volume, 95, 569–580, https://doi.org/10.1023/A:1005221108016, 2001. a
Lozbin, A., Inchin, A., and Shpadi, M.: DIA Software package, [code], available at: https://drive.google.com/drive/folders/1qwFEMWCqotXnhKZ2at9ZUFLHarmQaKw8?usp=sharing, last access: 2 December 2021. a
Merikallio, S.: Analysis and visualisation software for DEMETER Langmuir Probe instrument, REPORTS No. 2006:10, 2006. a
Molchanov, O.: Low frequency waves and induced radiation in near-Earth plasma, M. Nauka, 1985. a
Molchanov, O., Rozhnoi, A., Solovieva, M., Akentieva, O., Berthelier, J. J., Parrot, M., Lefeuvre, F., Biagi, P. F., Castellana, L., and Hayakawa, M.: Global diagnostics of the ionospheric perturbations related to the seismic activity using the VLF radio signals collected on the DEMETER satellite, Nat. Hazards Earth Syst. Sci., 6, 745–753, https://doi.org/10.5194/nhess-6-745-2006, 2006. a
Moldabekov, M. M., Inchin, A. S., Shpadi, Y. R., and Lozbin, A. Y.: Kazakhstan scientific space system project, Solar Syst. Res., 45, 652–656, https://doi.org/10.1134/S0038094611070197, 2011. a
Parrot, M., Benoist, D., Berthelier, J. J., Błe˛cki, J., Chapuis, Y., Colin, F., Elie, F., Fergeau, P., Lagoutte, D., Lefeuvre, F., Legendre, C., Lévêque, M., Pinçon, J. L., Poirier, B., Seran, H. C., and Zamora, P.: The magnetic field experiment IMSC and its data processing onboard DEMETER: Scientific objectives, description and first results, [data set], Planet. Space Sci., 54, 441–455, https://doi.org/10.1016/j.pss.2005.10.015, 2006. a, b
Parrot, M., Sauvaud, J. A., Berthelier, J. J., and Lebreton, J. P.: First in-situ observations of strong ionospheric perturbations generated by a powerful VLF ground-based transmitter, Geophys. Res. Lett., 34, L11111, https://doi.org/10.1029/2007GL029368, 2007. a
Sauvaud, J. A., Moreau, T., Maggiolo, R., Treilhou, J. P., Jacquey, C., Cros, A., Coutelier, J., Rouzaud, J., Penou, E., and Gangloff, M.: High-energy electron detection onboard DEMETER: The IDP spectrometer, description and first results on the inner belt, Planet. Space Sci., 54, 502–511, https://doi.org/10.1016/j.pss.2005.10.019, 2006. a
Sauvaud, J. A., Maggiolo, R., Jacquey, C., Parrot, M., Berthelier, J. J., Gamble, R. J., and Rodger, C. J.: Radiation belt electron precipitation due to VLF transmitters: Satellite observations, Geophys. Res. Lett., 35, L09101, https://doi.org/10.1029/2008GL033194, 2008. a