the Creative Commons Attribution 4.0 License.
the Creative Commons Attribution 4.0 License.
 | 02 May 2022
Propagating characteristics of mesospheric gravity waves observed by an OI 557.7 nm airglow all-sky camera at Mt. Bohyun (36.2° N, 128.9° E)
Jun-Young Hwang
Yong Ha Kim
Hosik Kam
Seok-Min Song
Young-Sil Kwak
Tae-Yong Yang
We analysed all-sky camera images observed at Mt. Bohyun observatory (36.2∘ N, 128.9∘ E) for the period 2017–2019. The image data were acquired with a narrowband filter centred at 557.7 nm for the OI airglow emission at ∼ 96 km altitude. A total of 150 wave events were identified in the images of 144 clear nights. The interquartile ranges of wavelength, phase speed and periods of the identified waves are 20.5–35.5 km, 27.4–45.0 m s−1 and 10.8–13.7 min with the median values of 27.8 km, 36.3 m s−1 and 11.7 min, respectively. The summer and spring bias of propagation directions of north-eastward and northward, respectively, can be interpreted as the effect of filtering by the prevailing winds in the lower atmosphere. In winter the subdominant north-westward waves may be observed due to a nullified filtering effect by slow northward background wind or secondary waves generated in the upper atmosphere. Intrinsic phase speeds and periods of the waves were also derived by using the wind data simultaneously observed by a nearly co-located meteor radar. The nature of vertical propagation was evaluated in each season. The majority of observed waves are found to be freely propagating and thus can be attributed to wave sources in the lower or upper atmosphere.
- Article
(3501 KB) - Full-text XML
- BibTeX
- EndNote


Short-period atmospheric gravity waves (< 100 min) are well known for playing an important role in carrying energy and momentum from the lower atmosphere, propagating upward, and depositing them into the mesosphere and lower thermosphere (MLT) region (Lindzen, 1981; Fritts and Alexander, 2003). In the mid- and high-latitude MLT region, the transported energy and momentum are deposited through the breaking and dissipating processes of gravity waves, and they affect significantly the zonal flow in both hemispheres, which in turn causes the pole-to-pole circulation resulting in the cold and warm mesosphere in summer and winter, respectively (Lindzen, 1981; Fritts and Vincent, 1987; Fritts and Alexander, 2003; Becker, 2012). Atmospheric gravity waves are generated by a number of causes or mechanisms, such as mountainous terrain, convective activity triggered by severe weather phenomena, wind shear and areas with high baroclinic instability (Fritts and Alexander, 2003).
The characteristics of short-period gravity waves have been studied by the observation of airglow emission in the MLT region. The airglow imaging technique has been developed to observe gravity waves directly by using a wide-field or all-sky lens with a highly sensitive, cooled charge-coupled device (CCD) detector. The observation using an all-sky camera has the advantage of being able to derive various parameters of gravity waves through a series of processing in time and spatial domains. Time series of all-sky airglow images can be converted into a series of two-dimensional image arrays that can be analysed objectively to obtain the horizontal wavelength, propagation phase speed and period of the wave (Taylor et al., 1993).
An all-sky imager had been deployed at Bohyun observatory (BHO; 36.2∘ N, 128.9∘ E) to observe various airglows, including OH Meinel 720–910 nm, O2 atmospheric band near 865.7 nm, OI 630 nm and OI 557.7 nm in the pilot period 2002–2005. Later, the all-sky camera at BHO focused on the OI 557.7 airglow observation, because the throughput of the OI 557.7 filter is far more efficient than other filters. The previous studies with the all-sky observation at BHO have reported seasonal variation of wave parameters and horizontal propagation directions (Kim et al., 2010; Yang et al., 2015).
The characteristics of vertical propagation of gravity waves can be determined by the relationship between the horizontal phase speed of gravity waves and the background wind field and vertical temperature profile. The nature of vertical propagation can be classified into critical-level filtering, ducting and freely propagating modes. The critical-level filtering effect is caused when the horizontally propagating wave meets with the same vector of background wind, and the wave would be absorbed or reflected out (Kim and Chun, 2010; Heale and Snively, 2015). The wave that is reflected from the upper and (or) lower altitude regions can be (partially) ducted (Fritts and Alexander, 2003). The wave ducting can occur when the wave propagates against background wind field, at which the background wind profile has a local maximum, called Doppler ducting (Chimonas and Hines, 1986; Isler et al., 1997; Nappo, 2002; Suzuki et al., 2013). In addition, large vertical changes in background winds such as wind shear or curvature wind can provide a favourable condition to cause Doppler ducting (e.g. Chimonas and Hines,1986; Isler et al., 1997). The ducted wave can horizontally propagate for much longer distance than freely propagating waves (Isler et al., 1997; Hecht et al., 2001; Pautet et al., 2005). In freely propagating mode, horizontally propagating waves can be Doppler shifted by opposing or forwarding background wind. Therefore, the background wind can play a crucial role in evaluating the nature of both vertical and horizontal propagation of gravity waves. Fortunately, we were able to take advantage of the background wind measurements around the OI airglow layer by a meteor radar (MR) at Gyeryong nearby BHO.
This study reports the characteristics of the observed and intrinsic parameters of gravity waves by using the all-sky imaging data for the period 2017–2019 along with the mesospheric wind data that were simultaneously observed by a meteor radar. The intrinsic parameters of gravity waves allow us to understand the relation between the observed wave directions and the background winds as well as the nature of vertical propagation at the mid-latitude mesosphere around East Asia.
We analysed OI 557.7 airglow images observed by the all-sky camera at BHO from April 2017 through to December 2019. Images of the total of 144 nights were used in the analysis by excluding the cases of cloudy and/or moonlit nights and equipment malfunction. The all-sky camera at BHO is an ultra-high-speed () 3 in. camera composed of a fisheye lens with a viewing angle of 180∘, telecentric lens to adjust airglow emission light path for parallel incident to filter, a six-position filter wheel installed with two narrowband filters (OI 557.7, OI 630.0), and a 1024 × 1025 CCD detector. All-sky images were obtained with 4 × 4 binning to increase signal-to-noise ratios. A detailed description of the all-sky camera at BHO is given in Yang et al. (2015). The OI 557.7 nm filter has a central wavelength of 557.81 nm with a full width at half maximum of 1.53 nm. The images with the OI 557.7 filter were obtained continuously at intervals of 5 min with an exposure time of 90–150 s and a spatial resolution of 500 km radial region. The OI 630.0 nm filter was not used in this period of observation.
A very-high-frequency (VHF) meteor radar system has been operating at Gyeryong station (36.2∘ N, 127.1∘ E) since November 2017. The Enhanced Meteor Detection Radar (EMDR) system (supplied by ATRAD Pty Ltd.) is an interferometric radar consisting of five channels. The system is operated with specifications of a transmitter peak power of 24 kW, with duty cycle of 8.4 % from November 2017–May 2018 and 4.2 % from May 2018 to the present. The meteor radar provides meridional and zonal winds at 2 km bin in the 80–100 km altitude range every hour. The wind data were utilized when the intrinsic wave parameters and vertical propagation were examined. In addition, the temperature data between 80 and 100 km were adopted from the Sounding of the Atmosphere using Broadband Emission Radiometry (SABER) instrument (Russell et al., 1999; Mlynczak et al., 2020) on board the TIMED satellite. The temperature measurement by SABER covers the altitude range of 15–110 km. The temperature data are selected for an airglow observation at the BHO site by allowing the differences of ± 30∘ longitude and ± 8∘ latitude within 1–2 local time hours. The temperature data are utilized when the Brunt–Väisälä frequency was computed to evaluate the vertical wavelengths of gravity waves. In addition, seasonal variations of night-time winds are identified in the middle atmosphere to confirm the filtering effect of gravity waves by using Modern-Era Retrospective analysis for Research and Applications version 2 (MERRA-2) data (Gelaro et al., 2017; Rienecker et al., 2011). MERRA-2 is an atmospheric reanalysis model created by NASA's Global Modeling and Assimilation Office (GMAO, https://gmao.gsfc.nasa.gov/reanalysis/MERRA-2/data_access/, last access: 20 November 2020). MERRA-2 reanalysis data are available for 0–80 km altitudes and 0.5∘ × 0.625∘ latitude and longitude resolutions.
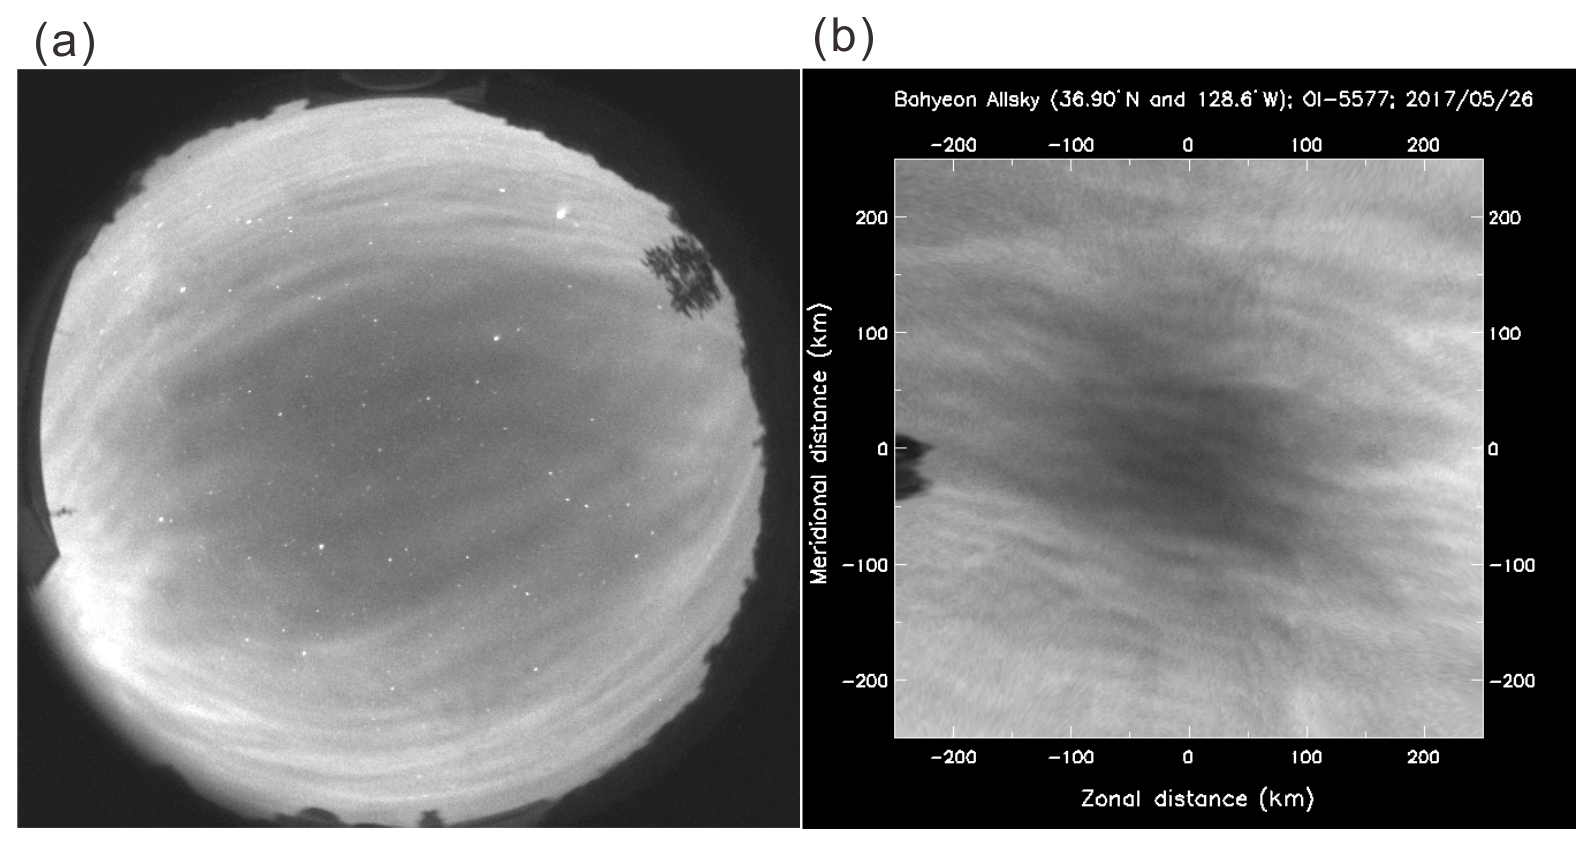
Figure 1(a) An all-sky image with the OI 557.7 nm filter and (b) an image after star removal and coordinate transformation. The image was observed at 15:32:33 UT on 26 May 2017.
The procedure to acquire the wave parameters can be separated into two steps: preprocessing of all-sky camera images and the image processing with 2D image. The preprocessing includes image selection of clear nights (see Fig. 1a), star removing, and transforming the fisheye lens image into the horizontal plane image (500 km × 500 km; see Fig. 1b) at the OI 557.7 airglow altitude of 96 km. The details about the preprocessing method are provided in Kam et al. (2017).
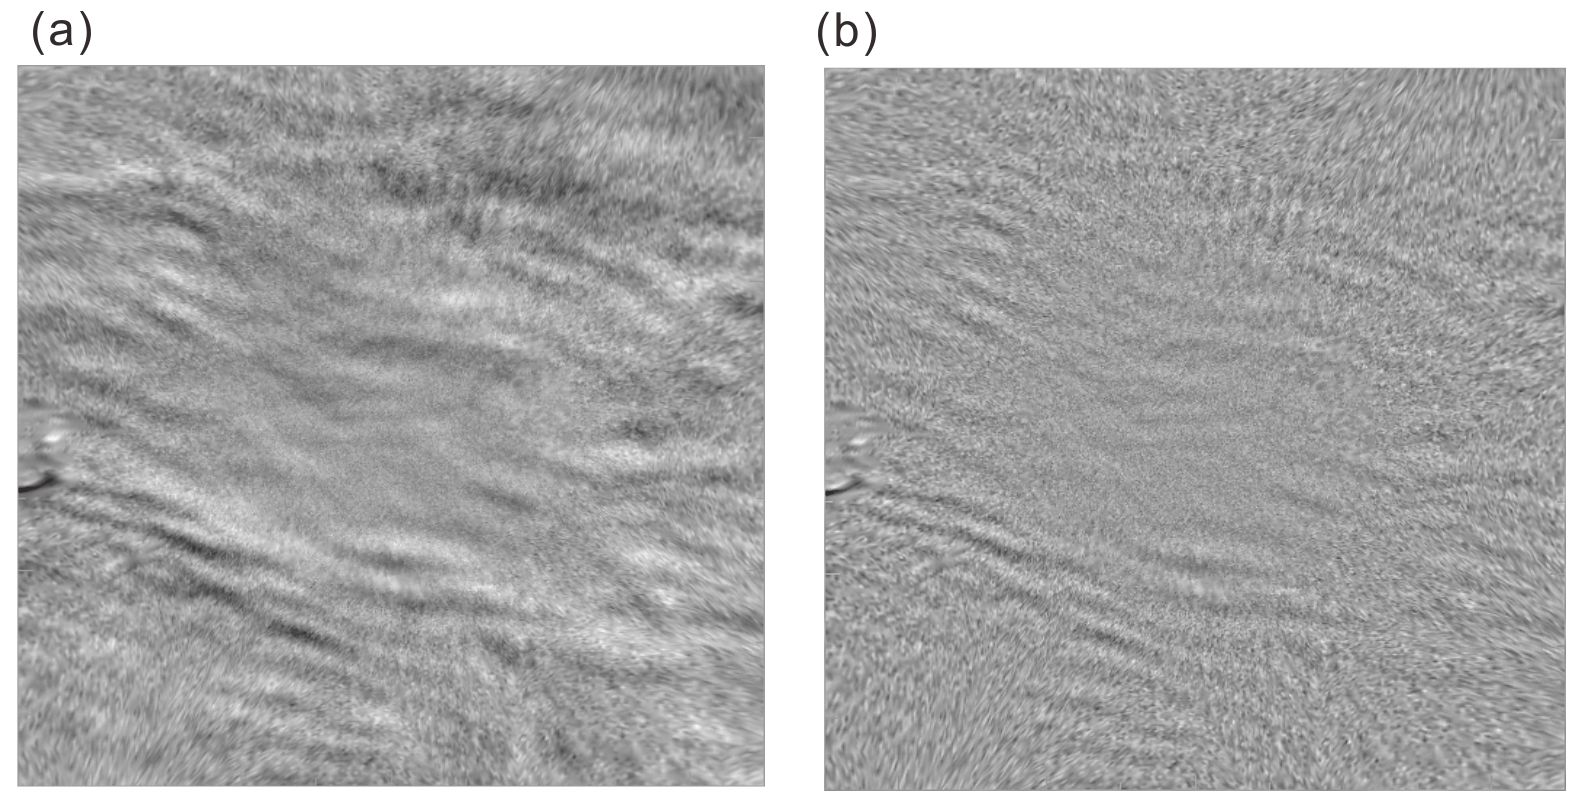
Figure 2(a) A time-difference image (TD image) obtained by subtracting two successive images; (b) an image after large-scale modulation removed from (a) by applying 2D bandpass filtering.
Time series of preprocessed images were first converted into time-difference (TD) images (Fig. 2a), from which large-scale modulation was removed by applying 2D bandpass filtering (Fig. 2b). The TD image is obtained from two consecutive images (see Fig. 1b) by subtracting one from the other. We then applied a 2D fast Fourier transform (FFT) to derive wave parameters of quasi-monochromatic waves from the series of TD images (Tang et al., 2005).
The 2D FFT operation of two TD images produces 2D spectrum arrays of J1 and J2, which can be cross-correlated as in Eq. (1) to derive a phase difference (ϕ1−ϕ2) of the wave:
where kx and ky are zonal and meridional wave numbers, respectively. The value of |R1R2|2 derived from |f(kx,ky)|2 represents the magnitude of the wave. The dominant wave was chosen at the maximum magnitude, whose kx and ky values provide the wavelengths of the dominant wave. Along with the time difference and the wavelength information, the phase difference allows us to determine the observed (apparent) phase speed of the dominant wave.
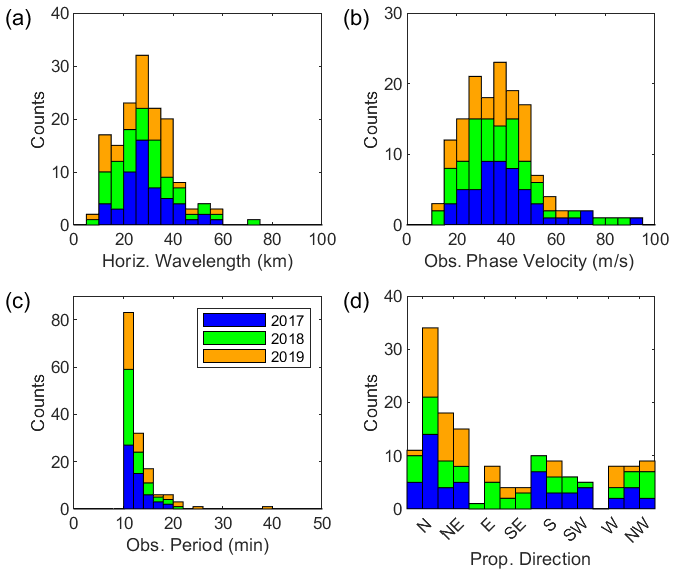
Figure 3The parameters of the observed waves in the OI 557.7 airglow layer from 2017–2019; (a) wavelength, (b) phase velocity, (c) period and (d) propagation direction. Colours of blue, green and orange correspond to each year of 2017, 2018 and 2019, respectively.
A total of 150 wave events were identified from the all-sky image data for 3 years (2017–2019). For these wave events, observed parameters of the dominant wave including horizontal wavelength, phase speed, period and propagation direction are derived, and their distributions are plotted as in Fig. 3. The interquartile range (IQR) of wavelength spanned from 20.5–35.5 km with a median value of 27.8 km, the observed phase speed IQR is from 27.4–45.0 m s−1 with a median of 36.3 m s−1 and the observed period IQR is from 10.8–13.7 with a median of 11.7 min. In addition, the predominant propagating directions are north (44 %) and north-east (33 %). The characteristics of these wave parameters were similar to the results by Kim et al. (2010).
Table 1Seasonal median values and interquartile ranges (IQRs) of observed wave parameters (horizontal wavelength, λ; phase speed, cobs; and period, τ) observed at Mt. Bohyun for 2017–2019.
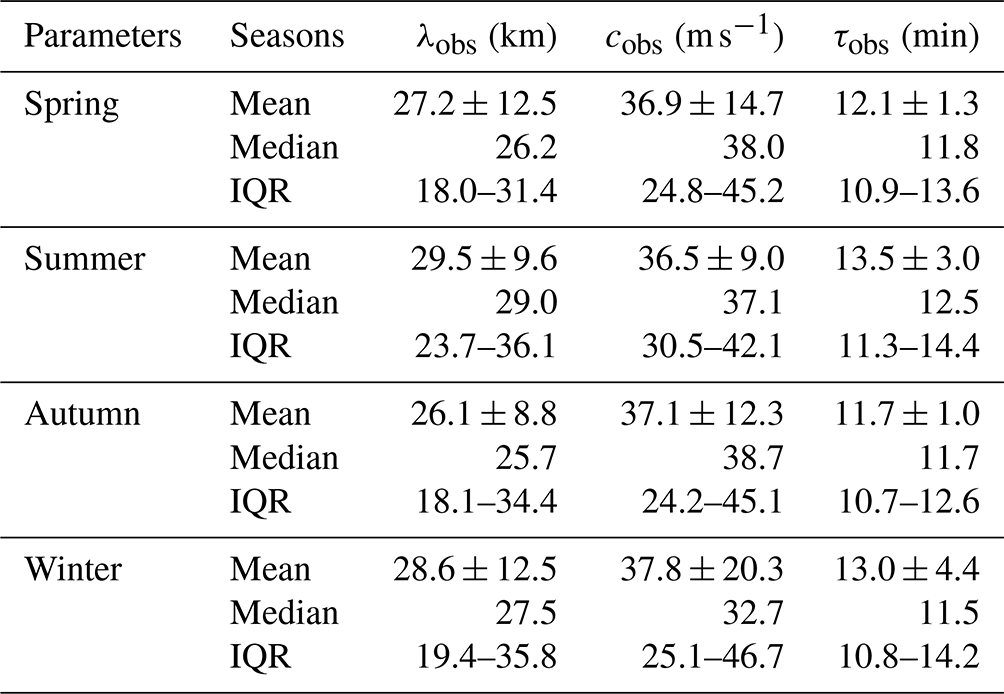

Figure 4Propagation vectors (left) and the occurrences (right) of observed waves in the OI airglow over the 3 years from 2017 to 2019. (a) Spring, (b) summer, (c) autumn and (d) winter. The number on the arc lines indicate (left) the phase velocity and (right) occurrences in each radial direction. Wave propagation directions are divided into eight regions by a clockwise azimuth angle of 45∘ from −22.5 to 315∘, corresponding to the north (N), north-east (NE), east (E), south-east (SE), etc. In autumn, both equipment problems and poor weather resulted in a particularly small number of observations compared to other seasons.
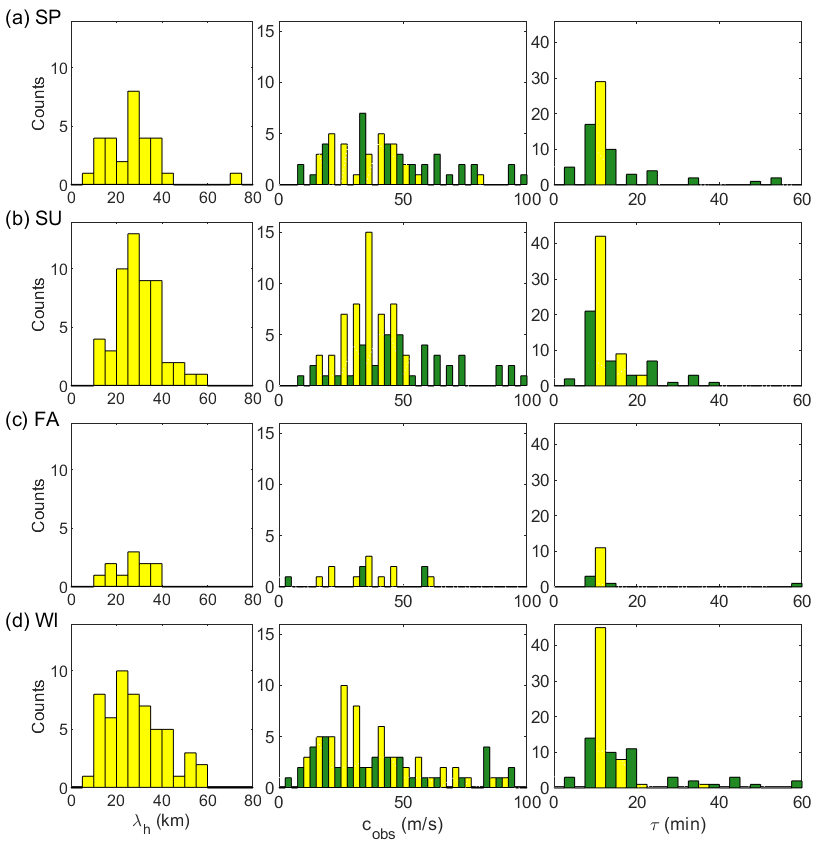
Figure 5Seasonal distributions of observed (yellow) and intrinsic (green) wave parameters. Each row represents (a) spring, (b) summer, (c) autumn (denoted FA for fall), and (d) winter. Observed gravity waves are in total 150 events from April 2017 to December 2019, while intrinsic wave parameters were derived for 95 events when both wind data and temperature data were available from the nearly co-located meteor radar and a nearby area overpassed by TIMED/SABER, respectively.
In order to compare consistently with the results by Takeo et al. (2017), which reported similar observations in the East Asia, we divided seasons in the same way: from 21 February–19 April (2 months) for spring, from 20 April–20 August (4 months) for summer, from 21 August–20 October (2 months) for autumn, and from 21 October–20 February (4 months) for winter. Seasonal wave propagation vectors and their occurrences are shown in Fig. 4a–d. The seasonal occurrences for observed (yellow) horizontal wavelength, observed phase speed and observed period are shown in Fig. 5; intrinsic (green) phase speed and period are also shown. The mean and median values of the parameters for each season are summarized in Table 1. In spring, the propagation is primarily to the north-east and next the north, which take up 35 % and 24 % out of 29 cases, respectively, as shown in Fig. 4a. In summer, propagation directions to the north (50 %) and north-east (35 %) are dominant (Fig. 4b). In autumn, the wave seems to propagate all directions without preference (Fig. 4c). The autumn season contains a particularly small number of wave events due to equipment problems and poor weather. In winter, the propagation directions seem to be grouped into the south (27 %), north-west (23 %) and south-west (16 %) (see Fig. 4d). In terms of the median values, the observed phase speed in winter is particularly slower than other seasons, whereas other parameters show little variation. Overall it is evident that in spring and summer, the northward- and north-eastward-propagating gravity waves are dominant, whereas in winter the southward and north-westward propagations are dominant. The distinct seasonal properties of propagation direction can be attributed to the filtering effect by the background wind field during the gravity wave propagation from the lower atmosphere (e.g. Kim et al., 2010; Kim and Chun, 2010; Heale and Snively, 2015).
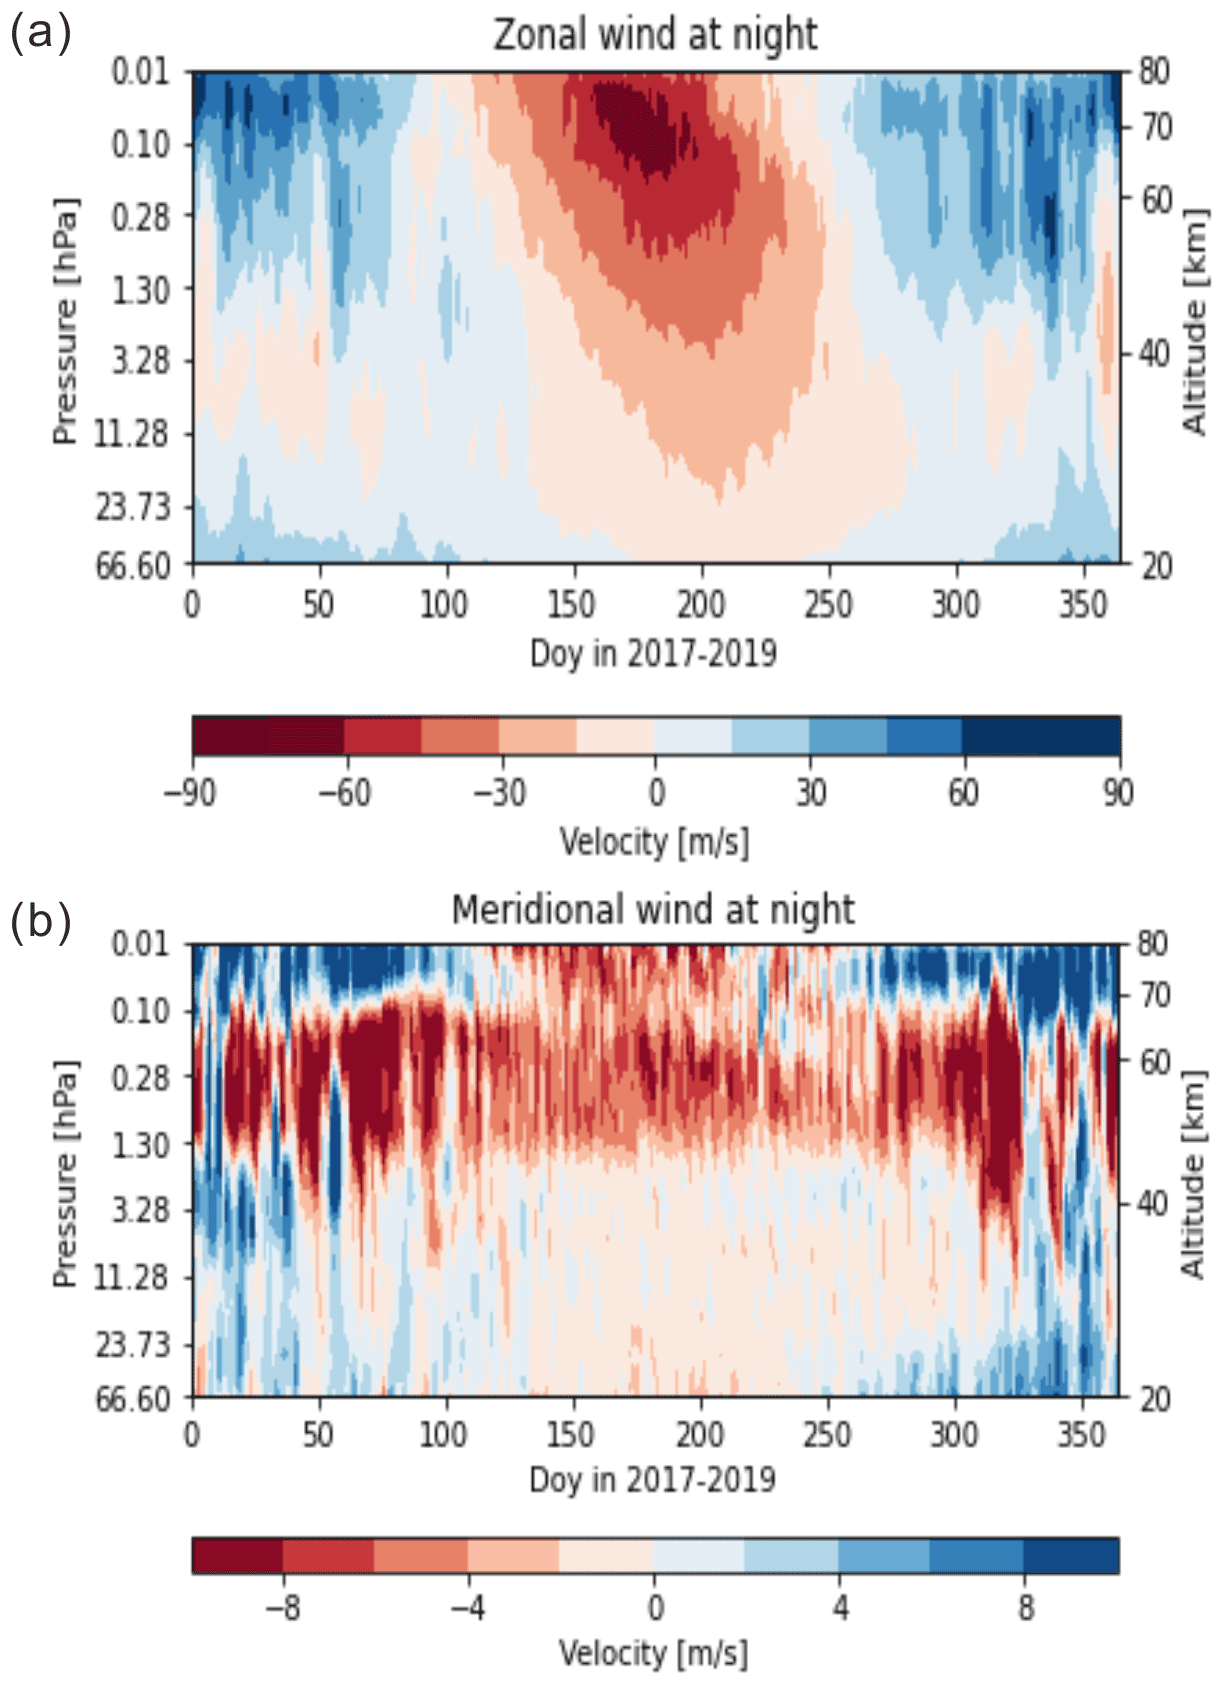
Figure 6Seasonal variations of night-time (upper) zonal and (lower) meridional wind vectors in terms of day number (1–356) and 20–80 km (56–0.01 hPa) altitude from MERRA-2 reanalysis data for 2017–2019.
In order to confirm the filtering effect on the seasonal variation of observed propagation direction, we checked the horizontal winds of MERRA-2 data (Gelaro et al., 2017; Rienecker et al., 2011). In Fig. 6 seasonal variations of night-time winds are plotted from 20–80 km (56–0.01 hPa) for 2017–2019. Here in the spring and summer the westward wind is dominant in the middle atmosphere (40–80 km), whereas in the autumn and winter the eastward wind is dominant. One needs to note that the spring division (21 February– 19 April) includes some of the eastward wind occurrences. In addition, MR-observed annual variations of zonal and meridional winds for years 2017–2020 are available for 80–100 km (Kam et al., 2021). Here, prevailing winds in spring and summer are observed in westward and southward at 80–100 km, seemingly continued from ∼ 30–80 km altitudes, while in winter eastward winds are maintained at 80–100 km but slow northward winds (< ∼ 10 m s−1) at less than 90 km turn to the south above 90 km. It is reasonable to suggest that westward waves in spring and summer may have been filtered out by the westward wind and thus are hardly observed. The southward wind in spring and summer may also have filtered out the southward waves, which is consistent with our observation. Furthermore, in summer it is well known that the convective system of typhoons or tropical cyclones can be significant sources of gravity waves in the middle latitude. The typhoon-generated gravity waves in the south of the Korean Peninsula can propagate in any directions, but the westward-propagating waves might be filtered out in the stratosphere by the prevalent westward wind. Therefore, northward- or north-eastward-propagating waves are obviously observed in the Korean Peninsula. The details about typhoon-generated gravity waves can be referred to in Kim and Chun (2010). In winter, it is expected that eastward/northward waves be well filtered out by prevailing eastward/northward winds. However, although our observation shows southward/westward preferential directions (see Fig. 4d), north-westward waves are also subdominant. The significant northward component of the wave direction may not be blocked by the filtering effect. Meanwhile, it seems to survive on upward propagation up to 96 km due to the low velocity (< 10 m s−1) of northward mean field. Otherwise, the north-westward wave in winter may be interpreted as secondary waves or waves generated in the upper mesosphere.
Previous studies of mid-latitude gravity waves have reported that gravity waves in eastward and northward propagations dominate most of the summer (Taylor et al., 1993; Nakamura et al., 1999; Walterscheid et al., 1999; Hecht et al., 2001; Ejiri et al., 2003; Tang et al., 2005). Observations at BHO have confirmed the similar tendency of propagation in summer (Kim et al., 2010; Yang et al., 2015). The summer bias of wave propagation can be distinctly due to the critical-level filtering by the prevailing zonal and meridional winds in the lower atmosphere. However, the tendency of wave propagation also likely shows different patterns according to localized sources. For example, in spring for Shigaraki (34.9∘ N, 136.1∘ E) Takeo et al. (2017) observed using the OI 557.7 nm filter the dominant south-westward propagation in addition to the north-eastward that is similar to our results in Fig. 4a. In winter, the southward (equatorward) propagation was dominant in several studies although less than in summer (Hecht et al., 2001; Ejiri et al., 2003; Tang et al., 2005). Both Ejiri et al. (2003) and Takeo et al. (2017) observed southward-dominant propagation for Shigaraki in winter. Besides, Ejiri et al. (2003) found that winter preferential propagation may vary with latitudes, because both southward- and poleward-dominant propagations in both OH and OI observations were observed at Rikubetsu (43.6∘ N), a relatively high latitude site.
The OI 557.7 nm airglow layer has been reported to peak at 96 km with a thickness of ∼ 7–9 km, including both disturbed and undisturbed conditions (Vargas et al., 2007). The waves with a vertical wavelength less than the airglow layer thickness may not be detected by an airglow imager due to sinusoidal cancellation (Nielsen et al., 2012; Vargas et al., 2007). The vertical wavelength of the observed wave can be derived from the simplified dispersion relation of gravity waves while excluding wind curve and wind shear terms (e.g. Nappo, 2002), such as
where N is the Brunt–Väisälä frequency, ci is the intrinsic phase speed of gravity wave and Hs is the scale height. The MR-measured wind profiles are not accurate enough to estimate the wind curve and shear terms. The intrinsic phase speed, ci, can be expressed as c−u, where c is the wave phase speed, and u is the background wind speed in the wave propagating direction. The Brunt–Väisälä frequency is given as
where g is the acceleration due to gravity, 9.55 m s−2; T is the atmospheric temperature; and Cp is a specific heat capacity at constant pressure, adopted as 1005 for dry air (Brasseur and Solomon, 2005). Hs is given with , where R is the gas constant of dry air (287 ).
The intrinsic phase speeds of waves were computed by utilizing the wind at 96 km simultaneously measured by the Gyeryong meteor radar. The intrinsic period (τi) is calculated by , where λh is the observed horizontal wavelength. The IQR of intrinsic phase speed of gravity waves in spring spanned from 19.4–72.0 m s−1 with a median value of 41.5 m s−1, and the IQR of intrinsic period is from 6.3–20.0 min with a median of 10.0 min. In summer the corresponding IQR values are 28.2–64.0 m s−1 with a median of 48.1 m s−1 and 6.5–20.9 min with a median of 9.8 min; in winter, the IQR values are 10.0–56.7 m s−1 with a median of 28.6 m s−1 and 7.9–18.1 min with a median of 13.1 min. It is noted that the intrinsic speeds for spring and summer are larger than the observed ones (see Fig. 5), implying that the majority of waves occurred in the opposite direction to the background wind. The intrinsic speed has been merely shifted to the larger one observed by the Doppler effect. The results of intrinsic parameters exist in the typical values of gravity wave parameters such as intrinsic phase speeds of 30–100 m s−1 and intrinsic periods from 5–50 min (Taylor et al., 1997; Swenson et al., 2000; Hecht et al., 2001; Ejiri et al., 2003).
The nature of vertical propagation can be evaluated by the vertical wave number squared, m2 (Isler et al., 1997). If m2 is greater than zero in the airglow-observed MLT region, the gravity wave is in freely propagating mode. If m2 is less than zero, the wave is vertically evanescent, which indicates wave motion only in the horizontal propagation. If the freely propagating region is bounded by evanescent regions below and above, the wave is in ducting mode. If it is bounded by an evanescent region on only one side, below or above, it is in partial ducting mode.
Table 2Vertical propagation nature of gravity waves at Mt. Bohyun for 2017–2019.

Based on the m2 profile in 90–100 km centred at 96 km, the nature of vertical propagation can be classified for seasons, as summarized in Table 2. For autumn season, there are only a few data available, so it is not meaningful in a statistical aspect. Freely propagating waves take up a maximum of 89 % in summer and a minimum of 60 % in spring. For the other maximum and minimum seasons, ducted waves were 12 % and 0 % in spring and summer, respectively; partial ducting takes up 16 % and 3 % for spring and winter, respectively; evanescent waves take up 18 % and 4 % for winter and summer, respectively. Freely propagating waves take up a majority, while (partially) ducted waves and evanescent waves cannot be ignored. Freely propagating waves show vertical wavelengths with a median value of 14 km, and IQR ranged from 6.6–19.6 km.
The wave ducting can be primarily caused by the background wind, so-called Doppler ducting, or primarily by a variation of Brunt–Väisälä frequency, so-called thermal ducting. Doppler ducting is favourable when the wind profile has a local maximum against the wave propagation, and thermal ducting is typically present at temperature increase to give a peak of N2 profile (e.g. Chimonas and Hines, 1986; Isler et al., 1997; and Nappo, 2002; Walterscheid and Hickey, 2009). We determine Doppler ducting or thermal ducting by utilizing simultaneously measured wind profiles derived from meteor radar and SABER temperature in Eq. (2).
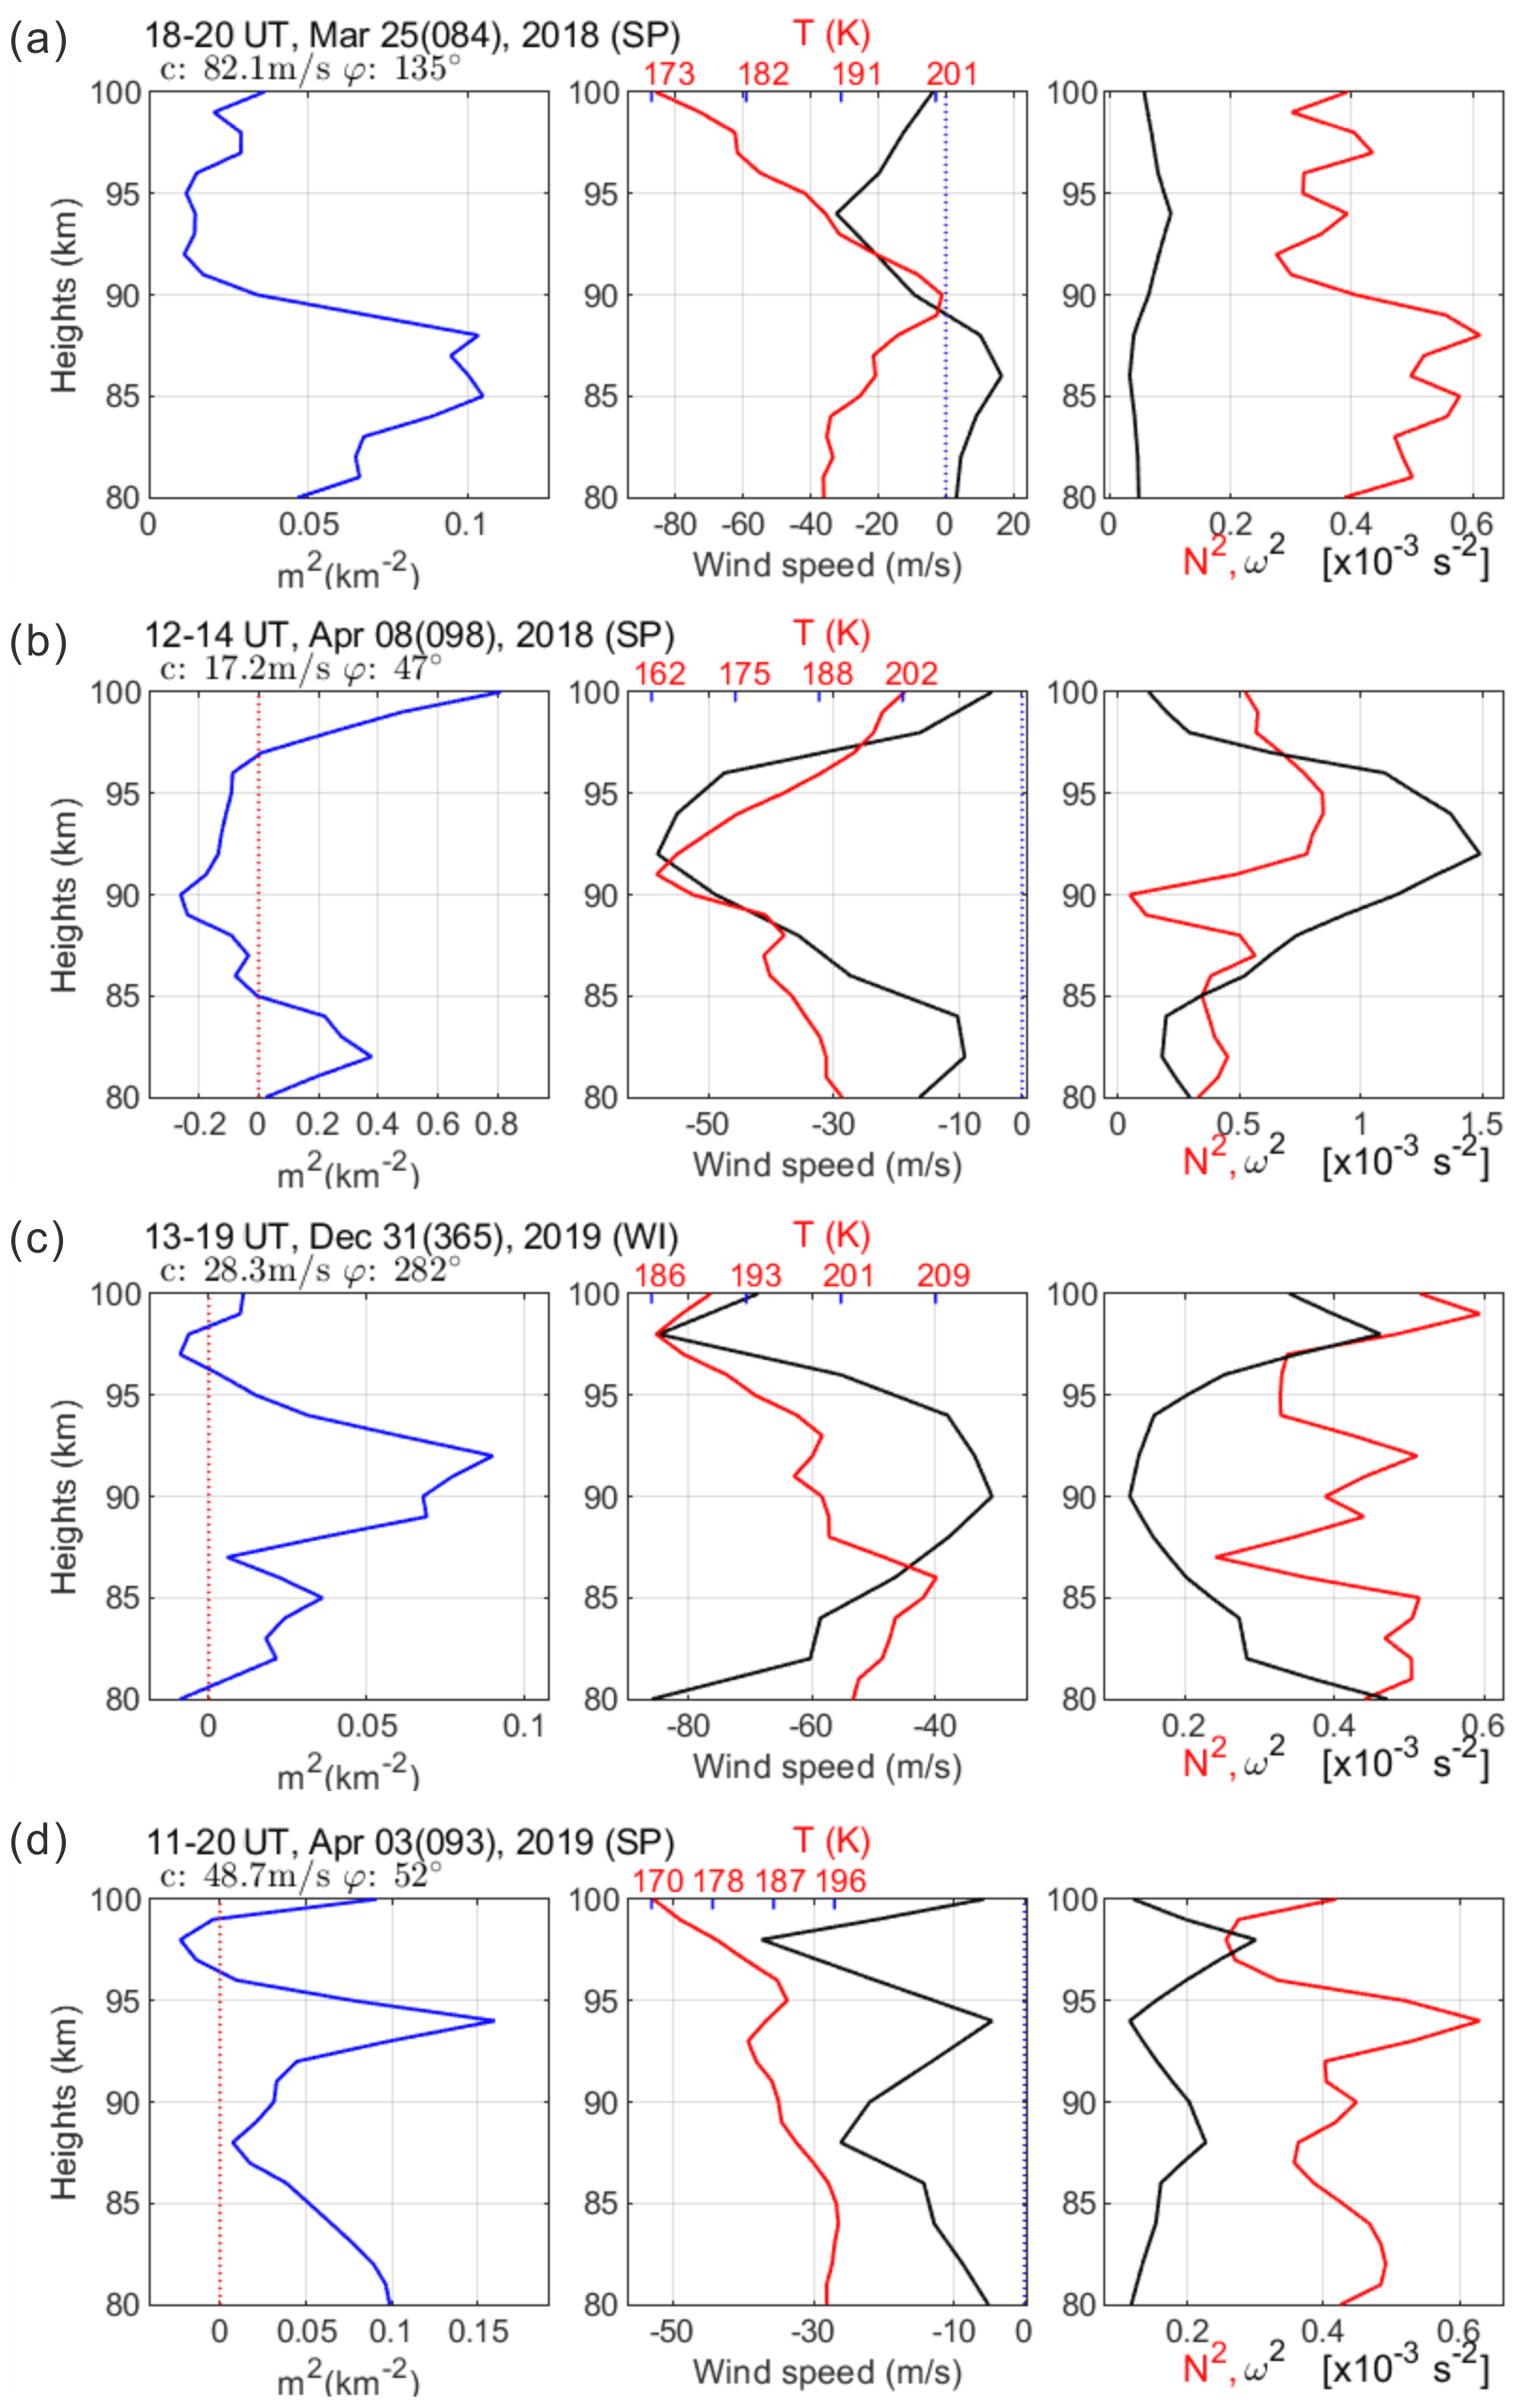
Figure 7Examples of vertical propagation characteristics evaluated by vertical wave number squared, m2, and the relation with temperature and horizontal wind. (left) The profile of m2; (middle) wind speed aligned to wave propagating direction and temperature (red); (right) Brunt–Väisälä frequency squared (N2, red) and intrinsic frequency squared (ω2). (a) Freely propagating, (b) evanescent based on negative m2 at 90–97 km, (c) ducted as encompassed by negative m2, and (d) partially ducted by above m2. Each title is noted with the applied gravity wave occurring time, date and season. In addition, c and φ indicate the apparent phase speed and azimuth angle of the horizontal propagation, respectively.
Examples of vertical propagation nature appraised by m2 are shown in Fig. 7a–c, where the left panel presents the m2 profile, and the middle panel displays the MR wind profile projected onto the wave propagating direction and the temperature (red, referring to upper axis) obtained from SABER, in which the negative wind means that the wind blows opposite to the wave propagation direction, and the right panel presents N2 (red) and ω2 profiles (, where τi is intrinsic period).
In Fig. 7a the gravity wave at a phase speed of c = 82.1 m s−1 was propagating south-eastward (φ = 135∘) against the background wind at 90–100 km altitudes, and the values of m2 in the 90–100 km region are all positive, indicating the freely propagating nature. It might be attributed to the wave velocity far exceeding the background wind velocity (about −30 m s−1).
Figure 7b presents an example of an evanescent wave, based on negative values of m2 in the altitude range of 84–97 km. The background wind is too fast (∼ −70 m s−1) in the opposing direction of the wave at a velocity of 17.2 m s−1, prohibiting the vertical propagation. Observed horizontal period is 11.8 min, while the intrinsic period is 3.2 min. The intrinsic frequency is greater than the Brunt–Väisälä frequency which is typical for the atmospheric layer of evanescent wave occurring. The evanescent waves (e.g. Nielsen et al., 2012; Isler et al., 1997) may be formed by the wave propagating upward from the lower atmosphere or by the secondary wave generated in situ at the airglow layer (e.g. Simkhada et al., 2009). Simkhada et al. (2009) presented a numerical result that evanescence occurs at 75–97 km from the wave forced below by the tropospheric source. It was diagnosed that the evanescent wave might be caused by encountering the opposing strong background wind field, generating vertical wind of a few metres per second to cause the perturbation at airglow layer.
Figure 7c shows an example of a ducting wave with a phase speed of 28.3 m s−1 in propagation to the north-west. Here the freely propagating region (m2 > 0) at 87–96 km is encompassed by the negative values of m2 above 96 km and below 81 km. The winds opposing the gravity wave propagation become large both above 96 km and below 81 km. Here the negative values of m2 occurring at 96–98 km and at ∼ 80–81 km can be attributed to the fast background winds. Therefore, the wave can be trapped around 93 km, vertically, but still propagate into the horizontal direction. Nielsen et al. (2012) noted that when jets occurred above and below the altitude region of freely propagating waves (m2 > 0), the wave can be bounded by evanescent regions (m2 < 0), causing Doppler ducting. Suzuki et al. (2013) observed an evidence of Doppler ducting under the large opposing winds: a northward-propagating wave at a phase speed of 48 m s−1 lasting for ∼ 5 h (11:00–17:00 UT) went through a strong southward wind, stretching over 16∘ × 16∘ in latitude and longitude. The ducted wave can be identified as Doppler ducting, associated with fast winds.
Figure 7d shows an example of partial ducting, above which an evanescent region is formed. For such a partial ducting, in the upper part an evanescent region (m2 < 0) seems to be related to N2 decreasing and a peak of freely propagating waves (m2 > 0) at 94 km corresponds to a peak of N2. According to this, the evanescent wave appears closely associated with a variation of N2, identified with thermal ducting.
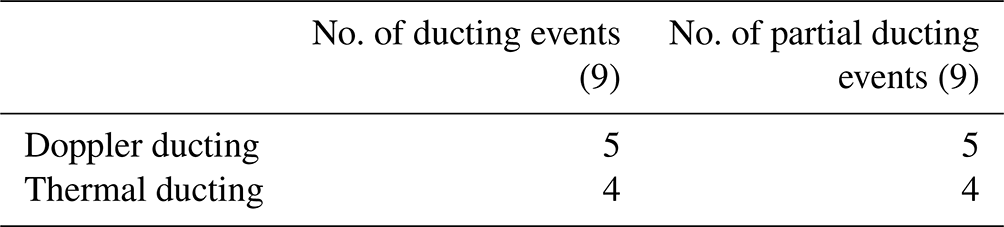
In Table 3, the ducted and partially ducted waves are categorized into either Doppler or thermal ducting. Here, it can be seen that the wave ducting above the Korean Peninsula occurs with almost equal probability of Doppler ducting or thermal ducting, although the number of observed ducting cases is not sufficient to indicate a local trend.
Table 3Classification of ducted and partially ducted waves into thermal or Doppler ducting.
This study investigated the characteristics of horizontal and vertical propagation of atmospheric gravity waves observed at Mt. Bohyun observatory (BHO; 36.2∘ N, 128.9∘ E) for the period 2017–2019. The data used are all-sky images of the OI 557.7 nm airglow layer (∼ 96 km). Wind data in the 80–100 km altitude range measured by a meteor radar at a nearly co-located site were utilized to derive intrinsic wave parameters and their vertical propagation nature.
The results of our analysis can be summarized as follows:
-
A total of 150 wave events were identified in the images of 144 clear nights. The interquartile ranges (IQRs) of wavelength, observed phase speed, and observed periods of the identified waves are 20.5–35.5 km (with a median value of 27.8 km), 27.4–45.0 m s−1 (with a median value of 36.3 m s−1) and 10.8–13.7 min (with 11.7 min median value), respectively.
-
The observed waves propagate predominantly north-eastward and northward in spring and summer, respectively. In winter the majority of waves propagate southward, but a significant portion of waves propagate northward. The seasonal preferential directions as in our observation have been reported by previous studies in East Asia and interpreted as the consequence of the critical-level filtering effect due to the prevailing wind in the lower atmosphere. The observed north-westward waves in winter may be caused by the nullified filtering effect due to small background wind field, secondary waves or waves generated in the upper mesosphere.
-
Intrinsic phase speeds and periods of the waves were also derived by using both the wind data simultaneously observed by a meteor radar and temperature data observed by TIMED/SABER. It is noted that the intrinsic speeds for spring and summer are larger than the observed ones, because the majority of waves propagate in the opposite direction to the background wind.
-
The nature of vertical propagation was evaluated in each season. The freely propagating waves take up a maximum of 89 % in summer and a minimum of 60 % in spring. For other maximum and minimum seasons, ducted waves were 12 % and 0 % in spring and summer, respectively. Evanescent waves were 18 % and 4 % in winter and summer, respectively. The majority of observed waves are found to be freely propagating. The ducted wave is more favourable in spring, and the evanescent wave is more favourable in winter.
In conclusion, we find that both horizontal and vertical propagation characteristics of the observed waves at the OI 557.7 nm airglow layer are consistent with the notion that the majority of waves originated from the lower atmosphere and experienced the filtering effect by the prevailing winds in the intermediate atmosphere.
We referred to free reanalysis wind data from https://goldsmr5.gesdisc.eosdis.nasa.gov/data/MERRA2/M2T3NVASM.5.12.4/ (Rienecker et al., 2011) for the seasonal night-time mean wind field at altitudes of 20–80 km. We also used TIMED/SABER data from FTP site ftp://saber.gats-inc.com (Russell et al., 1999) as an element in making our figures and tables.
YHK and YSL conceived of the presented idea and the design of the study. JYH and YSL manually gathered the data used. JYH, SMS and YSL programmed for data analysis. The data analysis and interpretation of the results were done by YHK and YSL. This paper was drafted and edited by YSL and JYH, and it was critically reviewed by TYY, HK, YSK and YHK for content. YSK and TYY took responsibility for overseeing the project. All authors have read and agreed to the published version of the article.
The contact author has declared that neither they nor their co-authors have any competing interests.
Publisher's note: Copernicus Publications remains neutral with regard to jurisdictional claims in published maps and institutional affiliations.
We would like to thank the anonymous reviewers for the critical reviews that helped to improve this paper.
This research was supported by basic research funding from the Korea Astronomy and Space Science Institute (KASI) (grant no. KASI2021185005).
This paper was edited by Gunter Stober and reviewed by two anonymous referees.
Becker, E.: Dynamical control of the middle atmosphere, Space Sci. Rev., 168, 238–314, https://doi.org/10.1007/s11214-011-9841-5, 2012.
Brasseur, G. and Solomon, S.: Aeronomy of the Middle Atmosphere: Chemistry and Physics of the Stratosphere and Mesosphere, 3rd Edn., Springer, Dordrecht, ISBN 978-1-4020-3284-4, 2005.
Chimonas, G. and Hines, C. O.: Doppler ducting of atmospheric gravity waves, J. Geophys. Res., 91, 1219–1230, 1986.
Ejiri, M., Shiokawa, K., Ogawa, T., Igarashi, L., Nakamura, T., and Tsuda, T.: Statistical study of short-period gravity waves in OH and OI nightglow images at two separated sites, J. Geophys. Res., 108, 4679, https://doi.org/10.1029/2002JD002795, 2003.
Fritts, D. C. and Alexander, M. J.: Gravity wave dynamics and effects in the middle atmosphere, Rev. Geophys., 41, 1–68, https://doi.org/10.1029/2001RG000106, 2003.
Fritts, D. C. and Vincent, R. A.: Mesospheric momentum flux studies at Adelaide, Australia: Observations and a gravity wave/tidal interaction model, J. Atmos. Sci., 44, 605–619, 1987.
Gelaro, R., McCarty, W., Suárez, M. J., Todling, R., Molod, A., Takacs, L., and Wargan,K.: The modern-era retrospective analysis for research and applications, version 2 (MERRA-2), J. Climate, 30, 5419–5454, 2017.
Heale, C. J. and Snively, J. B.: Gravity wave propagation through a vertically and horizontally inhomogeneous background wind, J. Geophys. Res.-Atmos., 120, 5931–5950, https://doi.org/10.1002/2015JD023505, 2015.
Hecht, J. H., Walterscheid, R. L., Hickey, M., and Franke, S.: Climatology and modelling of quasi-monochromatic atmospheric gravity waves observed over Urbana, Illinois, J. Geophys. Res., 106, 5181–5196, 2001.
Isler, J. R., Taylor, M. J., and Fritts, D. C.: Observational evidence of wave ducting and evanescence in the mesosphere, J. Geophys. Res., 102, 26,301–26,313, 1997.
Kam, H., Jee, G., Kim, Y. H., Ham, Y.-B., and Song, I.-S.: Statistical analysis of mesospheric gravity waves over King Sejong Station, Antarctica (62.2∘ S, 58.8∘ W), J. Atmos. Sol.-Terr. Phy., 155, 86–94, https://doi.org/10.1016/j.jastp.2017.02.006, 2017.
Kam, H., Kwak, Y.-S., Yang, T.-Y., Kim, Y., Kim, J., Lee, J., Choi, S., and Baek, J.-H.: Characteristics of Horizontal Winds in the Mesosphere and Lower Thermosphere Region over Korean Peninsula Observed from the Korea Astronomy and Space Science Institute Meteor Radar, J. Astron. Space Sci., 38, 229–236. https://doi.org/10.5140/JASS.2021.38.4.229, 2021.
Kim, S.-Y. and Chun, H. Y.: Stratospheric Gravity Waves Generated by Typhoon Saomai (2006): Numerical Modeling in a Moving Frame Following the Typhoon, J. Atmos. Sci., 67, 3617–3636, 2010.
Kim, Y. H., Lee, C. S., Chung, J. K., Kim, J. H., and Chun, H. Y.: Seasonal variations of mesospheric gravity waves observed with an airglow all-sky camera at Mt. Bohyun, Korea (36∘ N). J. Astron. Space Sci., 27, 181–188, 2010.
Lindzen, R. S.: Turbulence and stress owing to gravity wave and tidal breakdown, J. Geophys. Res.-Oceans., 86, 9707–9714, https://doi.org/10.1029/JC086iC10p09707, 1981.
Mlynczak, M. G., Daniels, T., Hunt, L. A., Yue, J., Marshall, B. T., Russell, J. M., Remsberg, E. E., Tansock, J., Esplin, R., Jensen, M., Shumway, A., Gordley, L., and Yee, J. H.: Radiometric Stability of the SABER Instrument, Earth Space Sci., 7, 1–8, https://doi.org/10.1029/2019EA001011, 2020.
Nakamura, T., Higashikawa, A., Tsuda, T., and Matsushita, Y.: Seasonal variations of gravity wave structures in OH airglow with a CCD imager at Shigaraki, Earth Planets Space, 51, 897–906, 1999.
Nappo, C. J.: An Introduction to Atmospheric Gravity Waves, Academic Press, San Diego, 2002.
Nielsen, K., Taylor, M. J., Hibbins, R. E., Jarvis, M. J., and Russell III, J. M.: On the nature of short-period mesospheric gravity wave propagation over Halley, Antarctica, J. Geophys. Res., 117, D05124, https://doi.org/10.1029/2011JD016261, 2012.
Pautet, P., Taylor, M. J., Liu, A. Z., and Swenson, G. R.: Climatology of shot-period gravity waves observed over Northern Australia during the Darwin Area Wave Experiment (DAWEX) and their dominant source regions, J. Geophys. Res., 110, D03S90, https://doi.org/10.1029/2004JD004954, 2005.
Rienecker, M. M., Suarez, M. J., Gelaro, R., Todling, R., Bacmeister, J., Liu, E., Bosilovich, M. G., Schubert, S. D., Takacs, L., Kim, G., Bloom, S., Chen, J., Collins, D., Conaty, A., da Silva, A., Gu, W., Joiner, J., Koster, R. D., Lucchesi, R., Molod, A., Owens, T., Pawson, S., Pegion, P., Redder, C. R., Reichle, R., Robertson, F. R., Ruddick, A. G., Sienkiewicz, M., and Woollen, J.: MERRA: NASA’s Modern-Era Retrospective Analysis for Research and Applications, J. Climate, 24, 3624–3648, https://doi.org/10.1175/JCLI-D-11-00015.1, 2011 (data available at: https://goldsmr5.gesdisc.eosdis.nasa.gov/data/MERRA2/M2T3NVASM.5.12.4/, last access: 20 November 2020).
Russell III, J. M., Mlynczak, M. G., Gordley, L. L., Tansock Jr., J. J., and Esplin, R. W.: Overview of the SABER experiment and preliminary calibration results, Proc. SPIE, 3756, 277–288, https://doi.org/10.1117/12.366382, 1999 (data available at: ftp://saber.gats-inc.com, last access: 20 July 2021).
Simkhada, D. B., Snively, J. B., Taylor, M. J., and Franke, S. J.: Analysis and modeling of ducted and evanescent gravity waves observed in the Hawaiian airglow, Ann. Geophys., 27, 3213–3224, https://doi.org/10.5194/angeo-27-3213-2009, 2009.
Suzuki, S., Shiokawa, K., Otsuka, Y., Kawamura, S., and Murayama, Y.: Evidence of gravity wave ducting in the mesopause region from airglow network observations, Geophys. Res. Lett., 40, 601–605, https://doi.org/10.1029/2012GL054605, 2013.
Swenson, G. R., Alexander, M. J., and Haque, R.: Dispersion imposed limits on atmospheric gravity waves in the mesosphere: Observations form OH airglow, Geophys. Res. Lett., 27, 875–878, 2000.
Takeo, D., Shiokawa, K., Fujinami, H., Otsuka, Y., Matsuda, T. S., Ejiri, M. K., and Yamamoto, M.: Sixteen year variation of horizontal phase velocity and propagation direction of mesospheric and thermospheric waves in airglow images at Shigaraki, Japan, J. Geophys. Res.-Space, 122, 8770–8780, 2017.
Tang, J., Kamalabadi, F., Franke, S. J., Liu, A. Z., and Swenson, G. R.: Estimation of gravity wave momentum flux with spectroscopic imaging, IEEE T. Geosci. Remote, 43, 103–109, 2005.
Taylor, M. J., Ryan, E. H., Tuan, T. F., and Edwards, R.: Evidence of preferential directions for gravity wave propagation due to wind filtering in the middle atmosphere. J. Geophys. Res.-Atmos., 98, 6047–6057, https://doi.org/10.1029/92JA02604, 1993.
Taylor, M. J., Pendleton Jr., W. R., Clark, S., Takahashi, H., Gobbi, D., and Goldberg, R. S.: Image measurements of short-period gravity waves at equatorial latitudes, J. Geophys. Res., 102, 26283–26299, 1997.
Vargas, F., Swenson, G., Liu, A., and Gobbi, D.: O(1S), OH, and O2(b) airglow layer perturbations due to AGWs and their implied effects on the atmosphere, J. Geophys. Res., 112, D14102, https://doi.org/10.1029/2006JD007642, 2007.
Walterscheid, R. L. and Hickey, M. P.: Gravity Wave Ducting in the Upper Mesosphere and Lower Thermosphere Duct System, J. Geophys. Res.-Atmos., 114, D19109, https://doi.org/10.1029/2008JD011269, 2009.
Walterscheid, R., Hecht, J., Vincent, R., Reid, I., Woithe, J., and Hickey, M.: Analysis and interpretation of airglow and radar observations of quasi-monochromatic gravity waves in the upper mesosphere and lower thermosphere over Adelaide, Australia (35∘ S, 138∘ E), J. Atmos. Sol.-Terr. Phy., 61, 461–478, https://doi.org/10.1016/S1364-6826(99)00002-4, 1999.
Yang, T. Y., Kwak, Y.-S., and Kim, Y. H.: Statistical comparison of gravity wave characteristics obtained from airglow all-sky observation at Mt. Bohyun, Korea and Shigaraki, Japan, J. Astron. Space Sci., 32, 327–333, 2015.
- Abstract
- Introduction
- Observational and model data
- Data processing for acquiring wave parameters
- Characteristics of observed waves at Mt. Bohyun
- Characteristics of intrinsic gravity wave parameters
- Characteristics of vertical propagation
- Summary and conclusions
- Data availability
- Author contributions
- Competing interests
- Disclaimer
- Acknowledgements
- Financial support
- Review statement
- References