the Creative Commons Attribution 4.0 License.
the Creative Commons Attribution 4.0 License.
 | 20 Jul 2021
Influence of different types of ionospheric disturbances on GPS signals at polar latitudes
Vladimir B. Belakhovsky
Wojciech J. Miloch
The comparative research of the influence of different types of auroral particle precipitation and polar cap patches (PCPs) on the global positioning system (GPS) signals disturbances in the polar ionosphere was done. For this purpose, we use the GPS scintillation receivers at Ny-Ålesund and Skibotn, operated by the University of Oslo. The presence of the auroral particle precipitation and polar cap patches was determined by using data from the EISCAT 42m radar on Svalbard. The optical aurora observations in 557.7 and 630.0 nm spectrum lines on Svalbard were used as well for the detection of ionospheric disturbances. The cusp identification was done with using SuperDARN (Hankasalmi) data.
We consider events when the simultaneous EISCAT 42m and GPS data were available for the years 2010–2017, and in this paper we present, in detail, typical examples describing the overall picture, and we present the statistics for 120 events. We considered the dayside/cusp precipitation, substorm precipitation, daytime and nighttime PCPs, and precipitation associated with the interplanetary shock wave arrival. We demonstrate that substorm-associated precipitation (even without PCPs) can lead to a strong GPS phase (σϕ) scintillations up to ∼ 1.5–3 radians, which is much stronger than those usually produced by other types of considered ionosphere disturbances. The value of the substorm-phase scintillations in general correlate with the value of the geomagnetic field disturbance. But sometimes even a small geomagnetic substorm, when combined with the PCPs, produces quite strong phase scintillations. Cusp phase scintillations are lower than dayside PCPs scintillations. PCPs can lead to stronger ROT (rate of total electron content) variations than other types of ionosphere disturbances. So our observations suggest that the substorms and PCPs, being different types of the high-latitude disturbances, lead to the development of different types and scales of ionospheric irregularities.
- Article
(13718 KB) - Full-text XML
- BibTeX
- EndNote


The global navigation satellite systems (GNSS) have a great influence on human society today. The ionosphere, as a medium for radio wave propagation, can produce a negative impact on the quality of the received signal. The global positioning system (GPS) uses two frequencies, i.e. f1 = 1575.42 MHz and f2 = 1227.60 MHz. There are a lot of dual-frequency GPS receivers all over the world which are used for ionosphere studies. Irregularities in the plasma density can lead to rapid fluctuations in the amplitude and phase of the signal, which are known as ionosphere scintillations (Basu et al., 2002). Strong scintillations reduce the quality of the signal and even lead to the signal loss. Thus, the investigation of GPS scintillations is an important aspect of space weather. The level of scintillations is characterized by the phase (σϕ) and amplitude (S4) of scintillation indices. Amplitude scintillations are caused by the plasma irregularities with scale sizes ranging from tens to hundreds of metres, while the phase scintillations are caused by the irregularities with the sizes from hundreds of metres to several kilometres. Ionospheric scintillations are most severe in the equatorial region and at high latitudes (Basu et al., 2002; Kintner et al., 2007).
The phase scintillations index is determined mainly by the diffractive (stochastic) GPS signal variations. In order to calculate scintillation indices, a long-term trend caused by the satellite motion in relation to the receiver and ionosphere changes needs to be removed. A standard cut-off frequency (0.1 Hz) is commonly used for signal detrending (Fremouw et al., 1978). This cut-off frequency is adequate for the equatorial and midlatitude ionosphere. But the high-latitude ionosphere is characterized by the high and variable ionospheric drift velocity (∼ 100–1500 m s−1), which adds refractive variations to the phase scintillation index. The value of the cut-off frequency affects the phase scintillation index. So it often leads to strong phase scintillations without amplitude scintillation. To solve this problem, some researchers introduce new scintillations indexes. Mushini et al. (2012) introduced the improved phase–scintillation index (σchain), and Forte (2005) introduced the Sφ index. The fast iterative filtering signal decomposition technique was used to find the optimal cut-off frequency (Ghobadi et al., 2020; Spogli et al., 2021). De Franceschi et al. (2019) have demonstrated the difficulty in finding the optimum cut-off frequency for statistical studies, and they proposed looking for actual scintillations by investigating the simultaneous occurrence of S4 and σφ increase.
The high-latitude ionosphere is a very dynamic and unpredictable structure forming plasma irregularities on a wide variety of scale sizes (from 1000 km to decametre scale). Case studies have indicated a relationship between auroral appearance and GPS scintillations (Smith et al., 2008; Prikryl et al., 2010; Kinrade et al., 2013). Mostly discrete aurora cause strong scintillations and cycle slips (i.e. a jump in differential phase total electron content – TEC). Phase scintillations are more prominent than amplitude scintillation in the polar ionosphere (Prikryl et al., 2010). Ionospheric phase disturbances over the auroral region are frequent phenomena which often occur during nighttime (Prikryl et al., 2011).
One of the most dynamic ionospheric disturbances at high latitudes is the substorm. A magnetosphere substorm is a transient process originated on the nightside of the Earth, when a significant amount of energy derived from the solar wind–magnetosphere interaction is stored in the magnetosphere tail and then released into the auroral ionosphere (Rostoker et al., 1980). The substorms are characterized by sporadic precipitation of energetic electrons from the magnetotail that lead to the appearance of the bright aurora. GPS signal phase scintillations correlate well with substorm-associated auroral disturbances.
It was found that polar moving auroral forms (PMAFs), which are discrete auroral forms produced by the transient magnetopause reconnection, have a big impact on GNSS phase scintillations (Oksavik et al., 2015). Authors found that the scintillation impact is strongest when the appearance of the PMAFs coincides with the appearance of the PCPs. Studies (Van der Meeren et al., 2016) showed that the Sun-aligned arc in the polar cap does not cause significant phase scintillations.
At polar latitudes, polar cap patches can produce severe ionosphere disturbances. Polar cap patches are 100–1000 km islands of enhanced F-region plasma density. The patches appear near the cusp and then propagate along the ionospheric convection streams into the nightside auroral oval modulated by the nightside tail reconnection; after that, patches returned to the dayside (Lockwood and Carlson, 1992; Zhang et al., 2013). During a strong and stable polar cap convection, segmentation may not happen, and a continuous tongue of ionization (TOI) may be formed across the polar cap (Foster et al., 2005). Phase scintillations in TOI were studied in the paper by Van der Meeren et al. (2014), who was observed bursts of phase scintillations and no amplitude scintillations in relation to the leading gradient of the TOI. Patches may develop smaller-scale irregularities down to decametre scale through the Kelvin–Helmholtz (KH) and gradient drift instabilities (Oksavik et al., 2012; Clausen et al., 2016). In the auroral oval, polar cap patches are termed auroral blobs (Lorentzen et al., 2010). Several types of auroral blobs were selected in previous investigations, i.e. boundary blobs, subauroral blobs, and auroral blobs (Crowley et al., 2000). These airglow emissions are detectable from ground optical instruments as structures propagating from high to low latitudes.
Statistical studies found one peak in the occurrence rate of GPS phase scintillation around magnetic noon and another peak around magnetic midnight (Jin er al., 2015). It is also found that the phase scintillation occurrence rate is higher in the dayside, while the strong phase scintillation occurs more frequently during night. Nonetheless, strong phase scintillation events can also be triggered at daytime in association with the PMAF.
Jin et al. (2014) found that polar cap patches have their biggest impact on GPS signals once they reach the nightside auroral oval, in particular when combined with upward field-aligned currents (Clausen et al. 2016). Jin et al. (2014) focused on phase scintillation measurements inside polar cap patches identified in airglow imager data and found that patches have a moderate scintillation impact (σϕ ∼ 0.2). They also found, however, that the strongest impact on scintillations occurred when these patches cross from the polar cap into the auroral oval to become auroral blobs (Jin et al., 2016). It was shown in the literature (Jin et al., 2014, 2016) that PCPs can produce GPS scintillations quite comparable with scintillations during the particle precipitation with the appearance of strong green aurora. But it was a case study; therefore, this question needs further studies.
The high-latitude disturbances have a great negative influence on radio waves propagation. So, it is important to know what type of the high-latitude ionosphere disturbances has strongest influence on GPS navigation systems. In the present work, we address the following question: what disturbances in the polar ionosphere (particle precipitation or polar cap patches) have a stronger impact on the scintillations of GPS signals?
The Ny-Ålesund (NYA) GPS scintillation receiver of the University of Oslo (UiO) was the main instrument used in our study. Upon the availability of data, the Skibotn (Norway; mainland) GPS receiver was also used. The UiO GNSS scintillation receiver is the standard GNSS ionospheric scintillation/TEC monitor (GISTM; model GSV4004B; Van Dierendonck et al., 1993). The carrier phase and power at the L1 frequency (1.57542 GHz) are tracked and recorded at 50 Hz rate. The phase (σϕ) and amplitude scintillation indices (S4) are also calculated and recorded automatically. The phase scintillation index is defined as being the standard deviation of the carrier phase that has been detrended by the high-pass sixth-order Butterworth filter with a cut-off frequency of 0.1 Hz. The amplitude scintillation index (S4) is defined as the standard deviation of the received signal power, based on the 50 Hz sampling rate and normalized to the average signal power over 1 min periods.
In our paper, we use the standard detrending (0.1 Hz) in order to be able to compare our results with previous results obtained with using this GPS receiver on Svalbard (Clausen et al., 2016; Jin et al., 2015, 2016, 2017, 2018). The choice of the fixed cut-off frequency can add refractive variations to the phase scintillation index. The term “phase scintillation index”, used in our study, means the phase fluctuations due to the presence of large-scale irregularities (above the Fresnel radius).
The GPS TEC data have been post-processed by using WinTEC-P (Carrano et al., 2009). The ROT (rate of TEC) data over 1 min are also used to depict the TEC variations (see, e.g., Alfonsi et al., 2011), where ROT = .
To describe the ionospheric plasma parameters (density, ion, and electron temperature and line of sight ion velocity as a function of range), we used the Svalbard EISCAT 42m radar and ultra-high frequency (UHF) radar in Tromsø. The beam of the EISCAT 42m radar is directed along the geomagnetic field (azimuth = 184∘; elevation = 82∘). The UHF radar beam was fixed at an azimuthal angle of 185∘ and an elevation angle of 77∘ (i.e., in the field-aligned direction in the F region).
For some convenient cases, the optical aurora observations performed by the all-sky imager (ASI) of the UiO and Polar Geophysical Institute (Russia) on Svalbard were used. The ASI in Longyearbyen (named LYR5) is located at Kjell Henriksen Observatory (KHO; 78.2∘ N, 16.0∘ E; 75.4∘ MLAT). The LYR5 ASI uses an ICCD (intensified charge-coupled device). The imagers record emission intensity across the sky with a 180∘ field of view fisheye lens at 630.0 nm every 30 s and 557.7 nm every 15 s, respectively. The intensity of the ASI is calibrated into the standard kilo Rayleigh (kR) intensity scale.
The stations mentioned in this study have, respectively, the following geographic and corrected geomagnetic (CGM) coordinates:
-
Ny Ålesund (NYA) – (78.92∘ N, 11.95∘ E), (75.25∘ N, 112.08∘ E)
-
Longyearbyen (LYR) – (78.20∘ N, 15.82∘ E), (75.12∘ N, 113.00∘ E)
-
Hornsund (HOR) – (77.00∘ N, 15.60∘ E), (74.13∘ N, 109.59∘ E)
-
Tromsø (TRO) – (69.66∘ N, 18.94∘ E), (66.64∘ N, 102.90∘ E)
-
Skibotn (SKN) – (69.43∘ N, 20.38∘ E), (66.28∘ N, 103.41∘ E).
IMAGE magnetometers were used for the geomagnetic field observations. The OMNIWeb database was used for the evaluating the solar wind and interplanetary magnetic field parameters. We use the 1 min resolution symmetric component of ring current (SYM-H) and auroral electrojet (AE) indices to show the geomagnetic storm and substorm activity. The SYM-H and AE indices were obtained from the World Data Center for Geomagnetism at Kyoto University (http://wdc.kugi.kyoto-u.ac.jp/, last access: 16 July 2021).
In the present study, we consider the influence of different geophysical phenomena on the GPS scintillations, i.e. dayside/cusp precipitation, nighttime substorm precipitation, daytime and nighttime polar cap patches, and precipitation associated with the interplanetary shock arrival. We focused mainly on the phase scintillation index because the amplitude scintillation index (S4) has practically no significant variations at high latitudes. The presence of the particle precipitation in the ionosphere, associated with the appearance of the green line aurora, was determined as the density increase between 100–200 km altitudes according to the EISCAT radar data. The presence of the polar cap patches was determined as a strong density increase above 200 km altitude. We mainly consider the winter time because the EISCAT radar works most often in the winter season. We present 120 different cases for the years 2010–2017, when the data from the EISCAT 42m radar were available, and in this paper, we analyse typical examples in detail. The presented conclusions are valid for the common picture. The preliminary analyses was done in a proceeding paper (Belakhovsky et al., 2020).
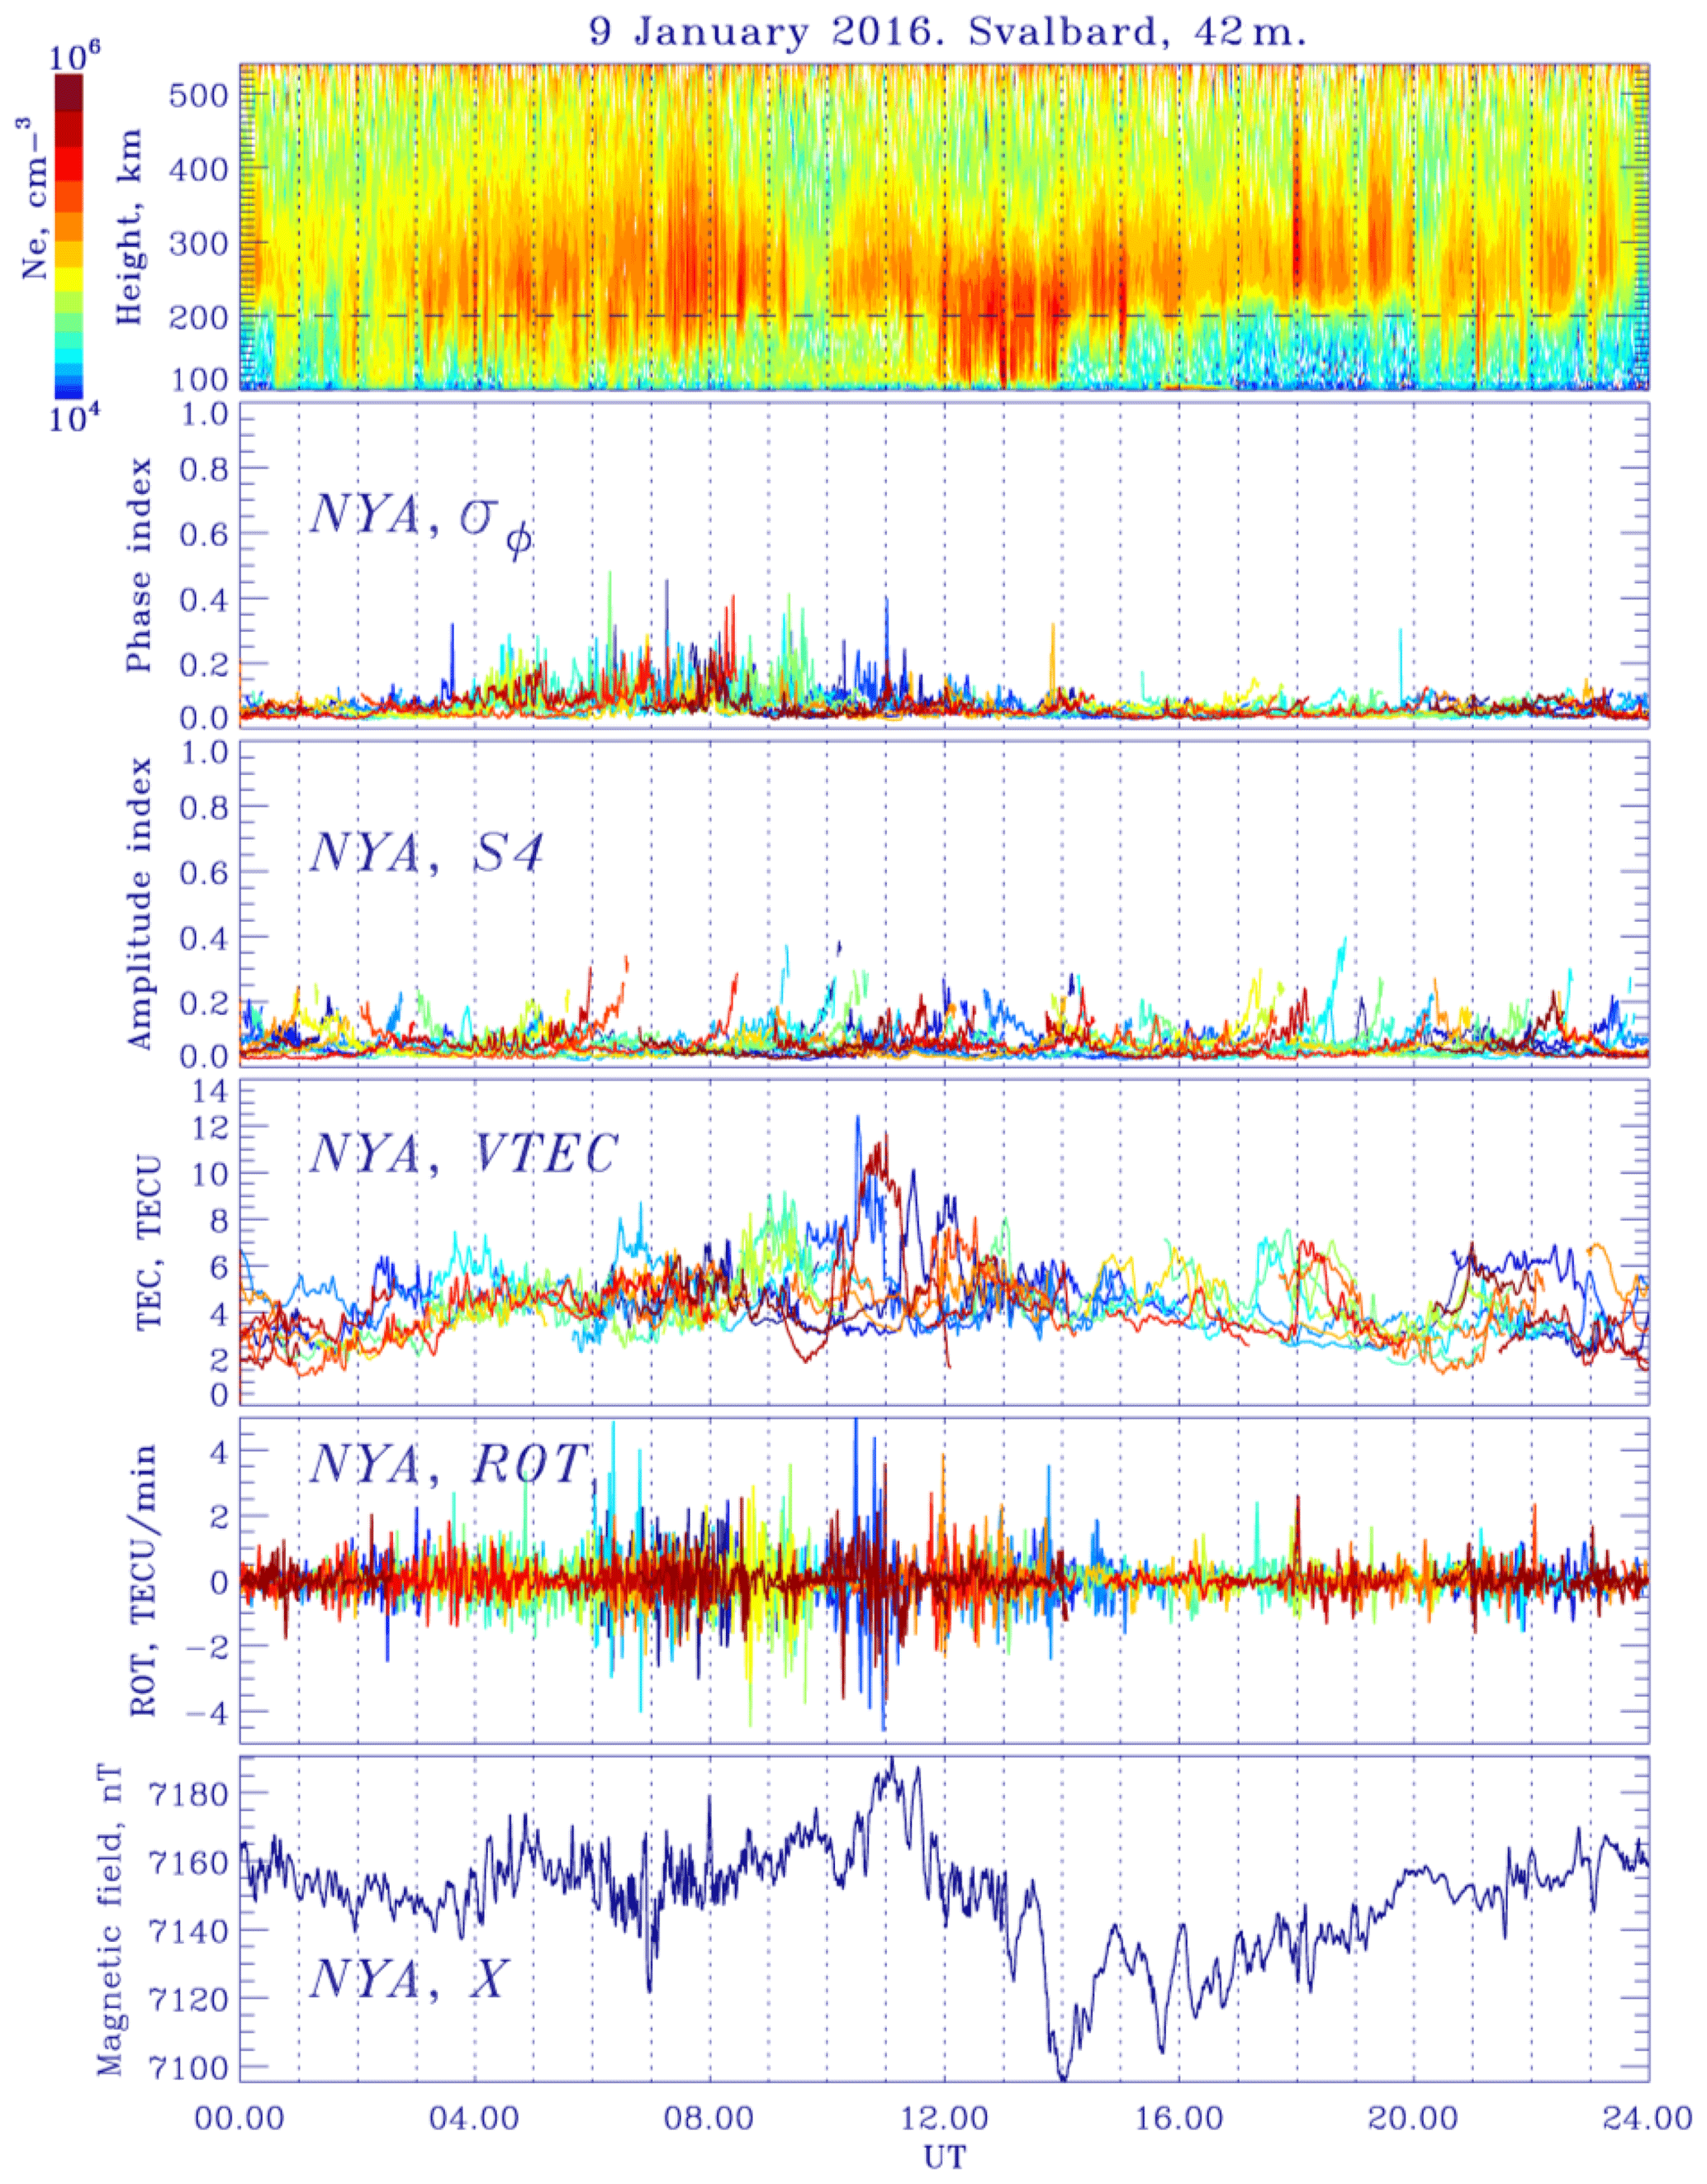
Figure 1Ionosphere plasma density according to the EISCAT 42m radar data, phase scintillation index and amplitude scintillation index according to the GPS receiver at NYA station, TEC and ROT variations according to the GPS receiver at NYA station, and geomagnetic field variations (X component) at NYA station for 9 January 2016.
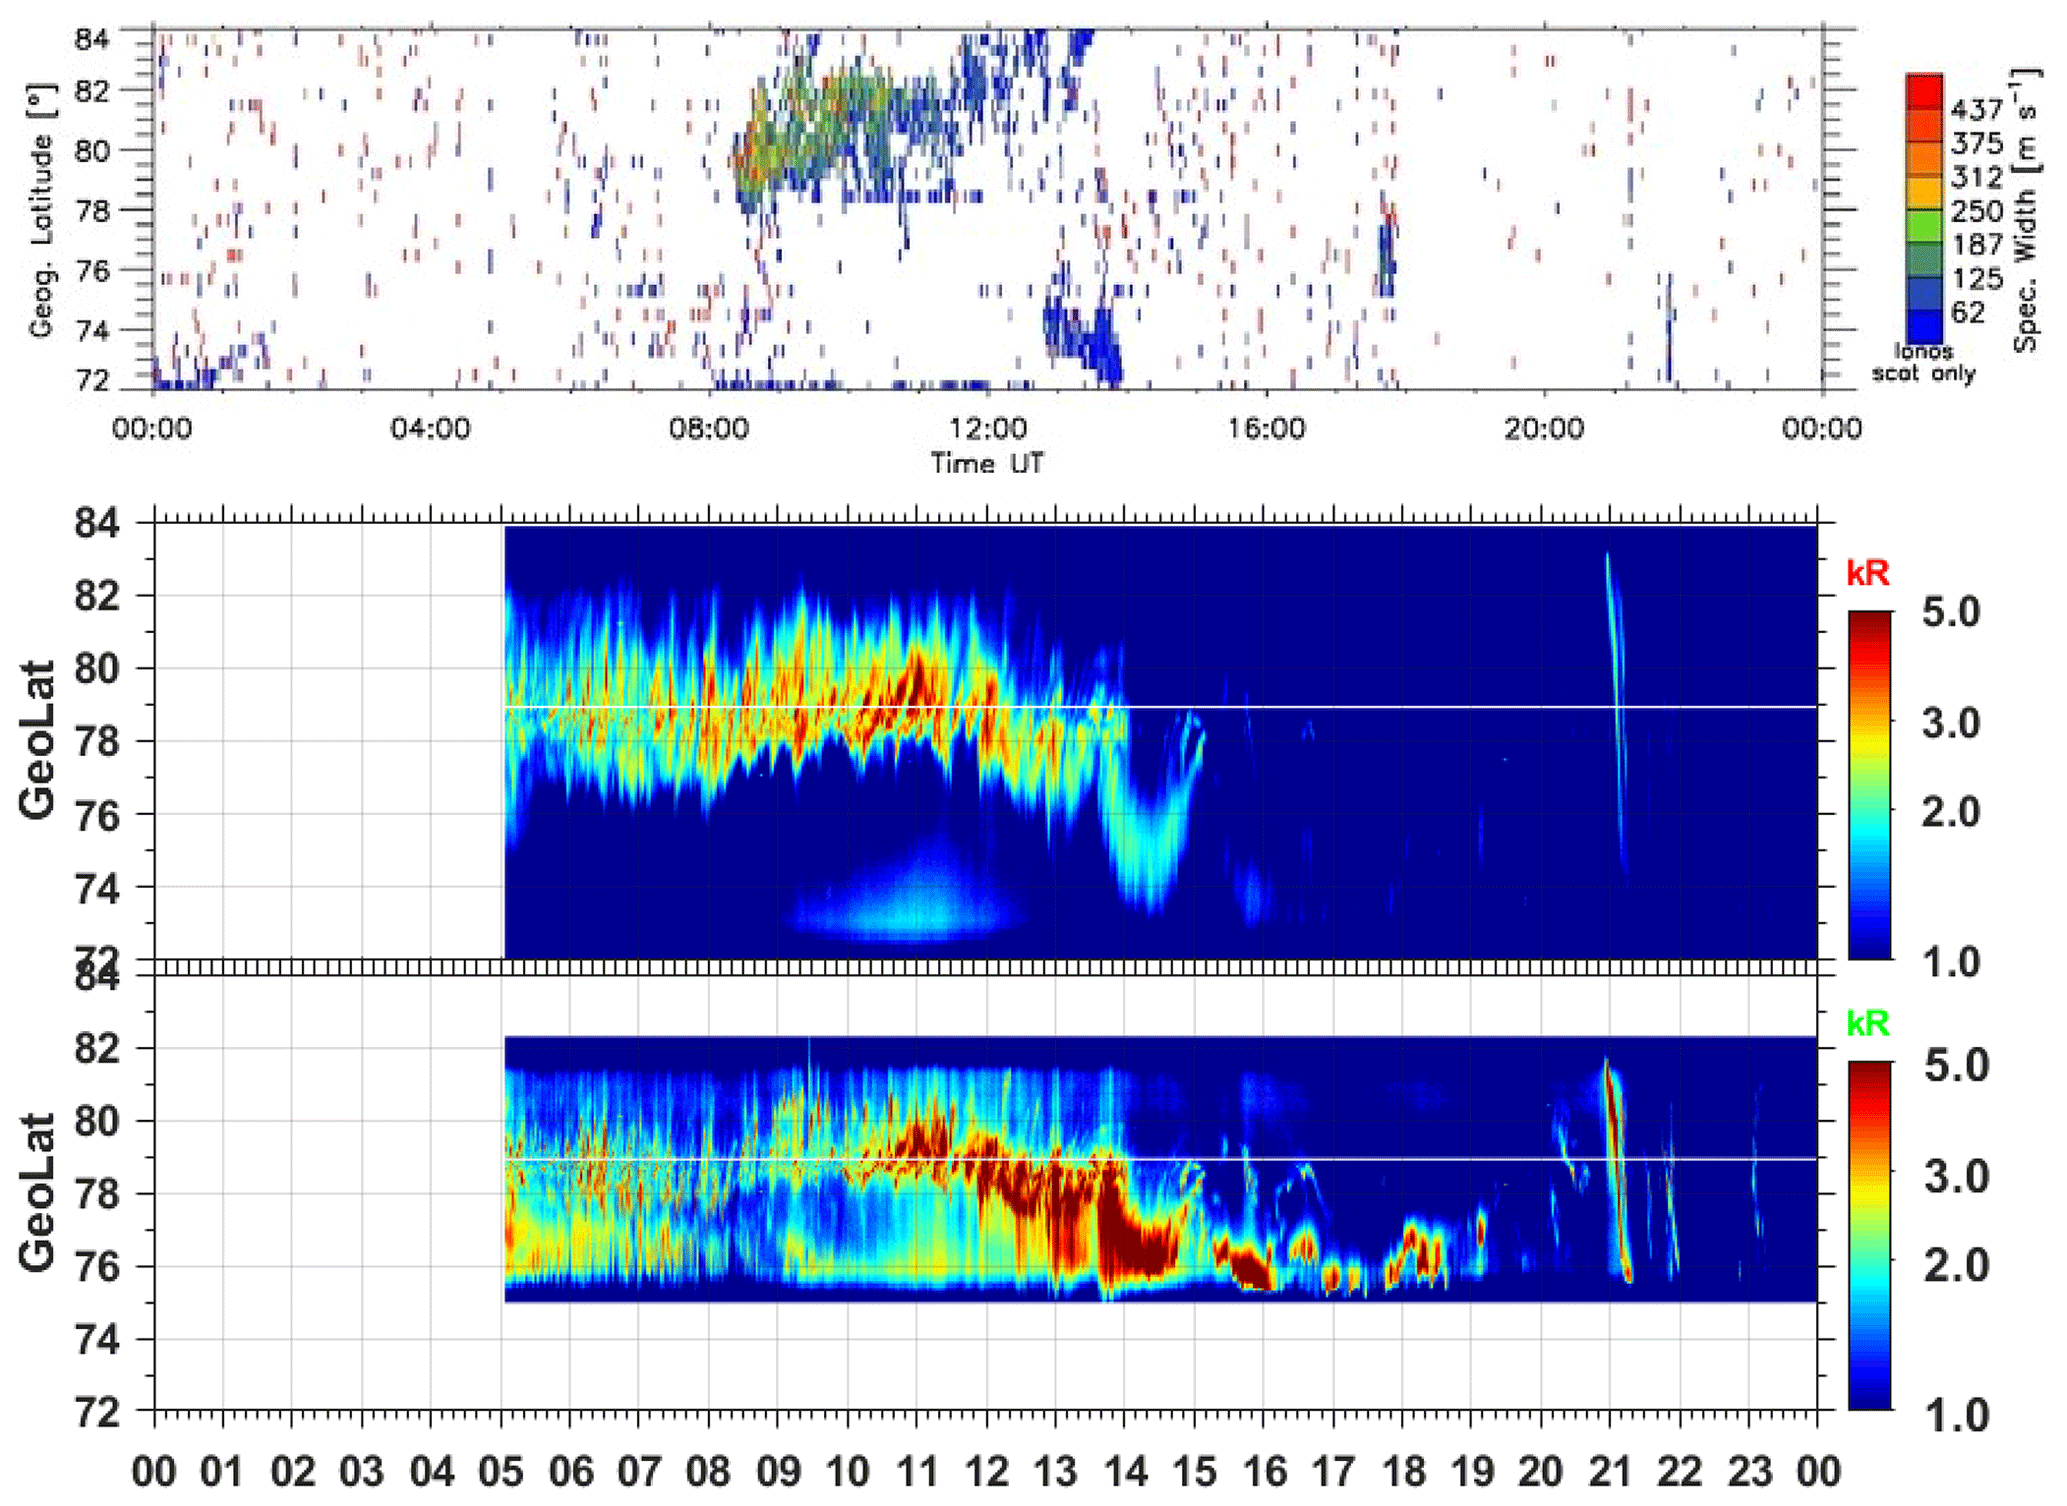
Figure 2Latitude–time plot of the spectral width, according SuperDARN Hankasalmi radar, and keograms (557.7 and 630.0 nm emission line) from the all-sky imager at NYA station for 9 January 2016.
3.1 Dayside/cusp precipitation
The example of the dayside precipitation on 9 January 2016 is shown in Fig. 1. It was geomagnetically quiet period (SYM-H = −10 nT), and the solar wind speed had moderate values (V = 460 km s−1). At the time intervals 04:00–08:00 and 12:00–14:00 UT (universal time), the ionosphere density increase at altitudes 100–200 km, associated with the charge particle precipitation according to the EISCAT 42m data (MLT = UT + 3), is seen. The increase in the aurora intensity in the 557.7 nm emission line measured by the NYA all-sky imager testifies to presence of the particle precipitation as well (Fig. 2).
During these geomagnetic conditions, the NYA station often was located near the cusp region. The cusp is a small area near noon, and it reaches about 3 MLT in longitude and some degrees in latitude. The cusp can be identified by the spectral width of reflected ionosphere signal. In the region of the cusp, an increase in the spectral width of the reflected signal is observed due to an increase in the turbulence. The cusp is observed with an increase in the spectral width of the reflected signal up to 200 m s−1 at near-noon hours. The method of the cusp identification, using SuperDARN data, was done, for example, in André et al. (2000) and Pilipenko et al. (2015). According to the SuperDARN radar (beam 9) observations in Hankasalmi (Fig. 2), the cusp near the Svalbard was registered approximately from 08:00 to 12:00 UT. The equatorial boundary of the cusp was located at 78∘ of geographic latitudes and higher. The growth in the aurora intensity in the 630.0 nm emission lines at 07:00–09:00 UT during the low intensity in 557.7 nm may also testify about the optical identification of the cusp.
The different colours in panels 2–5 (Fig. 1) are data from the different GPS satellites. The GPS phase scintillation index reaches the value about 0.4–0.5 rad. It is possible that the jumps in phase index variations during the time interval 08:00–11:00 UT may testify to the passing of the station near the cusp. There is no strong Ne increase below 200 km, testifying to the particle precipitation, according to the EISCAT 42m data at 08:00–11:30 UT. At the moment of the passing under the cusp region, the vertical total electron content (VTEC; up to 12 TECU) and ROT (up to 5 TECU min−1) increase was also observed (Fig. 1).
The growth in the phase index was seen not during all period of Ne enhancement (100–200 km) measured by the EISCAT radar. This is possibly due to the field of view of the EISCAT radar not coinciding with the field of view of NYA GPS receiver. So, for small-scale ionosphere disturbances (i.e. with the scale size lower than overlap between EISCAT and NYA GPS receiver fields of view), the Ne increase does not always correlate with phase index growth.
The ROT variations have small disturbances (2–4 TECU min−1) during the presence of the particle precipitation. The amplitude scintillation index has no distinct response to the morning and daytime precipitation.
Substorm disturbances were not observed during this day. Small amplitude Pc5 pulsations (10–20 nT) were seen in the X component of the geomagnetic field at NYA station during morning precipitation. These Pc5 pulsations can contribute to the charge particle precipitation in the ionosphere (Belakhovsky et al., 2016).
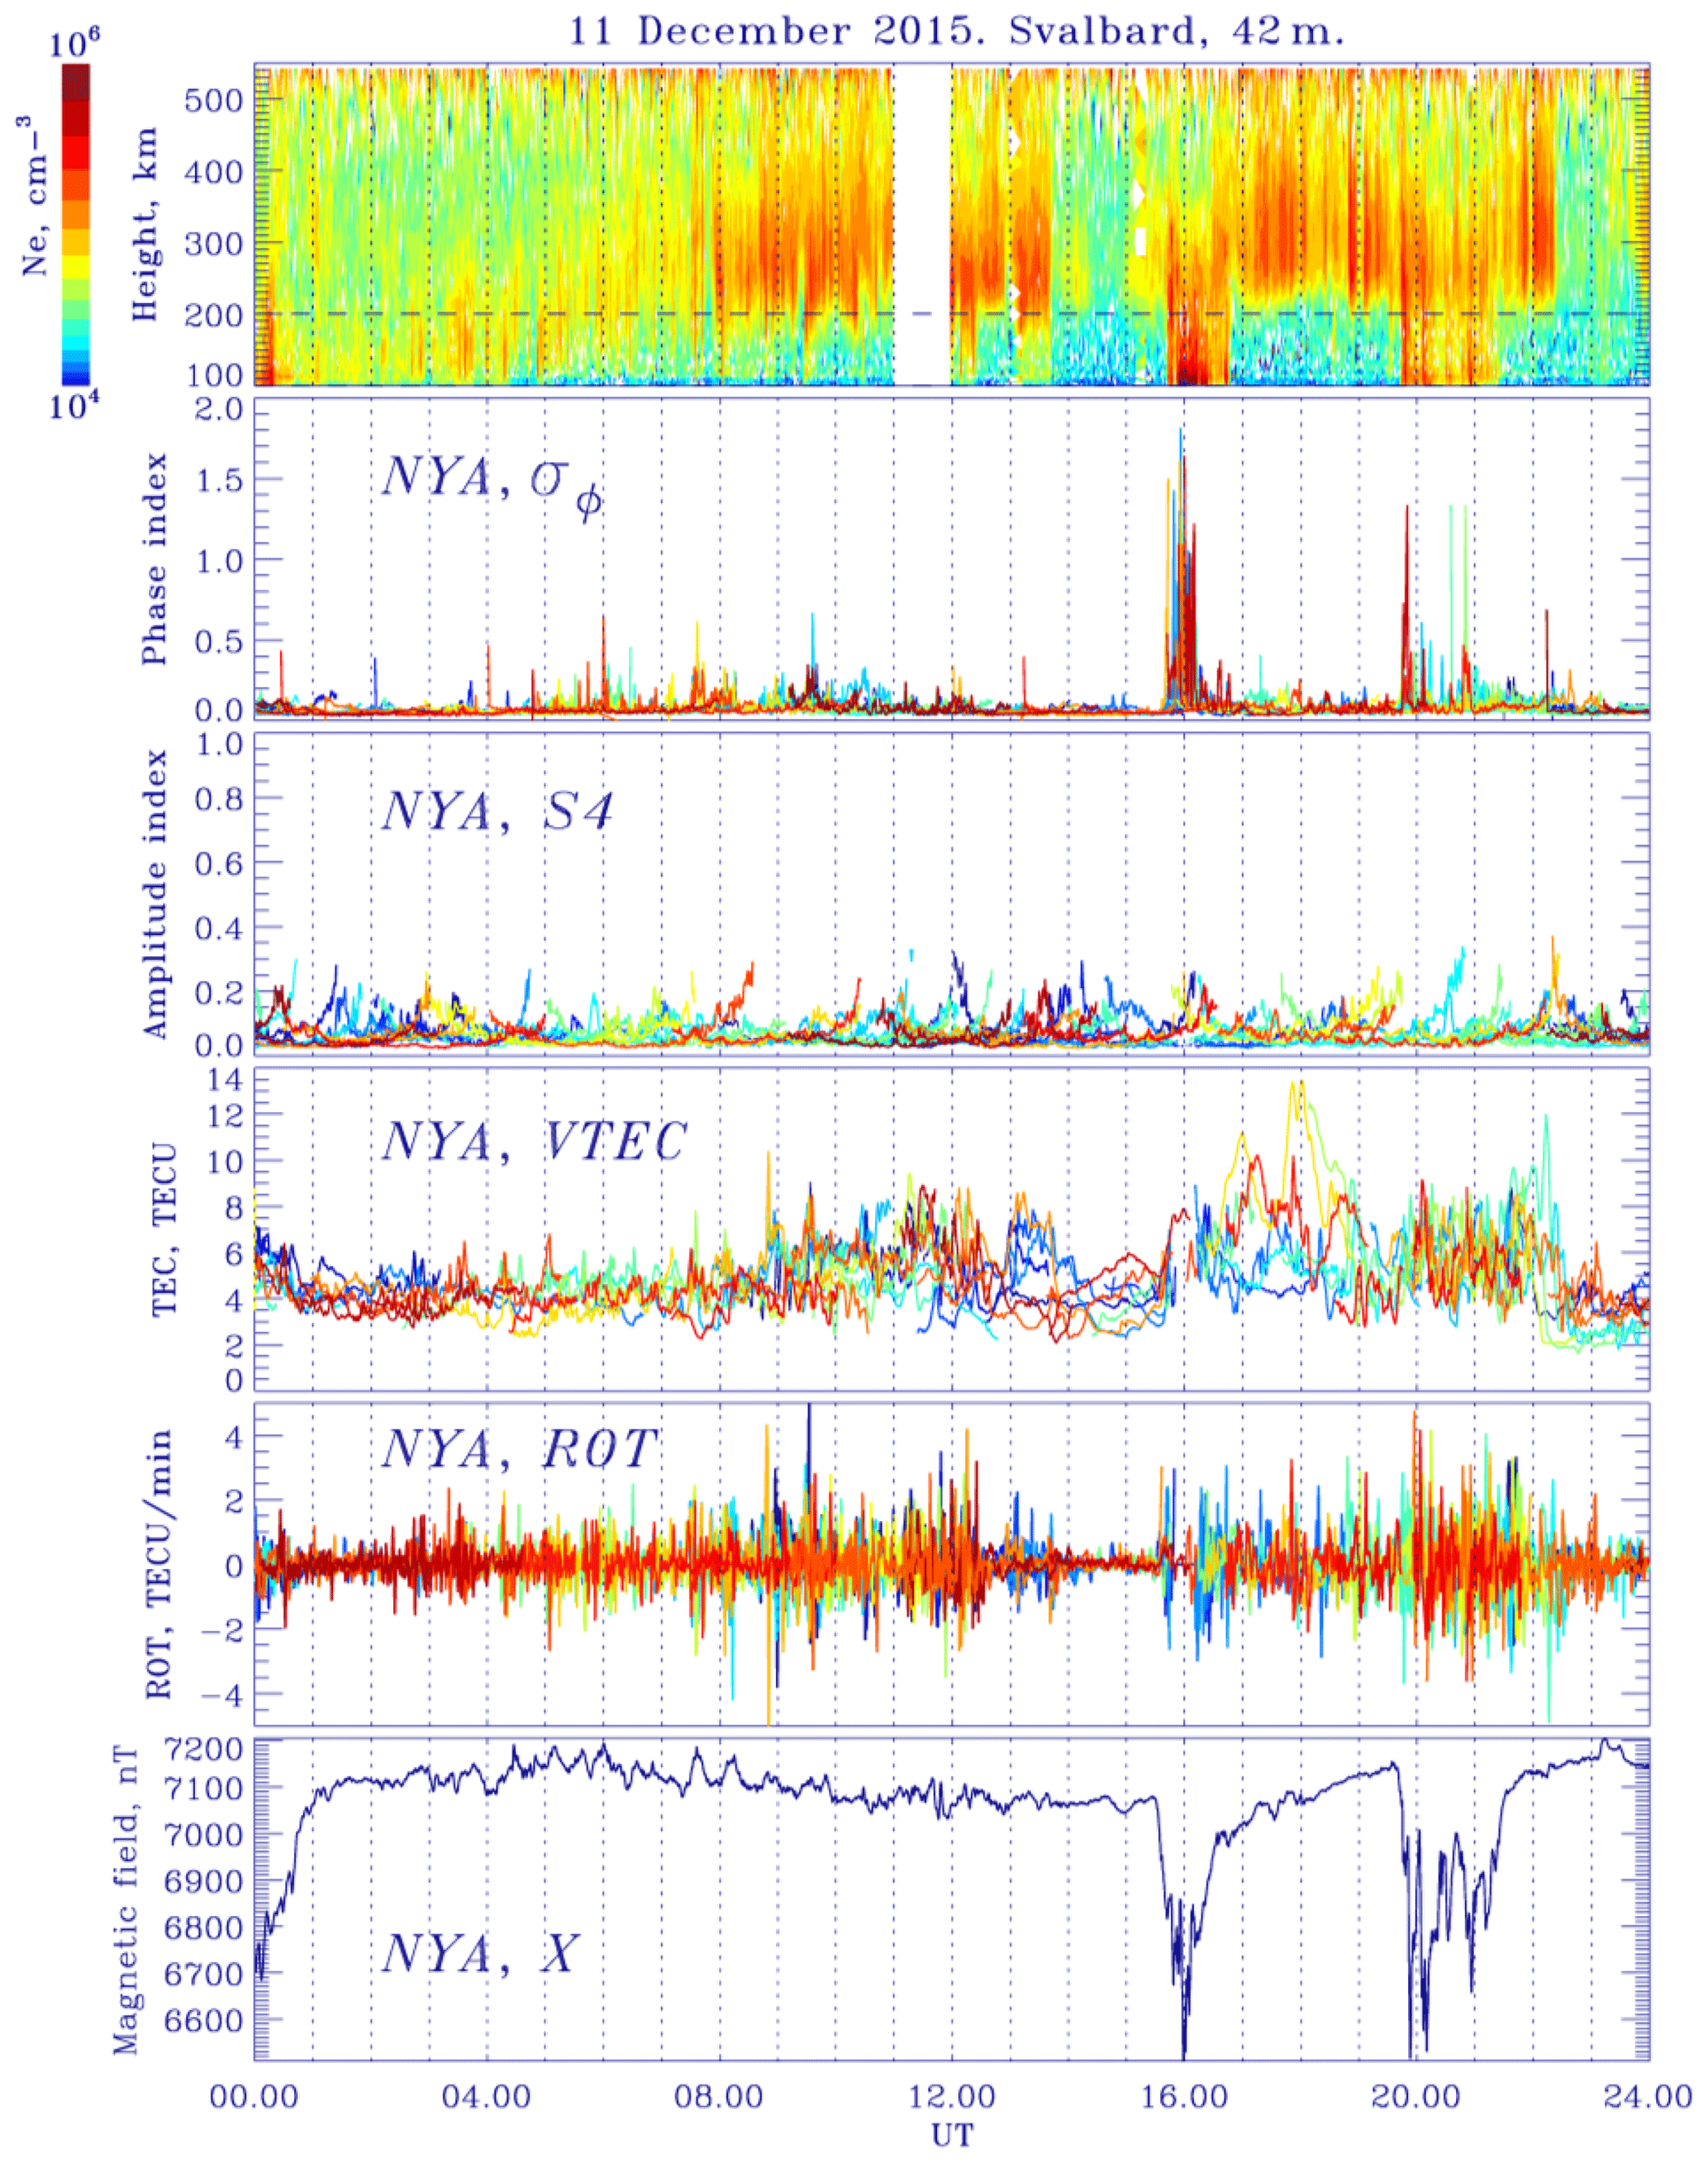
Figure 3Ionosphere plasma density according to the EISCAT 42m radar data, phase scintillation index and amplitude scintillation index according to the GPS receiver at NYA station, TEC and ROT variations according to the GPS receiver at NYA station, and geomagnetic field variations (X component) at NYA station for 11 December 2015.
3.2 Substorm precipitation
The example of the substorm precipitation and the GPS scintillations response to it is shown in Fig. 3 (11 December 2015). A total of two substorms were observed during this day. The first one was at 15:30–17:00 UT, and the second was at 20:00–22:00 UT. They were polar substorms because they were mainly observed at latitudes higher than 70∘. It can be noticed that the amplitude of the first substorm reaches the value about 1400 nT at Hornsund (HOR) station; at NYA station, the amplitude of the substorm was 600 nT. The second substorm has a lower amplitude than the first substorm (600 nT at HOR station). These substorms were observed without geomagnetic storm (SYM-H ≈ −10 nT); however, the solar wind speed was quite high (V = 640–680 km s−1), according to the OMNIWeb database (data not shown).
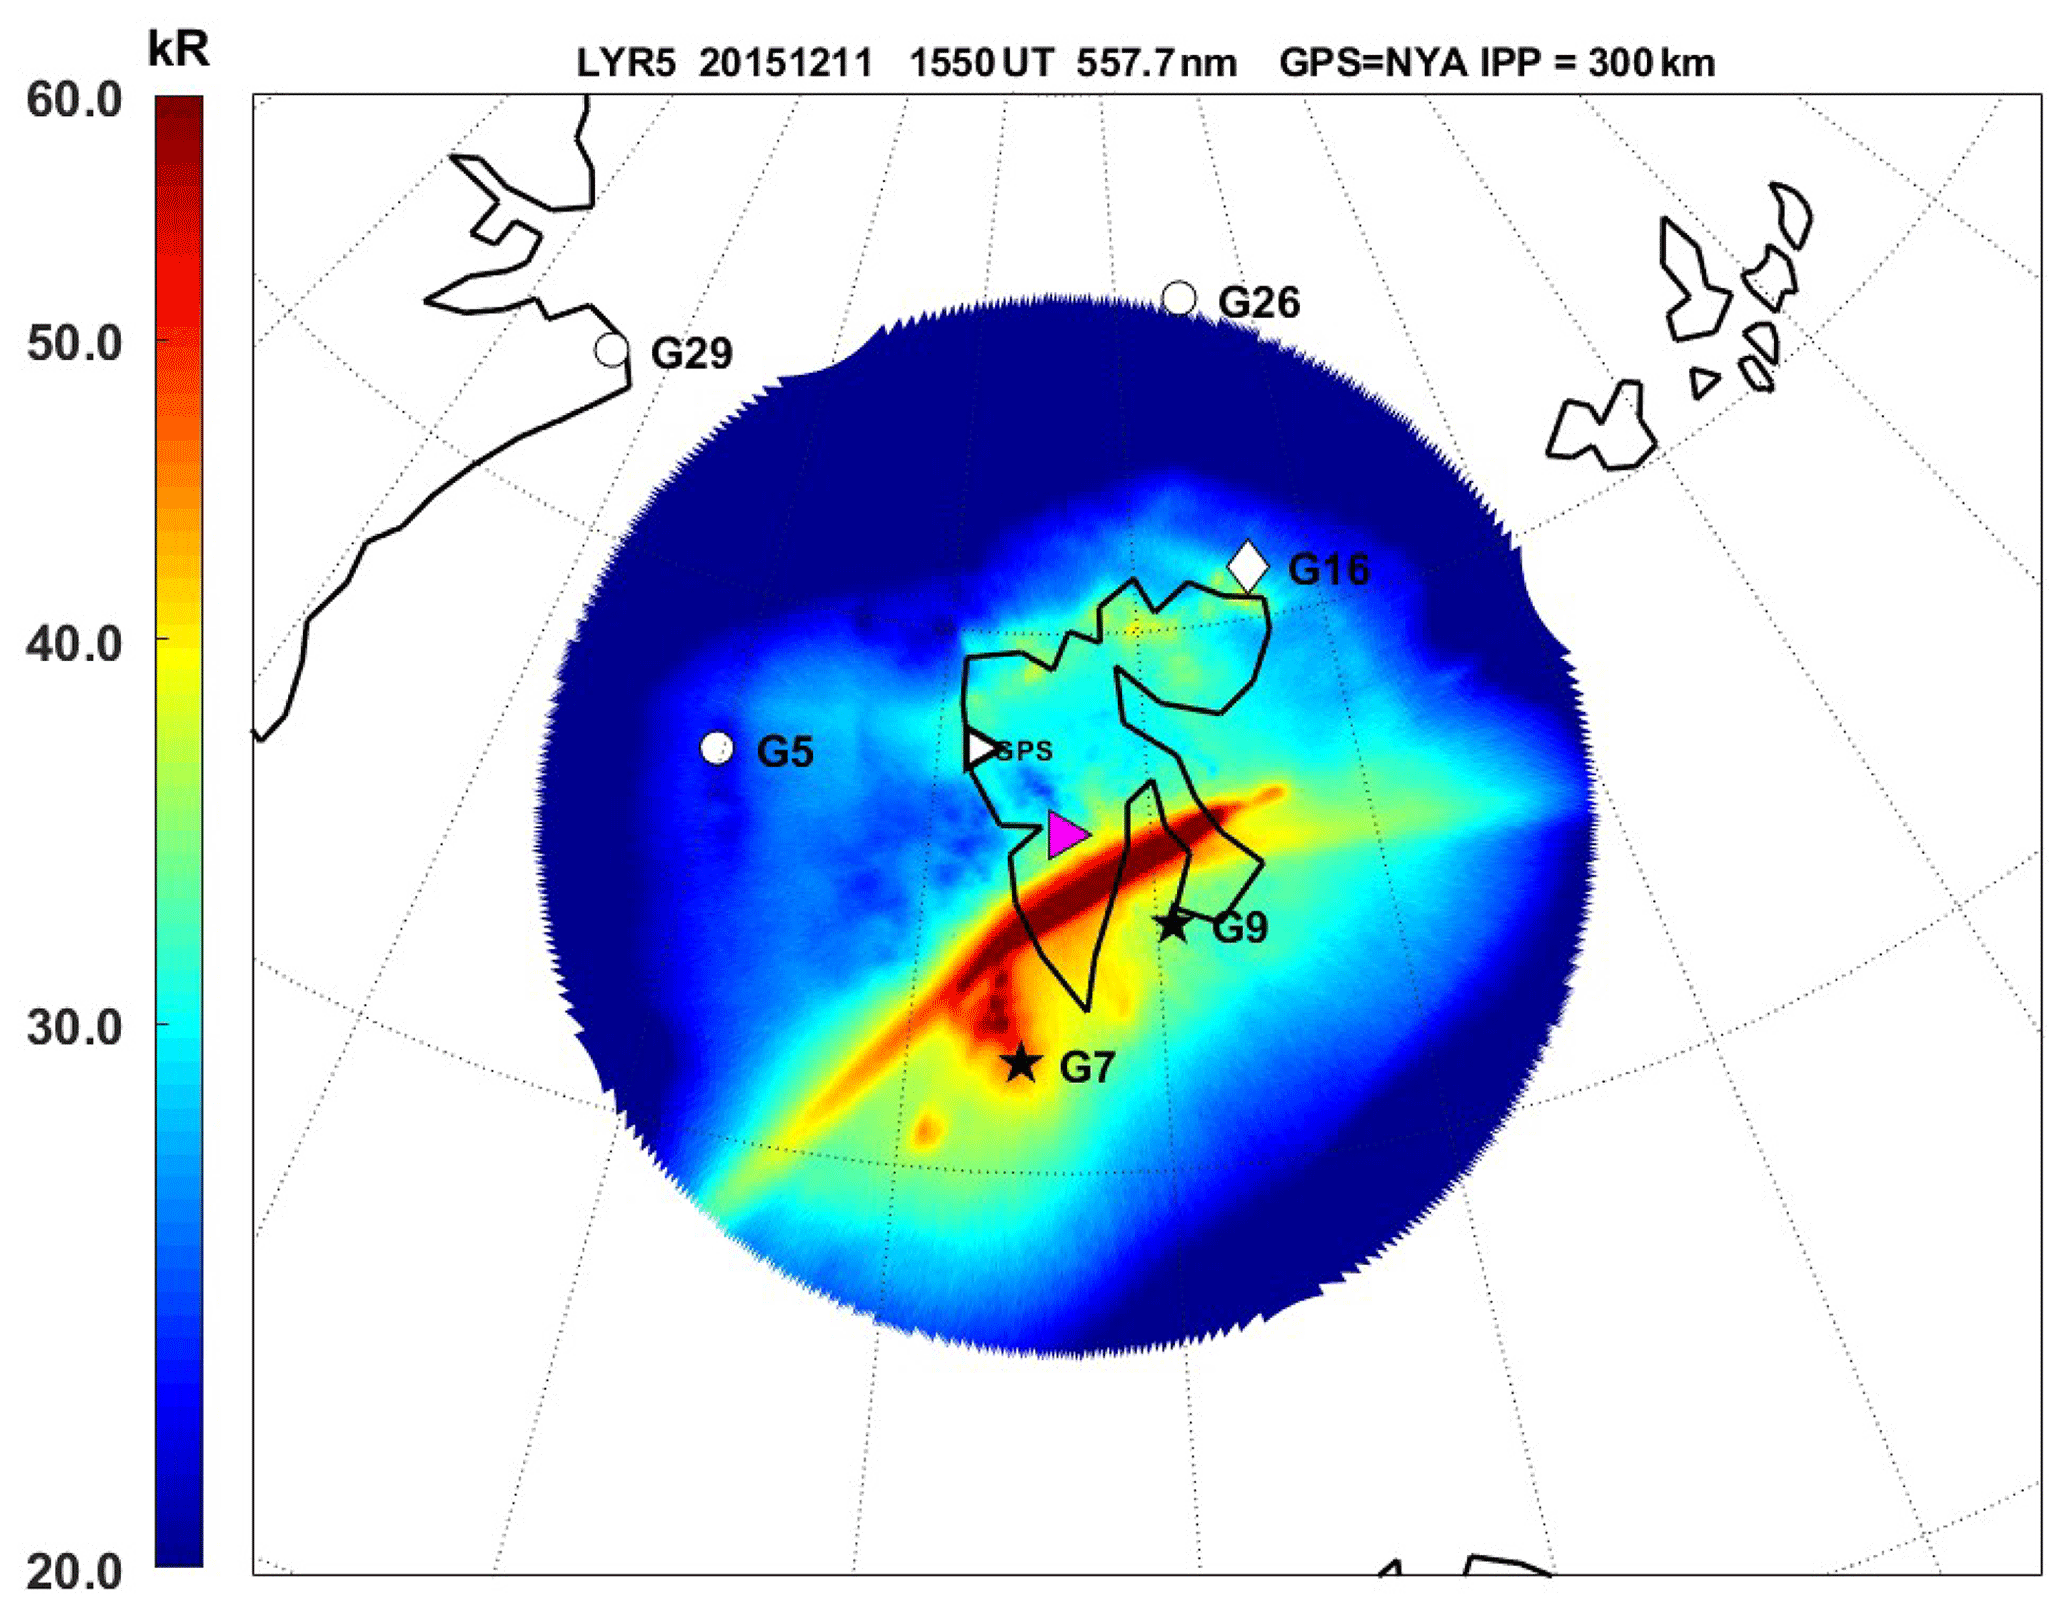
Figure 4The all-sky camera image (557.7 nm emission) at LYR station projected into the map for 15:50 UT on 11 December 2015. The rose triangle is an EISCAT 42m radar, the white triangle is a GPS receiver at NYA station, and the G7, G9, G5, G16, G29, and G26 are ionosphere pierce points of the corresponding GPS satellites.
The ionosphere plasma density ΔNe increases during substorm on two orders of magnitude, from 1 × 10⁴ to 1 × 106 cm−3, at an altitude of about 104 km. At an altitude of 125 km, ΔNe increases from 1 × 10⁴ to 5 × 105 cm−3. The substorms were accompanied by the strong increase in aurora intensity along different spectrum lines. The growth of the phase scintillation index was accompanied by the appearance of the bright aurora arc, according to LYR all-sky camera observations (Fig. 4), oriented approximately in an east–west direction. We have plotted the ionosphere pierce points (IPPs) of the GPS signals to show how they overlap with the EISCAT 42m and all-sky camera fields of view (Fig. 4). For large-scale disturbances (hundreds of kilometres) which were considered in this paper, this overlap does not matter. Some GPS satellites can always be used to register the large-scale ionosphere disturbance.
The phase index reaches the value of about 2 rad during the first substorm. The growth in the phase scintillation index was seen mainly during the substorm expansion phase (30–40 min). During the second substorm, the phase scintillation index has the lower value (0.5–1.5 rad). The growth in the phase scintillation index was seen as sharp increases during 5–10 min time intervals.
Substorms do not lead to significant TEC increase. It is seen in the absence of the TEC data during the substorm and testifies about the cycle slips of GPS signals at this moment.
The ultra-low frequency (ULF) waves in Pi3 frequency range embedded into the substorm structure contribute to the particle acceleration into the ionosphere and growth of the field-aligned currents (FACs), which leads to such strong values of the phase scintillation index.
3.3 Precipitation associated with the interplanetary shock arrival
We considered the example of the interplanetary shock influence on the scintillations of GPS signals. Here, the example of the event on 22 January 2012 is presented. It is well known that the interplanetary shock interaction with the Earth's magnetosphere leads to strong particle precipitation into the ionosphere and leads to the appearance of the so-called shock aurora (Zhou et al., 2003). The interplanetary shock interaction with the Earth's magnetosphere, which leads to the development of the geomagnetic storm, is known as SSC (storm sudden commencement); otherwise, when there is no geomagnetic storm, it is named SI (sudden impulse). In the paper by Belakhovsky et al. (2017), it is shown that shock wave arrival produces to the global TEC increase at high latitudes by up to 40 %.
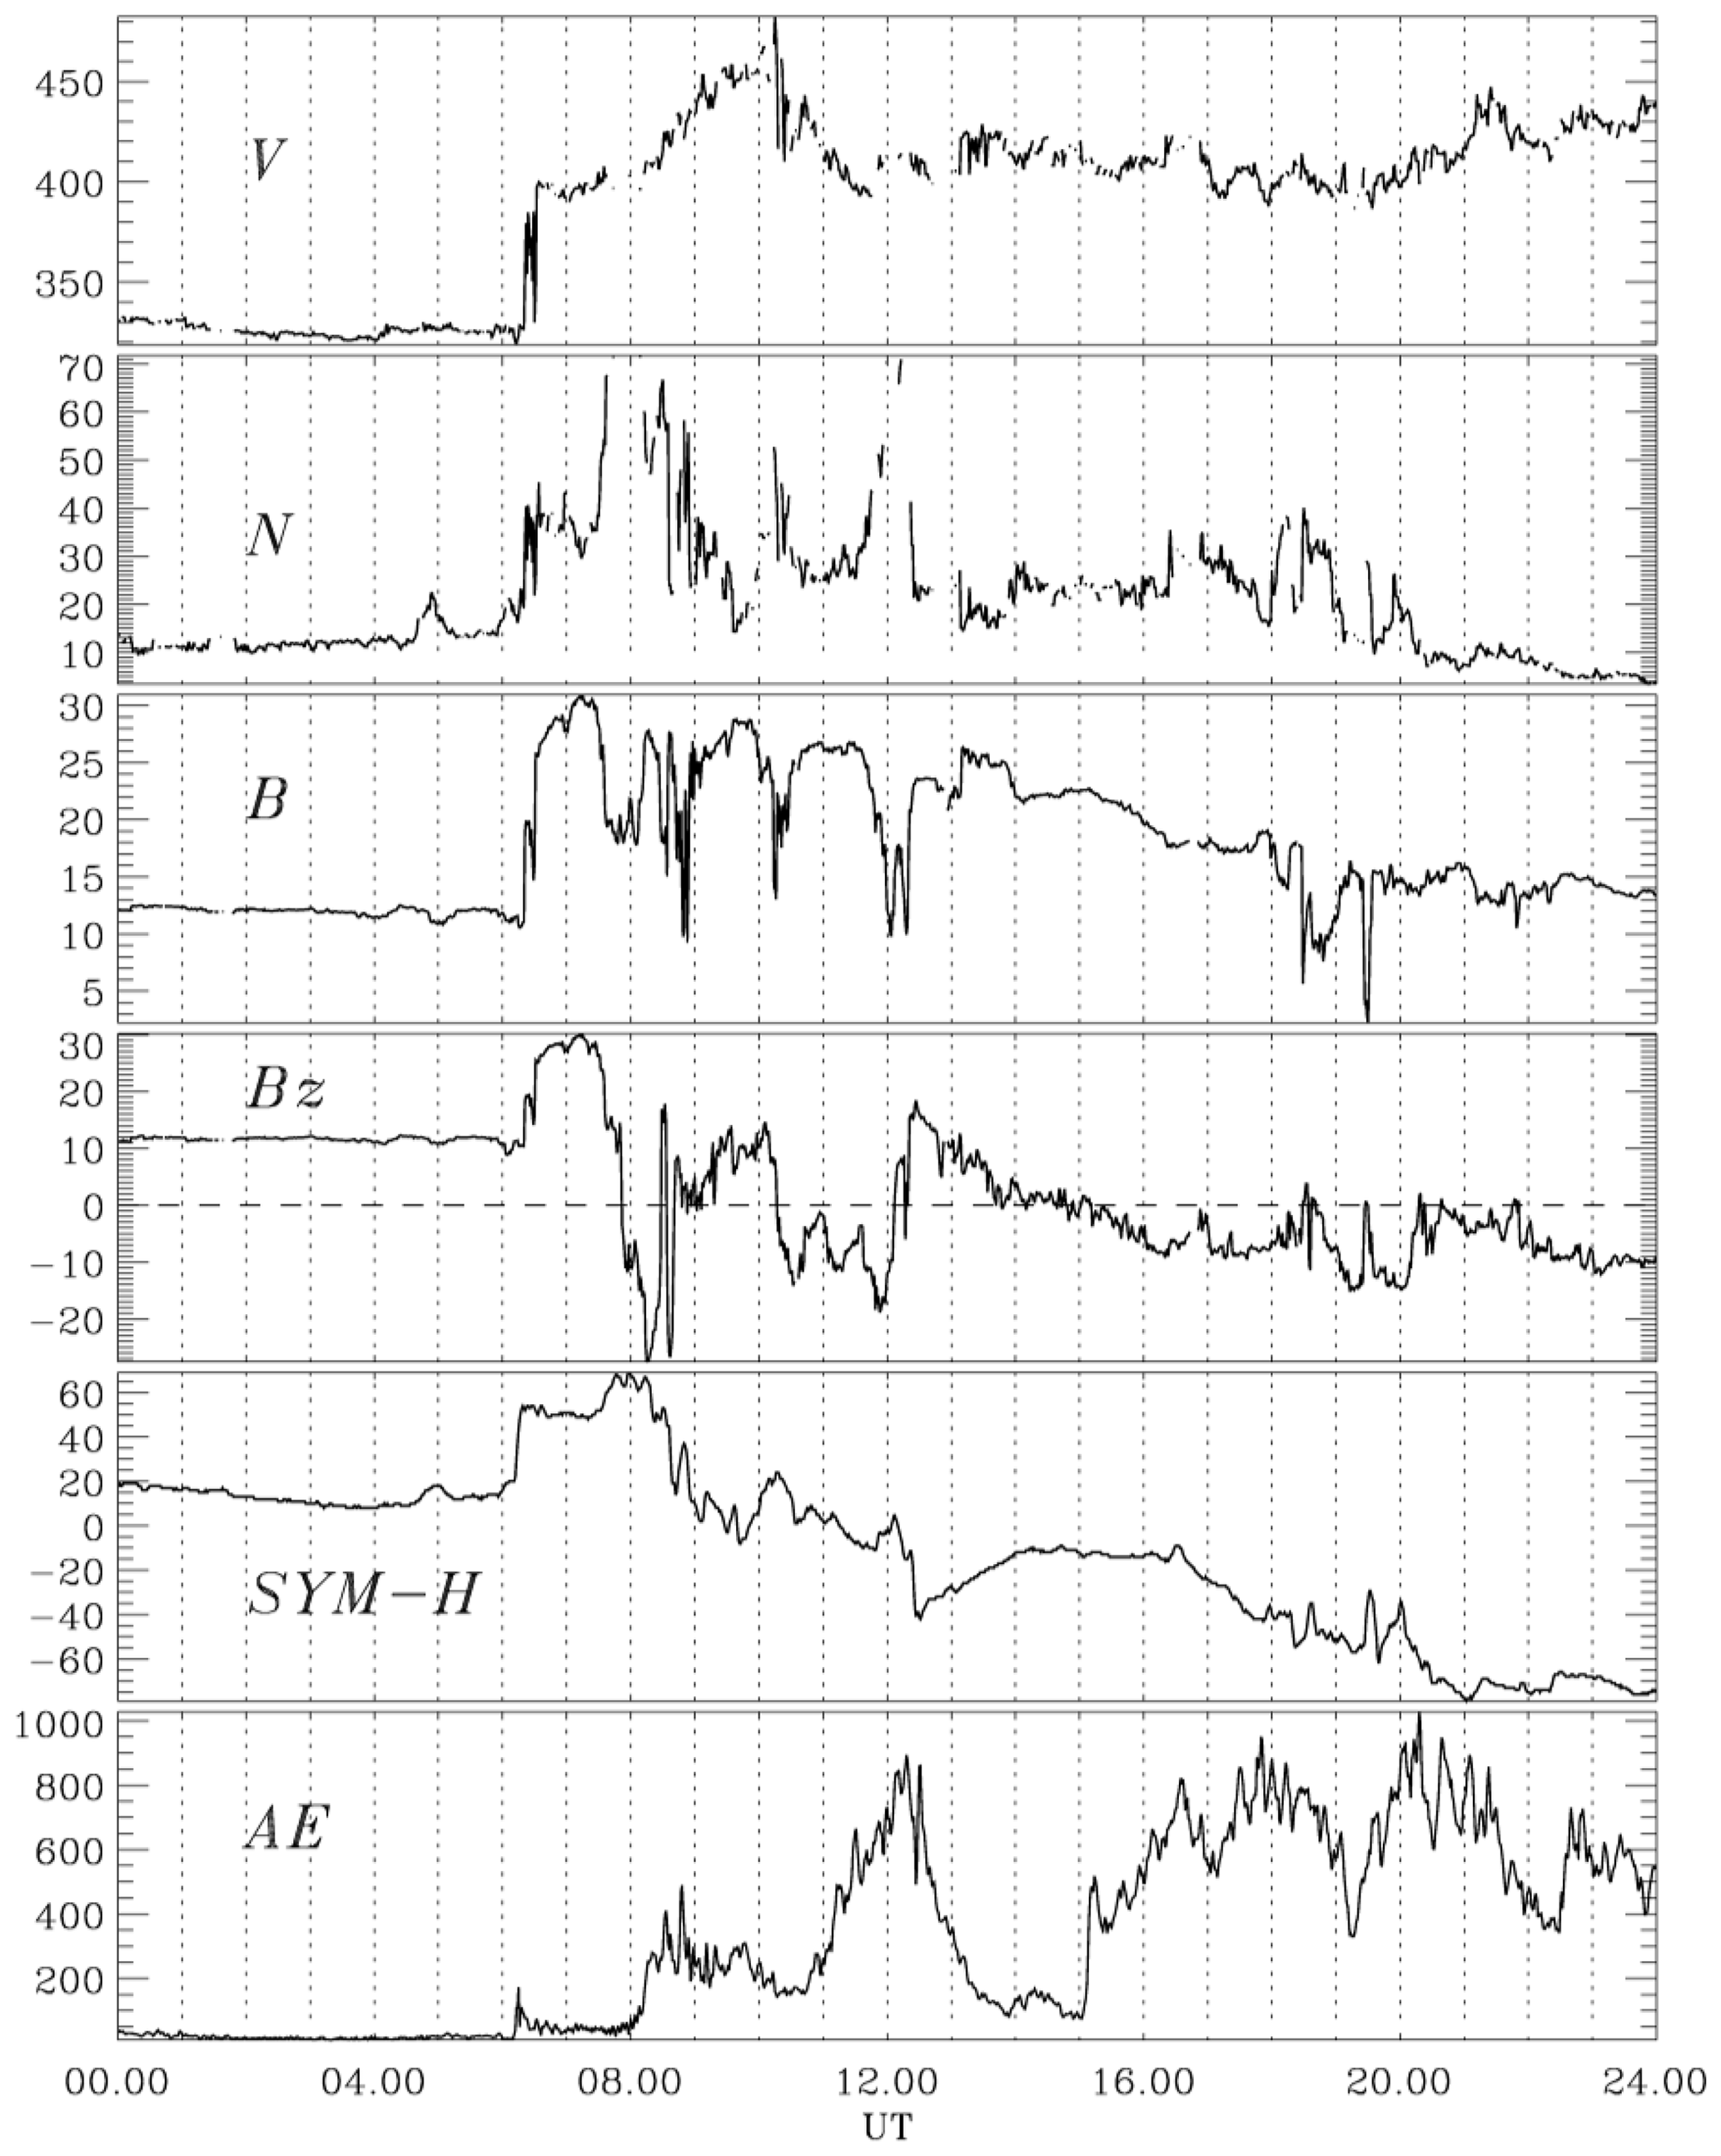
Figure 5Solar wind speed V (kilometres per second), solar wind density N (cubic centimetres), magnitude of the IMF (interplanetary magnetic field) B (nanoteslas), Bz component (nanoteslas) of IMF according to the OMNIWeb database, SYM-H index (nanoteslas), and AE index (nanoteslas) for 22 January 2012.
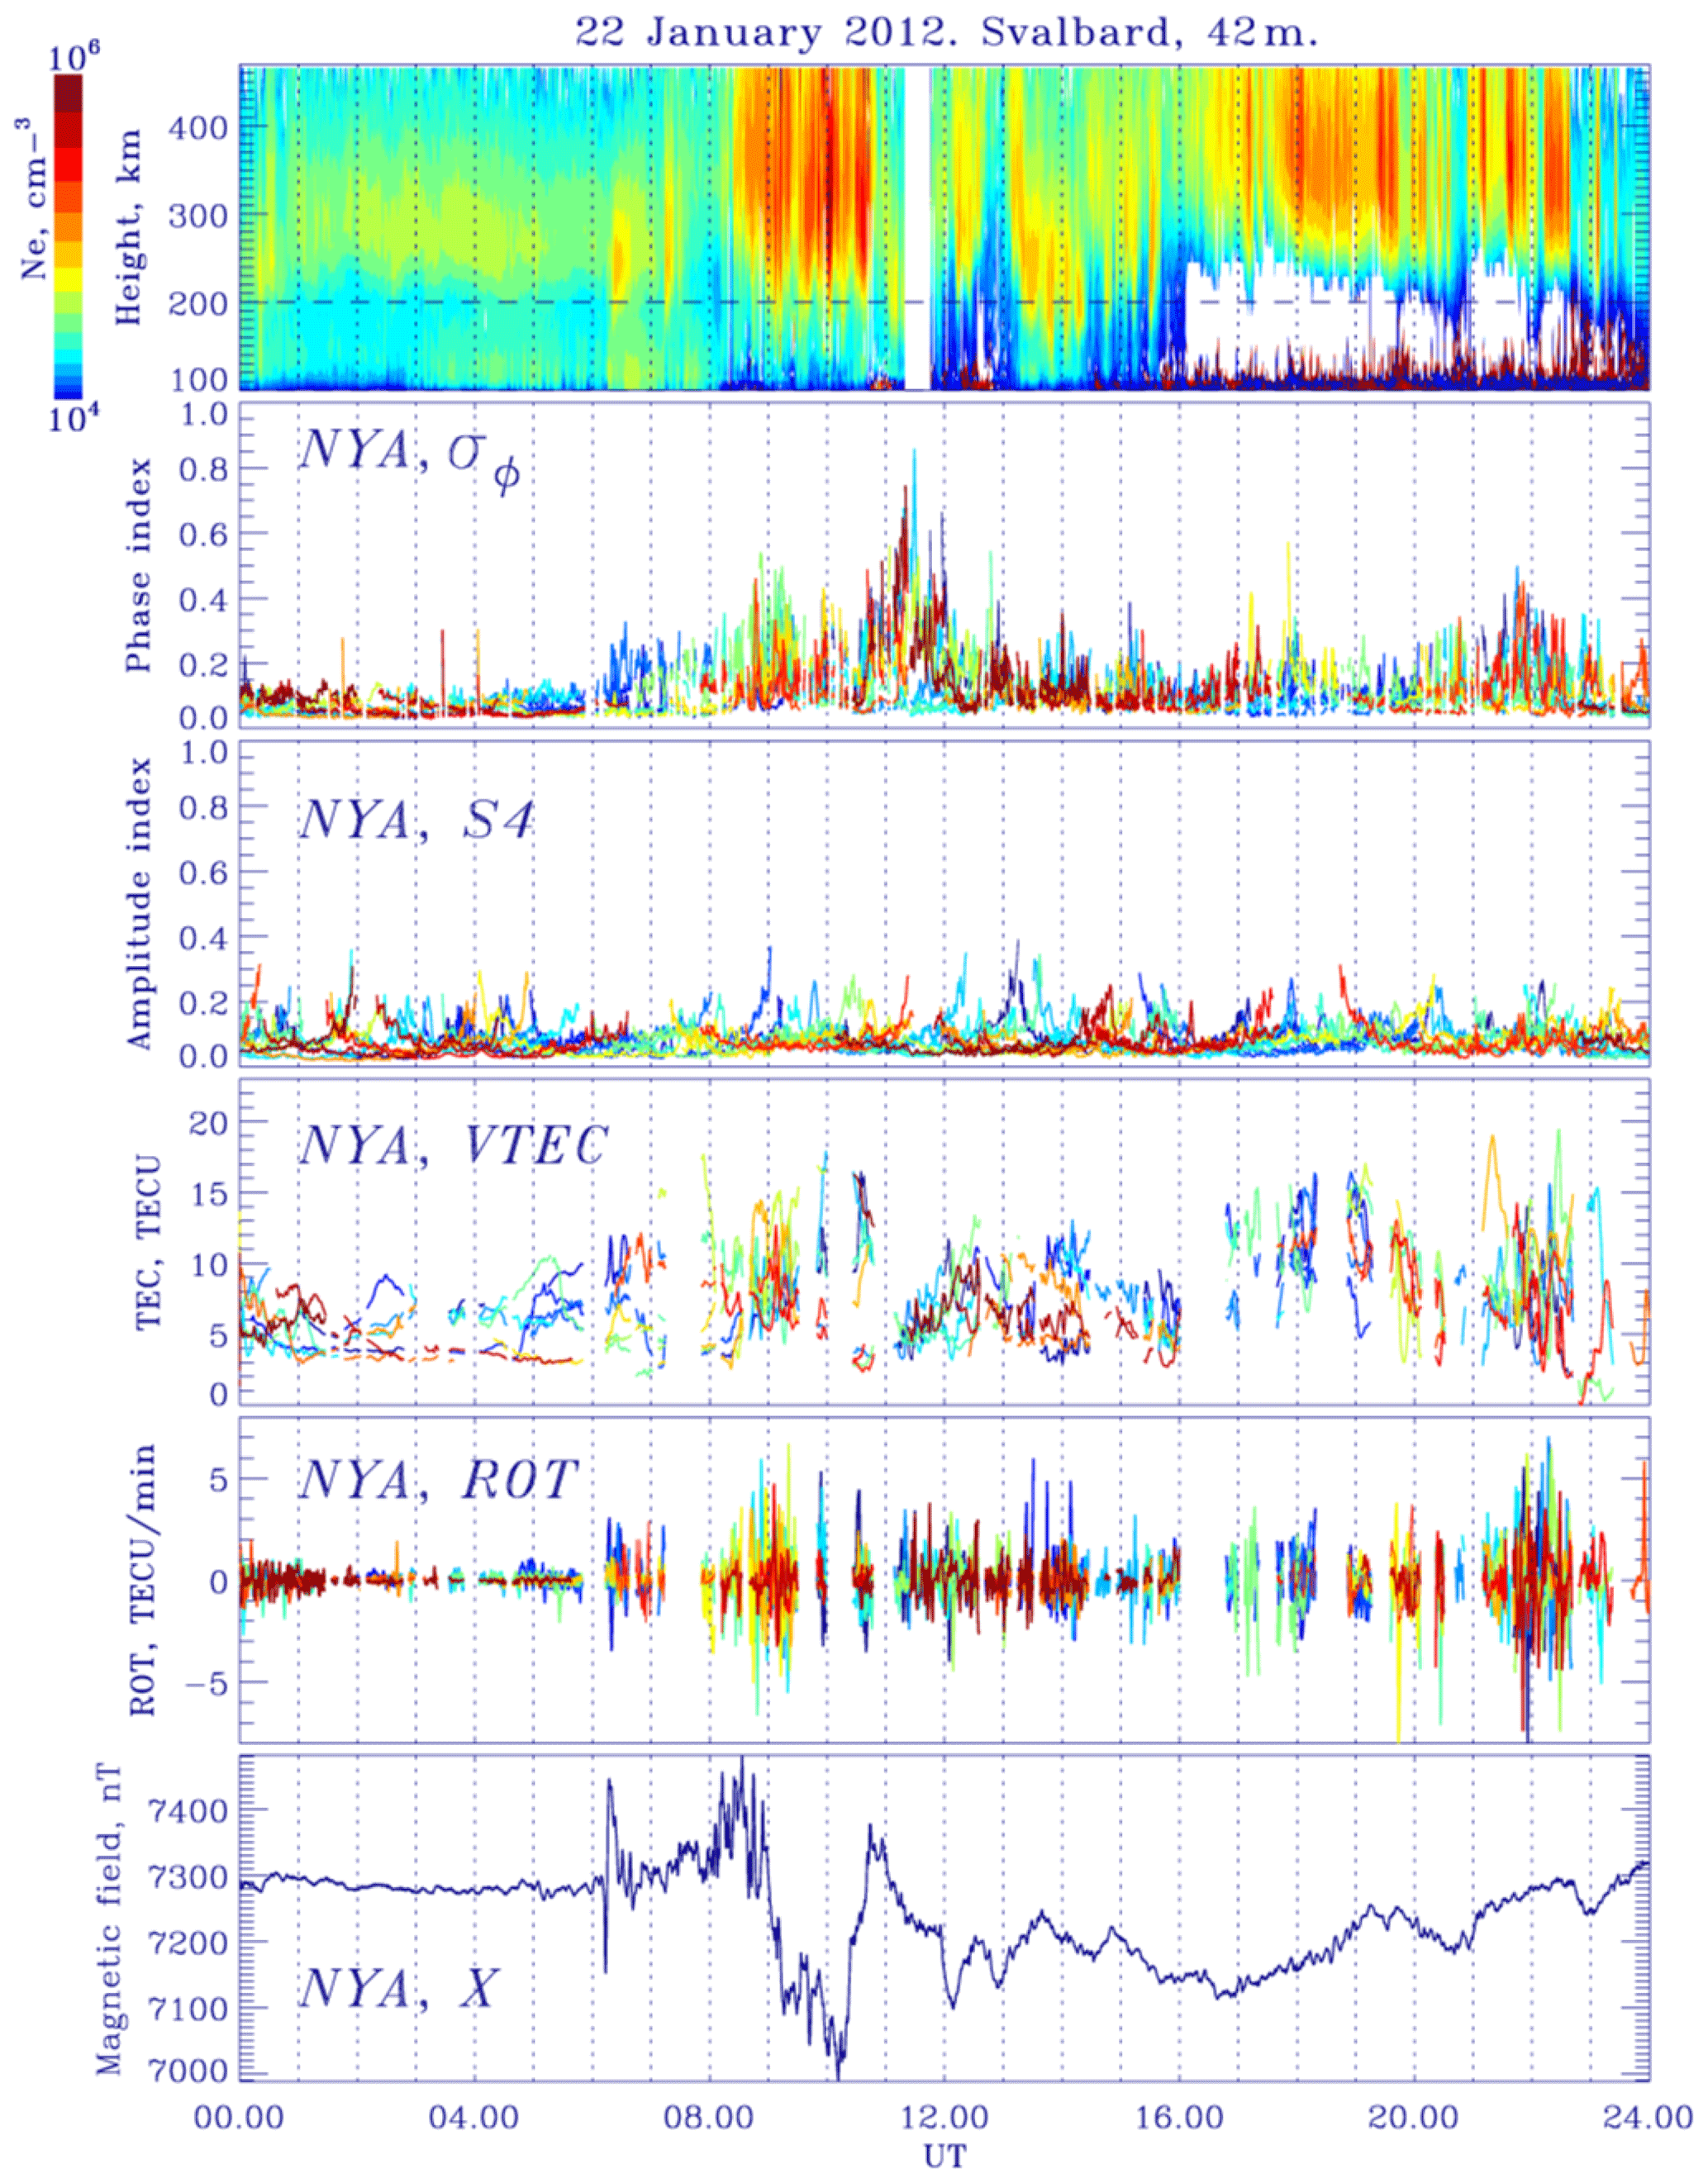
Figure 6Ionosphere plasma density according to the EISCAT 42m radar data, phase scintillation index and amplitude scintillation index according to the GPS receiver at NYA station, TEC and ROT variations according to the GPS receiver at NYA station, and geomagnetic field variations (X component) at NYA station for the 22 January 2012.
The considered interplanetary shock is accompanied by an abrupt increase in the solar wind velocity (from 320 to 400 km s−1), density (from 20 to 40 cm−3), temperature, and magnitude of the interplanetary magnetic field (from 12 to 25 nT); according to the OMNIWeb database, there was abrupt growth of the SYM-H index at 06:10 UT (Fig. 5). The NYA station at the moment of interplanetary shock arrival was located on the morning side (09 MLT). For the SSC event, the phase index reaches the value near 0.3–0.4 rad (Fig. 6). The ROT reaches the value about 4 TECU min−1. So, the SSC event does not lead to the strong GPS scintillations.
For the considered interplanetary shock cases, the phase index reaches similar values (less than 1 rad).
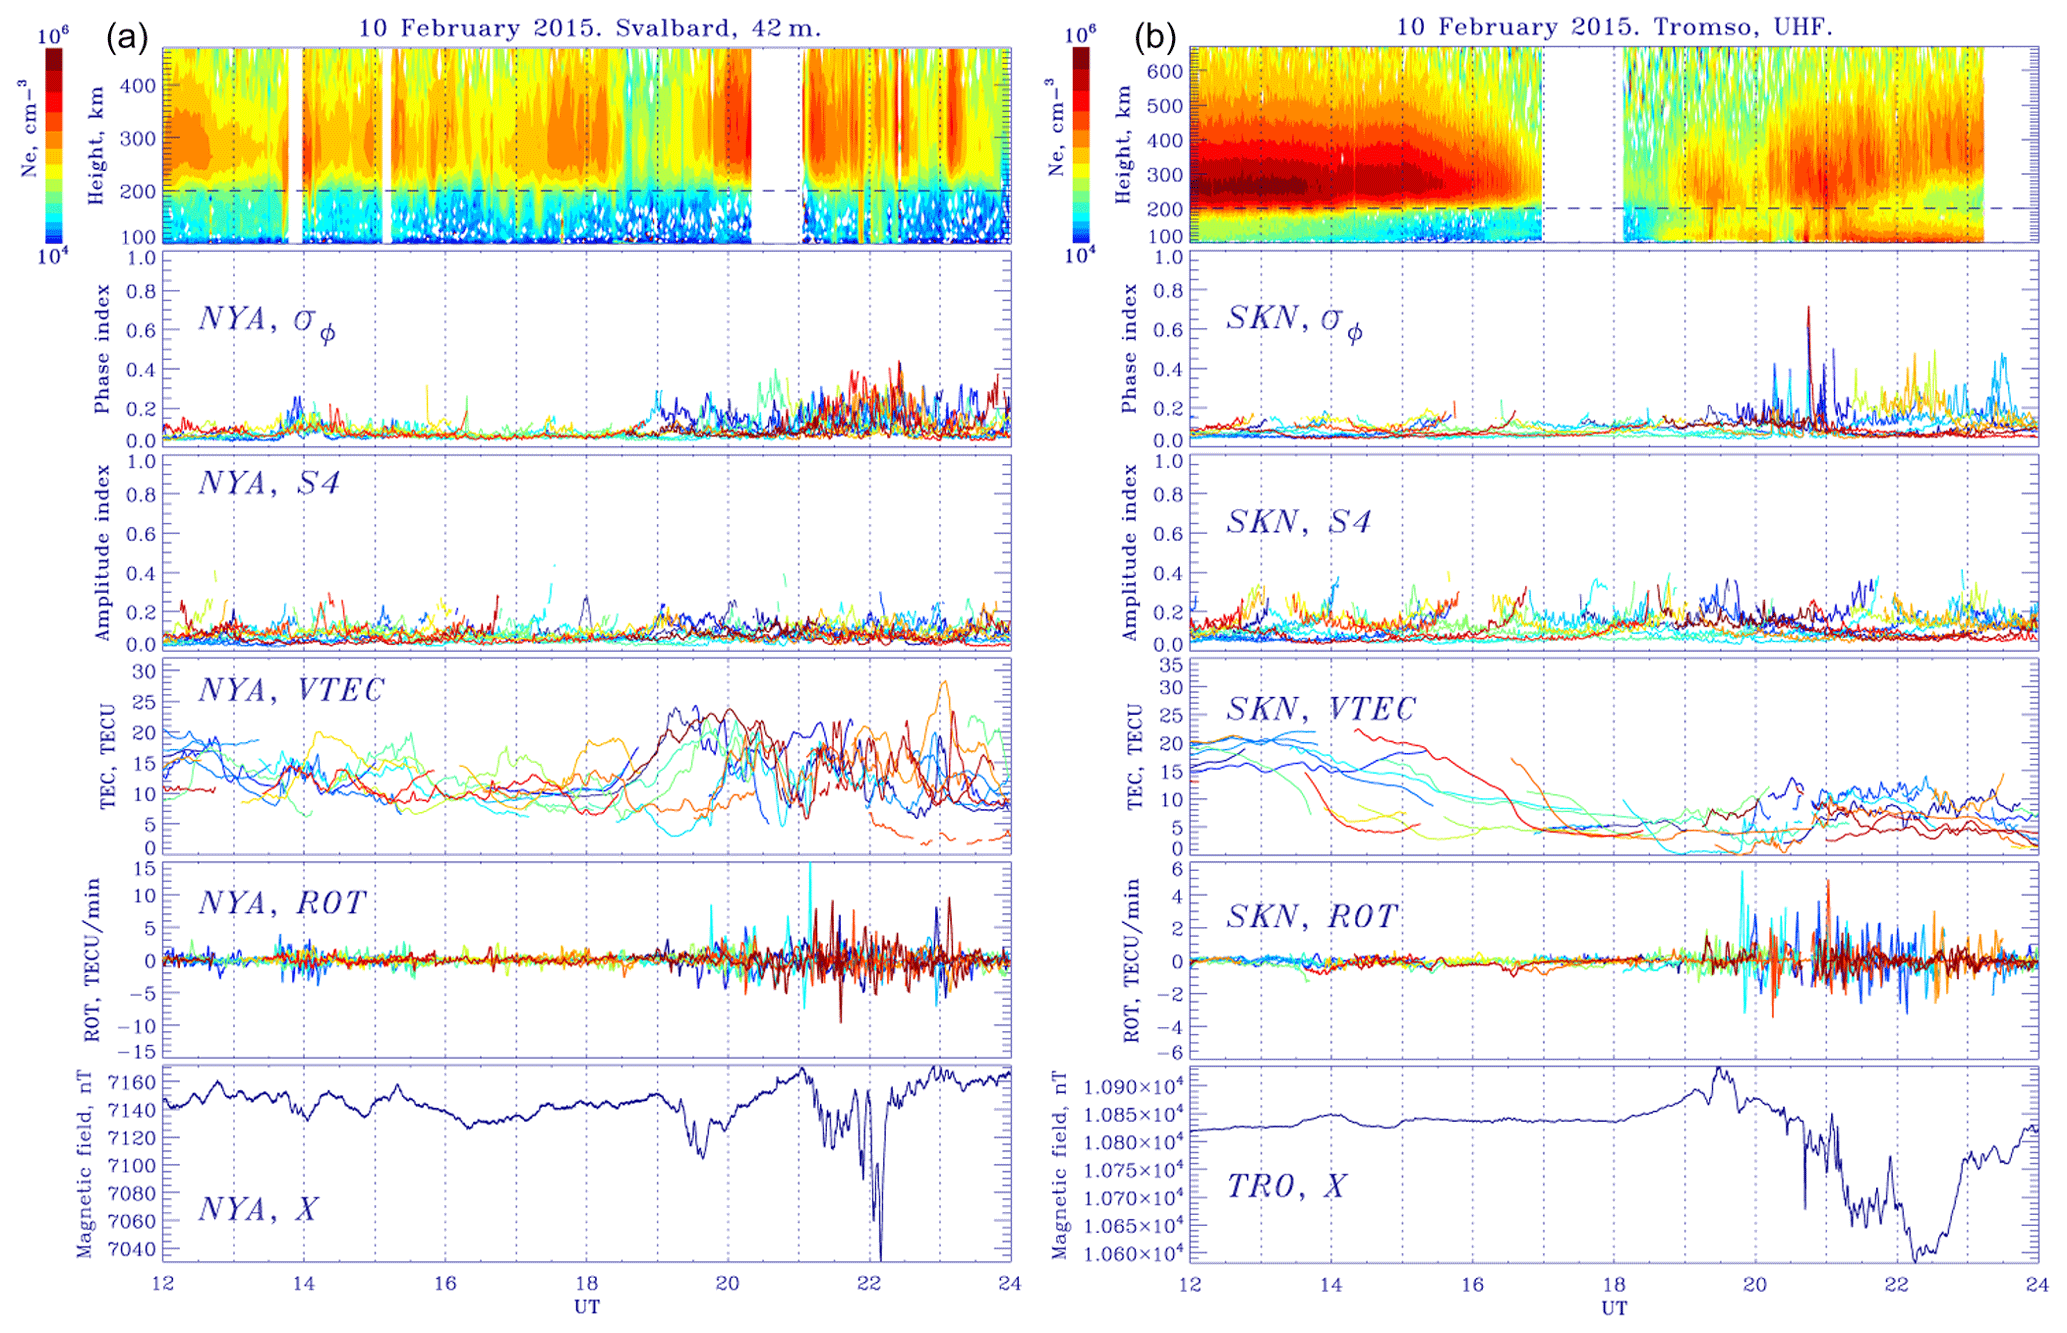
Figure 7(a) Ionosphere plasma density according to the EISCAT 42m data, phase, amplitude scintillation indexes, TEC and ROT variations according to the GPS receiver at NYA station, and X component of the geomagnetic field at NYA station. (b) Ionosphere plasma density according to the UHF EISCAT data, phase and amplitude scintillation indexes, TEC and ROT variations according to the GPS receiver at SKN station, and X component of the geomagnetic field at TRO station for 10 February 2015.
3.4 Polar cap patches
Nighttime polar cap patches. The example of the evening–nighttime polar cap patches (PCPs) is shown in Fig. 7a for 10 February 2015. The PCPs were observed at 19:00–23:30 UT as a density increase above 200 km, according to the EISCAT 42m radar data. The ionosphere plasma density ΔNe increases during PCPs from 8 × 10⁴ to 7 × 105 cm−3 at an altitude of about 321 km. At the NYA GPS receiver, the phase scintillation index reaches the medium value (0.4 rad). However, the ROT variations for the PCPs reach the high values (10–15 TECU min−1).

Figure 8Keogram (630.0 nm emission line) from the all-sky imager at LYR station for 10 February 2015.
During the PCPs appearance, the Bz component of the IMF has negative values (−6 nT) during 3 h (data not shown). It leads to the development of the small substorm. The amplitude of the substorm is 120–140 nT in the X component of the geomagnetic field at NYA station. The PCPs are also identified in the aurora intensity variations as forms propagating from the polar to low latitudes in 630.0 nm (red line), and emissions (Fig. 8) occurred at 19:00–23:00 UT, according to LYR all-sky camera observations.
It was done by comparing the PCPs development on EISCAT 42m radar (Svalbard) and EISCAT UHF radar located at lower latitudes in Tromsø (Fig. 7b). The sharp increase in the plasma density (Fig. 7b) from 12:00 to 17:00 UT above 200 km is caused by the sunlight. During an appearance of PCPs near Svalbard at latitudes of the SKN (TRO) stations, a long-lasting substorm (more than 4 h duration) with the amplitude 200–250 nT was observed. This substorm produces a strong ΔNe increase below 200 km and at altitudes of 200–550 km (Fig. 7b). At the SKN station, the phase scintillation index has approximately the same values (0.4–0.5 rad) as in polar latitudes (NYA station), but for one moment, σϕ reaches the value of about 0.7 rad. ROT variations at SKN station have lower values (6 TECU min−1) than those on Svalbard.
Daytime polar cap patches. The influence of polar cap patches, which were observed on the dayside, on GPS signals scintillations were also analysed. We considered the geomagnetic storm on 22 January 2012 (Figs. 5 and 6). The SSC event for this storm was considered in Sect. 3.3 of this paper. It was CME (coronal mass ejection) geomagnetic storm conditions, the SYM-H index reached the value about -80 nT, and the solar wind speed had a maximum of about 480 km s−1, according to the OMNIWeb database.
According to the ionosphere plasma density measurements on EISCAT 42m radar, the PCPs were registered after the development of the geomagnetic storm in the time interval 08:00–12:00 UT (11:00–15:00 MLT; see Fig. 6). The ionosphere plasma density ΔNe increases during PCPs from 5 × 10⁴ to 7 × 105 cm−3 at an altitude of about 321 km. The negative bay in the geomagnetic field variations, with an amplitude of about 300 nT is seen at NYA station.
During this event, the strong GPS phase scintillations (0.5–0.8 rad) were registered in the whole time interval of the PCPs appearance. The S4 index amplitude has no clear response to the PCPs. A VTEC increase was observed (from 5 to 18 TECU), which was caused by the PCPs contribution. ROT variations have high values (7 TECU min−1).
For the all of the considered PCPs, the cases phase index has a value less than 1.
3.5 Statistical analysis
To statistically confirm the results of our case studies, we present four tables which include values of phase scintillation index and ROT values for the considered types of the ionosphere disturbances. Tables 2 and 3 also include the magnitude of the geomagnetic field disturbance (X component) for the substorms, and SSC/SI events. Often, during the whole day, some types of the ionosphere disturbances were observed.
Table 1The values of the phase scintillation index and ROT, determined from the GPS receiver at NYA station, during dayside/cusp precipitation events.
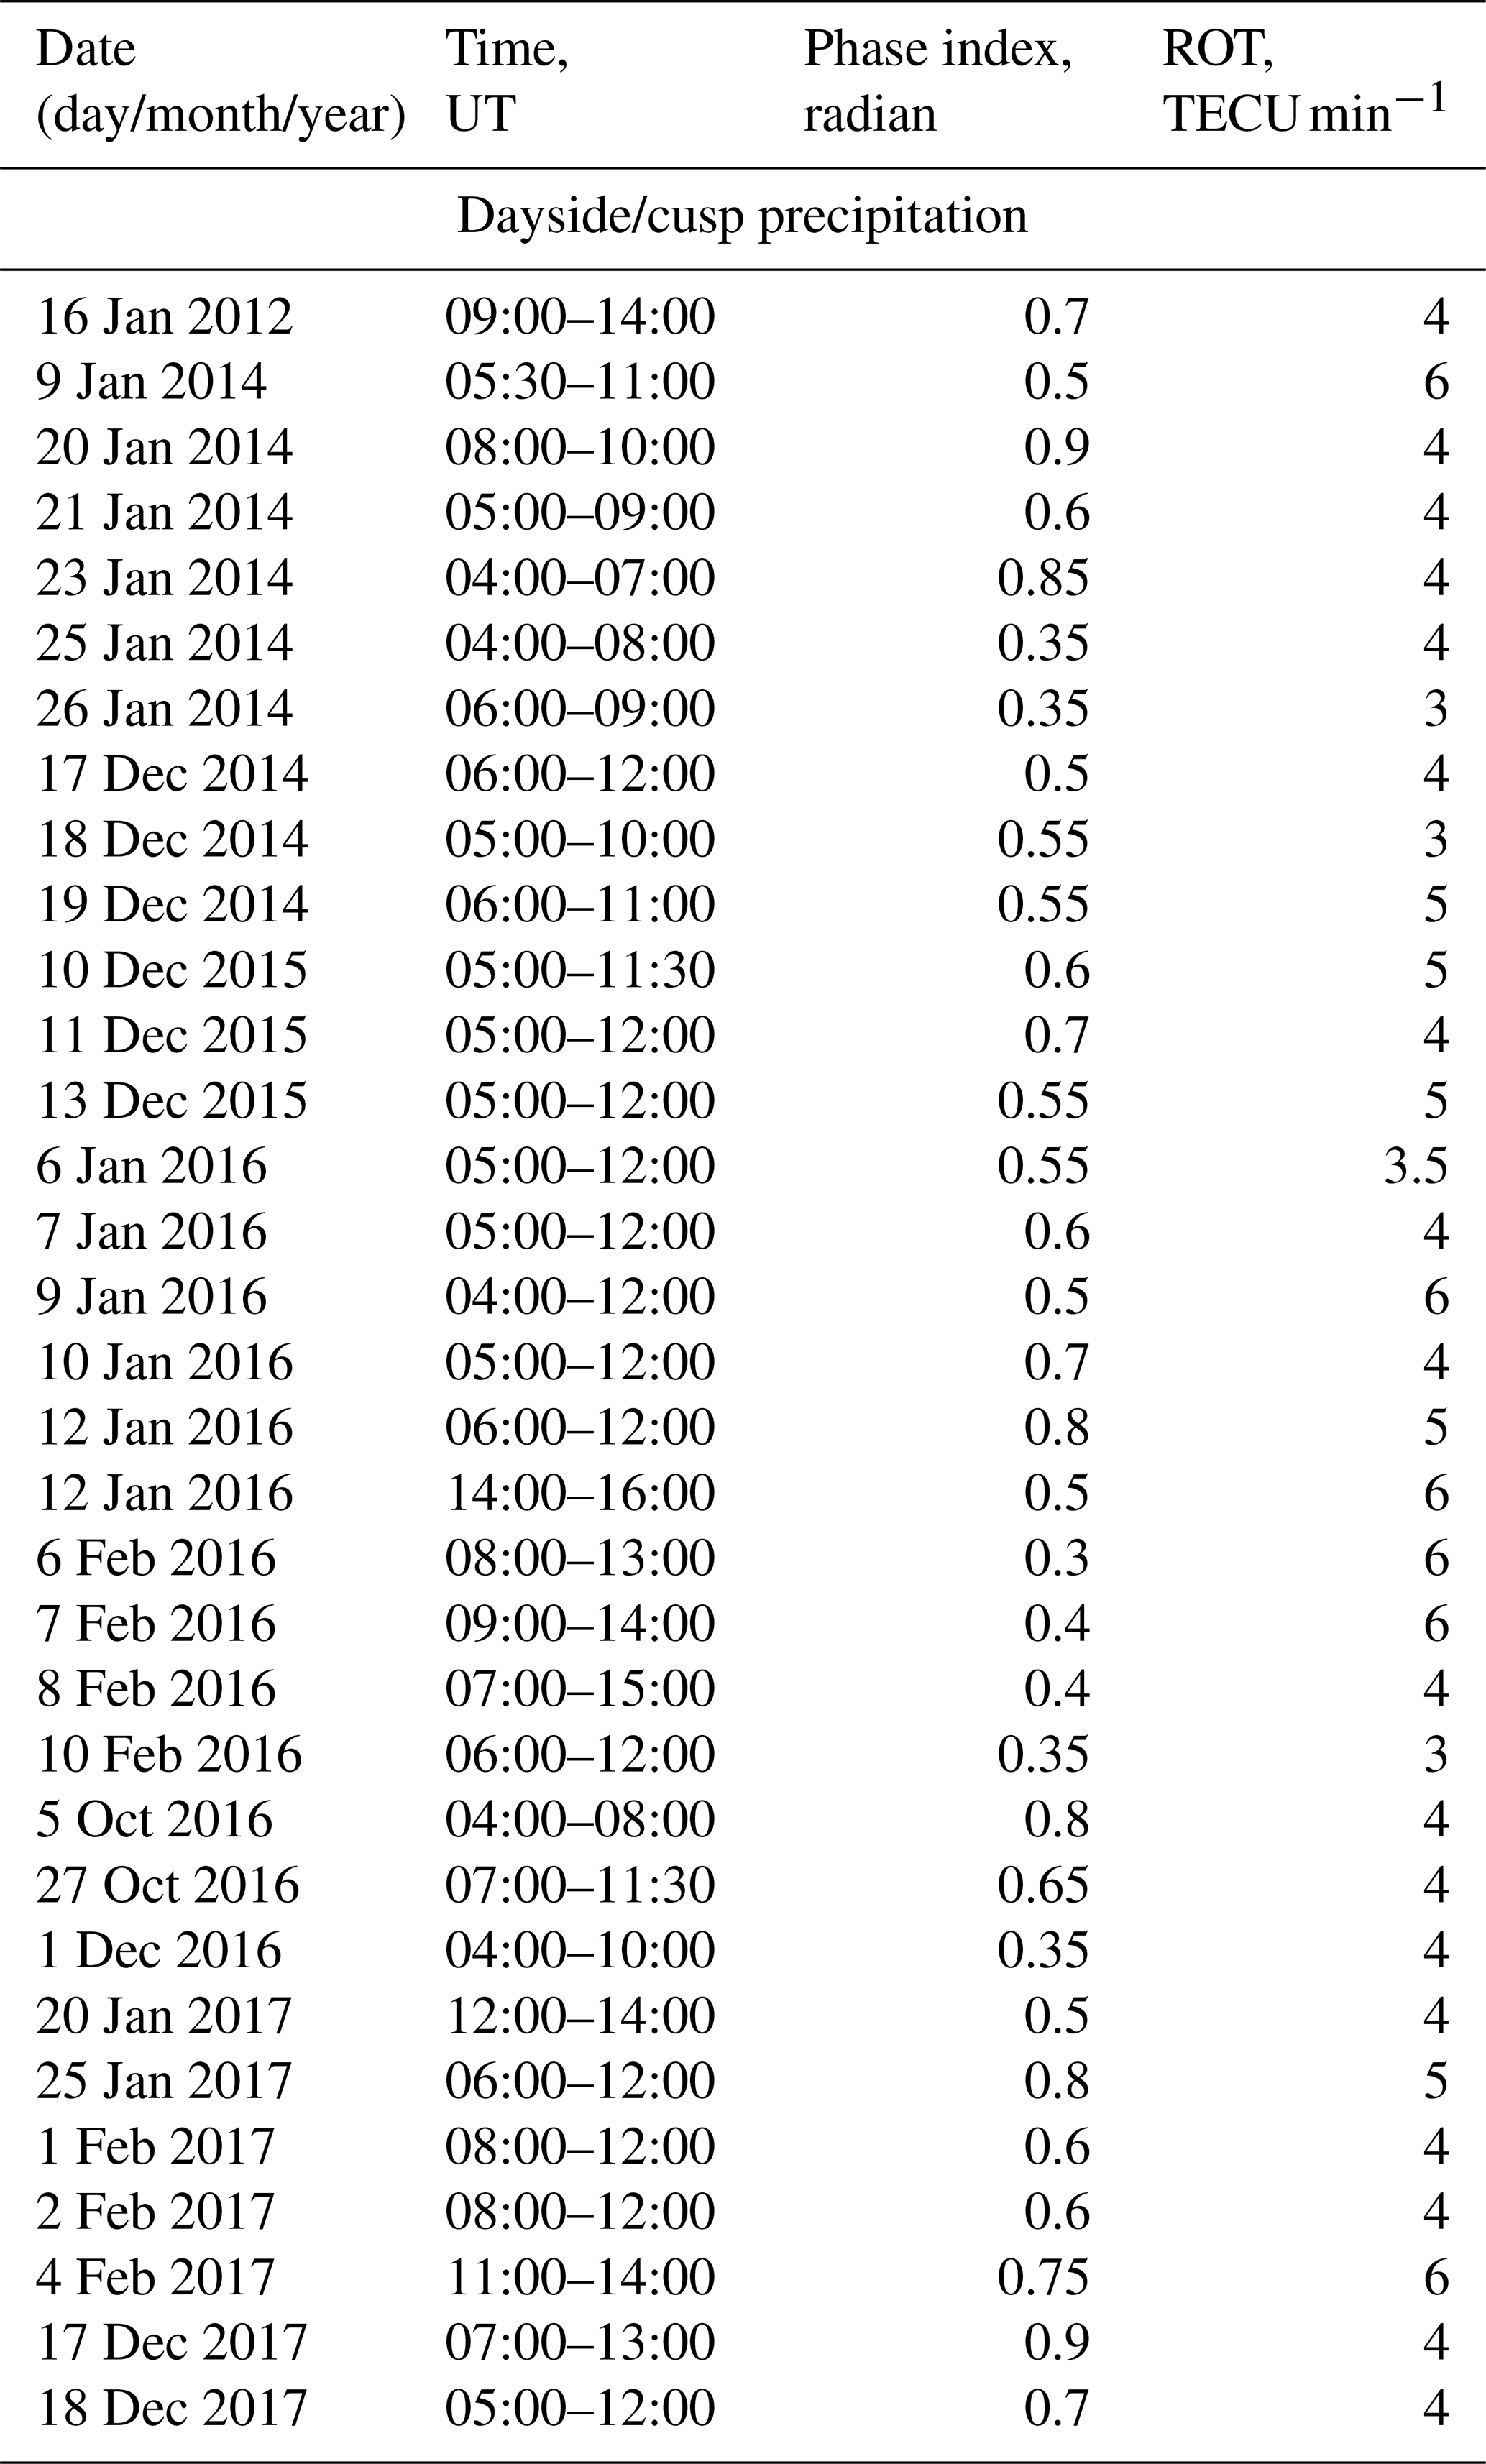
Table 1 presents 33 dayside/cusp precipitation events. The phase scintillation index is less than 1 rad, with the medium values of about 0.5–0.6 rad. ROT values are no more than 6 TECU min−1.
Table 2The values of the phase scintillation index and ROT, determined from the GPS receiver at NYA station, and corresponding levels of the geomagnetic field disturbance (ΔX) during substorm and substorm during PCPs events.

Table 2 presents 35 substorm events. For many substorm events, the phase scintillation index is more than 1 and ROT values are no more than 6 TECU min−1. The maximum value of the phase scintillations is 2.9 rad fixed for the 20 January 2010 event when the geomagnetic field disturbance ΔX at NYA stations is about 750 nT. We also separately selected substorms which were observed during the PCPs appearance. It is seen from the substorm statistics that, in general, the phase index increase correlates with the level of the geomagnetic disturbance. But sometimes even small amplitude substorms lead to the significant values of the phase index when combined with the PCPs. Possibly the presence of the PCPs gives growth to the level of scintillations (Jin et al., 2014; Clausen et al. 2016).
Table 3The values of the phase scintillation index, ROT, determined from the GPS receiver at NYA station, and corresponding levels of the geomagnetic field disturbance (ΔX) during SSC/SI events.

Table 3 presents 14 SSC/SI events. Shock-induced precipitation leads to medium values of the phase scintillation index (0.4–0.5 rad) and medium values of the ROT (4–6 TECU min−1). SSC events, when they were observed at nighttime, often trigger the development of the geomagnetic substorm. So, high values of the phase scintillations (near 1 rad) can be caused by the triggering of the substorm immediately after SSC. Often there is no significant increase in the GPS phase scintillations observed after the SSC.
Table 4The values of the phase scintillation index and ROT, determined from the GPS receiver at NYA station, during PCPs events.
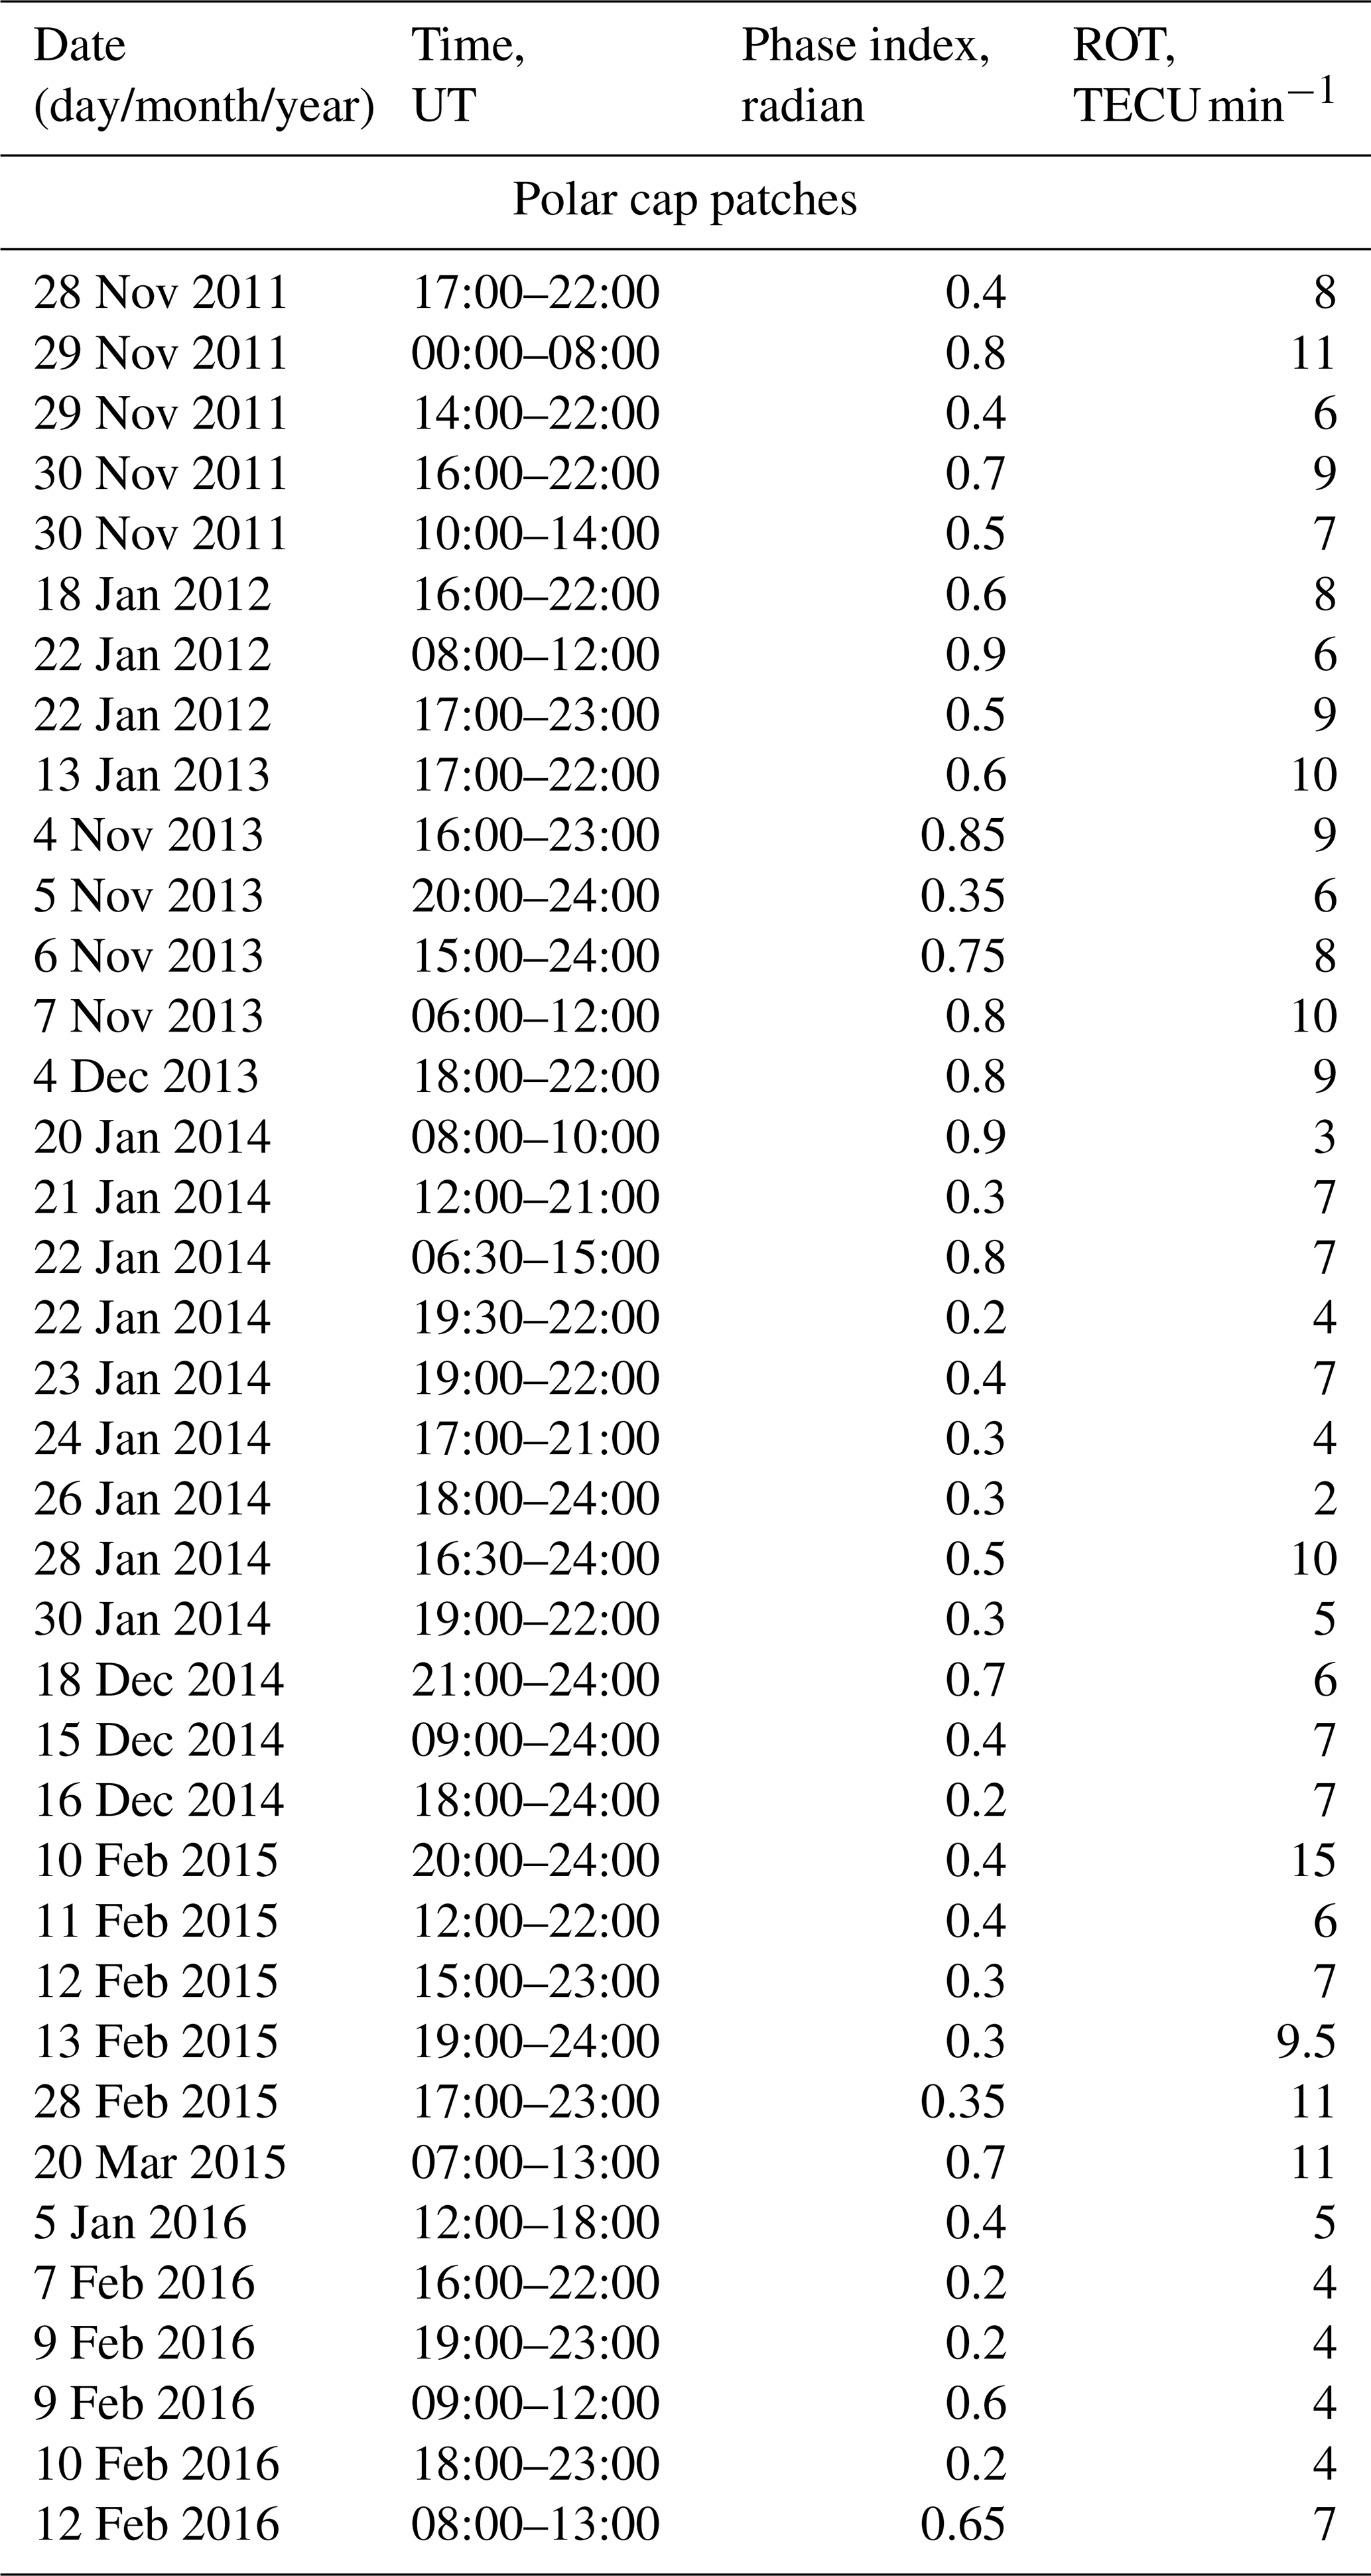
Table 4 shows 38 daytime and nighttime PCPs events. It is seen from Table 4 that phase scintillations during PCPs are less than 1. An analysis of Table 4 shows that PCPs produce more strong ROT variations (even > 10 TECU min−1) than other types of the polar latitude ionosphere disturbances.
Jin et al. (2017) investigated the GPS scintillations around the cusp region and found that cusp precipitation has a stronger influence on GPS phase scintillation when combined with the PCPs. Our research shows that daytime PCPs can produce stronger GPS phase scintillations than dayside/cusp precipitation (see Tables 1 and 4).
It is also seen from the tables that often one type of the ionosphere disturbance was registered during several consecutive days. For example, for the PCPs it is 28–30 November 2011, 4–6 November 2013, and 20–26 January 2014, for the substorms it is 10–13 December 2015, and for the cusp/daytime precipitation it is 17–19 December 2014. Of course, there are more events with a significant increase in the phase scintillations during the years 2010–2017. But we mainly pay attention to the events when the GPS and EISCAT data were available simultaneously to precisely define the physical nature of the ionosphere disturbance. Only for the SSC/SI events do we not always use the EISCAT radar data. So, an analysis of the group of the events confirms in general the detailed analysis of the individual events.
The high-latitude ionosphere is a very dynamic structure, due to the charge particles (mainly electrons and protons) penetrating from outer space, which can lead to the appearance of the different timescale ionosphere irregularities. Variations in the ionospheric electron density cause the variable group delay and phase advance of the radio wave, resulting in rapid phase fluctuations or phase scintillations. The scintillations of the GPS radio signal are caused by the refraction and diffraction of radio waves passing through ionospheric irregularities on scales from tens of metres to a few kilometres (Basu et al., 2002; Kintner et al., 2007). There is a problem with finding the optimal cut-off frequency during phase detrending. The choice of the standard cut-off frequency (0.1 Hz) can lead to the presence of the refractive variations in the phase scintillation index (Forte, 2005; Mushini et al., 2012; Ghobadi et al., 2020; Spogli et al., 2021).
There are a lot of disturbances in the polar ionosphere. The main phenomena are substorm and polar cap patches. In this work, it is considered the influence of different types of the high-latitude ionosphere disturbances (such as dayside/cusp precipitation, substorms, nighttime and daytime polar cap patches, and interplanetary shock waves) on perturbations of GPS signals, using the GPS scintillation receiver on Svalbard. For some events, the SKN GPS scintillation receiver on mainland (Norway) was also used. In this paper, we present case studies and statistical analyses.
Concerning amplitude GPS scintillations at high latitudes, we confirm the previous findings and did not found any certain reaction of the S4 index to the considered disturbances. However, Jin et al. (2018) have found S4 scintillations for the very strong geomagnetic storm on 17 March 2017. But it was extreme event. For the ordinary events S4 index at high latitudes does not experience great increases.
The analysis shows that the polar substorms, even if they are observed without PCPs, lead to the maximum values of the phase scintillation index (1.5–3 rad). From one side it is obvious because the substorm is the most powerful disturbance in the magnetosphere–ionosphere system, and it leads to the growth of the ionosphere plasma density on two orders of magnitude. The ULF waves (Pi3 pulsations), embedded into substorm, can accelerate electrons along the geomagnetic field lines and produce auroral arcs. The duration of the substorm is about 1.5–3 h, while the growth of the phase scintillation index was observed during 30–40 min (expansion phase). So, the substorm leads to the high, but short-term, growth of the phase index. Kim et al. (2014) showed that ULF waves in the Pi2 frequency range have a dominant role in producing accelerated auroral electrons. During the substorms, bright and discrete auroral forms appeared in the sky. Such inhomogeneous ionization structures produce significant changes in the refractive index and enhance the phase scintillation index (Hosokawa et al., 2014). In addition, field-aligned currents and produced field-aligned irregularities can be the major drivers of high-latitude ionospheric irregularities (Prikryl et al., 2011).
The phase scintillations are typically produced by variations in the refractive index due to ionospheric irregularities of the scale from a few kilometres to a few tens of kilometres (Kintner et al. 2007). The phase scintillations during the substorm interval were produced through the refractive process caused by large-scale density irregularities associated with a rapidly moving auroral arc. Hosokawa et al. (2014) found that phase scintillations were enhanced in relation to substorm onset and decreased as the aurora became more diffuse. They suggested that discrete aurora in the GPS signal path is necessary for the occurrence of phase scintillations during substorm intervals. In addition to scintillation, other effects, such as loss of lock (Smith et al., 2008) and cycle slips (Prikryl et al., 2010), have been directly observed in relation to auroral emissions. The long-term statistical study (De Franceschi et al., 2019) over Svalbard for the years 2013–2016 shows that magnetic midnight region is the most exposed to scintillations.
Polar cap patches are the source of decametre to kilometre-scale irregularities causing scintillations. In some of the considered cases, the polar cap patches were observed during 6 h on EISCAT 42m radar. Analysis shows that PCPs are accompanied by the lower values of phase index than during a substorm, but this growth is registered during longer time intervals. At the same time, the PCPs lead to the substantially higher values in the ROT variations. ROT is the time rate of change of the differential carrier phases; it provides information about scale size of the electron density irregularities which produce GPS signal scintillations. We used a 1 min ROT time resolution in our study. The typical velocity of the plasma convection at high latitudes is between 100 m s−1 and 1 km s−1. So, 1 min ROT variations are caused by the irregularities with the scale of about 6–60 km. Our observations suggest that the substorms and PCPs, being different types of high-latitude disturbances, lead to the development of different types and scales of ionospheric irregularities.
Comparison of the EISCAT observations on Svalbard and in Tromsø shows that, during PCPs appearance on Svalbard, a typical substorm at lower latitudes (Tromsø) was observed. The levels of the phase scintillations are quite comparable at high (Tromsø) and polar (Svalbard) latitudes, but the level of ROT is higher at polar latitudes.
There are two plasma instabilities which can explain the ionospheric irregularities at high latitudes, i.e. the gradient drift instability (GDI) and the Kelvin–Helmholtz instability (KHI). The GDI requires a density gradient, and it can produce irregularities at the trailing edge of a plasma patch, while the KHI requires a velocity shear, and the irregularities can be created around boundaries of velocity shears. The GDI can work on these sharp density gradients very efficiently (Moen et al., 2013) to produce small-scale irregularities which cause scintillations. The polar cap patches represent the largest scale structure in the high-latitude ionosphere. During their convection in the polar cap, the GDI acts on them and develops small-scale irregularities on the trailing edge.
The identification of the cusp region, using the SuperDARN and all-sky cameras, was done in our study. The cusp region is a source of the plasma turbulence of the different scales. It is found the medium growth of the TEC and ROT near the cusp region. Cusp phase scintillations are lower than dayside PCPs scintillations. On the dayside, the cusp is an active region of the GPS scintillations (Moen et al., 2013), where the loss of signal locks occurs (Oksavik et al., 2015). By analysing GPS phase scintillations around magnetic noon, it is suggested that GPS phase scintillations are sensitive to a combination of the cusp aurora and the intake of solar extreme ultraviolet radiation (EUV)-ionized plasma (Jin et al., 2015).
The common analysis shows that, for all of the considered events, the significant phase scintillations were observed. PCPs lead to the prolonged variations in the phase index but with smaller values (less than 1). Shock-induced precipitation and daytime and cusp precipitation lead to the medium values of phase index (0.4–0.5 radians) and medium values of the ROT. But among the all types of the disturbances, the substorms lead to the greatest values in the phase scintillations index. Thus, the substorm precipitation has the strongest impact on the scintillations of GPS radio signals in the polar ionosphere – even without PCPs. The substorm leads to short times (10–20 min) and the strongest values of GPS phase scintillations, while PCPs lead to long times (some hours) and medium values of GPS phase scintillations. So both types of these ionosphere disturbances are dangerous for the quality of communications, navigation, and locations at polar latitudes.
The influence of different types of the high-latitude ionosphere disturbances (such as daytime/cusp precipitation, substorms, nighttime and daytime polar cap patches, and interplanetary shock wave) on perturbations of GPS signals, using receivers on Svalbard and in Skibotn, are considered. All of the considered types of ionospheric disturbances lead to growth in the phase scintillations index and ROT variations.
Substorms (even without PCPs) lead to the maximum values of the phase scintillation index (1.5–3 rad). The growth of the phase index was mainly observed during the substorm expansion phase. ULF waves in the Pi3 frequency range during a substorm producing auroral arcs can lead to such high values of the phase scintillation index.
The values of the substorm phase scintillations in general correlate with the values of the geomagnetic field disturbance. But sometimes even small geomagnetic substorms, when combined with the PCPs, produce quite strong phase scintillations.
Polar cap patches lead to the prolonged variations in phase index with smaller values (less than 1). At the same time, polar cap patches can lead to strong ROT variations (10–15 TECU min−1) in comparison with the substorm disturbances. So our observations suggest that the substorms and PCPs, being different types of the high-latitude disturbances, lead to the development of different types and scales of ionospheric irregularities.
The cusp region, identified with SuperDARN radar, leads to the moderate growth of the phase scintillation index and ROT variations. Shock-induced precipitation leads to medium values in the phase scintillation index (0.4–0.5 radians) and medium values in the ROT (4–6 TECU min−1). Our analyses show that there is no clear response of the amplitude scintillation index to the different types of the ionosphere disturbances.
The IMF and solar wind data are provided by the NASA OMNIWeb service (https://omniweb.gsfc.nasa.gov/, last access: 16 July 2021). The authors wish to thank the IMAGE (http://www.ava.fmi.fi/image/, last access: 16 July 2021) and EISCAT groups for the available data. EISCAT is an international association supported by research organizations in China (CRIRP), Finland (SA), Japan (NIPR and STEL), Norway (NFR), Sweden (VR), and the UK (NERC). Data from EISCAT can be obtained from the Madrigal database http://www.eiscat.se/, last access: 16 July 2021. The University of Oslo ASI data are available at http://tid.uio.no/plasma/aurora, last access: 16 July 2021. The authors acknowledge the use of SuperDARN data. SuperDARN is a collection of radars funded by national scientific funding agencies of Australia, Canada, China, France, Italy, Japan, Norway, South Africa, UK, and USA.
VBB formulated the problem, analysed the events, drew the conclusions, and wrote the text, with contributions from all the co-authors. YJ formulated the problem, processed the GPS and optical data, and corrected the text. WJM formulated the problem and organized the research team.
The authors declare that they have no conflict of interest.
Publisher's note: Copernicus Publications remains neutral with regard to jurisdictional claims in published maps and institutional affiliations.
The authors wish to thank the Norwegian Polar Research Institute at Ny-Ålesund for assisting us with the GPS receiver in Ny-Ålesund, and Bjørn Lybekk and Espen Trondsen for the instrument operations. The authors wish to thank the IMAGE, SuperDARN, and EISCAT groups and the University of Oslo for the use of their data. This work has been supported by the Russian Science Foundation (grant no. 18-77-10018).
This research has been supported by the Russian Science Foundation (grant no. 18-77-10018).
This paper was edited by Ana G. Elias and reviewed by Knut Stanley Jacobsen and one anonymous referee.
Alfonsi, L., Spogli, L., De Franceschi, G., Romano, V., Aquino, M., Dodson, A., and Mitchell, C. N.: Bipolar climatology of GPS ionospheric scintillation at solar minimum, Radio Sci., 46, RS0D05, https://doi.org/10.1029/2010RS004571, 2011.
André, R., Pinnock, M., and Rodger, A. S.: Identification of the low-altitude cusp by Super Dual Auroral Radar Network radars: A physical explanation for the empirically derived signature, J. Geophys. Res., Vol. 105, 12, https://doi.org/10.1029/2000JA900071, 2000.
Basu, S., Groves, K. M., Basu, S., and Sultan, P. J.: Specification and forecasting of scintillations in communication/navigation links: Current status and future plans, J. Atmos. Sol.-Terr. Phy., 64, 1745–1754, https://doi.org/10.1016/S1364-6826(02)00124-4, 2002.
Belakhovsky, V., Pilipenko, V., Murr, D., Fedorov, E., and Kozlovsky, A.: Modulation of the ionosphere by Pc5 waves observed simultaneously by GPS/TEC and EISCAT, Earth Planets Space, 68., 102, https://doi.org/10.1186/s40623-016-0480-7, 2016.
Belakhovsky, V. B., Pilipenko, V. A., Sakharov, Y. A., Lorentzen, D. L., and Samsonov, S. N.: Geomagnetic and ionospheric response to the interplanetary shock on January 24, 2012, Earth Planets Space, 69, 105, https://doi.org/10.1186/s40623-017-0696-1, 2017.
Belakhovsky, V. B., Jin, Y., and Miloch, W. J.: Influence of Different Ionospheric Disturbances on the GPS Scintillations at High Latitudes, in: Problems of Geocosmos – 2018, edited by: Yanovskaya, T. B., Kosterov, A., Bobrov, N. Y., Divin, A. V., Saraev, A. K., and Zolotova, N. V., Springer Proceedings in Earth and Environmental Sciences, Springer, 281–287, https://doi.org/10.1007/978-3-030-21788-4_24, 2020.
Carrano, C. S., Anghel, A., Quinn, R. A., and Groves, K. M.: Kalman filter estimation of plasmaspheric total electron content using GPS, Radio Sci., 44, RS0A10, https://doi.org/10.1029/2008RS004070, 2009.
Clausen, L. B. N., Moen, J. I., Hosokawa, K., and Holmes, J. M.: GPS scintillations in the high latitudes during periods of dayside and nightside reconnection, J. Geophys. Res., 121, 3293–3309, https://doi.org/10.1002/2015JA022199, 2016.
Crowley, G., Ridley, A. J., Deist, D., Wing, S., Knipp, D. J., Emery, B. A., Foster, J., Heelis, R., Hairston, M., and Reinisch, B. W.: Transformation of high-latitude ionospheric F region patches into blobs during the March 21, 1990, storm, J. Geophys. Res., 105, 5215–5230, https://doi.org/10.1029/1999JA900357, 2000.
De Franceschi, G., Spogli, L., Alfonsi, L., Romano, V., Cesaroni, C., and Hunstad, I.: The ionospheric irregularities climatology over Svalbard from solar cycle 23, Sci. Rep., 9, 1–14, https://doi.org/10.1038/s41598-019-44829-5, 2019.
Forte, B.: Optimum detrending of raw GPS data for scintillation measurements at auroral latitudes, J. Atmos. Sol.-Terr. Phy., 67, 1100–1109, https://doi.org/10.1016/j.jastp.2005.01.011, 2005.
Foster, J. C., Coster, A. J., Erickson, P. J., Holt, J. M., Lind, F. D., Rideout, W., McCready, M., van Eyken, A., Barnes, R. J., Greenwald, R. A., and Rich, F. J.: Multiradar observations of the polar tongue of ionization, J. Geophys. Res., 110, A09S31, https://doi.org/10.1029/2004JA010928, 2005.
Fremouw, E. J., Leadabrand, R. L., Livingston, R. C., Cousins, M. D., Rino, C. L., Fair, B. C., and Long, R. A.: Early results from the DNA wideband satellite experiment — complex-signal scintillation, Radio Sci., 13, 167–187, https://doi.org/10.1029/RS013i001p00167, 1978.
Ghobadi, H., Spogli, L., Alfonsi, L., Cesaroni, C., Cicone, A., Linty, N., Romano, V., and Cafaro, M.: Disentangling ionospheric refraction and diffraction effects in GNSS raw phase through fast iterative filtering technique, GPS Solut., 24, 1–13, https://doi.org/10.1007/s10291-020-01001-1, 2020.
Hosokawa, K., Otsuka, Y., Ogawa, Y., and Tsugawa, T.: Observations of GPS scintillation during an isolated auroral substorm, Progress in Earth and Planetary Science, 1, 16, https://doi.org/10.1186/2197-4284-1-16, 2014.
Jin, Y. and Oksavik, K.: GPS scintillations and losses of signal lock at high latitudes during the 2015 St. Patrick's Day storm, J. Geophys. Res., 123, 7943–7957, https://doi.org/10.1029/2018JA025933, 2018.
Jin, Y., Moen, J., and Miloch, W.: GPS scintillation effects associated with polar cap patches and substorm auroral activity: direct comparison, J. Space Weather Spac., 4, A23, https://doi.org/10.1051/swsc/2014019, 2014.
Jin, Y., Moen, J. I., and Miloch, W. J.: On the collocation of the cusp aurora and the GPS phase scintillation: A statistical study, J. Geophys. Res., 120, 9176–9191, https://doi.org/10.1002/2015JA021449, 2015.
Jin, Y., Moen, J. I., Miloch, W. J., Clausen, L. B. N., and Oksavik, K.: Statistical study of the GNSS phase scintillation associated with two types of auroral blobs, J. Geophys. Res., 121, 4679–4697, https://doi.org/10.1002/2016JA022613, 2016.
Jin, Y., Moen, J. I., Oksavik, K., Spicher, A., Clausen, L. B. N., and Miloch, W. J.: GPS scintillations associated with cusp dynamics and polar cap patches, J. Space Weather Spac., 7, A23. https://doi.org/10.1051/swsc/2017022, 2017.
Kim, H., Clauer, C. R., Deshpande, K., Lessard, M. R., Weatherwax, A. T., Bust, G. S., Crowley, G., and Humphreys, T. E.: Ionospheric irregularities during a substorm event: Observations of ULF pulsations and GPS scintillations, J. Atmos. Sol.-Terr. Phy., 114, 1–8, https://doi.org/10.1016/j.jastp.2014.03.006, 2014.
Kinrade, J., Mitchell, C. N., Smith, N. D., Ebihara, Y., Weatherwax, A. T., and Bust, G. S.: GPS phase scintillation associated with optical auroral emissions: First statistical results from the geographic South Pole, J. Geophys. Res., 118, 2490–2502, https://doi.org/10.1002/jgra.50214, 2013.
Kintner, P. M., Ledvina, B. M., and De Paula, E. R.: GPS and ionospheric scintillations, Space Weather, 5, S09003, https://doi.org/10.1029/2006SW000260, 2007.
Lockwood, M. and Carlson Jr., H. C.: Production of polar cap electron density patches by transient magnetopause reconnection, Geophys. Res. Lett., 19, 1731–1734, https://doi.org/10.1029/92GL01993, 1992.
Lorentzen, D. A., Moen, J., Oksavik, K., Sigernes, F., Saito, Y., and Johnsen, M. G.: In situ measurement of a newly created polar cap patch, J. Geophys. Res., 115, A12323, https://doi.org/10.1029/2010JA015710, 2010.
Moen, J., Oksavik, K., Alfonsi, L., Daabakk, Y., Romano, V., and Spogli, L.: Space weather challenges of the polar cap ionosphere, J. Space Weather Spac., 3, A02, https://doi.org/10.1051/swsc/2013025, 2013.
Mushini, S. C., Jayachandran, P. T., Langley, R. B., MacDougall, J. W., and Pokhotelov, D.: Improved amplitudeand phase-scintillation indices derived from wavelet detrended high-latitude GPS data, GPS Solut., 16, 363–373, https://doi.org/10.1007/s10291-011-0238-4, 2012.
Oksavik, K., Moen, J., Lester, M., Bekkeng, T. A., and Bekkeng, J. K.: In situ measurements of plasma irregularity growth in the cusp ionosphere, J. Geophys. Res., 117, A11301, https://doi.org/10.1029/2012JA017835, 2012.
Oksavik, K., Van der Meeren, C., Lorentzen, D. A., Baddeley, L. J., and Moen, J.: Scintillation and loss of signal lock from poleward moving auroral forms in the cusp ionosphere, J. Geophys. Res., 120, 9161–9175, https://doi.org/10.1002/2015JA021528, 2015.
Pilipenko, V., Belakhovsky, V., Engebretson, M. J., Kozlovsky, A., and Yeoman, T.: Are dayside long-period pulsations related to the cusp?, Ann. Geophys., 33, 395–404, https://doi.org/10.5194/angeo-33-395-2015, 2015.
Prikryl, P., Jayachandran, P. T., Mushini, S. C., Pokhotelov, D., MacDougall, J. W., Donovan, E., Spanswick, E., and St.-Maurice, J.-P.: GPS TEC, scintillation and cycle slips observed at high latitudes during solar minimum, Ann. Geophys., 28, 1307–1316, https://doi.org/10.5194/angeo-28-1307-2010, 2010.
Prikryl, P., Jayachandran, P. T., Mushini, S. C., and Chadwick, R.: Climatology of GPS phase scintillation and HF radar backscatter for the high-latitude ionosphere under solar minimum conditions, Ann. Geophys., 29, 377–392, https://doi.org/10.5194/angeo-29-377-2011, 2011.
Rostoker, G., Akasofu, S.-I., Foster, J., Greenwald, R., Kamide, Y., Kawasaki, K., Lui, A., McPherron, R., and Russel, C.: Magnetospheric substorms-definition and signatures, J. Geophys. Res., 85, 1663–1668, https://doi.org/10.1029/JA085iA04p01663, 1980.
Smith, A. M., Mitchell, C. N., Watson, R. J., Meggs, R. W., Kintner, P. M., Kauristie, K., and Honary, F.: GPS scintillation in the high arctic associated with an auroral arc, Space Weather, 6, s03d01, https://doi.org/10.1029/2007SW000349, 2008.
Spogli, L., Ghobadi, H., Cicone, A., Alfonsi, L., Cesaroni, C., Linty, N., Romano, V., and Cafaro, M.: Adaptive Phase Detrending for GNSS Scintillation Detection: A Case Study Over Antarctica, IEEE Geosci. Remote S., p. 5, https://doi.org/10.1109/LGRS.2021.3067727, 2021.
Van der Meeren, C., Oksavik, K., Lorentzen, D., Moen, J. I., and Romano, V.: GPS scintillation and irregularities at the front of an ionization tongue in the nightside polar ionosphere, J. Geophys. Res., 119, 8624–8636, https://doi.org/10.1002/2014JA020114, 2014.
Van der Meeren, C., Oksavik, K., Lorentzen, D. A., Paxton, L. J., and Clausen, L. B. N.: Scintillation and irregularities from the nightside part of a Sun-aligned polar cap arc, J. Geophys. Res., 121, 5723–5736, https://doi.org/10.1002/2016JA022708, 2016.
Van Dierendonck, A. J., Klobuchar, J., and Hua, Q.: Ionospheric Scintillation Monitoring Using Commercial Single Frequency C/A Code Receivers, Paper presented at Proceedings of the 6th International Technical Meeting of the Satellite Division of The Institute of Navigation (ION GPS 1993), Salt Lake City, UT, September 22–24, 1333–1342, 1993.
Zhang, Q.-H., Zhang, B.-C., Moen, J., Lockwood, M., McCrea, I. W., Yang, H.-G., Hu, H.-Q., Liu, R.-Y., Zhang, S.-R., and Lester, M.: Polar cap patch segmentation of the tongue of ionization in the morning convection cell, Geophys. Res. Lett., 40, 2918–2922, https://doi.org/10.1002/grl.50616, 2013.
Zhou, X.-Y., Strangeway, R. J., Anderson, P. C., Sibeck, D. G., Tsurutani, B. T., Haerendel, G., Frey, H. U., and Arballo, J. K.: Shock aurora: FAST and DMSP observation, J. Geophys. Res., 108, 8019, https://doi.org/10.1029/2002JA009701, 2003.