the Creative Commons Attribution 4.0 License.
the Creative Commons Attribution 4.0 License.
 | 22 Jul 2020
Evaluation of possible corrosion enhancement due to telluric currents: case study of the Bolivia–Brazil pipeline
Joyrles Fernandes de Moraes
Igo Paulino
Lívia R. Alves
Clezio Marcos Denardini
The electric field induced in the Bolivia–Brazil gas pipeline (GASBOL) was calculated by using the distributed source line transmission (DSLT) theory during several space weather events. We used geomagnetic data collected by a fluxgate magnetometer located at São José dos Campos (23.2∘ S, 45.9∘ W). The total corrosion rate was calculated by using the Gummow (2002) methodology and was based on the assumption of a 1 cm hole in the coating of the pipeline. The calculations were performed at the ends of pipeline where the largest “out-of-phase” pipe-to-soil potential (PSP) variations were obtained. The variations in PSP during the 17 March 2015 geomagnetic storm have led to the greatest corrosion rate of the analyzed events. All the space weather events evaluated with high terminating impedance may have contributed to increases in the corrosion process. The applied technique can be used to evaluate the corrosion rate due to the high telluric activity associated with the geomagnetic storms at specific locations.
- Article
(2590 KB) - Full-text XML
- BibTeX
- EndNote


Telluric electric currents that flow within the Earth or on its surface are significantly enhanced during disturbances of the Earth's magnetic field (geomagnetic storms). These currents can propagate through conducting systems on the Earth's surface such as pipelines (Campbell, 1980; e.g., the Trans Alaska Pipeline System), phone cables (Anderson et al., 1974), and electric power systems (Lanzerotti et al., 1999) that can produce blackouts in extreme events (Guillon et al., 2016).
The propagation of the geomagnetically induced currents (GICs) throughout the pipelines can change the pipe-to-soil potential (PSP), which in turn changes the electrochemical environment on the pipelines' surface and can cause a corrosion process. In cathodically protected pipelines, the PSP is maintained at a negative potential of at least −850 mV. Fluctuations in PSP caused by GICs can lead to the potential being beyond −850 mV, which results in corrosion (Seager, 1991). According to Place and Sneath (2001), PSP fluctuations also interfere with pipeline surveys.
Previous works on GICs were done in high latitudes and revealed specific interactions between the disturbances in the solar wind and the geomagnetic field (Campbell, 1980; Fernberg et al., 2007). The effects of GICs in pipelines have also been observed and published in Argentina (Osella et al., 1998), Australia (Marshall et al., 2010), and New Zealand (Ingham and Rodger, 2018) where engineers tried to find ways of dealing with the problem.
Boteler and Cookson (1986) showed that the telluric voltage induced on pipelines can be calculated by using distributed source transmission line (DSTL) equations, and the telluric effects in the pipeline are not only influenced by space weather events but also depend on the Earth's conductivity, the pipelines' electromagnetic properties, and the geometric parameters. These calculations, when applied to modern, well-coated pipelines, suggest that the effects of the telluric current may not be as innocuous as originally thought – especially for long pipelines located in high latitudes (Gummow, 2002). The DSTL theory was first described in Schelkunoff (1943) and has been used in several studies (Pulkkinen et al., 2001).
In this paper, the model proposed by Trichtchenko and Boteler (2002) for the induced effects in pipelines, which uses the DSTL theory, is used to compute the corrosion rates in the Bolivia–Brazil gas pipeline (GASBOL) during specific space weather events and focuses on the 17 March 2015 geomagnetic storm. The GASBOL is the largest pipeline in Latin America, with a total extension of 3159 km between Rio Grande, Bolivia, and Canoas, Brazil. The pipeline route runs through 557 km to the Brazilian border. It is the main mode of gas transportation in the Brazilian territory. The GASBOL is buried about 0.5 m under the ground to ensure its integrity.
2.1 Magnetometer
The Earth's magnetic field and its variations are recorded at geomagnetic observatories and stations all over the globe. In this paper, we have used magnetic measurements from the São José dos Campos (23.2∘ S, 45.9∘ W) station to study the corrosion produced by GICs in the first GASBOL route from Rio Grande (17.8∘ S, 63.1∘ W) to Paulinia (22.8∘ S, 47.1∘ W), which is 1814 km long. The locations of the GASBOL route being studied and the magnetic station are shown in Fig. 1 (the red line represents the geomagnetic equator).

Figure 1Bolivia–Brazil gas pipeline route (solid line), bends (diamonds), and São José dos Campos (23.2∘ S, 45.9∘ W) magnetic observatory (star). The red line represents the geomagnetic equator. The route length is 1814 km. The pipeline route runs through 557 km to the Brazilian border. The pipeline starts in Bolivia and is represented by “×”.
We chose eight events to study the effects of space weather with different intensities. The events were chosen based on the disturbed storm time index (Dst) shown in Table 1.

The São José dos Campos magnetic station is part of the Estudo e Monitoramento Brasileiro de Clima Espacial (Embrace) Magnetometer Network (MagNet, collectively Embrace MagNet). The Embrace MagNet covers most of the eastern South American longitudinal sector (Denardini et al., 2015). This network fills the gap for this sector with magnetic measurements available online, and aims to provide magnetic data for studying changes in space weather. All the details of the magnetic network, type of magnetometers, data resolution, data quality control, and data availability have been published elsewhere (Denardini et al., 2018).
2.2 Electric field
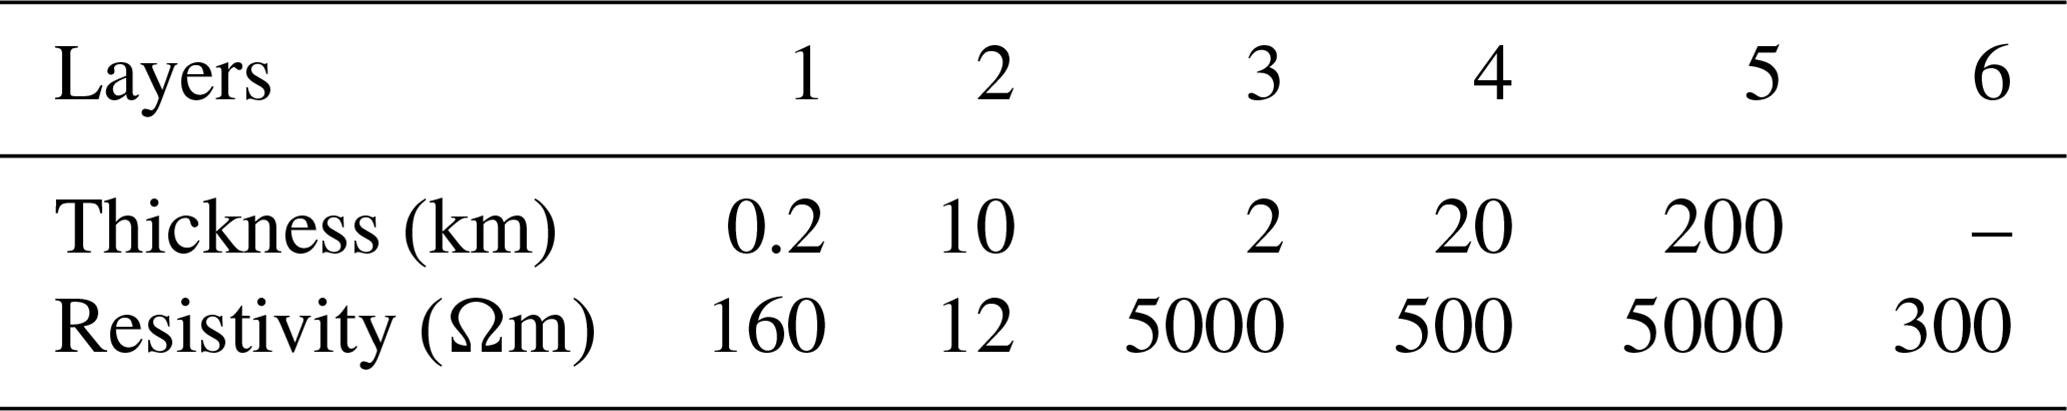
The electric fields produced by geomagnetic disturbances drive electric currents into the Earth. These currents are responsible for fluctuations in PSP. According to Trichtchenko and Boteler (2002), GICs have the effect of shielding the interior of the Earth from the geomagnetic disturbances. As the magnetic and electric fields are dependent on the conductivity structure of the Earth, the variation in the conductivity with depth was modeled by using multiple horizontal layers with a different uniform conductivity. The Earth model layers used in this paper are shown in Table 2 and were obtained at São José dos Campos from previous geophysical surveys and those published by Padilha et al. (1991).
The electric field on the surface can be obtained by using the following equation:
where H is the magnetic field component obtained from the magnetometer, and z is the surface impedance obtained by applying the recursion relation for the impedances at the multiple horizontal layers (Trichtchenko and Boteler, 2002). In our case, we are considering z as a scalar; hence, the Esurface is orthogonal to Hsurface.
2.3 DSTL theory
The electric response of a pipeline can be modeled by the DSTL equations. In the DSTL approach, each uniform section of the pipeline is represented by a transmission line circuit element with a specific series impedance and a parallel admittance. The voltage in any section of the pipeline can be calculated by applying the following Trichtchenko and Boteler (2002) equation:
where Ep is the electric field induced in the pipe, x1 and x2 are the positions of the ends of the pipeline, and γ is the propagation constant along the pipeline. This is defined as , where is the parallel admittance, and is the series impedance per unit length. Furthermore, G is the conductance to ground, C is the capacitance, R is the resistance of pipeline steel, and L is the inductance.
Equation (2) is a solution to a partial differential equation; thus Ap and Bp are constants dependent on the boundary conditions at the ends of the pipeline. According to Trichtchenko and Boteler (2002), the pipeline is independent of frequency and, for that reason, C and L were not necessary for applying the theory. Using the same argument, we can consider that Ep=Esurface.
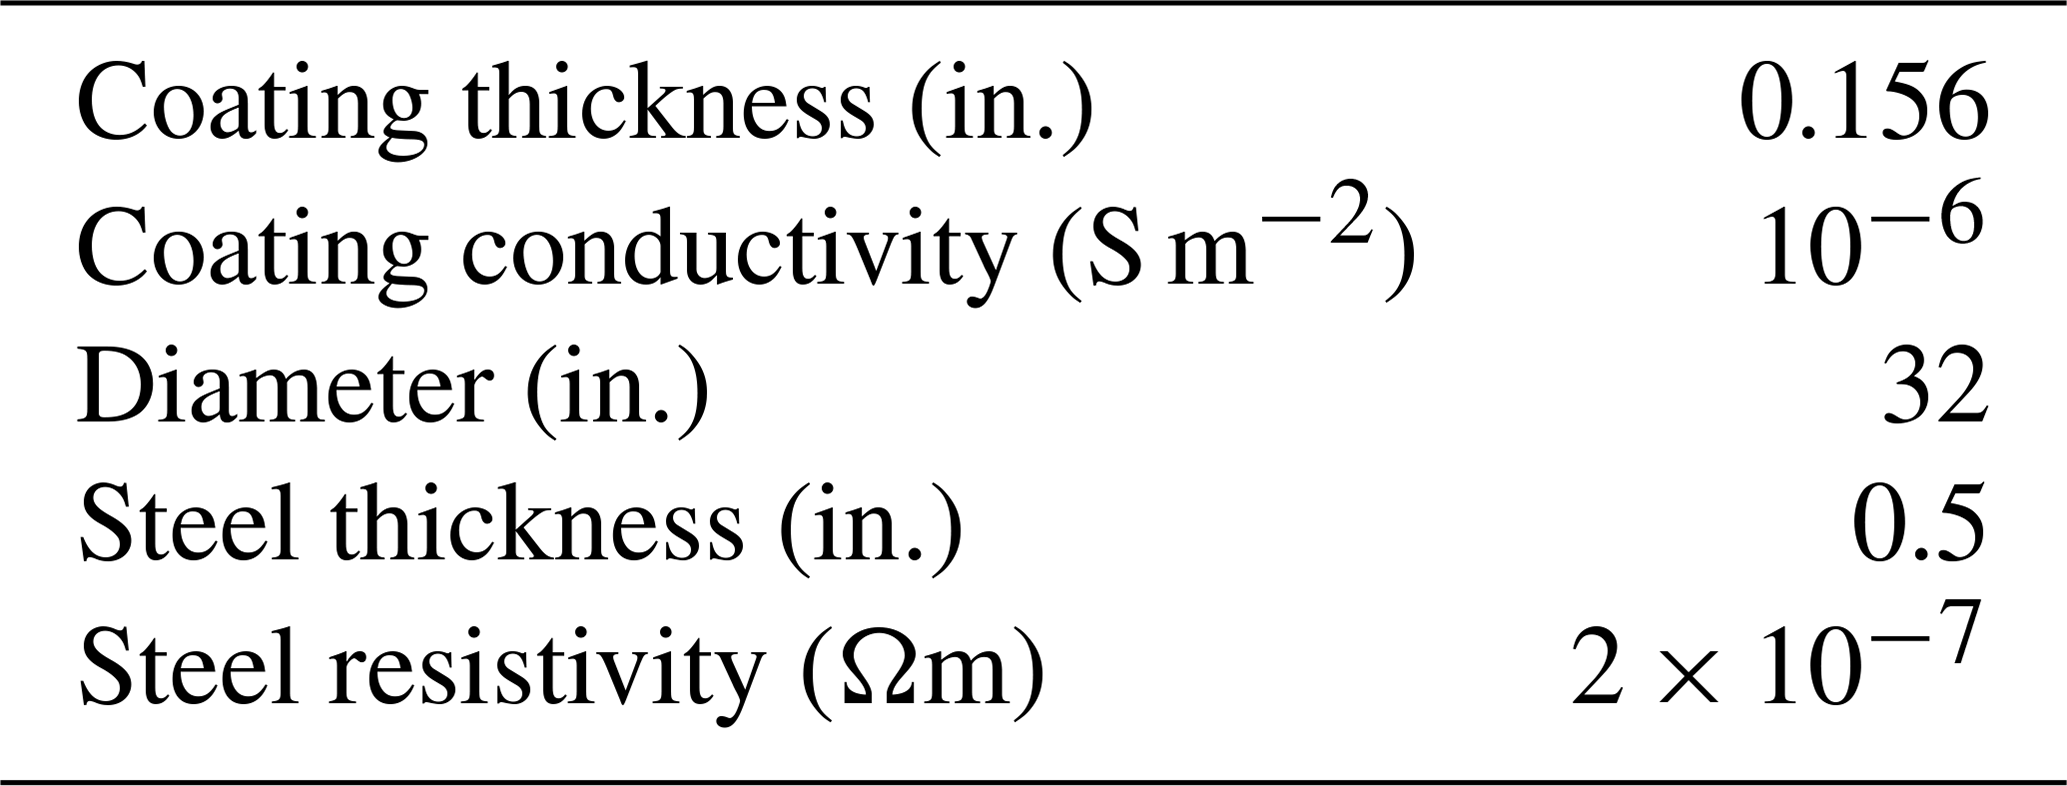
According to Trichtchenko and Boteler (2002), 0.1 Ω represents a low-resistance connection to the ground and 1000 Ω is no ground connection. Since the termination impedances are unknown in our case, we considered five terminating impedances (0.1, 1, 10, 100, and 1000 Ω). The circuit characteristics of GASBOL were obtained from the company website and material manufacturers for the pipeline industry as shown in Table 3.
2.4 Corrosion rate estimation
Gummow (2002) suggested a general expression to estimate the corrosion rate (in mm yr−1) through a 1 cm diameter hole in the pipeline coating as follows:
where V is the change in PSP, F(p) is the percentage of direct corrosion current due to an alternating current in a given period, and F(t) is the fraction of time for which the pipe was unprotected, which depends on the geomagnetic activity. Gummow (2002) referenced 0.025 mm yr−1 as the generally acceptable maximum value for the corrosion rate (CR) in a pipeline. In this paper, the CR was only computed for cases in which the cathodic protection level was greater than −850 mV.
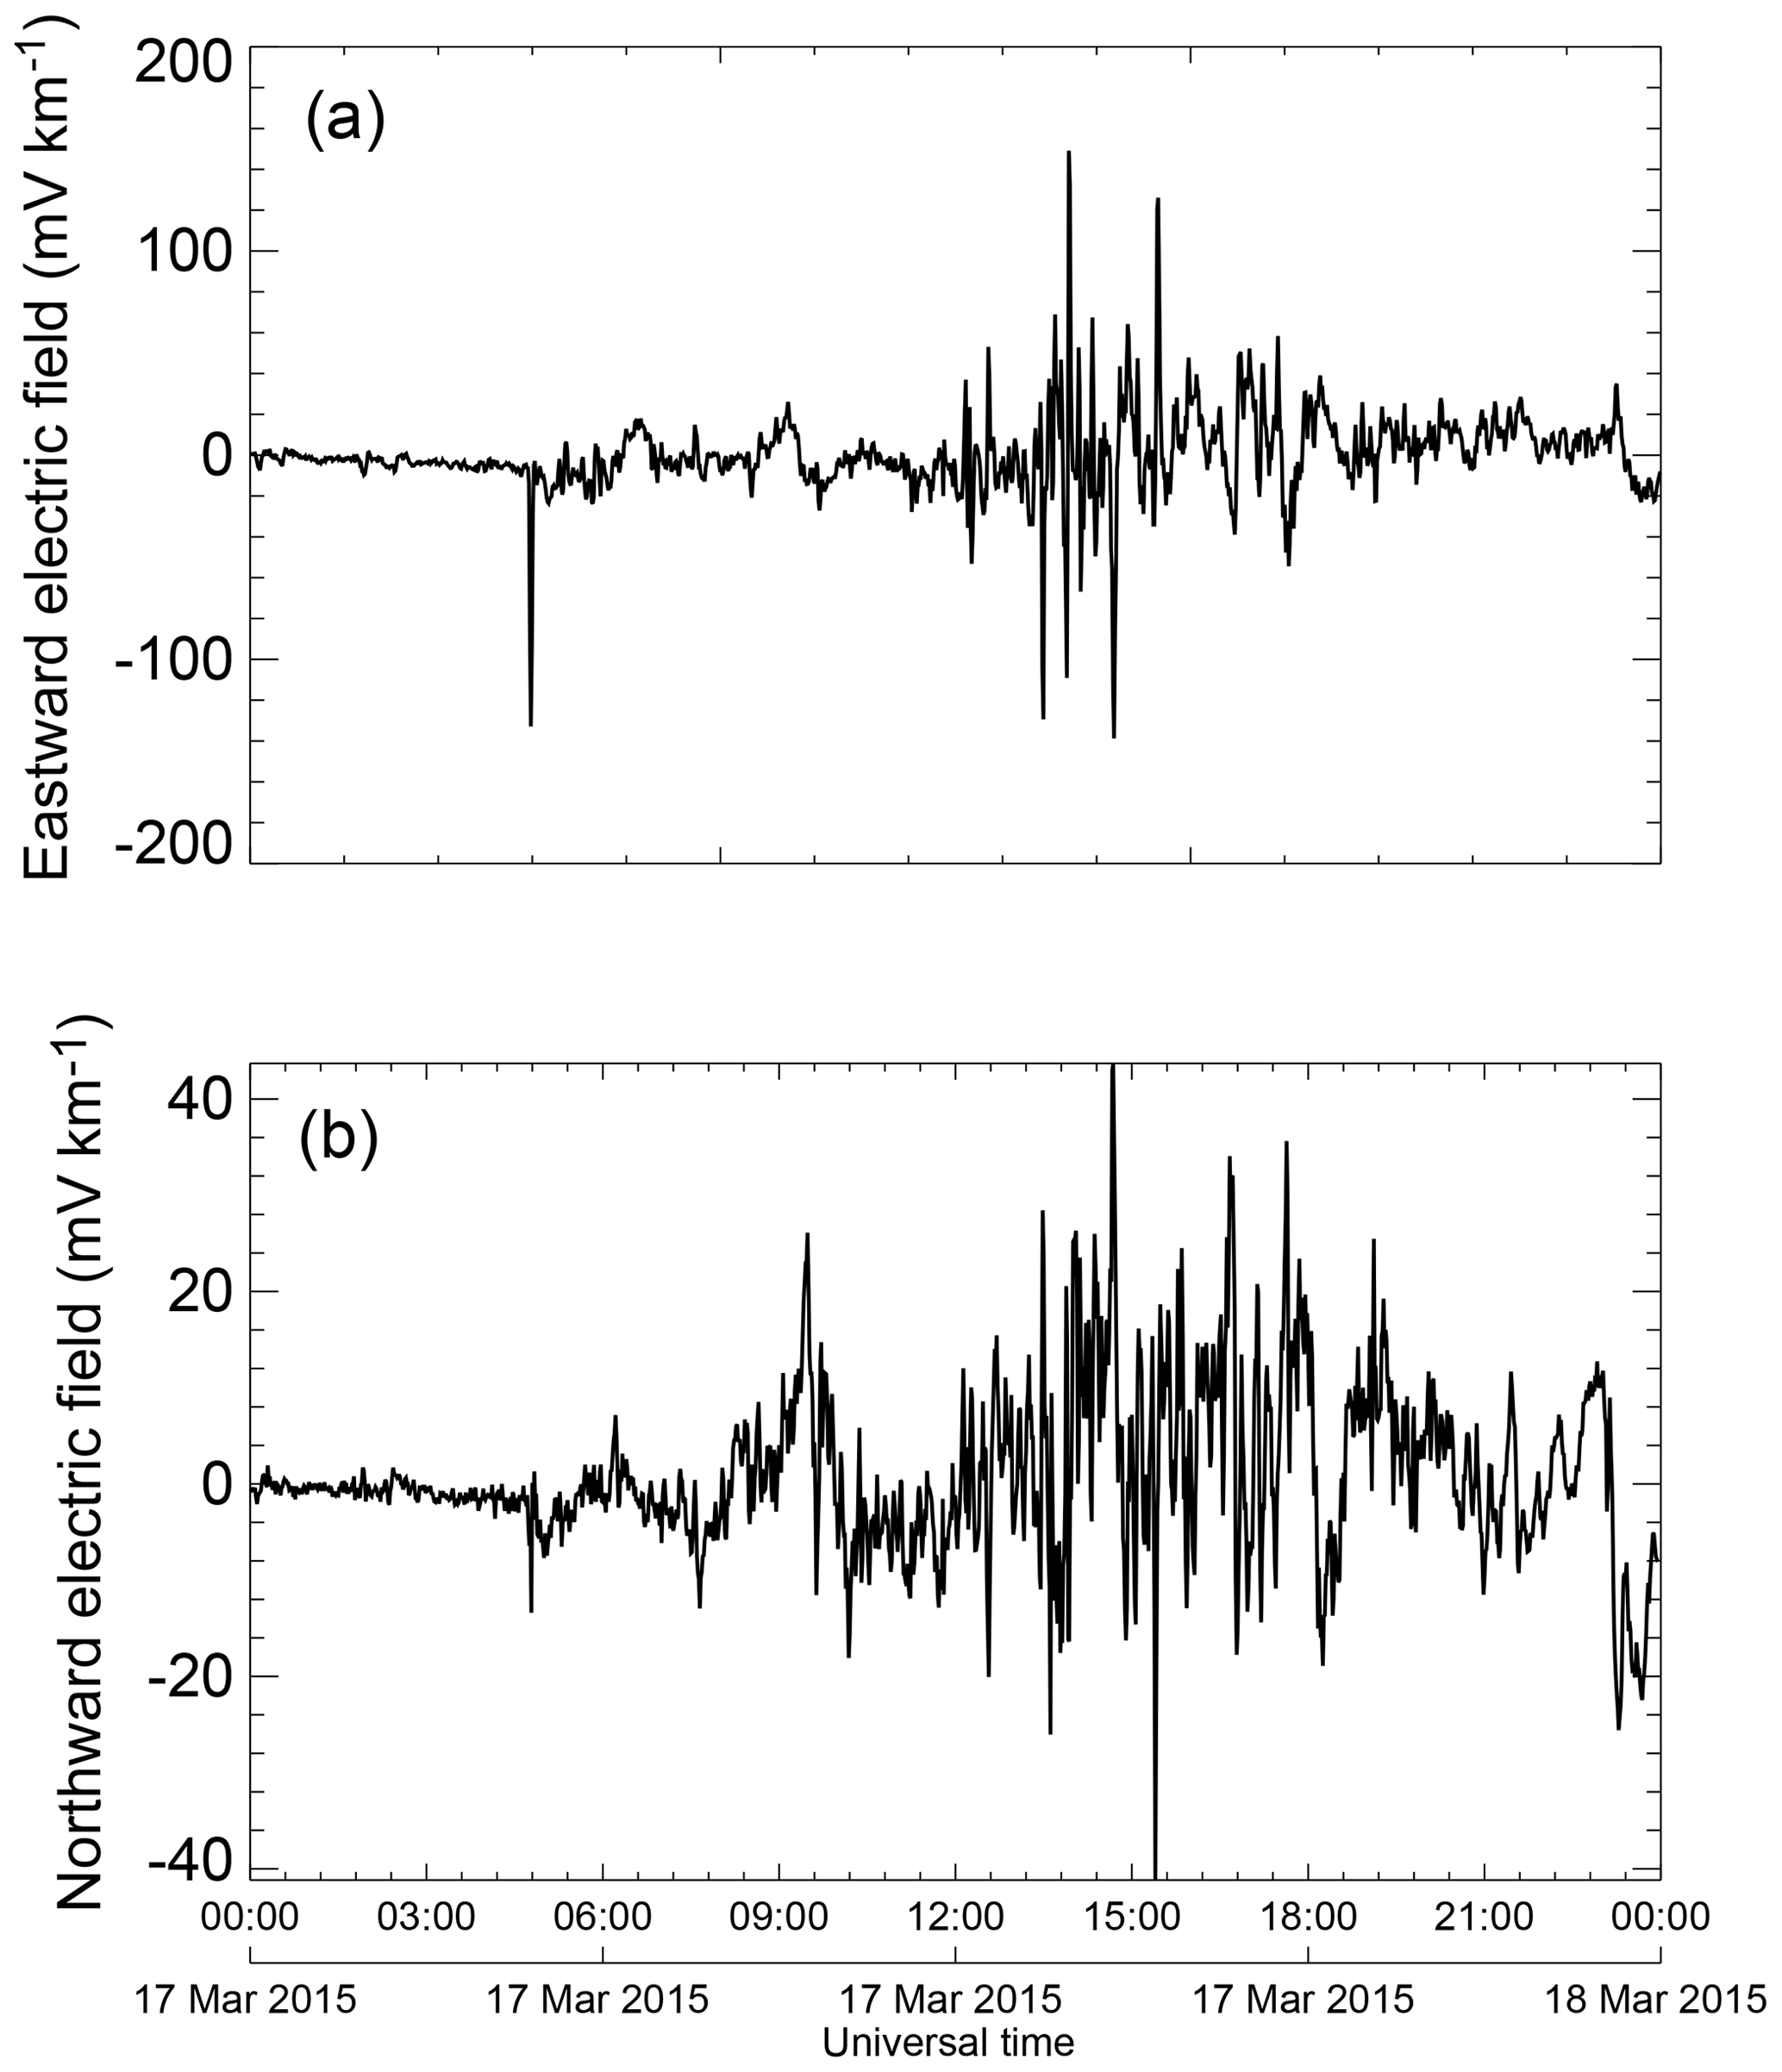
Figure 2Data of the eastward (a) and northward (b) electric field during the 17 March 2015 geomagnetic storm.
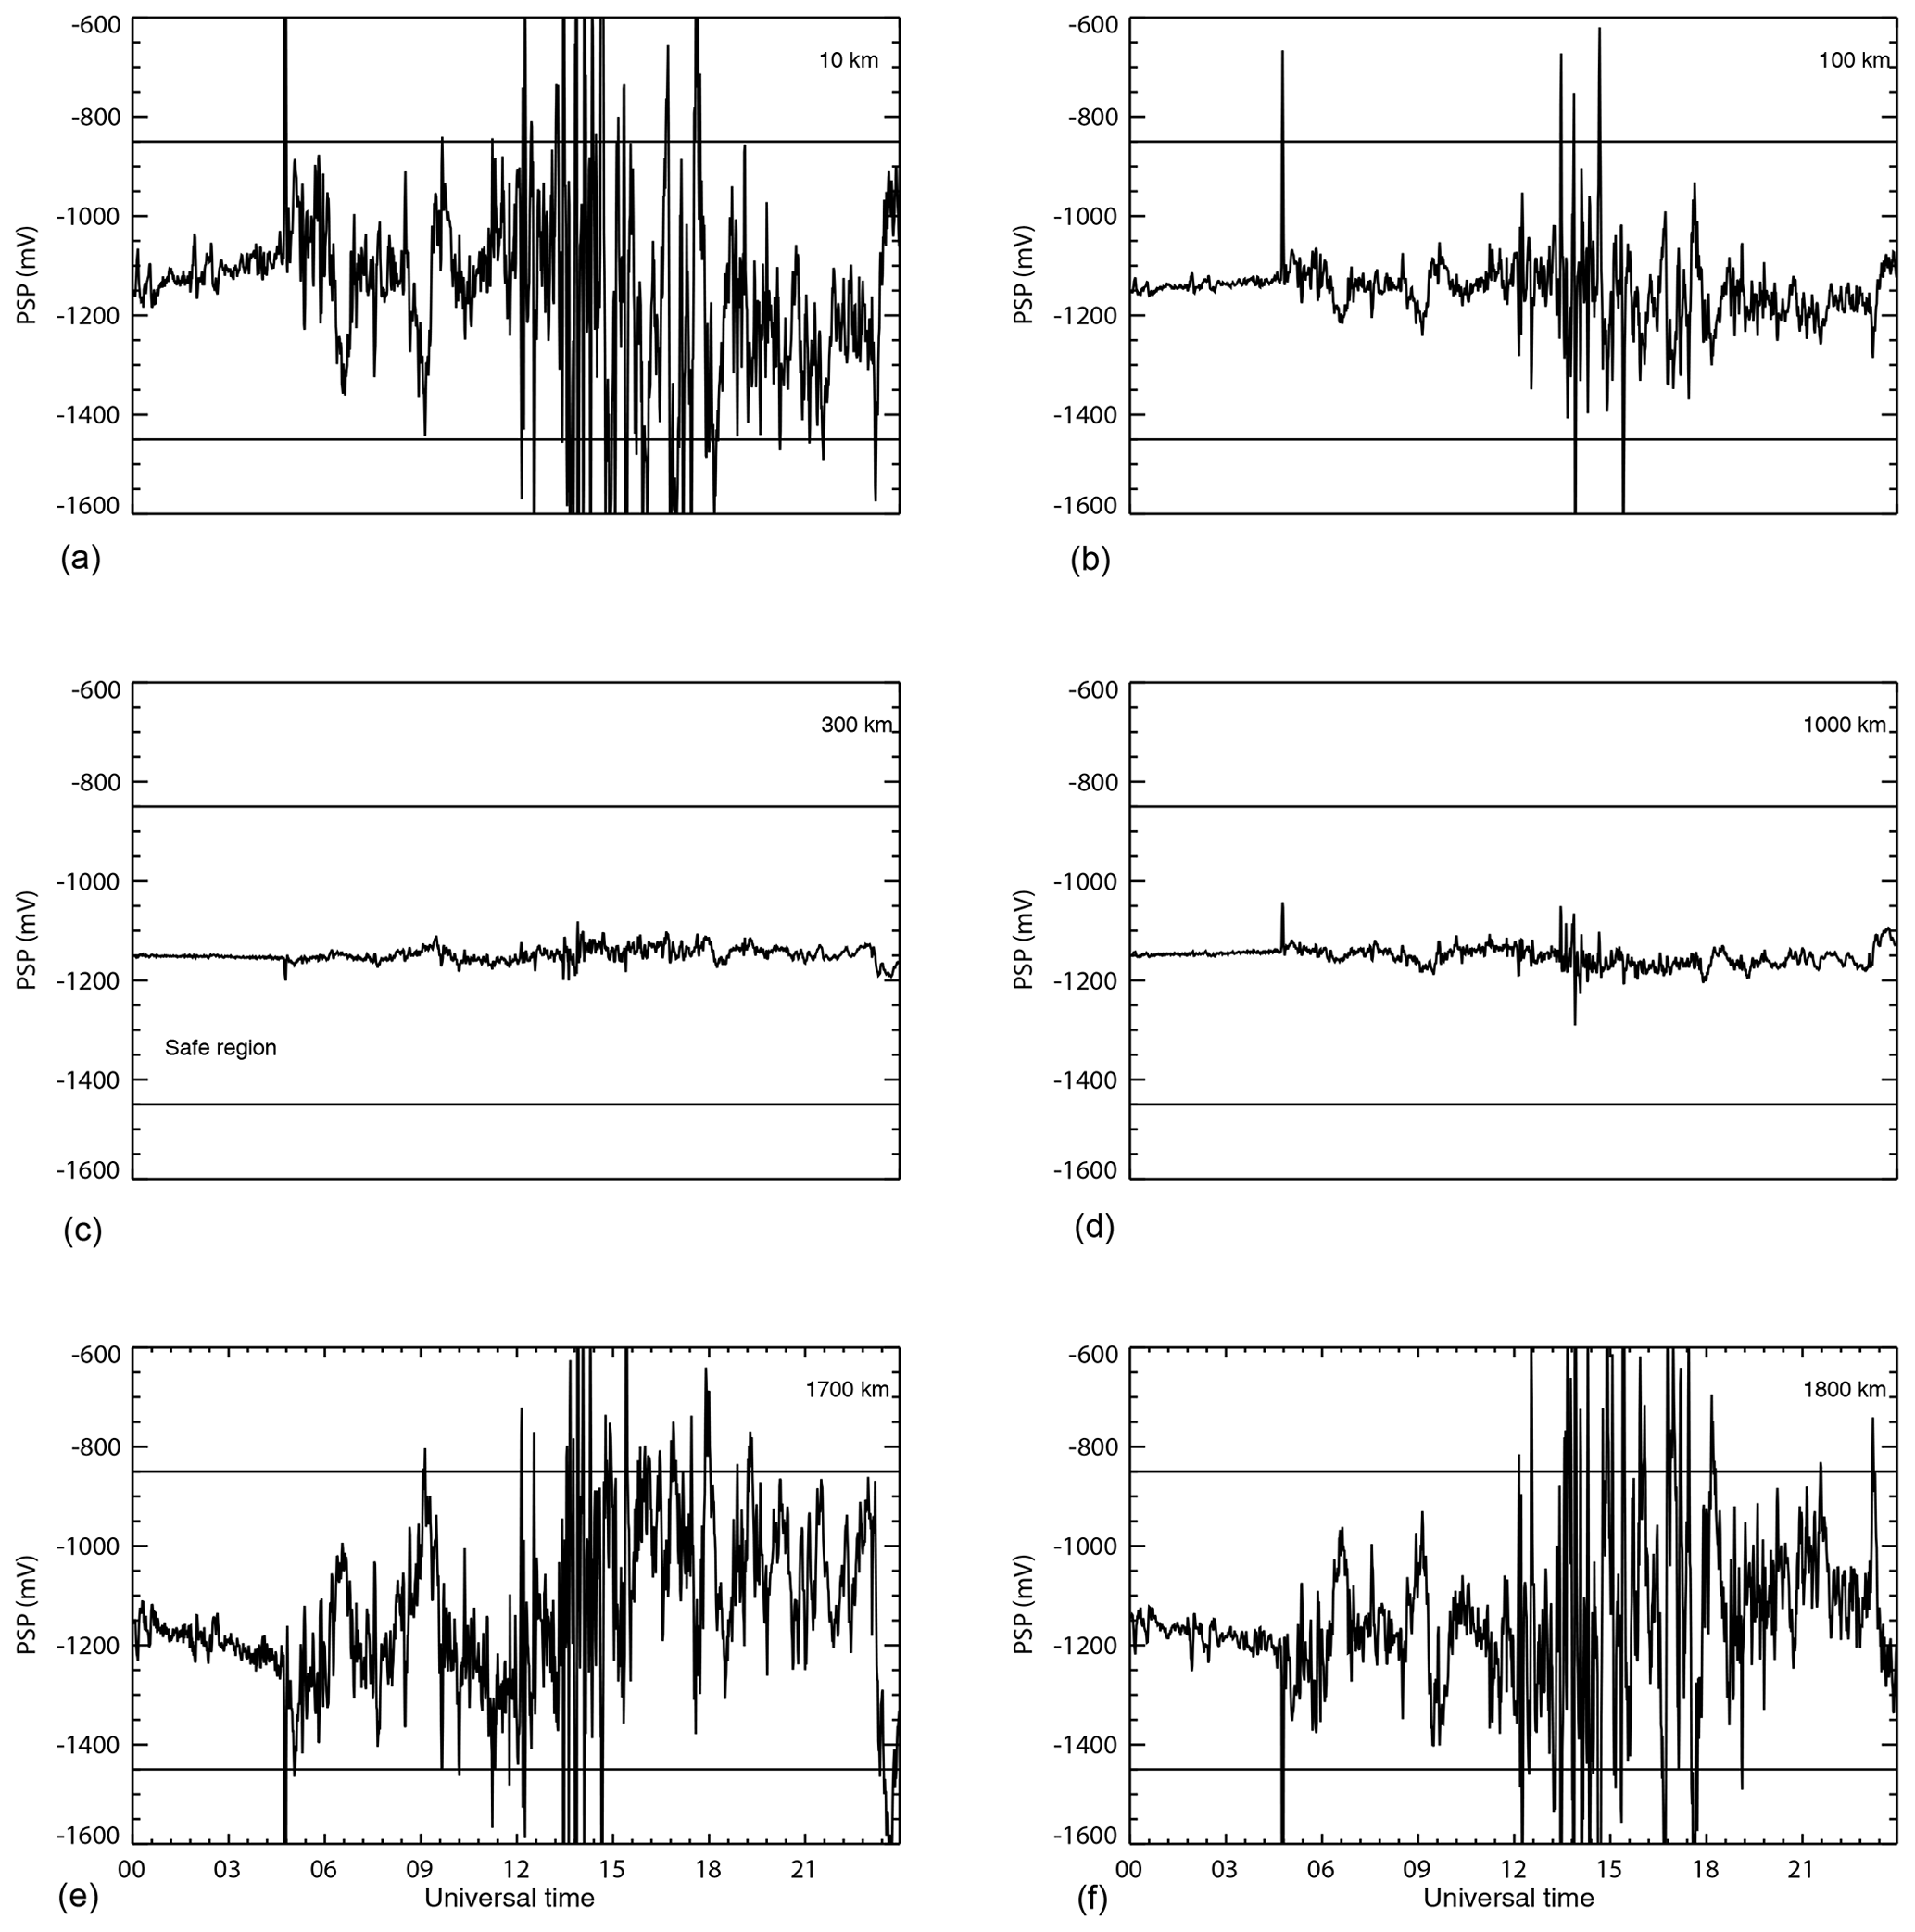
Figure 3Pipe-to-soil potential (PSP) obtained by DSLT theory for different sites (values in km at the top right of each panel) along the GASBOL pipeline for a terminating impedance of 0.1 Ω during the 17 March 2015 geomagnetic storm. Solid lines delimit the safe range of the GASBOL operation. The pipeline route has a total extension of 1814 km and runs through 557 km to the Brazilian border.
Figure 2 shows the electric field obtained during the 17 March 2015 geomagnetic storm. The electric field was obtained by using Eq. (1). The eastward electric field was greater than 0.15 V km−1, and the northward electric field reached 0.05 V km−1. These peaks were observed during the main stage of the geomagnetic storm. The larger values occur in the eastern component because the variation in a geomagnetic component leads to a change in the electrical component in a perpendicular direction. For this event, the magnetic component By (northerly direction) presented the greatest values.
The geomagnetic field variation rate is a function of the latitude, where the measurements are made, and the ionospheric current system, which can affect the amplitudes of the variations. According to Trivedi et al. (2005) large amplitudes of the magnetic horizontal component can be caused by the increase in electron precipitation in the South Atlantic Magnetic Anomaly (SAMA) region, which is present in the southern part of Brazil. The SAMA is a region with a low geomagnetic field intensity; therefore, it is a major point of entry for high-energy particles (Heirtzler, 2002). This region also coincides with a region in space that has an intensive radiation presence that comes from particles that were trapped in Earth's inner Van Allen radiation belt. According to Paulikas (1975), ionospheric ionization is produced in the E layer when energetic particles come closest to the Earth's surface and interact with the dense atmosphere. This procedure increases the ionospheric conductivity, which leads to the rise in the GICs intensity during disturbed periods.

Figure 4Pipe-to-soil potential obtained by DSLT theory for different sites (values in km at the top right of each panel) along the GASBOL pipeline for a terminating impedance of 1000 Ω during the 17 March 2015 geomagnetic storm. Solid lines delimit the safe range of the GASBOL operation.
Variations in the magnetic field that cause changes in the electric field create GICs, which are responsible for PSP fluctuations. The PSP was computed for each point on the GASBOL by using Eq. (2). Figure 3 shows the PSP at different sites on the pipeline that have a low terminating impedance (0.1 Ω). This site represents a position on the pipeline that begins at x=0 km, which is on the Bolivian side, and ends at x=1814 km, which represents the total extension of the first route of the pipeline. Figure 4 also contains the PSP at different sites with a high terminating impedance (1000 Ω). The solid lines are the safe operating region of the pipeline (−0.85 and −1.45 V).
It is possible to observe that in both cases the largest variations in PSP are relative to the largest variations in the electric field that occurred during the main stage of the 17 March 2015 geomagnetic storm. The PSP with low terminating impedance was out of the safe region, which was mainly when the pipe was considered to have high terminating impedance. The terminating impedances are responsible for allowing the entry of GICs into the pipe, and the high terminating impedance is relative to the pipe's connection to the ground.
Figures 3 and 4 show that the largest PSP fluctuations were at the ends of the pipe. This result is confirmed in Fig. 5, which is a profile of the PSP as a function of the length of the pipe at 13:00 UT on 17 March 2015. This result confirms the mathematical theory described by Boteler and Seager (1998). According to those authors, it produces a movement of an electrical charge away from one end of the pipeline and a buildup of charge at the other end, which results in the S-shaped potential profile. From the beginning of the pipe to the point at 250 km, the negative variation in the potential of the pipe with respect to the ground causes a current to flow into the pipe. Meanwhile, at about 1600 km on the other side, the positive variation potential causes the current to leave the pipe.

Figure 5Pipe-to-soil potential profile as a function of the distance along the pipeline at 13:00 UT on 17 March 2015.
Figures 6 and 7 also show the corrosion rates in GASBOL as a function of the terminating impedances for eight space weather events in 2015. The corrosion rate was estimated by using Eq. (3). The events were set by the intense geomagnetic activity and by using the Dst index. Figure 6 is related to the loss of material during strong (Dst) and moderate () geomagnetic storms. Figure 7 shows the weak storms (Dst) and quiet days. The markers in Figs. 6 and 7 are related to the different events for each level of storm intensity. The acceptable limit of the corrosion rate, as referenced by Gummow (2002), is 0.025 mm yr−1.

Figure 6Corrosion rate as a function of the terminating impedances for strong (a) and moderate (b) geomagnetic storms. The acceptable limit of corrosion is indicated in (a).
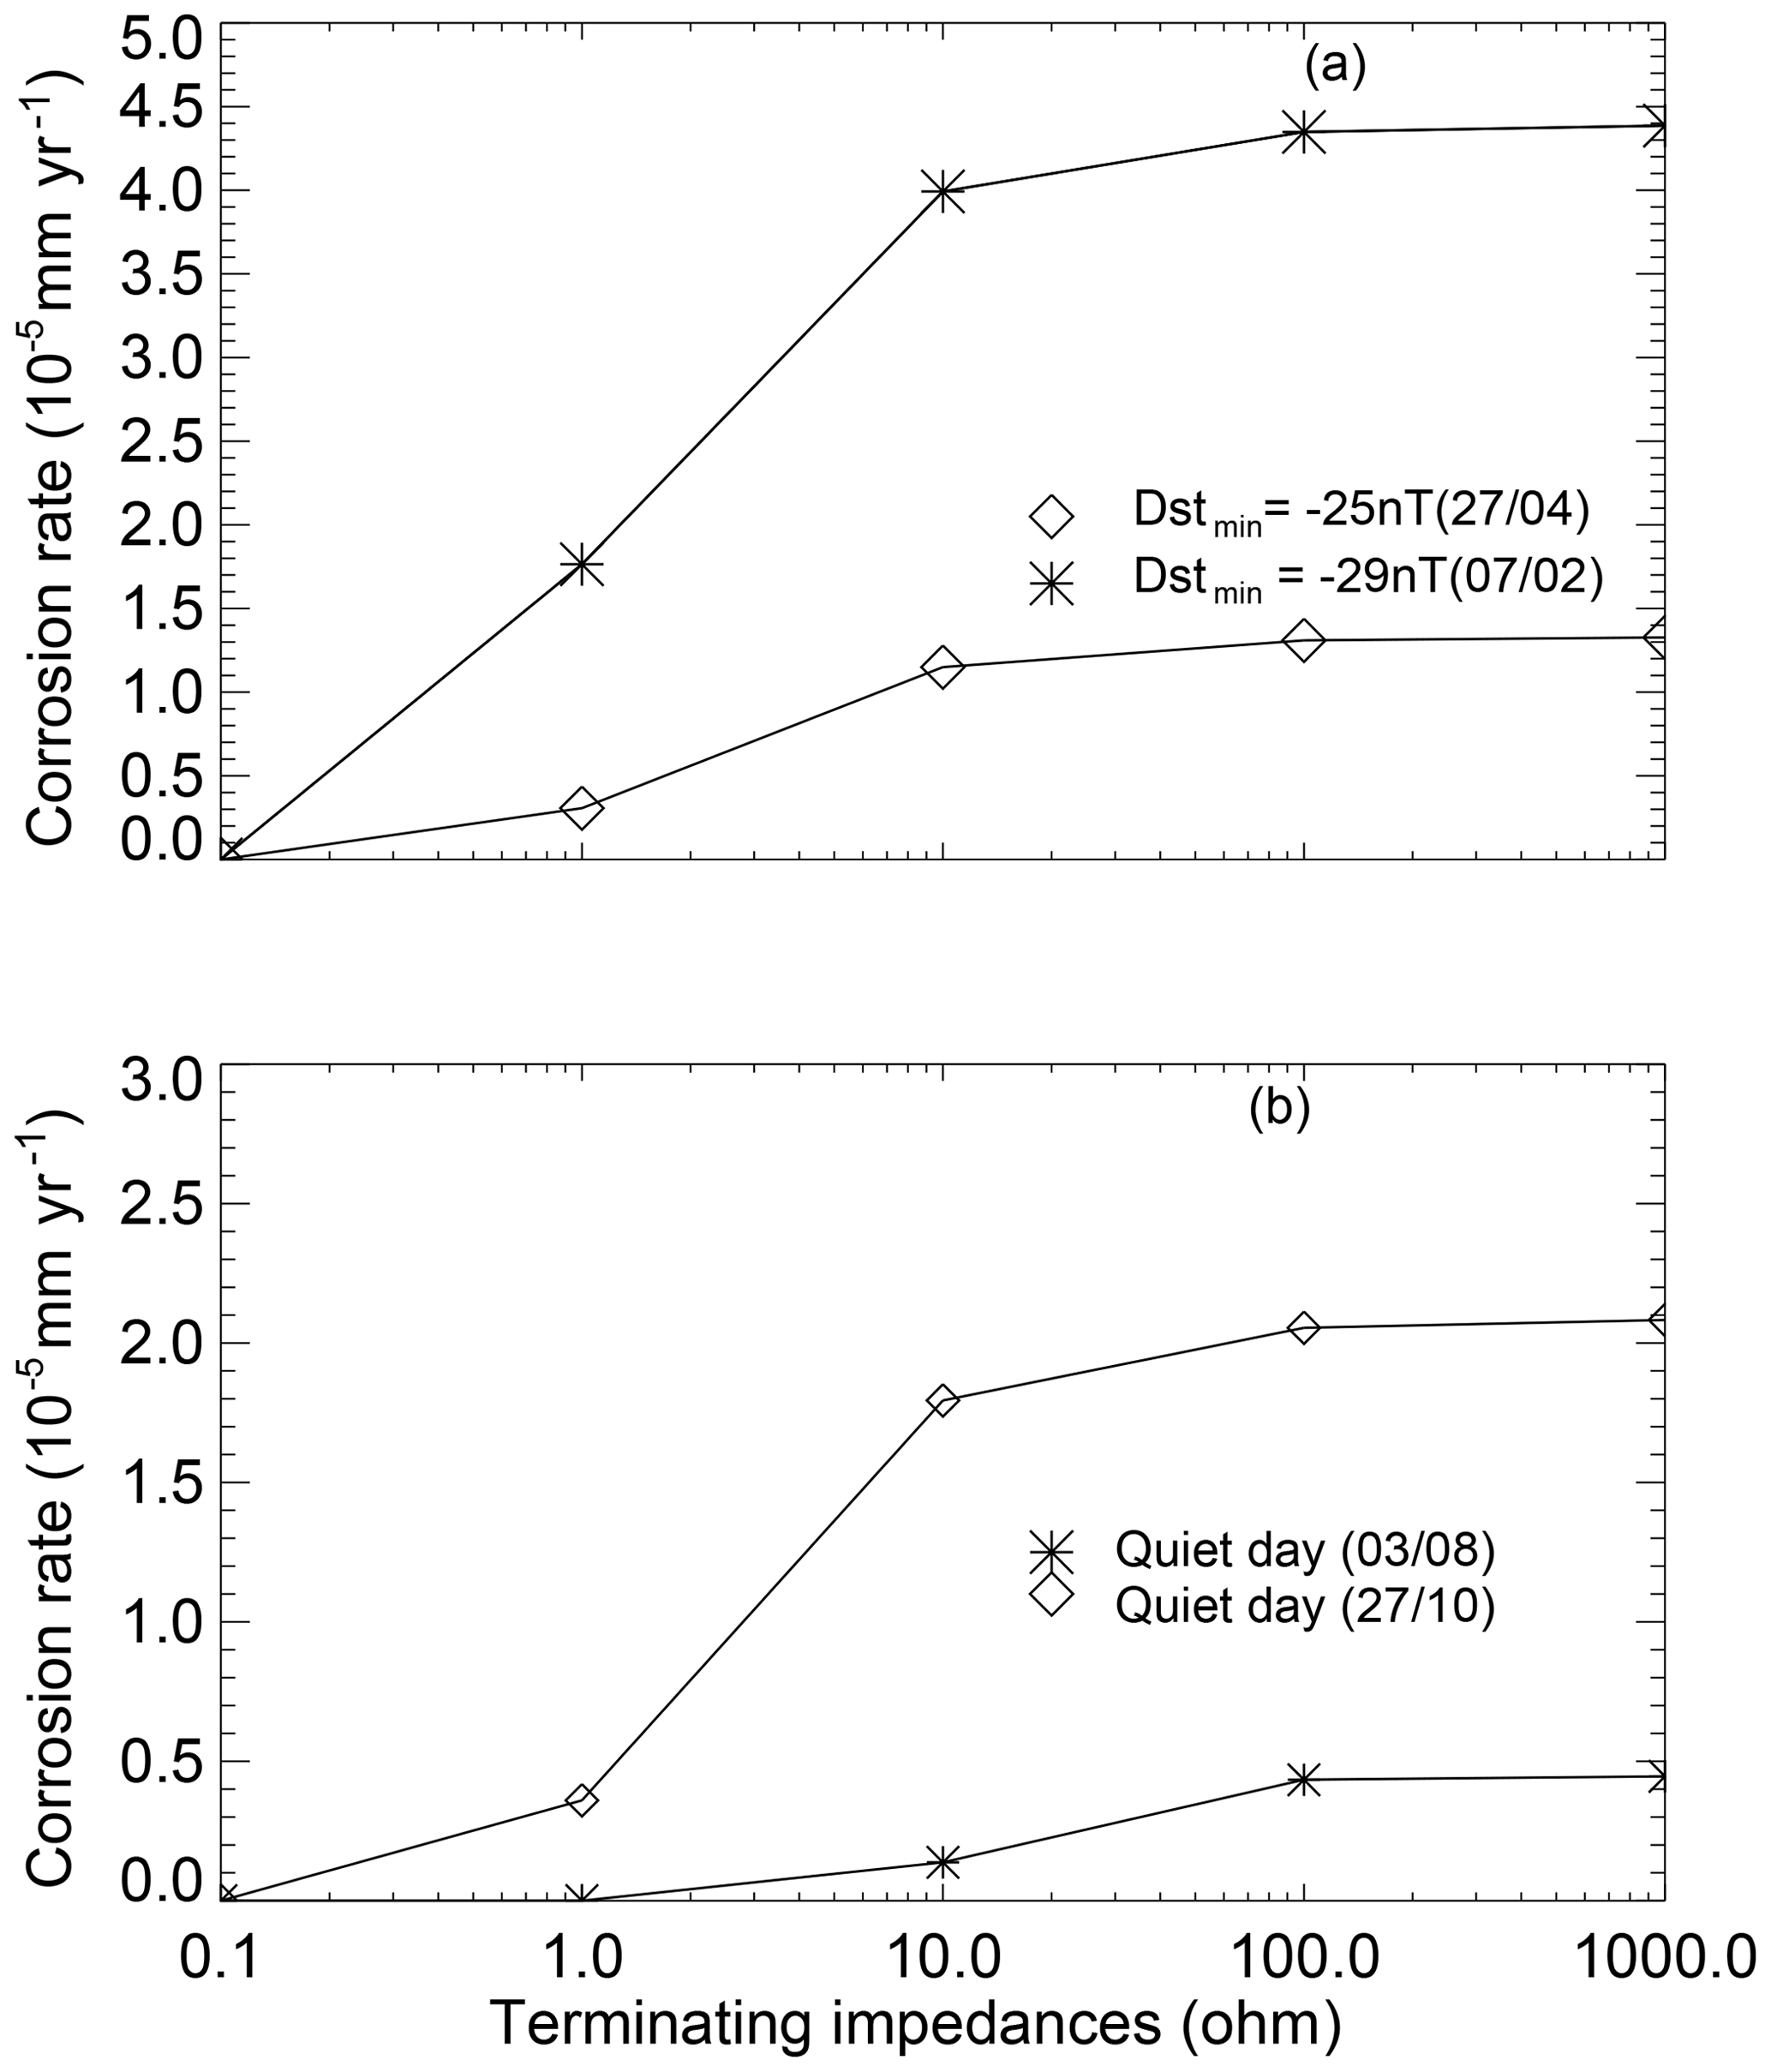
Figure 7Corrosion rate as a function of the terminating impedances for weak geomagnetic storms (a) and quiet days (b).
Figure 6a shows that the corrosion rate during strong geomagnetic storms was greater than 0.005 mm yr−1 when the terminating impedances were above 1 Ω. In addition, the corrosion rate presented constant values for impedances greater than 10 Ω. During the 17 March 2015 geomagnetic storm (star), the loss was the greatest for all impedances above 10 Ω. Figure 6b is related to moderate storms. It shows that the values were greater than mm for impedances equal to and greater than 1 Ω on 7 November 2015 (diamond). These results are close to the loss of material observed during the 23 June 2015 geomagnetic storm (diamond in Fig. 6a) that was considered to be strong; however, the loss of material did not come close to the 17 March 2015 geomagnetic storm, which was 10 times greater than the moderate storms.
Figure 7a shows the corrosion rates for weak storms. It is possible to observe that the loss of material during the 7 February 2015 geomagnetic storm was close to the result found during the 1 January 2015 storm. For impedances greater than 1 Ω, the loss of material was greater. On quiet days (Fig. 7b) with no geomagnetic storms, the results were reduced relative to weak storms and reached maximum values of about 2×105 mm in maximum impedances. In general, strong storms have more significant values when compared to weak storms, moderate storms, and quiet days.
Martin (1993) observed corrosion rates in the northern region of Australia (at a similar latitude to Brazil). It was found that the corrosion rates ranged between 0.01 and 0.038 mm yr−1. According to Martin (1993), the high corrosion rate is responsible for the 10 % penetration into the pipe over 14 years. Henriksen et al. (1978) studied a Norwegian pipeline with 300 telluric events and found a corrosion rate of 0.04 mm yr−1 caused by these events.
Considering that geomagnetic storms occur several times a year, there would be many days when currents are flowing along the pipes – primarily during the high solar activity periods. According to Osella and Favetto (2000), two risks are related to this. One of them is related to the enforcement of the induced current when the pipe is installed in a less-conductive medium. This implies that a section of the pipe would be the anode, and thus the soil would be the cathode. This configuration is responsible for the penetration of the excess currents through the pipe into the soil. The other risk is associated with the deterioration of the coating that is caused by high levels of current intensity.
The presented application of the distributed source line transmission (DSLT) theory for evaluating the corrosion rate in first Bolivia–Brazil gas pipeline route has provided a new understanding of the telluric current effects on the pipeline during extreme space weather events. The use of magnetometer data to compute the electric field allows us to estimate the PSP and corrosion rate, which leads to the following conclusions:
-
The electric field peaks computed during the 17 March 2015 geomagnetic storm occurred at the same time as the main stage of the storm, and the currents generated could arrive in Brazil by means of compressional waves or surface waves.
-
The GASBOL pipeline presented fluctuations in PSP, which exceeded the cathodic protection levels caused by GICs. This mainly occurred at the ends of the pipe, with high and low terminating impedances during the 17 March 2015 geomagnetic storm.
-
The GASBOL presented significant corrosion levels for terminating impedances greater than 10 Ω, mainly during the 17th geomagnetic storm of 17 March 2015. Moreover, the event did not exceed the acceptable level, but it can contribute to accelerating the corrosion process of the pipe. Therefore, the effects of GICs in pipelines cannot be negligible, even in middle latitudes, since they can reduce the lifetime of a pipeline.
All the magnetometer data are available online at the EMBRACE website (http://www2.inpe.br/climaespacial/SpaceWeatherDataShare/, INPE, 2020).
JFdM wrote the manuscript and did the calculations and analysis. IP discussed the space weather events, did part of figures, and supervised the entire work. LRA helped with the electric field calculations and suggested the multiple horizontal layers. LRA also contributed to revising the paper. CMD was responsible for coordinating the experiments with the magnetometer and also revised the paper.
The authors declare that they have no conflict of interest.
This article is part of the special issue “7th Brazilian meeting on space geophysics and aeronomy”. It is a result of the Brazilian meeting on Space Geophysics and Aeronomy, Santa Maria, Rio Grande do Sul, Brazil, 5–9 November 2018.
Joyrles Fernandes de Moraes wishes to thank the Brazilian National Council for Scientific and Technological Development (CNPq), which provided funding for the development of this work. Igo Paulino has been supported by the CNPq and Fundaçao de Amparo à Pesquisa do Estado da Paraíba (FAPESQ PB). The geomagnetic field data used in this paper have been provided by Embrace/INPE. Clezio Marcos Denardini wishes to thank CNPq/MCTI (grant no. 303643/2017-0). The authors also wish to thank Larisa Trichtchenko from Canadian Natural Resources Limited for the important contributions to the calculations of PSP.
This research has been supported by the CNPq (grant nos. 303511/2017-6 and 303643/2017-0) and FAPESQ PB.
This paper was edited by Marcos D. Silveira and reviewed by Cassio Antunes and one anonymous referee.
Anderson, C. W., Lanzerotti, L. J., and MacLennan, C. G.: Outage of the l4 system and the geomagnetic disturbances of 4 august 1972, Bell Syst. Tech. J., 53, 1817–1837, https://doi.org/10.1002/j.1538-7305.1974.tb02817.x, 1974. a
Boteler, D. and Cookson, M.: Telluric currents and their effects on pipelines in the cook strait region of New Zealand, Mater. Performance, 25, 27–32, 1986. a
Boteler, D. H. and Seager, W. H.: Telluric Currents: A Meeting of Theory and Observation, Corrosion, 54, 751–755, https://doi.org/10.5006/1.3284894, 1998. a
Campbell, W. H.: Observation of electric currents in the Alaska oil pipeline resulting from auroral electrojet current sources, Geophys. J. Int., 61, 437–449, 1980. a, b
Denardini, C. M., Chen, S. S., Resende, L. C. A., Moro, J., Bilibio, A. V., Fagundes, P. R., Gende, M. A., Cabrera, M. A., Bolzan, M. J. A., Padilha, A. L., Schuch, N. J., Hormaechea, J. L., Alves, L. R., Barbosa Neto, P. F., Nogueira, P. A. B., Picanço, G. A. S., and Bertollotto, T. O.: The Embrace Magnetometer Network for South America: Network Description and Its Qualification, Radio Sci., 53, 288–302, https://doi.org/10.1002/2017RS006477, 2018. a
Fernberg, P. A., Samson, C., Boteler, D. H., Trichtchenko, L., and Larocca, P.: Earth conductivity structures and their effects on geomagnetic induction in pipelines, Ann. Geophys., 25, 207–218, https://doi.org/10.5194/angeo-25-207-2007, 2007. a
Guillon, S., Toner, P., Gibson, L., and Boteler, D.: A Colorful Blackout: The Havoc Caused by Auroral Electrojet Generated Magnetic Field Variations in 1989, IEEE Power and Energy Magazine, 14, 59–71, https://doi.org/10.1109/MPE.2016.2591760, 2016. a
Gummow, R.: GIC effects on pipeline corrosion and corrosion control systems, J. Atmos. Sol.-Terr. Phy., 64, 1755–1764, https://doi.org/10.1016/S1364-6826(02)00125-6, 2002. a, b, c
Heirtzler, J.: The future of the South Atlantic anomaly and implications for radiation damage in space, J. Atmos. Sol.-Terr. Phy., 64, 1701–1708, https://doi.org/10.1016/S1364-6826(02)00120-7, 2002. a
Henriksen, J., Elvik, R., and Granasen, L.: Telluric current corrosion on buried pipelines, Proceedings of the Eighth Scandinavian Corrosion Congress, Hensinki, 2, 167–176, Helsinki University of Technology, Helsinki, Finland, 1978. a
Ingham, M. and Rodger, C. J.: Telluric Field Variations as Drivers of Variations in Cathodic Protection Potential on a Natural Gas Pipeline in New Zealand, Space Weather, 16, 1396–1409, https://doi.org/10.1029/2018SW001985, 2018. a
INPE: Estudo e Monitoramento Brasileiro do Clima Espacial, available at: http://www.inpe.br/spaceweather/ and http://www2.inpe.br/climaespacial/SpaceWeatherDataShare/, last access: 20 June 2020. a
Lanzerotti, L. J., Thomson, D. J., and Maclennan, C. G.: Engineering issues in space weather, International Union of Radio Science (URSI), 14, 25–50, 1999. a
Marshall, R. A., Waters, C. L., and Sciffer, M. D.: Spectral analysis of pipe-to-soil potentials with variations of the Earth's magnetic field in the Australian region, Space Weather, 8, S05002, https://doi.org/10.1029/2009SW000553, 2010. a
Martin, B. A.: Telluric Effects on a Buried Pipeline, Corrosion, 49, 343–350, https://doi.org/10.5006/1.3316059, 1993. a, b
Osella, A. and Favetto, A.: Effects of soil resistivity on currents induced on pipelines, J. Appl. Geophys., 44, 303–312, https://doi.org/10.1016/S0926-9851(00)00008-2, 2000. a
Osella, A., Favetto, A., and Lopez, E.: Currents induced by geomagnetic storms on buried pipelines as a cause of corrosion, J. Appl. Geophys., 38, 219–233, https://doi.org/10.1016/S0926-9851(97)00019-0, 1998. a
Padilha, A., Trivedi, N., Vitorello, I., and da Costa, J.: Geophysical constraints on tectonic models of the Taubaté Basin, southeastern Brazil, Tectonophysics, 196, 157–172, https://doi.org/10.1016/0040-1951(91)90294-3, 1991. a
Paulikas, G. A.: Precipitation of particles at low and middle latitudes, Rev. Geophys., 13, 709–734, https://doi.org/10.1029/RG013i005p00709, 1975. a
Place, T. and Sneath, T.: Practical telluric compensation for pipeline close-interval surveys, Mater. Performance, 40, 22–27, 2001. a
Pulkkinen, A., Pirjola, R., Boteler, D., Viljanen, A., and Yegorov, I.: Modelling of space weather effects on pipelines, J. Appl. Geophys., 48, 233–256, https://doi.org/10.1016/S0926-9851(01)00109-4, 2001. a
Schelkunoff, S. A.: Electromagnetic waves, 1st Edn., Van Nostrand, New York, 1943. a
Seager, W.: Adverse telluric effects on northern pipelines, International Arctic Technology Conference, Vol. 2, Anchorage, Alaska, 1991. a
Trichtchenko, L. and Boteler, D. H.: Modelling of geomagnetic induction in pipelines, Ann. Geophys., 20, 1063–1072, https://doi.org/10.5194/angeo-20-1063-2002, 2002. a, b, c, d, e, f
Trivedi, N., Pathan, B., Schuch, N. J., Barreto, M., and Dutra, L.: Geomagnetic phenomena in the South Atlantic anomaly region in Brazil, Adv. Space Res., 36, 2021–2024, https://doi.org/10.1016/j.asr.2004.09.020, 2005. a