the Creative Commons Attribution 4.0 License.
the Creative Commons Attribution 4.0 License.
 | 16 Jan 2020
Stratospheric observations of noctilucent clouds: a new approach in studying middle- and large-scale mesospheric dynamics
Nikolay Pertsev
Vladimir Perminov
Denis Efremov
Vitaly Romejko
The Stratospheric Observations of Noctilucent Clouds (SONC) experimental campaign was conducted on the night of 5–6 July 2018 with the aim of photographing noctilucent clouds (NLCs) and studying their large-scale spatial dynamics at scales of 100–1450 km. An automated high-resolution camera (equipped with a wide-angle lens) was lifted by a stratospheric sounding balloon to 20.4 km altitude above the Moscow region in Russia (∼56∘ N, 41∘ E), taking several hundreds of NLC images during the flight that lasted 1.7 h. The combination of a high-resolution camera and large geographic coverage (∼1500 km) has provided a unique technique of NLC observations from the stratosphere, which is impossible to currently achieve from either the ground or space. We have estimated that a horizontal extension of the NLC field as seen from the balloon was about 1450×750 km, whereas it was about 800×550 km as seen from the ground. The NLC field was located in a cold area of the mesopause (136–146 K), which was confirmed by satellite measurements. The southernmost edge of the NLC field was modulated by partial ice voids of 150–250 km in diameter. A medium-scale gravity wave had a wavelength of 49.4±2.2 km and an amplitude of 1.9±0.1 km. The final state of the NLC evolution was represented by thin parallel gravity wave stripes. Balloon-borne observations provide new horizons in studies of NLCs at various scales from metres to thousands of kilometres. Here we present a review paper on our experiment describing the initial results. Detailed studies on the time evolution of the cloud movements will be done in the future.
- Article
(5671 KB) - Full-text XML
- BibTeX
- EndNote


Night-shining clouds or noctilucent clouds (NLCs) are the highest clouds in the Earth's atmosphere observed at the summer mesopause between 80 and 90 km. NLCs can be readily seen from mid- and sub-polar latitudes of both hemispheres. NLCs are composed of water-ice particles of 30–100 nm in radius that scatter sunlight, and thus NLCs are observed against the dark twilight arc from May until September in the Northern Hemisphere and from November to February in the Southern Hemisphere (Bronshten and Grishin, 1970; Gadsden and Schröder, 1989; Liu et al., 2016). NLCs are also observed from space and in this case they are usually called polar mesospheric clouds (PMCs) (Thomas, 1984).
NLCs are almost always represented by a wave surface with a complex interplay between small-scale turbulence processes of 10–1000 m, atmospheric gravity waves (GW) with wavelengths of 10–1000 km, planetary waves, solar thermal tides, and lunar gravitational tides of about 10 000 km (Witt, 1962; Fritts et al., 1993; Rapp et al., 2002; Kirkwood and Stebel, 2003; Chandran et al., 2009; Dalin et al., 2010; Fiedler et al., 2011; Taylor et al., 2011; Pertsev et al., 2015). Sometimes, distinguished non-linear mesospheric phenomena like mesospheric walls or fronts appear at the mesopause which clearly separate two volumes of the mesopause with cold and warm air masses with a temperature difference of 20–25 K across a few kilometres (Dubietis et al., 2011; Dalin et al., 2013).
NLCs/PMCs are systematically observed and studied from the ground (optical imagers, lidars) as well as from space (the Aeronomy of the Ice in the Mesosphere (AIM), Odin, Solar Backscatter Ultraviolet Radiometer (SBUV) instruments) (e.g. Karlsson and Gumbel, 2005; Dalin et al., 2008; Bailey et al., 2009; Fiedler et al., 2011; DeLand and Thomas, 2015); there are also irregular (campaign-based) NLC observations conducted by using sounding rockets and aircraft (Zadorozhny et al., 1993; Gumbel and Witt, 2001; Reimuller et al., 2011). These techniques have advantages and disadvantages. In particular, ground-based measurements provide a high horizontal resolution of ∼20 m, a high temporal resolution of seconds (optical imagers) (Dalin et al., 2010; Baumgarten and Fritts, 2014), and a high vertical resolution of 50–150 m using lidars (Baumgarten et al., 2009), but are limited by tropospheric weather conditions and restricted to a certain small region on the Earth's surface. Satellite measurements, on the other hand, provide global PMC coverage but have low spatial horizontal resolution (∼5 km) as well as large spatial gaps of several hundreds of kilometres between adjacent orbits at middle and subpolar latitudes. Thus, there is no perfect technique to observe and study NLCs/PMCs so far. At the same time, observations made from stratospheric altitudes (20–40 km) are potentially available for comprehensive studies of NLCs/PMCs. So far, three published experiments from stratospheric balloons providing NLC/PMC observations have been conducted. The first one was performed over Antarctica between 29 December 2012 and 9 January 2013 (Miller et al., 2015). The E and B Experiment (EBEX) was dedicated to another research field concerning polarization in the cosmic microwave background (Reichborn-Kjennerud et al., 2010). At the same time, two star cameras of the EBEX experiment, with a narrow field of view of , were able to register fine structures of PMCs and turbulence dynamics, ranging from several kilometres down to 10 m. Another balloon-borne experiment (PMC-Turbo) was conducted between 8 and 14 July 2018 over the Sweden–Greenland–Canada territories in order to capture NLCs with seven optical cameras and lidar (Fritts et al., 2019). The PMC-Turbo experiment was launched about 2.5 d after the experiment described in the present paper.
In this paper, we report on scientific results of a new balloon-borne experiment dedicated to studies of NLC middle- and large-scale dynamics at horizontal scales of more than 100 km (Dalin et al., 2019). Such an experiment, conducted for the first time, opens new horizons for studies of middle- and large-scale dynamical features in combination with a high spatial resolution at the summer mesopause, currently unachievable for other techniques like ground-based and space measurements.
The Stratospheric Observations of Noctilucent Clouds (SONC) experiment is a special balloon-borne experiment dedicated to studies of large-scale dynamical features in NLCs. A high-resolution high sensitive camera (Sony Alpha A7S), with a full frame 35 mm 12 megapixel sensor (4240×2832 pixels) and equipped with a wide-angle lens (the field of view, FoV, is ), has been installed on a meteorological sounding balloon. This combination of a high-resolution sensor and wide FoV yields spatial horizontal resolutions of ∼30 and ∼3000 m when looking at 83 km from 20 km at elevation angles of 90 and 0∘, respectively. The horizontal coverage of a mesopause layer is over 2000 km when viewing along the horizon at low elevation angles. The balloon was launched from the Moscow region, Russia (∼56∘ N; 41∘ E), on the night of 5–6 July 2018. Since a gondola payload is constantly rotating and shaking during its flight, the NLC camera was installed on a special stabilized platform. The three-axis motorized gimbal stabilized platform (Fig. 1) was designed and built by Aerospace laboratory “Stratonautica” (http://stratonautica.ru, last access: 11 January 2020), which has wide-ranging experience in building such platforms and launching sounding balloons. The platform was designed to rotate in a 60∘ step in the azimuth angle in order to capture the whole hemisphere (360∘) since NLCs can appear in any direction as observed from mid-latitudes, including the southern part of the sky (Hultgren et al., 2011; Suzuki et al., 2016). The NLC camera took images every 6 s during the whole flight, obtaining several thousands of images and several hundreds of images capturing NLCs. In addition, automatic exposure bracketing was used to take four images in sequence with different exposures, allowing us to register various NLC brightnesses from very bright to very faint as well as faint stars, which is important information for the photogrammetric technique and georeference procedure of the images.
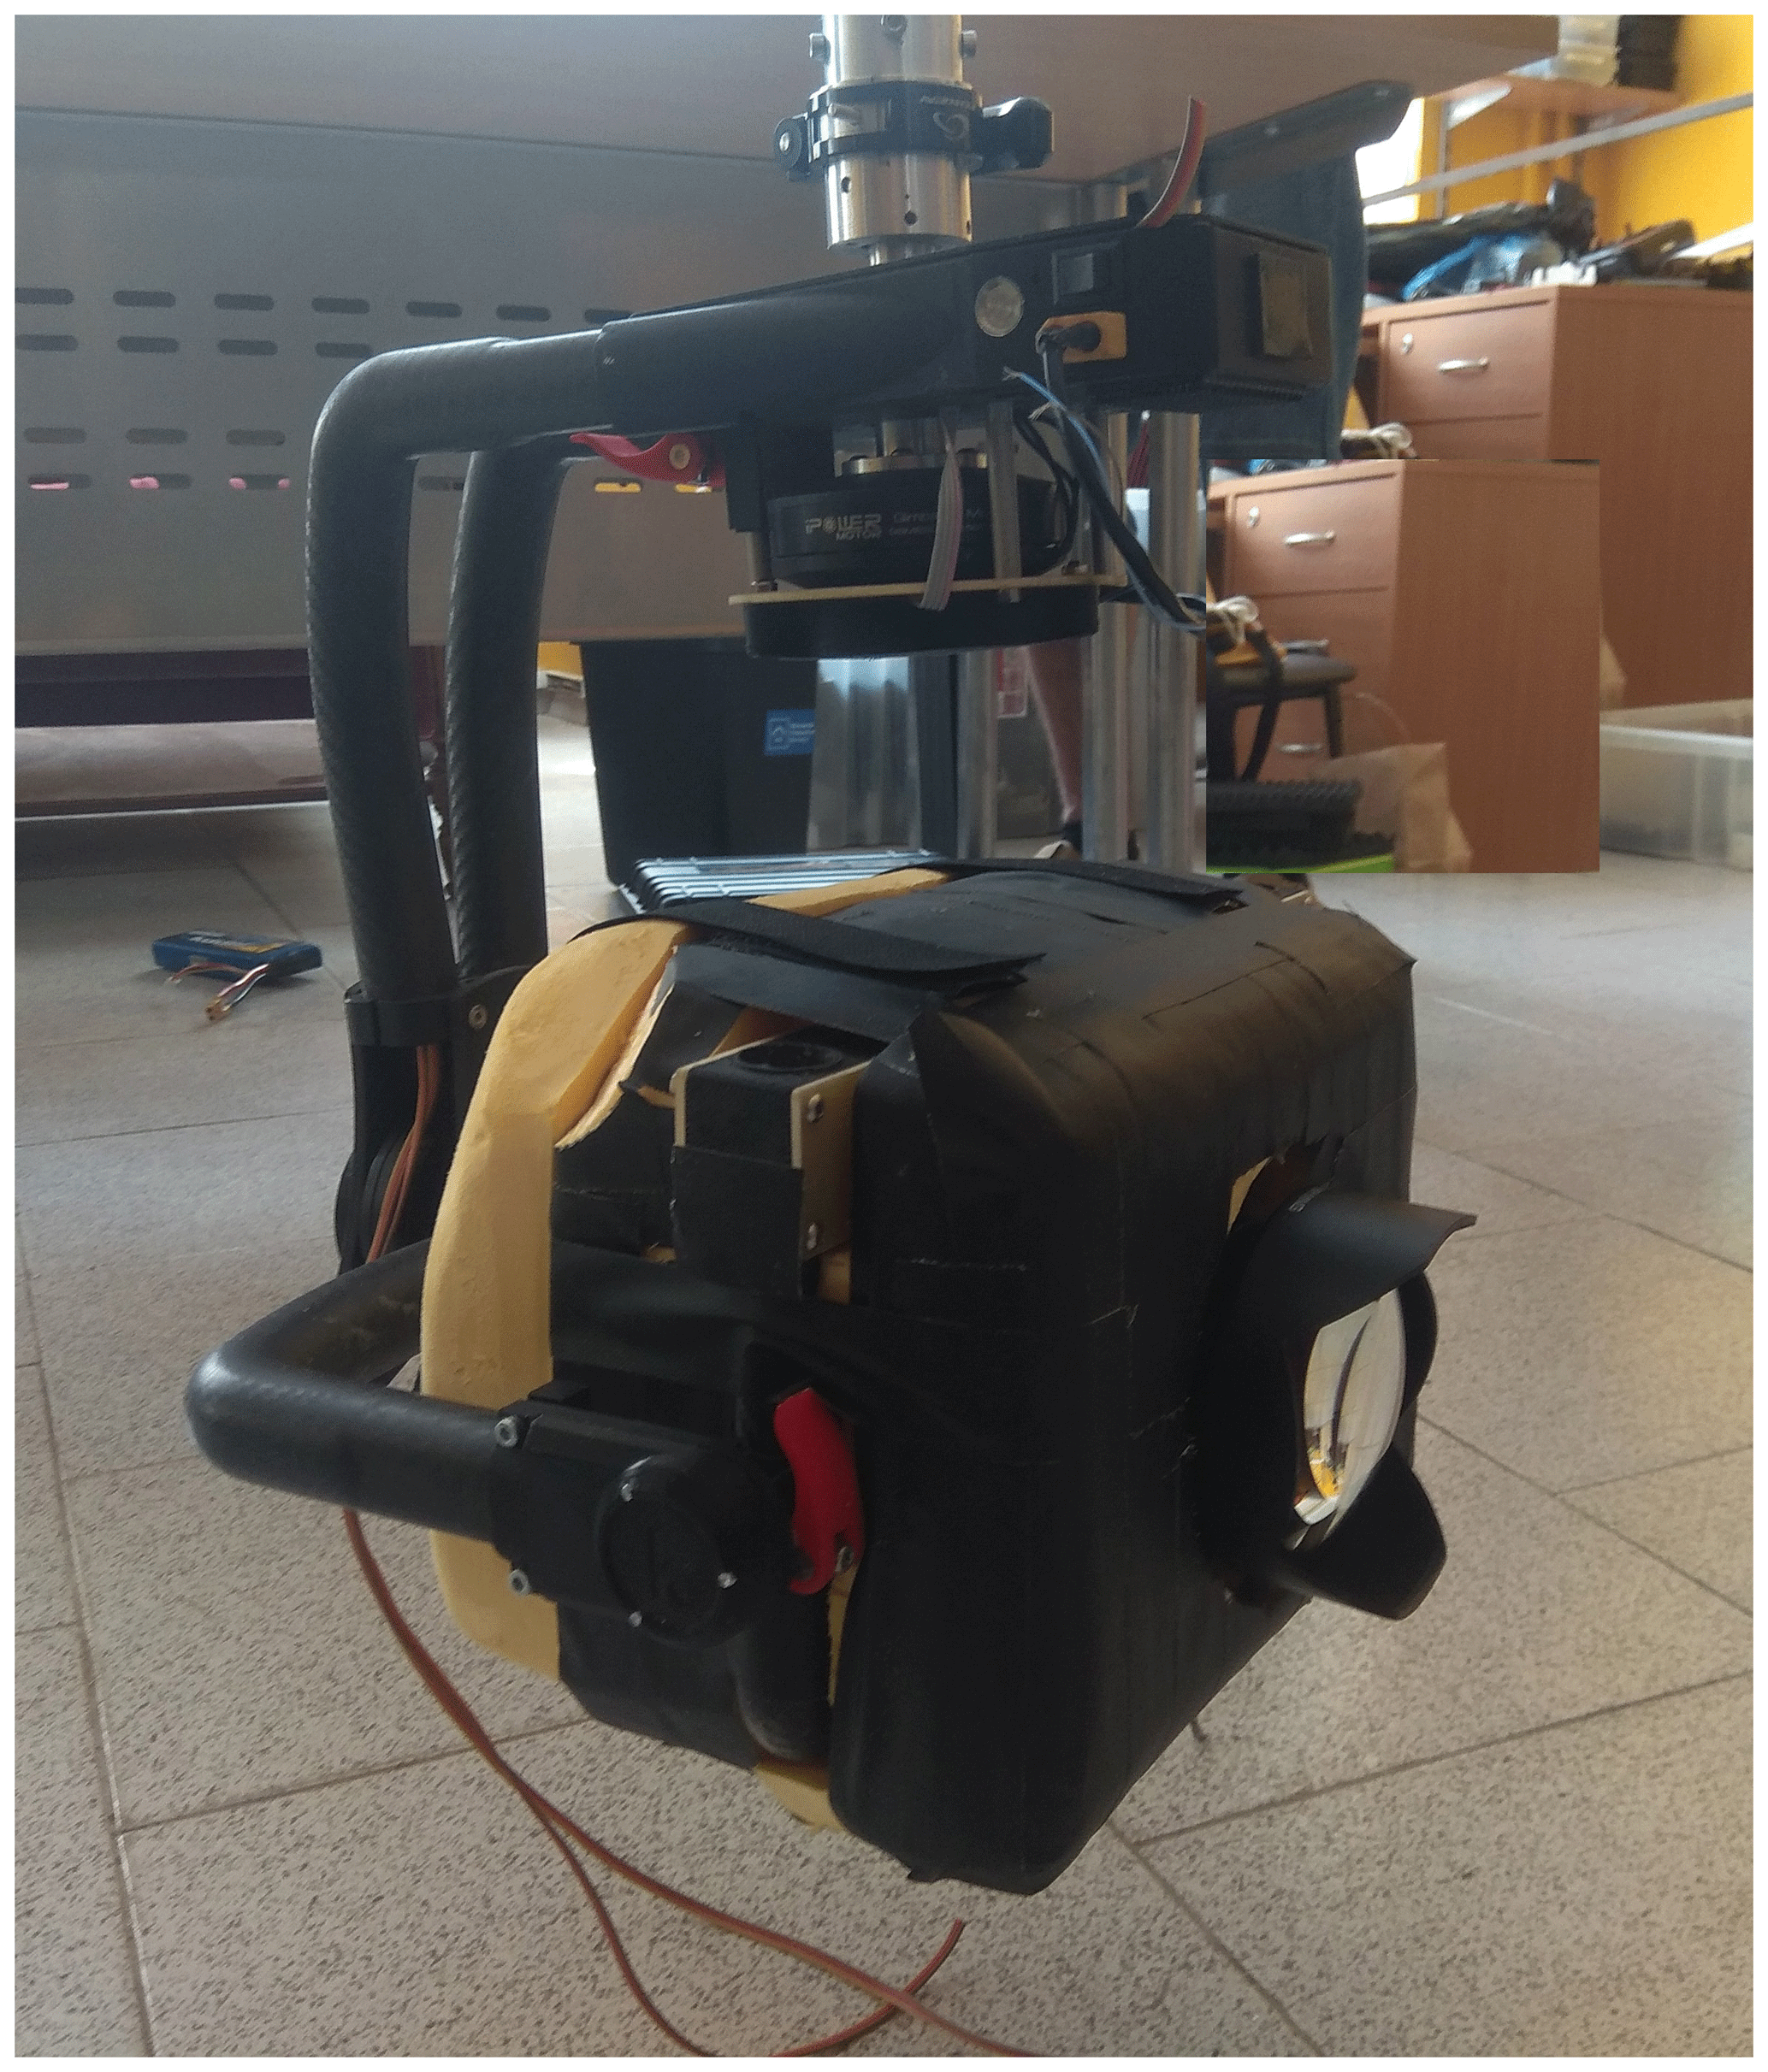
Figure 1The three-axis motorized gimbal stabilized platform, holding the NLC camera, designed and built by Aerospace laboratory “Stratonautica”. Photo by Denis Efremov.
The balloon was launched at 21:34 UT on 5 July 2018 and the total flight duration was about 1.7 h. The ascent speed was around 5 m s−1 and the balloon reached its maximum altitude of 20.4 km where it burst; then the payload descended with a parachute and the payload was successfully recovered. A GPS receiver was installed onboard in order to obtain information on the balloon trajectory. The flight characteristics of the SONC balloon are shown in Fig. 2.

Figure 2(a) The altitude of the SONC balloon as a function of flight time. (b) The vertical–horizontal trajectories of the SONC balloon: the red line is the upleg trajectory and the black line is the downleg trajectory.
A ground-based support consisting of three automated NLC cameras was established in the Moscow region in order to launch the balloon at the time of NLC appearance. Also, a number of amateur observers significantly contributed to the NLC observational programme before and during the flight. A launch window was preliminarily chosen at the beginning of July based on long-term statistics of NLC observations conducted in the Moscow region from 1962 to the present time. This statistics demonstrate that NLCs appear at the beginning of July, with about 65 % occurrence probability on a clear night (Dalin et al., 2020).
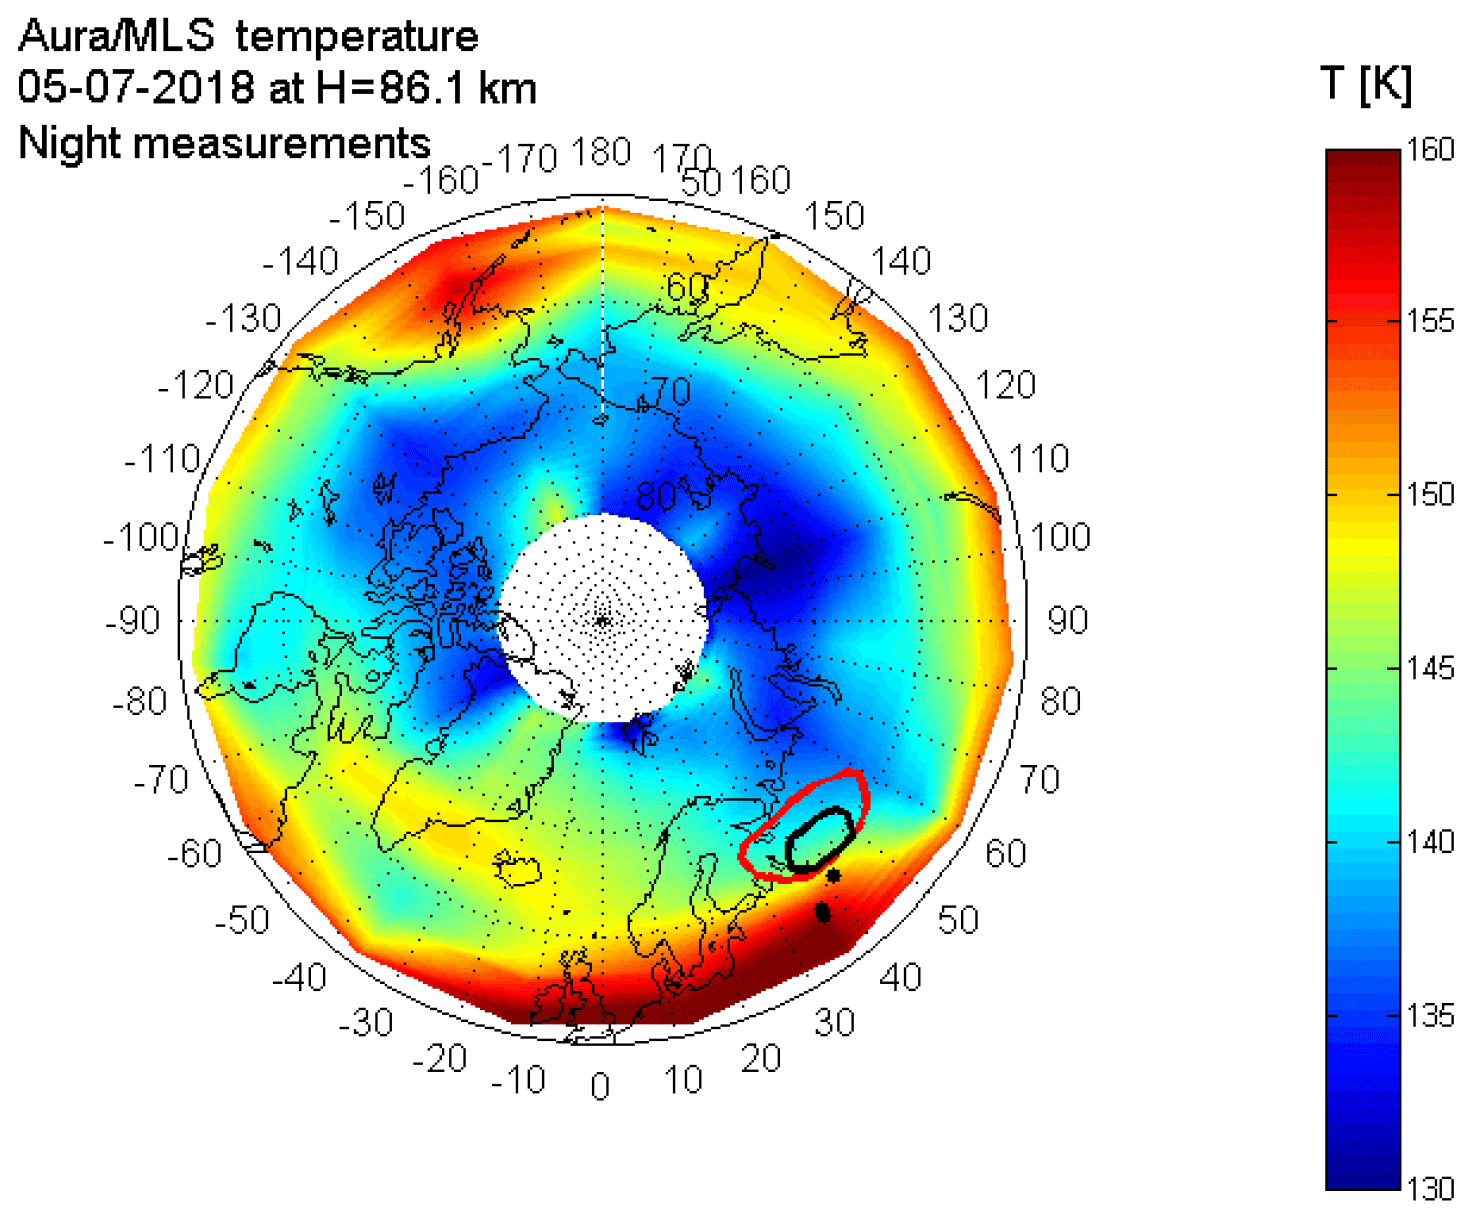
Figure 3The temperature map at the mesopause (geometric height of 86.1 km) as measured by the Aura/MLS spectrometer on 5 July 2018. Nighttime measurements around the globe have been selected to produce the map. Upon the temperature map, the outer borders of the NLC field (the actual NLC coverage) are overplotted: the red line is as seen from the SONC balloon, and the black line is as seen from the ground at the launch. The black dots mark the position of the balloon at 7.8 km at the ground and ground-based observers.
During the flight, the balloon-borne camera captured an extended NLC field with a number of interesting features discussed in Sect. 4. One can note the following general characteristics of the NLC display.
- a.
NLCs were observed between 20:30 and 23:15 UT (23:30 and 02:15 LT) on 5 July 2018.
- b.
NLCs were located between 82.6 and 85.1 km. The NLC height was estimated by using synchronously taken images obtained from two ground-based cameras located in the Moscow region.
- c.
The NLC field extended along the horizon from NW to NE at low elevation angles from −5 to +11∘ as seen from the balloon.
- d.
NLCs were modulated by atmospheric gravity waves of various scales with horizontal wavelengths from 9 to 50 km.
- e.
NLCs were travelling in a rather unusual direction from south to north at the observed mean speed of ∼43 m s−1.
- f.
NLCs were fading during the balloon ascent and they got very faint and less structured at the maximum balloon altitude of 20.4 km. The brightest and most well-developed NLCs were observed when the SONC balloon was between 6 and 13 km, which is why we analyse the most profound features of NLC images obtained at this height range.
Each analysed NLC image was georeferenced using horizontal coordinates of referenced stars (at least 15 stars are needed). The technique of the NLC georeference, triangulation height estimation, and error analysis can be found in Dalin et al. (2004, 2015).
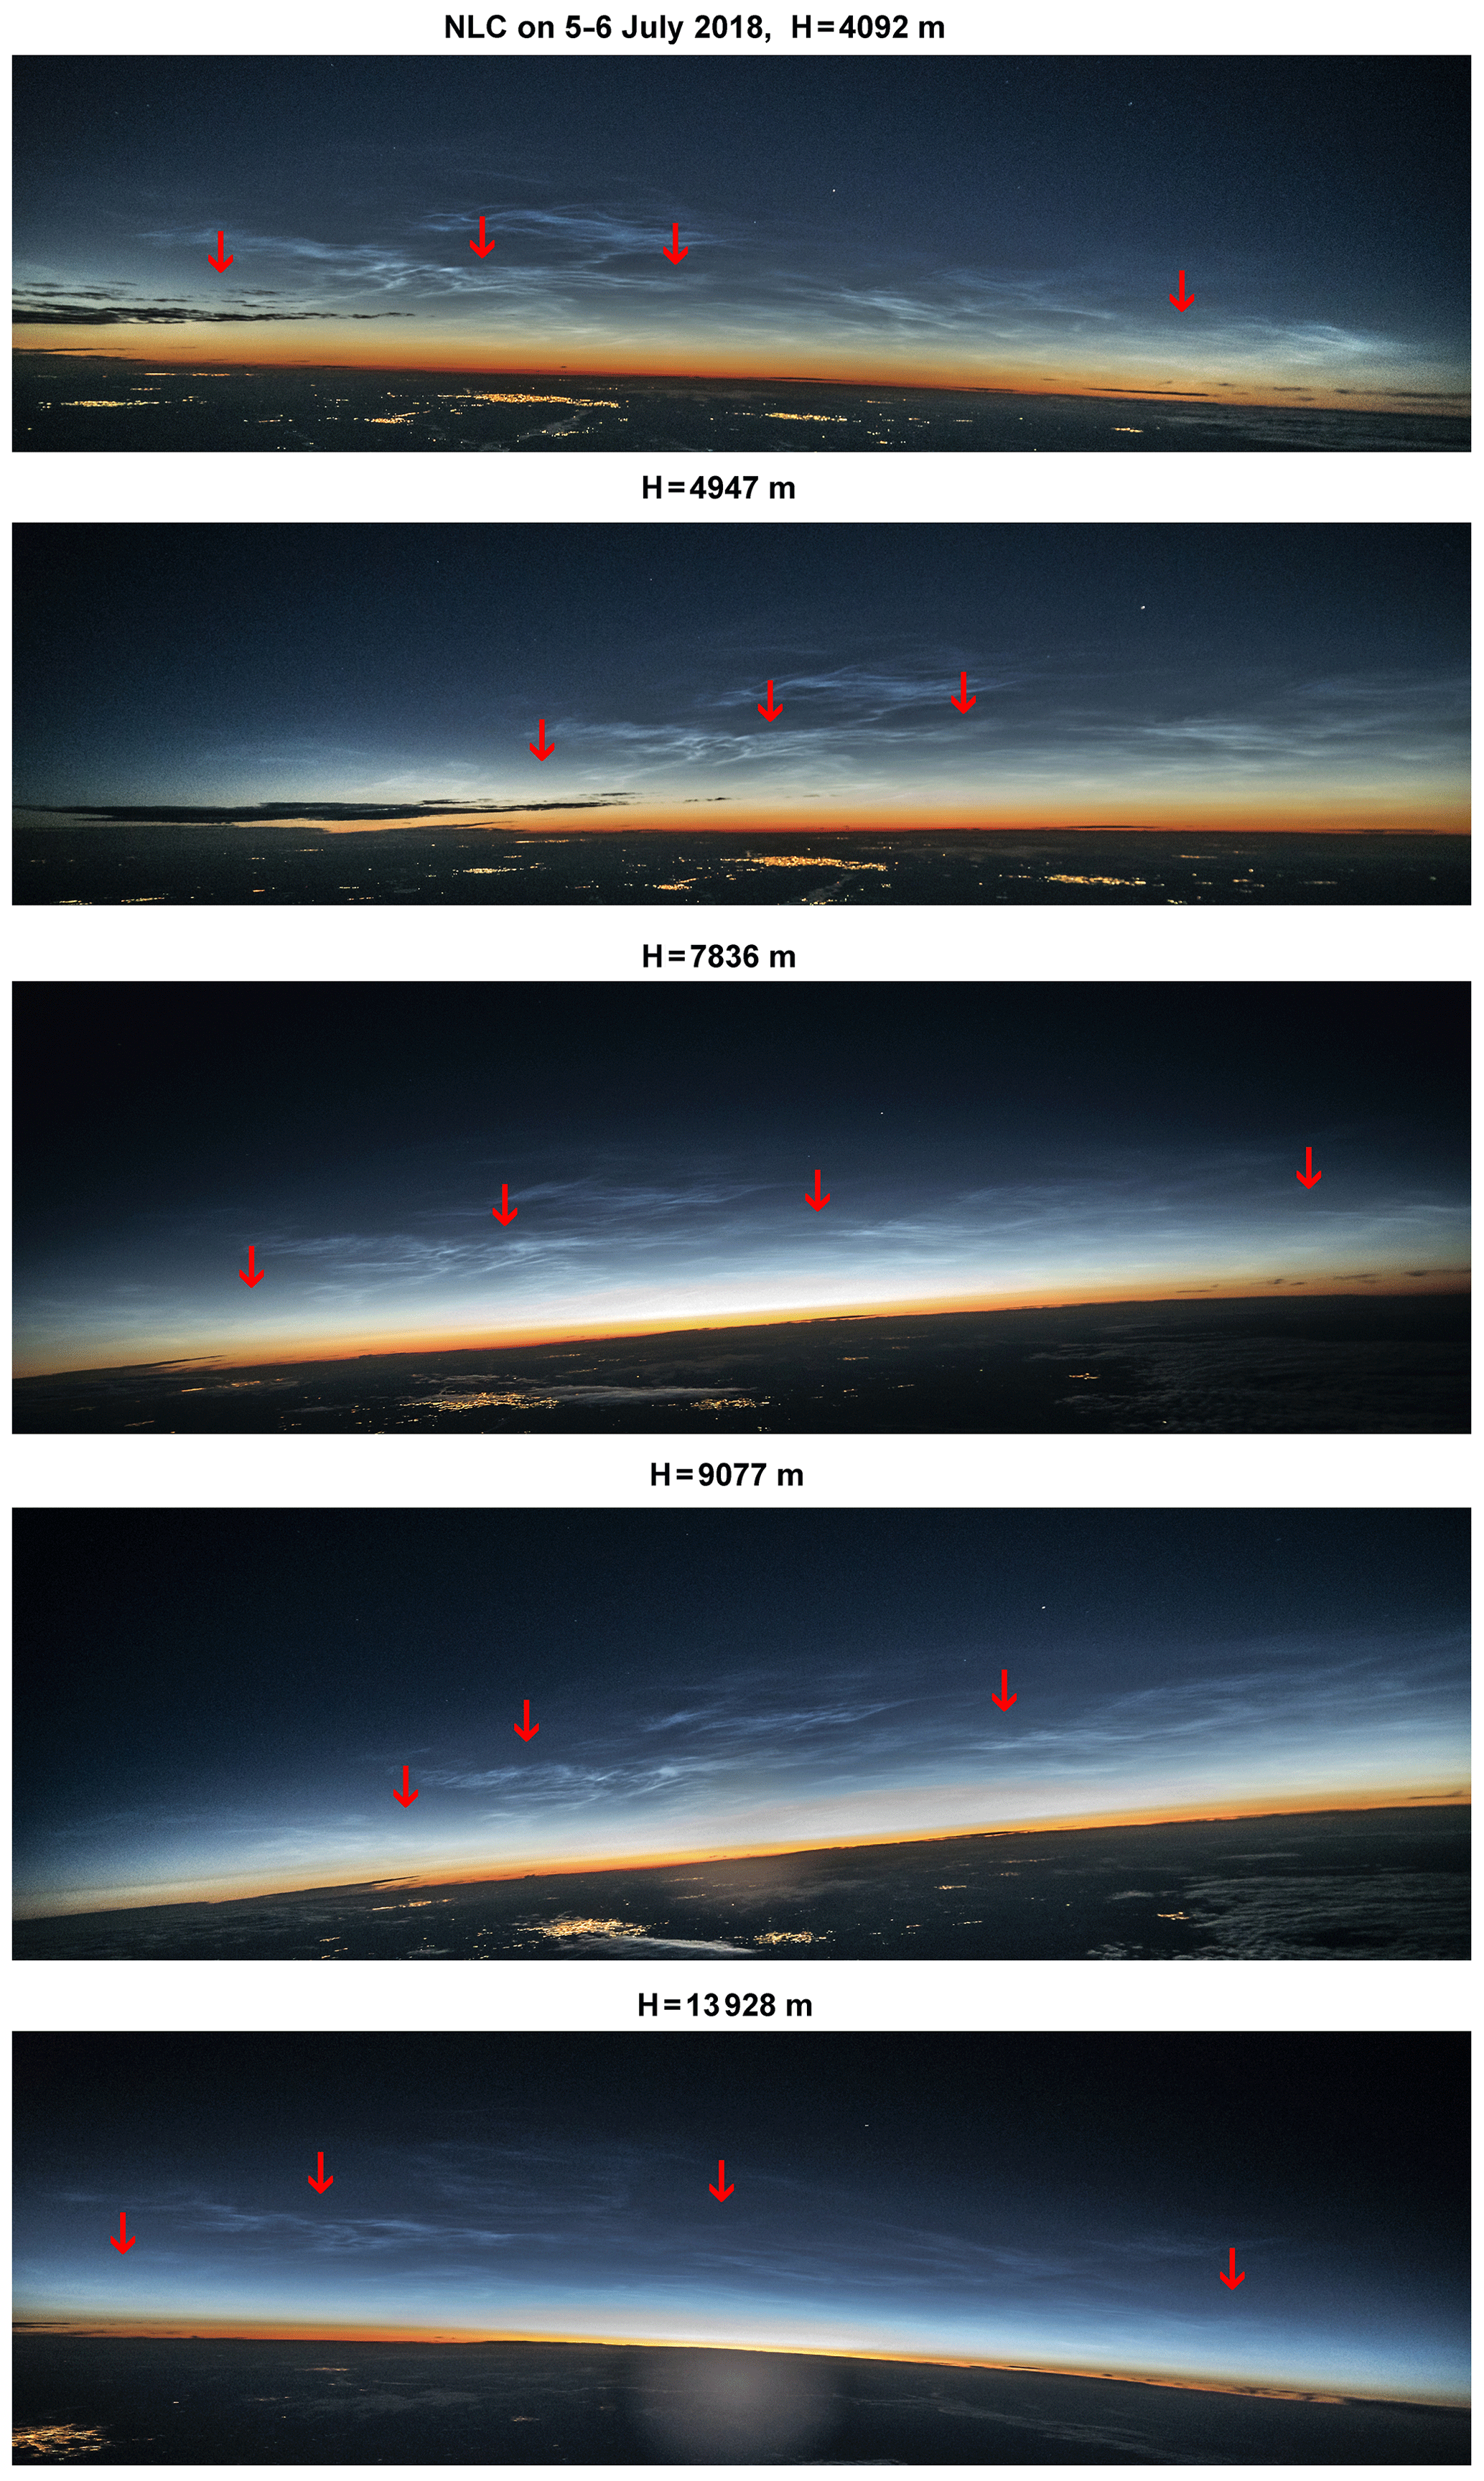
Figure 4The NLC field as observed from the SONC balloon at 4092, 4947, 7836, 9077, and 13 928 m above the ground at 21:46, 21:49, 21:57, 22:01, and 22:20 UT on 5 July 2018. The red arrows indicate the centres of large areas free from NLC particles (partial ice voids).

Figure 5Projection of the NLC fields (shown in Fig. 4) as observed from the SONC balloon on the surface. The red arrows indicate the centres of large areas free from NLC particles (partial ice voids).
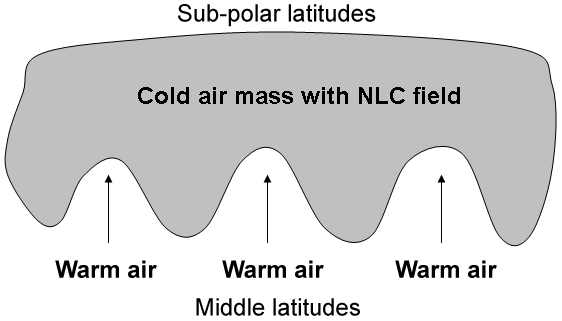
Figure 6A schematic representation of the intrusion of warm air masses from mid- to sub-polar latitudes, forming partial ice voids in the observed NLCs. A general concept of this scheme is analogous to the formation of a wave cyclone in the troposphere (see Figs. 8.18 and 8.19 in Ahrens, 1993).
The projection of the NLC field on the surface along with the temperature map obtained with the Aura/MLS spectrometer is shown in Fig. 3. The description of the MLS temperature product and its validation can be found in Froidevaux et al. (2006) and Schwartz et al. (2008). One can see that the NLC field (their actual coverage) extended mostly from the west to east along an area filled with low temperatures of 136–146 K, and the NLCs were located north of 58∘ N due to rapidly increasing temperature with decreasing latitude. That is why the NLCs were observed at low elevation angles (far to the north as seen from the Moscow region) on this particular night.
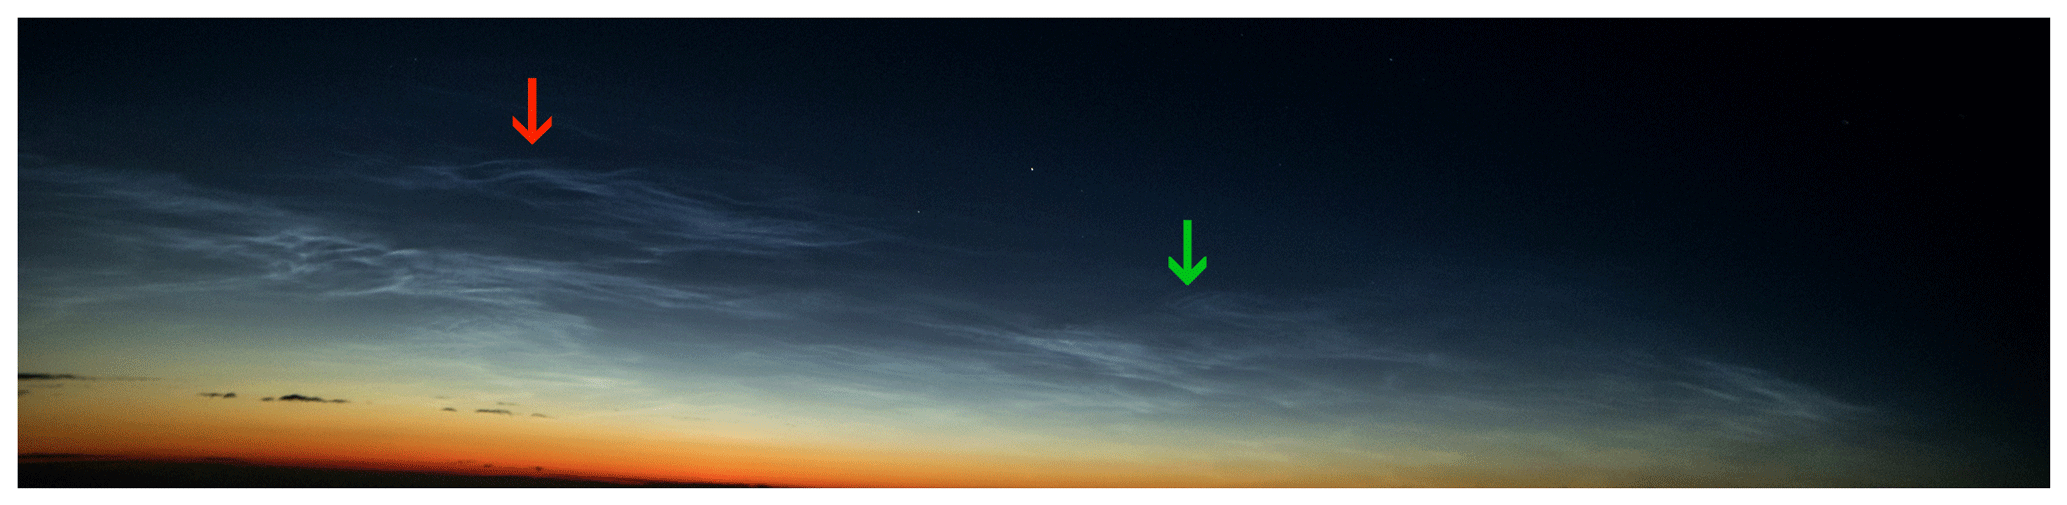
Figure 7The SONC balloon image taken at 6222 m above the ground at 21:49 UT on 5 July 2018. The red arrow marks the vertical modulation of the NLC layer by a gravity wave of medium scale. The green arrow indicates small-scale billow-type gravity waves.
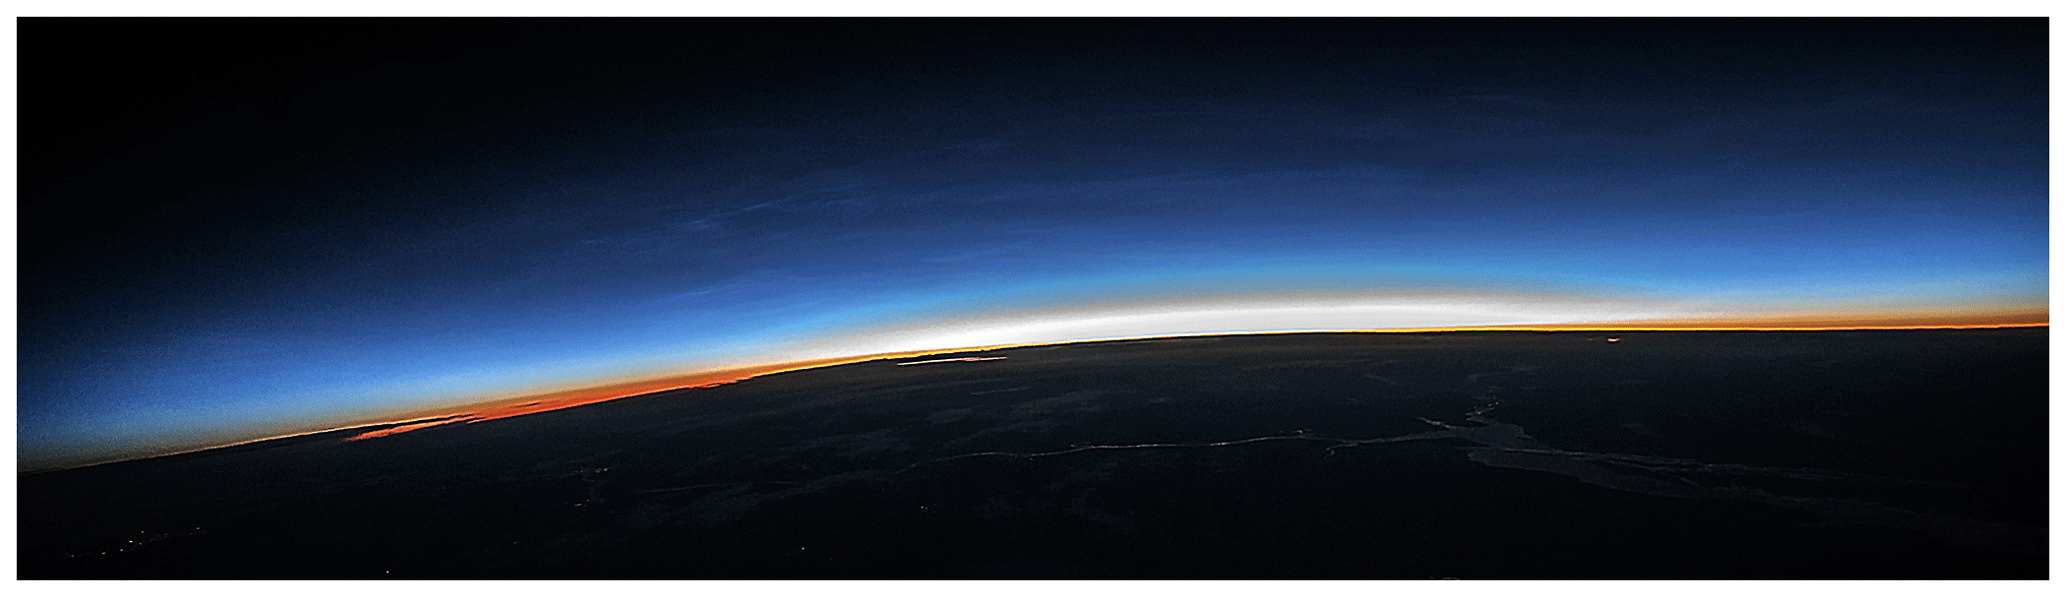
Figure 8The SONC balloon image taken at 20.3 km above the ground at 22:48 UT on 5 July 2018 represents the final stage of NLC evolution on that night.
Detailed analysis of five consecutive (in time) balloon-borne images (Figs. 4 and 5) has revealed the following features of the NLC display.
- a.
The horizontal extent of the NLC field from the western to eastern observable borders was about 1450 km, and from the northern to southern border of about 750 km. Such distances are impossible to observe from the ground due to the Earth's curvature and limited area of the twilight arch. The central part of the NLC field, with an extension of about 850×550 km, was seen from the ground, but the western and eastern wings of the field as well as the northern edge were located below the local ground horizon, making it impossible to observe them. Thus, balloon-borne NLC observations have an obvious great advantage over ground-based observations in terms of larger geographic coverage which is comparable to PMC observations made from space since a PMC observation scene has a spatial coverage of about 2000 km along the AIM satellite track and 1000 km across the track (Rusch et al., 2009).
- b.
The southernmost edge of the NLC field was modulated by partial circles (something like ice voids but with an open southern border), whose centres are shown by the red arrows in Figs. 4 and 5. The diameters of these partial ice voids are estimated to be in the range of 150–250 km. The mechanism of the formation of ice voids in NLCs/PMCs is not clear now, and it is an ongoing topic in atmospheric physics. One can mention three main mechanisms which are currently being discussed in the literature. Trubnikov and Skuratova (1967) addressed a theory of cellular convection and demonstrated its principal possibility in the summer mesosphere in relation to NLC occurrences. The authors estimated convective cells to be in the range of 90–250 km in radius, which agrees well with sizes of partial ice voids obtained in the present study. However, the main criterion for the convection to be developed, namely, the height gradient of the potential temperature, should have negative values. We have carefully estimated the potential temperature gradient or the static stability (based on Aura/MLS temperature measurements) in the analysed area and could not find any signatures of its negative values in the mesosphere and mesopause region. This means that in this particular case cellular convection could not be responsible for the observed partial ice voids in the NLCs.
However, satellite measurements can easily miss a negative static stability at local scales due to poor horizontal resolution, and local ice voids may be generated by a gravity wave breaking. Rusch et al. (2009) have hypothesized that ice voids could be caused by heating due to the passage of warm crests of a gravity wave. It is possible in the present case. However, we could not find any significant displacement of the partial ice voids (their boundaries) relative to the NLC field; i.e. the partial ice voids travelled with the same speed and direction as the entire NLC field did (∼43 m s−1 from south to north). One would expect an intrinsic phase speed and intrinsic direction of the movement of the partial ice voids if they were generated by a large-scale gravity wave of a wavelength of several hundreds of kilometres. Thus, it is difficult to prove this hypothesis of the influence of a large-scale gravity wave on the formation of the observed partial ice voids.
Thurairajah et al. (2013b) have proposed another mechanism related to a shock wave generated by a meteorite, which expands and cools the air and in turn leads to the formation of large ice particles which fall out of an NLC field (analogously to hole-punch clouds due to the passage of an aircraft). However, we observe large-scale partial ice voids (150–250 km) in a broad area of the mesopause over 1000 km. It was hardly possible that any big meteorite could produce such large holes in such a broad area, and we did not observe any meteor motion in our ground-based and balloon images.
Megner et al. (2018) have recently presented an interesting case study of a quasi-stationary ice void in NLCs which did not follow the general wind, suggesting that it was formed by a localized warming at the summer mesopause. This is not the case in our case study, in which we have observed partial ice voids moving at the general wind speed in the same direction along with the entire NLC field.
In the present case study, the partial ice voids had irregular shapes and sizes ranging from 150 to 250 km. Also, these partial voids moved along the wind with the same speed and direction. Thus, it is difficult to connect these partial voids with regular wave disturbances. At the same time, as shown in Fig. 3, the southernmost border of the NLC field was confined to the warm air mass located at sub-polar latitudes of ∼58∘ N and lower. The mesopause temperature at this border was equal to ∼147 K at 86 km altitude. The MLS data cannot reproduce the exact shape of this border due to low horizontal resolution (∼15∘) and a temporal resolution of ∼1.5 h. However, it is well known that tropospheric frontal systems have a meandering shape, sometimes with intrusions of warm and cold air masses as in the case of the formation of a frontal wave cyclone (Ahrens, 1993; Stull, 2000). In our case the warm front at the mesopause and the NLC partial ice voids resemble a tropospheric frontal wave, in which there are intrusions of warm air masses, moving from mid-latitudes, into the cold air mass located at sub-polar and polar latitudes (see Fig. 6). Therefore, we consider that the most probable source of these partial ice voids observed in the NLCs in this particular case is the intrusion of warm air masses into the cold air mass with the NLC field, sublimating ice particles. A similar conclusion was proposed by Thurairajah et al. (2013a), who have analysed a large ice void observed in PMCs (using AIM/CIPS satellite images) and have concluded that “… warmer temperatures (warmer than the frost point temperature of ∼144 K) at the location of the void may be related to increased tidal activity and transport of warm air from low latitudes”. Also, Rusch et al. (2009) and Thurairajah et al. (2013b) have demonstrated that the southernmost borders of PMCs can be highly modulated by partial ice voids of several hundreds of kilometres in diameter, and the authors have found the structural similarity between PMC images and those seen in tropospheric clouds.
- c.
Clear vertical modulation of the NLC layer is shown with the red arrow in Fig. 7. This is a unique view of a particular gravity wave seen at the local horizon of the balloon; that is why this wave modulation is viewed almost at the right angle to the line-of-sight. This geometry allows observation of a thin layer of NLC modulated in altitude by propagating gravity waves of small and medium scales. Such geometry is almost impossible to obtain from the ground since NLCs seen at the very horizon are usually masked by topography, tropospheric clouds, and, most importantly, tropospheric aerosols, which are constantly present and significantly absorb NLC brightness when looking at the very horizon. We have carefully estimated parameters of this particular wave: its horizontal wavelength was equal to 49.4±2.2 km and its amplitude was 1.9±0.1 km. We define this amplitude as a semi-amplitude A of a monochromatic wave with oscillation frequency ω, which is half of the peak-to-peak wave amplitude between the highest (crest) and lowest (trough) displacement values. In this calculation, the angle of 13.3∘ between the camera image plane and vertical plane at the NLC altitude was taken into account. A unique altitude determination based on the balloon images is possible under the assumption that the observed wave amplitude occurred in the vertical plane only and due to the fact that the balloon travelled a small horizontal distance (about 2 m) during a short exposure time of 1∕8 s. Also note that since NLCs are clearly seen both in the crest and trough of the wave (ice particles did not completely sublimate in the wave trough), we have estimated the wave amplitude in both the wave crest and trough. The amplitude estimations are the same in the wave trough and crest (within the given uncertainty). All this makes us confident in the estimation of the amplitude of this particular wave. We have analysed nine images at various viewing angles in order to deduce the maximum vertical displacement (amplitude) of this particular wave. The nine images showing progressive changes in the wave vertical displacement can be found at the following web page: ftp://ftp.irf.se/outgoing/pdalin/NLC/SONC_experiment_2018_07_05/WAVE_AMPLITUDE/, last access: 11 January 2020.
This is the most precise estimation of the amplitude of a gravity wave at the mesopause by using NLC observations (Witt, 1962; Haurwitz and Fogle, 1969; Bronshten and Grishin, 1970; Demissie et al., 2014). Since wave amplitude represents wave energy per unit mass (E ∼ 0.5× A2×ω2), this is an important source of information for estimating the wave energy budget at the upper atmosphere and can also be used for future model studies to estimate a wave source in the lower atmosphere (Demissie et al., 2014).
- d.
Small-scale billow-type gravity waves were estimated to have horizontal wavelengths of 8–11 km (Fig. 7). Such small-scale gravity waves are well known to be observed in NLC layers (Witt, 1962; Dalin et al., 2010; Pautet et al., 2011; Baumgarten and Fritts, 2014; Demissie et al., 2014), but we demonstrate this result in order to emphasize the ability to resolve small-scale NLC structures by using a large FoV camera, with a high-resolution sensor, onboard a sounding balloon.
- e.
Figure 8 illustrates an NLC image taken from an altitude of 20.3 km, which is very close to the maximum reached altitude of 20.4 km. The NLCs were rather faint by that time, which is in line with an idea of the intrusion of warm air masses from mid- to sub-polar latitudes. These large-scale warm air masses led to rapid sublimation of ice particles at large scales of about 1500 km. At the same time, one can see a very interesting feature to be considered. There were several thin parallel gravity wave bands (stripes) with lengths of 50–200 km and widths of ∼3–5 km in cross section. The reasons for seeing such thin stripes are as follows. (a) The SONC balloon was in the stratosphere, i.e. above the troposphere, in which optically strong air turbulence is constantly present. (b) The exposure time of this image was very short at 1∕125 s. All this made the image free from blurring (as little blurring as possible for moving NLCs and balloon motion). This image demonstrates a final stage of the NLC evolution (NLCs disappeared in 20 min after the image was taken), and these thin stripes might represent a final morphological state of the NLC evolution. Further balloon-borne NLC observations of very faint NLCs are required to confirm this consideration.
The combination of high-resolution images (∼30 m) and large geographic coverage (over 1500 km) is a unique property intrinsic to stratospheric balloon-borne NLC observations, which is impossible to achieve from either the ground or space. In general, a balloon-borne NLC observation provides us with the following new opportunities in the case of a long-duration flight of several days.
- a.
NLC images can be obtained for 24 h a day and during several days due to very little Rayleigh atmospheric scattering in the visible subrange of the spectrum above 20 km (Hughes, 1964).
- b.
Quantitative information on a wide range of waves (gravity and planetary waves, solar tides) propagating through the summer mesopause can be obtained.
- c.
Neutral wind velocity at the mesopause and large-scale trajectory of NLC fields over 1500 km can be measured.
- d.
Quantitative information on long mesospheric fronts, solitons, and other non-linear processes can be obtained.
- e.
Quantitative information on small-scale turbulent structures (down to 1 m) can be obtained in the case of using a narrow field-of-view lens.
- f.
A high-resolution vertical NLC structure (wave modulation, double layers) can be retrieved by observing NLCs at the very horizon. The absence of any terrain obstacles and tropospheric aerosol loading makes such stratospheric NLC observations unique.
- g.
The absence of optically strong tropospheric turbulence makes NLC images free from atmospheric blurring that in turn results in well-defined fine structures of gravity waves and turbulence in the mesopause region.
In the present study, we have estimated the following characteristics of the NLC field.
- a.
The horizontal extent of the NLC field as seen from the SONC balloon was about 1450×750 km, whereas it was about 800×550 km as seen from the ground. This emphasizes the great advantage of making large-scale balloon-borne observations over medium-scale ground-based ones.
- b.
The NLC field was travelling from south to north at a mean velocity of 43 m s−1.
- c.
The southernmost edge of the NLC field was modulated by partial ice voids of 150–250 km in diameter, which were likely generated by the intrusion of warm air masses moving from mid- to sub-polar latitudes. The mesopause temperature at this edge was equal to ∼147 K; i.e. it was a threshold temperature separating the mesopause region filled with NLCs from the warm area without NLCs.
- d.
A medium-scale wave had a wavelength of 49.4±2.2 km and a vertical amplitude of 1.9±0.1 km. This is the most precise estimation of a gravity wave amplitude ever made.
- e.
Small-scale billow-type gravity waves had wavelengths of 8–11 km.
- f.
The final morphology state of the NLC evolution was represented by thin parallel gravity wave stripes with lengths of 50–200 km and widths of ∼3–5 km.
The reader can access the SONC experiment images and balloon GPS coordinates, used in the paper, via a publicly available project ftp server at the Swedish Institute of Space Physics: ftp://ftp.irf.se/outgoing/pdalin/NLC/SONC_experiment_2018_07_05/ (Luspa, 2020).
PD wrote the paper, made calculations, and plotted the figures. NP and VP read and made suggestions appropriated for the paper. DE provided the raw balloon-borne images and balloon GPS coordinates. VR contributed to the image processing. All the authors read and commented regarding the work and agreed with the content and submission of this paper.
The authors declare that they have no conflict of interest.
The authors are grateful to Nikolay Gusev, Andrey Reshetnikov, Alexander Dalin, and Olga Dalina for their support of ground-based NLC observations during the SONC experiment. The Aura/MLS data version 4.23 were obtained from the NASA Goddard Space Flight Center Data and Information Services Center: https://disc.gsfc.nasa.gov/datasets/ML2T_004/summary?keywords=aura, last access: 12 January 2020.
This research has been partly supported by the Russian Foundation for Basic Research (grant no. 15-05-04975a).
This paper was edited by Petr Pisoft and reviewed by three anonymous referees.
Ahrens, C. D.: Essentials of meteorology: an invitation to the atmosphere, West Publishing Company, St. Paul, 438 pp., 1993.
Bailey, S. M., Thomas, G. E., Rusch, D. W., Merkel, A. W., Jeppesen, C., Carstens, J. N., Randall, C. E., McClintock, W. E., and Russell III, J. M.: Phase functions of polar mesospheric cloud ice as observed by the CIPS instrument on the AIM satellite, J. Atmos. Sol.-Terr. Phys., 71, 373–380, https://doi.org/10.1016/j.jastp.2008.09.039, 2009.
Baumgarten, G. and Fritts, D. C.: Quantifying Kelvin-Helmholtz instability dynamics observed in noctilucent clouds: 1. Methods and observations, J. Geophys. Res.-Atmos., 119, 9324–9337, https://doi.org/10.1002/2014JD021832, 2014.
Baumgarten, G., Fiedler, J., Fricke, K. H., Gerding, M., Hervig, M., Hoffmann, P., Müller, N., Pautet, P.-D., Rapp, M., Robert, C., Rusch, D., von Savigny, C., and Singer, W.: The noctilucent cloud (NLC) display during the ECOMA/MASS sounding rocket flights on 3 August 2007: morphology on global to local scales, Ann. Geophys., 27, 953–965, https://doi.org/10.5194/angeo-27-953-2009, 2009.
Bronshten, V. A. and Grishin, N. I.: Noctilucent clouds, Nauka, Moscow, 359 pp., 1970.
Chandran, A., Rusch, D. W., Palo, S. E., Thomas, G. E., and Taylor, M. J.: Gravity wave observations in the summertime polar mesosphere from the Cloud Imaging and Particle Size (CIPS) experiment on the AIM spacecraft, J. Atmos. Sol.-Terr. Phys., 71, 392–400, https://doi.org/10.1016/j.jastp.2008.09.041, 2009.
Dalin, P., Kirkwood, S., Moström, A., Stebel, K., Hoffmann, P., and Singer, W.: A case study of gravity waves in noctilucent clouds, Ann. Geophys., 22, 1875–1884, https://doi.org/10.5194/angeo-22-1875-2004, 2004.
Dalin, P., Pertsev, N., Zadorozhny, A., Connors, M., Schofield, I., Shelton, I., Zalcik, M., McEwan, T., McEachran, I., Frandsen, S., Hansen, O., Andersen, H., Sukhodoev, V., Perminov, V., and Romejko, V.: Ground-based observations of noctilucent clouds with a northern hemisphere network of automated digital cameras, J. Atmos. Sol.-Terr. Phys., 70, 1460–1472, 2008.
Dalin, P., Pertsev, N., Frandsen, S., Hansen, O., Andersen, H., Dubietis, A., and Balciunas, R.: A case study of the evolution of a Kelvin-Helmholtz wave and turbulence in noctilucent clouds, J. Atmos. Sol.-Terr. Phys., 72, 1129–1138, https://doi.org/10.1016/j.jastp.2010.06.011, 2010.
Dalin, P., Connors, M., Schofield, I., Dubietis, A., Pertsev, N., Perminov, V., Zalcik, M., Zadorozhny, A., McEwan, T., McEachran, I., Grønne, J., Hansen, O., Andersen, H., Frandsen, S., Melnikov, D., Romejko, V., and Grigoryeva, I.: First common volume ground-based and space measurements of the mesospheric front in noctilucent clouds, Geophys. Res. Lett., 40, 6399–6404, https://doi.org/10.1002/2013GL058553, 2013.
Dalin, P., Pogoreltsev, A., Pertsev, N., Perminov, V., Shevchuk, N., Dubietis, A., Zalcik, M., Kulikov, S., Zadorozhny, A., Kudabayeva, D., Solodovnik, A., Salakhutdinov, G., and Grigoryeva, I.: Evidence of the formation of noctilucent clouds due to propagation of an isolated gravity wave caused by a tropospheric occluded front, Geophys. Res. Lett., 42, 2037–2046, https://doi.org/10.1002/2014GL062776, 2015.
Dalin, P., Pertsev, N., Perminov, V., Efremov, D., and Romejko, V.: Looking at “night-shining” clouds from the stratosphere, Eos, 100, 4 pp., doi/10.1029/2019EO118439, 2019.
Dalin, P., Perminov, V., Pertsev, N., and Romejko, V.: Updated long-term trends in mesopause temperature, airglow emissions and noctilucent clouds, J. Geophys. Res.-Atmos., https://doi.org/10.1029/2019JD030814, 2020.
DeLand, M. T. and Thomas, G. E.: Updated PMC trends derived from SBUV data, J. Geophys. Res.-Atmos., 120, 2140–2166, https://doi.org/10.1002/2014JD022253, 2015.
Demissie, T. D., Espy, P. J., Kleinknecht, N. H., Halten, M., Kaifler, N., and Baumgarten, G.: Characteristics and sources of gravity waves observed in noctilucent cloud over Norway, Atmos. Chem. Phys., 14, 12133–12142, https://doi.org/10.5194/acp-14-12133-2014, 2014.
Dubietis, A., Dalin, P., Balciunas, R., Cernis, K., Pertsev, N., Sukhodoev, V., Perminov, V., Zalcik, M., Zadorozhny, A., Connors, M., Schofield, I., McEwan, T., McEachran, I., Frandsen, S., Hansen, O., Andersen, H., Grønne, J.,Melnikov, D., Manevich, A., and Romejko, V.: Noctilucent clouds: modern ground-based photographic observations by a digital camera network, Appl. Optics, 50, F72–F79, https://doi.org/10.1364/AO.50.000F72, 2011.
Fiedler, J., Baumgarten, G., Berger, U., Hoffmann, P., Kaifler, N., and Lübken, F.-J.: NLC and the background atmosphere above ALOMAR, Atmos. Chem. Phys., 11, 5701–5717, https://doi.org/10.5194/acp-11-5701-2011, 2011.
Fritts, D. C., Isler, J. R., Thomas, G. E., and Andreassen, Ø.: Wave breaking signatures in noctilucent clouds, Geophys. Res. Lett., 20, 2039–2042, https://doi.org/10.1029/93GL01982, 1993.
Fritts, D. C., Miller, A. D., Kjellstrand, C. B., Geach, C., Williams, B. P., Kaifler, B., Kaifler, N., Jones, G., Rapp, M., Limon, M., Reimuller, J., Wang, L., Hanany, S., Gisinger, S., Zhao, Y., Stober, G., and Randall, C. E.: PMC Turbo: Studying gravity wave and instability dynamics in the summer mesosphere using polar mesospheric cloud imaging and profiling from a stratospheric balloon, J. Geophys. Res.-Atmos., 124, 21 pp., https://doi.org/10.1029/2019JD030298, 2019.
Froidevaux, L., Livesey, N. J., Read, W. G., Jiang, Y. B., Jiménez, C. C., Filipiak, M. J., Schwartz, M. J., Santee, M. L., Pumphrey, H. C., Jiang, J. H., Wu, D. L., Manney, G. L., Drouin, B. J., Waters, J. W., Fetzer, E. J., Bernath, P. F., Boone, C. D., Walker, K. A., Jucks, K. W., Toon, G. C., Margitan, J. J., Sen, B., Webster, C. R., Christensen, L. E., Elkins, J. W., Atlas, E., Lueb, R. A., and Hendershot, R.: Early validation analyses of atmospheric profiles from EOS MLS on the Aura satellite, IEEE Trans. Geosci. Remote Sens., 44, 1106–1121, 2006.
Gadsden, M. and Schröder, W.: Noctilucent Clouds, Springer, New York, 165 pp., 1989.
Gumbel, J. and Witt, G.: Rocket-borne photometry of NLC particle populations, Adv. Space Res., 28, 1053–1058, 2001.
Haurwitz, B. and Fogle, B.: Wave forms in noctilucent clouds, Deep-Sea Res., 16, 85–95, 1969.
Hughes, J. V.: Sky brightness as a function of altitude, Appl. Optics, 3, 10, 1135–1138, 1964.
Hultgren, K., Körnich, H., Gumbel, J., Gerding, M., Hoffmann, P., Lossow, S., and Megner, L.: What caused the exceptional mid-latitudinal Noctilucent Cloud event in July 2009, J. Atmos. Sol.-Terr. Phys., 73, 2125–2131, 2011.
Karlsson, B. and Gumbel, J.: Challenges in the limb retrieval of noctilucent cloud properties from Odin/OSIRIS, Adv. Space Res., 36, 935–942, https://doi.org/10.1016/j.asr.2005.04.074, 2005.
Kirkwood, S. and Stebel, K.: Influence of planetary waves on noctilucent clouds occurrence over NW Europe, J. Geophys. Res., 108, 8440, https://doi.org/10.1029/2002JD002356, 2003.
Liu, X., Yue, J., Xu, J., Yuan, W., Russell III, J.M., Hervig, M. E., and Nakamura, T.: Persistent longitudinal variations in 8 years of CIPS/AIM polar mesospheric clouds, J. Geophys. Res.-Atmos., 121, 8390–8409, https://doi.org/10.1002/2015JD024624, 2016.
Luspa, M.: Project ftp server of the Swedish Institute of Space Physics, available at: ftp://ftp.irf.se/outgoing/pdalin/NLC/SONC_experiment_2018_07_05/, last access: 12 January 2020.
Megner, L., Stegman, J., Pautet, P.-D., and Taylor, M. J.: First observed temporal development of a noctilucent cloud ice void, Geophys. Res. Lett., 45, 8 pp., https://doi.org/10.1029/2018GL078501, 2018.
Miller, A. D., Fritts, D. C., Chapman, D., Jones, G., Limon, M., Araujo, D., Didier, J., Hillbrand, S., Kjellstrand, C. B., Korotkov, A., Tucker, G., Vinokurov, Y., Wan, K., and Wang, L.: Stratospheric imaging of polar mesospheric clouds: a new window on small-scale atmospheric dynamics, Geophys. Res. Lett., 42, 6058–6065, https://doi.org/10.1002/2015GL064758, 2015.
Pautet, P.-D., Stegman, J., Wrasse, C. M., Nielsen, K., Takahashi, H., Taylor, M. J., Hoppel, K. W., and Eckermann, S. D.: Analysis of gravity waves structures visible in noctilucent cloud images, J. Atmos. Sol.-Terr. Phys., 73, 2082–2090, https://doi.org/10.1016/j.jastp.2010.06.001, 2011.
Pertsev, N., Dalin, P., and Perminov, V.: Influence of semidiurnal and semimonthly lunar tides on the mesopause as observed in hydroxyl layer and noctilucent clouds characteristics, Geomagn. Aeron., 55, 811–820, https://doi.org/10.1134/S0016793215060109, 2015.
Rapp, M., Lübken, F.-J., Müllemann, A., Thomas, G., and Jensen, E.: Small scale temperature variations in the vicinity of NLC: experimental and model results, J. Geophys. Res., 107, 4392, https://doi.org/10.1029/2001JD001241, 2002.
Reichborn-Kjennerud, B., Aboobaker, A. M., Ade, P., Aubin, F., Baccigalupi, C., Bao, C., Borrill, J., Cantalupo, C., Chapman, D., Didier, J., Dobbs, M., Grain, J., Grainger, W., Hanany, S., Hillbrand, S., Hubmayr, J., Jaffe, A., Johnson, B., Jones, T., Kisner, T., Klein, J., Korotkov, A., Leach, S., Lee, A., Levinson, L., Limon, M., MacDermid, K., Matsumura, T., Meng, X., Miller, A., Milligan, M., Pascale, E., Polsgrove, D., Ponthieu, N., Raach, K., Sagiv, I., Smecher, G., Stivoli, F., Stompor, R., Tran, H., Tristram, M., Tucker, G. S., Vinokurov, Y., Yadav, A., Zaldarriaga, M., and Zilic, K.: EBEX: A balloon-borne CMB polarization experiment, Proceedings of SPIE, Millimeter, Submillimeter and Far-Infrared Detectors and Instrumentation for Astronomy V, San Diego, California, USA, 29 June–July 2010, Soc. of Photo-Opt. Instrum. Eng. (SPIE) Conf. Ser., 7741, edited by: Holland, W. S. and Zmuidzinas, J., SPIE, Bellingham, Wash, https://doi.org/10.1117/12.857138, 2010.
Reimuller, J. D., Thayer, J. P., Baumgarten, G., Chandran, A., Hulley, B., Rusch, D., Nielsen, K., and Lumpe, J.: Synchronized imagery of noctilucent clouds at the day-night terminator using airborne and spaceborne platforms, J. Atmos. Sol.-Terr. Phys., 73, 2091–2096, 2011.
Rusch, D. W., Thomas, G. E., McClintock, W., Merkel, A. W., Bailey, S. M., Russell III, J. M., Randall, C. E., Jeppesen, C., and Callan, M.: The cloud imaging and particle size experiment on the aeronomy of ice in the mesosphere mission: cloud morphology for the northern 2007 season, J. Atmos. Sol.-Terr. Phys., 71, 356–364, 2009.
Schwartz, M. J., Lambert, A., Manney, G. L., Read, W. G., Livesey, N. J., Froidevaux, L., Ao, C. O., Bernath, P. F., Boone, C. D., Cofield, R. E., Daffer, W. H., Drouin, B. J., Fetzer, E. J., Fuller, R. A., Jarnot, R. F., Jiang, J. H., Jiang, Y. B., Knosp, B. W., Kruger, K., Li, J.-L. F., Mlynczak, M. G., Pawson, S., Russell III, J. M., Santee, M. L., Snyder, W. V., Stek, P. C., Thurstans, R. P., Tompkins, A. M., Wagner, P. A., Walker, K. A., Waters, J. W., and Wu, D. L.: Validation of the Aura Microwave Limb Sounder temperature and geopotential height measurements, J. Geophys. Res., 113, D15S11, https://doi.org/10.1029/2007JD008783, 2008.
Stull, R. B.: Meteorology for scientists and engineers, Second Edition, Brooks/Cole, Pacific Grove, 502 pp., 2000.
Suzuki, H., Sakanoi, K., Nishitani, N., Ogawa, T., Ejiri, M. K., Kubota, M., Kinoshita, T., Murayama, Y., and Fujiyoshi, Y.: First imaging and identification of a noctilucent cloud from multiple sites in Hokkaido (43.2–44.4∘ N), Japan, Earth Planet. Space, 68, 182–189, https://doi.org/10.1186/s40623-016-0562-6, 2016.
Taylor, M. J., Pautet, P.-D., Zhao,Y., Randall, C. E., Lumpe, J., Bailey, S. M., Carstens, J., Nielsen, K., Russell III, J. M., and Stegman, J.: High-latitude gravity wave measurements in noctilucent clouds and polar mesospheric clouds, in: Aeronomy of the Earth's Atmosphere and Ionosphere, edited by: Abdu, M. and Pancheva, D., IAGA Special Sopron Book Series, Springer, Dordrecht, 2, 93–105, https://doi.org/10.1007/978-94-007-0326-1_7, 2011.
Thomas, G. E.: Solar Mesosphere Explorer measurements of polar mesospheric clouds (noctilucent clouds), J. Atmos. Terr. Phys., 46, 819–824, 1984.
Thurairajah, B., Bailey, S. M., Siskind, D. E., Randall, C. E., Taylor, M. J., and Russell III, J. M.: Case study of an ice void structure in polar mesospheric clouds, J. Atmos. Sol.-Terr. Phys., 104, 224–233, https://doi.org/10.1016/j.jastp.2013.02.001, 2013a.
Thurairajah, B., Bailey, S. M., Nielsen, K., Randall, C. E., Lumpe, J., Taylor, M. J., and Russell III, J. M.: Morphology of polar mesospheric clouds as seen from space, J. Atmos. Sol.-Terr. Phys., 104, 234–243, 2013b.
Trubnikov, B. N. and Skuratova, I. S.: Cellular convection in the zone of noctilucent clouds, Proceedings of the International Symposium on Noctilucent Clouds, Tallinn, 1966, edited by: Khvostikov, I. A. and Witt, G., VINITI, Moscow, 208–215, 1967.
Witt, G.: Height, structure and displacements of noctilucent clouds, Tellus, 14, 1–18, 1962.
Zadorozhny, A. M., Tyutin, A. A., Witt, G., Wilhelm, N., Wälchli, U., Cho, J. Y. N., and Swartz, W. E.: Electric field measurements in the vicinity of noctilucent clouds and PMSE, Geophys. Res. Lett., 20, 2299–2302, 1993.