the Creative Commons Attribution 4.0 License.
the Creative Commons Attribution 4.0 License.
On the magnetic characteristics of magnetic holes in the solar wind between Mercury and Venus
Charlotte Goetz
Ferdinand Plaschke
Tomas Karlsson
Daniel Heyner
Brian Anderson
The occurrence rate of linear and pseudo magnetic holes has been determined during MESSENGER's cruise phase starting from Venus (2007) and arriving at Mercury (2011). It is shown that the occurrence rate of linear magnetic holes, defined as a maximum of 10∘ rotation of the magnetic field over the hole, slowly decreases from Mercury to Venus. The pseudo magnetic holes, defined as a rotation between 10 and 45∘ over the hole, have mostly a constant occurrence rate.
- Article
(2902 KB) - Full-text XML
- BibTeX
- EndNote
The interplanetary magnetic field (IMF) shows various kinds of structures and discontinuities on different scales (see e.g. Burlaga, 1969; Burlaga et al., 1969), such as large-scale section boundaries, coronal mass ejections (CMEs), and corotational interaction regions (CIRs); middle-scale reconnection exhausts; and small-scale waves and turbulence. On the small-scale side Turner et al. (1977) found that there were depressions in the IMF strength with in an average field of , in the form of discrete “holes” (1γ=1 nT). The rotation of the background magnetic field was very small from one side of the hole to the other. This set them apart from regular current sheets, and these so-called “linear holes” were assumed to be some diamagnetic structure created by inhomogeneities in the solar wind plasma, although the plasma data were of an insufficient rate to determine that for sure. It is these linear holes, or magnetic holes (MHs), that are the topic of this paper.
The origin of these structures has been studied, and e.g. Stevens and Kasper (2007) found that they occur mainly when the plasma-β of the solar wind is high. This makes MHs related to structures that look similar, namely mirror mode (MM) waves, which are also characterized by magnetic depressions, usually in a “train” of structures, for high-β plasmas with a temperature asymmetry (Gary et al., 1993), specifically, when RSK>1 (Southwood and Kivelson, 1993) with
and
Interestingly, Stevens and Kasper (2007) found that the magnetic holes mainly occurred in MM stable environments. They argue that the non-linear development of MMs may result in MHs in MM stable regions. Indeed, Hasegawa and Tsurutani (2011) proposed a turbulent diffusion model for the development of MMs (Bohm-like diffusion, Bohm et al., 1949), where the higher frequencies of the structure diffuse out. Thereby smaller MMs will disappear, whilst larger MMs tend to grow in size as they are transported away by the plasma flow from their generation region. Using data from Venus Express at Venus and Giotto at comet 1P/Halley, Schmid et al. (2014) showed that the sizes of MMs indeed increase when the spacecraft is further away from the assumed generation region.
Buti et al. (2001) presented another generation mechanism based on presence of large-amplitude, right-handed Alfvén wave packages, observed in the solar wind to propagate at large angles with respect to the background magnetic field. Using hybrid simulations they show that these Alfvén wave packages develop into MHs in plasma regions where there is a high plasma-β, Te<Ti and , through the creation of plasma inhomogeneities.
In order to find out a possible origin region for and the development of MHs in the solar wind and their occurrence rate, the cruise phase of the MESSENGER (MErcury Surface, Space ENvironment, GEochemistry, and Ranging, Solomon et al., 2007) spacecraft on its way from the Earth to Mercury is studied. Several studies have discussed the occurrence rate of MHs (or MMs) in the solar wind. Turner et al. (1977) found an occurrence rate of MHs of 1.5 d−1 near Earth using Explorer 43 (Imp I) data. Zhang et al. (2008) used Venus Express data near Venus to find an occurrence rate of MMs of 4.5 d−1. Stevens and Kasper (2007) used Wind data to obtain a rate of 1 MH per 1.75 d. Briand et al. (2010) used both Cluster (between 2002 and 2005) and found 65 MH of which 45 were linear holes, and also STEREO (between March 2007 and August 2009), and found there were 146 well-defined structures of which 38 % were linear MHs.
Further out in the solar system MHs were found with the Ulysses mission, where Winterhalter et al. (2000) found at high solar latitude an occurrence rate of 5.2 d−1, whereas Burlaga et al. (2007) used Voyager 1 data from 2006 when the spacecraft was located in the heliosheath and found an occurrence of 2 MH d−1. Sperveslage et al. (2000) found various occurrence rates as they studied the solar wind from 0.3 to 17 AU, with different space missions: from Helios 1 and 2 1.7–2.2 d−1, and from Voyager 2 between 2 and 17 AU an average value of 0.2 d−1 but with a decreasing trend from 0.2 d−1 between 2 and 4 AU to 0.1 d−1 beyond 11 AU. Naturally one needs to be careful when comparing all these different occurrence rates as not all papers use the same criteria to determine the presence of MHs.
For MESSENGER's orbital phase Karlsson et al. (2016) studied isolated magnetic structures, which could be interpreted as magnetic holes. However, they found that there were both “negative” and “positive” magnetic structures (i.e. decreases and increases in magnetic field strength respectively). Interestingly, the positive structures were only observed in the magnetosheath and were not present in the solar wind. It is not uncommon to find a combination of peaks and troughs in the magnetosheath, where these structures develop from the mirror mode instability. Joy et al. (2006) showed how there was a development from troughs to peaks in the Jovian magnetosheath. However, in the Hermean magnetosheath Karlsson et al. (2016) identify the positive structures as flux transfer events as many are associated with a bipolar field signature. The negative structures had and a duration of 2 s s, with no real difference between solar wind and magnetosheath events.
This study is performed using the MESSENGER magnetometer data (Anderson et al., 2007) during the cruise phase of the mission from Venus to Mercury (2007–2011). The data have a resolution of 1 s and are in heliocentric, Cartesian J2000 coordinates1.
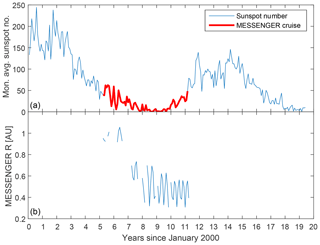
There are almost continuous data for the cruise phase, as can be seen in Fig. 1, where the different years of the cruise are plotted in different colours and the circles show the locations of where magnetic holes are observed, and in Fig. 2b, where the radial distance of MESSENGER from the Sun is plotted over time.
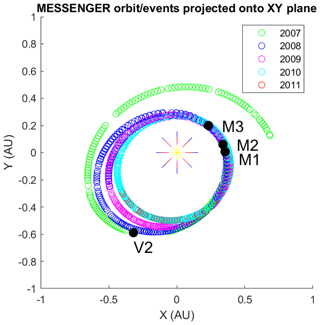
Figure 1The cruise phase of MESSENGER projected onto the XYJ2000 plane with different colours for different years and the locations of the second Venus flyby (V2) and the three Mercury flybys (M1/2/3). The circles denote the locations at which magnetic holes are observed.
The magnetic field data are investigated for the presence of magnetic holes. In this paper the same method is used as in Plaschke et al. (2018). A short recap is as follows.
-
The background magnetic field strength is determined by a sliding window average over 300 s: B300.
-
The data are smoothed by a sliding window average over 2 s: B2.
-
From the ratio time series ΔB∕B300, the lowest depressions are preselected that are separated by at least 300 s.
-
The total magnetic field strength is B300>2 nT.
-
The depth of the structure is .
Out of the 5 years of data, this results in an identification of 6897 structures, of which the full width at half maximum (FWHM, in seconds) is determined and the depth in ΔB∕B300. Using the location of MESSENGER in interplanetary space at a resolution of 1 h, we can determine an estimate of the dwelling time of the spacecraft at a certain radial distance from the Sun.
One more restriction needs to be put onto the MH events: the rotation of the magnetic field should be small over the structure. In order to check this, the average magnetic field is determined by the time interval before the structure, Bbef during , and after the structure, Baft during , where t0 is the location of the structure and δt is the FWHM of the structure. The rotation angle is then determined by . In Fig. 3 an example of a MH structure with Θ<10∘ is shown. Fig. 3a shows total magnetic field Bm in black and the two filtered magnetic fields B300 and B2 in red and green respectively. Then the three (unfiltered) components of the magnetic field are plotted and in Fig. 3e ΔB∕B300 is shown. It should be noted that in the interval shown here, there are two magnetic holes, separated by less than 300 s, which means that this is counted as one event in our statistics. We address a possible error that is caused by this at the end of the discussion section.
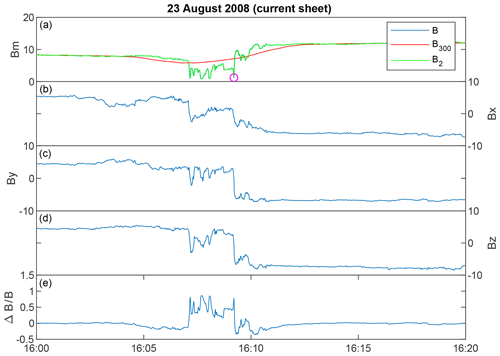
Figure 4 shows an example of a structure with Θ>170∘ in the same way as Fig. 3. The rotation over the structure indicates a current sheet (CS) instead of an MH, which is also clear from the magnetic field components shown in panels (b)–(d), which all change sign.
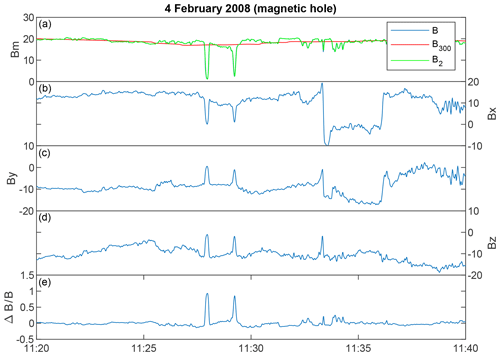
Figure 3Two magnetic holes on 4 February 2008 between 11:25 and 11:30 UT with rotation over the structure Θ<10∘ and depth . Panel (a) shows the magnetic field magnitude full resolution (blue), B300 (red), and B2 (green). Panels (b)–(d) show the unfiltered magnetic field components Bx, By, and Bz. Panel (e) shows the ΔB∕B300. Note that this time interval would count as one event even though two holes can be seen, which have a separation of ∼2 min.
The solar wind magnetic field varies with distance from the Sun, decreasing in strength the further from the Sun, in an approximately R−1 dependence. In Fig. 5 a 2-D histogram of the occurrence rate of the mean magnetic field strength is shown as a function of R, for the cruise phase between Venus and Mercury. Th usually assumed R−1 dependence of the interplanetary magnetic field is overplotted with a white line showing nT.
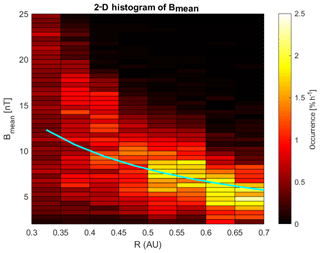
Figure 52-D histogram of the mean magnetic field as a function of R for the whole cruise mission. The bins are 0.05 AU in R and 0.5 nT for B. The cyan curve shows nT.
In this study, unlike studies during the orbital phase of MESSENGER (e.g. Karlsson et al., 2016), there is no need to discuss the influence of solar activity, as can be seen in Fig. 2a. The blue line shows the monthly averaged sunspot number and the red line shows the cruise phase, which is all the way in very low solar activity, although, during the orbital phase of the mission, there is little dependence between the number of observed magnetic holes and the sunspot number (Karlsson et al., 2019).
The occurrence rate of the MHs as a function of radial distance from the Sun is studied first. Therefore, the region AU is binned into bins of 0.05 AU. For each bin the number of magnetic holes and the dwelling time was determined, after which the ratio of the two gives the occurrence rate per hour. The histogram is given in Fig. 6, where the data are also split up into rotational bins: Θ≤10∘, 10∘ < Θ≤45∘, 45∘ < Θ≤90∘, 90∘ < Θ≤135∘, 135∘ < Θ≤180∘.
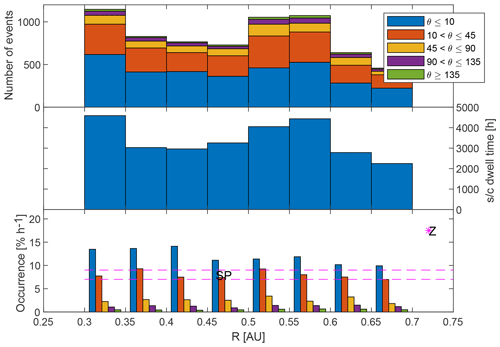
Figure 6Histogram of the occurrence rate of MHs as a function of radial distance and colour coded after the rotational bins as given in the legend. For each category the single count statistical error is determined and plotted as an error bar. The magenta asterisks in the bottom panel show the occurrence rate near Venus (Zhang et al., 2008, Z). The two dashed magenta lines are the average Helios occurrence rate (Sperveslage et al., 2000, SP).
On average there is a 21.9±5.5 % chance to observe a structure, in 1 h, which relates to ∼5.6 d−1, although there are variations in the bins. In Fig. 6 the colour coding shows the various rotation angle ranges defined above, and the results from other studies have also been added translated into a rate in % h−1.
4.1 Linear MHs
For the linear MHs (LMHs), i.e. Θ≤10∘, the average occurrence rate is 9.0 % h−1 with a standard deviation of 3.5 % h−1, which means ∼2.2 MH d−1. There is a clear slow decrease in the occurrence rate from Mercury to Venus. In the discussion section this is looked at in more detail.
For the LMHs a 2-D histogram of the occurrence rate of the width (FWHM) and the depth of the LMHs is shown in Fig. 7. The widths of the LMHs show that they have mainly a width between 15 and 30 s.
The physical size of the LMHs, assuming a solar wind vsw=350 km s−1, would then be ≤ 10 000 km. With an assumed magnetic field strength near Mercury of ∼10 nT and , this would correspond to ∼ 13–28 proton gyro radii. The depths of the LMHs as shown in Fig. 7 are spread up to 0.85, with the highest counts in the lower depth bins.
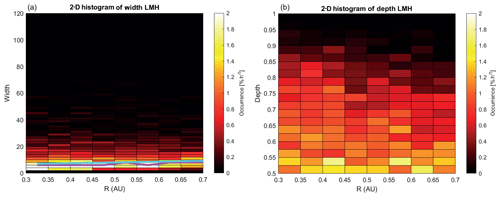
Figure 72-D histogram of the occurrence rate of (a) the width (in seconds) and (b) the depth of the LMHs as a function of radial distance from the Sun. In panel (a) the green line shows the maximum occurrence rate in each radial bin and the cyan line shows the increase in width of LMHs as observed by Sperveslage et al. (2000).
4.2 “Pseudo” MHs
“Pseudo” MHs (PMHs) in this paper are defined as the structures with a slightly larger rotation of the magnetic field, i.e. 10∘ < Θ≤45∘, the orange part in Fig. 6. The average occurrence rate of these structures is 7.9 % h−1 with a standard deviation of 2.6 % h−1, which means ∼1.9 PMH d−1. In this case, the occurrence rate is relatively constant.
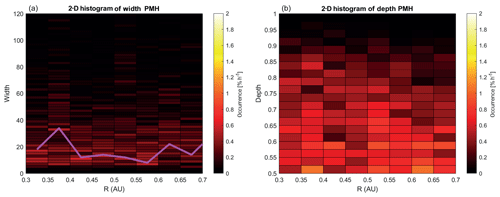
Figure 82-D histogram of the occurrence rate of (a) the width (in seconds) and (b) the depth of the PMHs as a function of radial distance from the Sun. In panel (a) the green line shows the maximum occurrence rate in each radial bin.
In Fig. 8 the same 2-D histograms for the width and the depth of the PMHs are shown as for the LMHs. It is clear that the spread in the width is larger for these structures: the highest occurrence rates are between 15 and 60 s. For the depth the highest occurrence rates are found below 0.7.
The mirror instability, Eq. (1), is dependent on and thus on the background magnetic field strength and the plasma parameters. In the case of MESSENGER there are no directly available plasma data for the cruise phase and, therefore, the events are only studied as a function of the background magnetic field B300 for both the width and the depth of the structures.
In Figs. 9a and 10a the width of the MHs is shown as a function of the magnetic field strength, on which the 25th (blue), 50th (green), 75th (blue), and 97.5th (yellow) percentiles are overplotted. It is clear that for the LMHs the majority of the events are all below 40 s with a very narrow region between the lower and upper quartiles (blue lines), with the median around 10 s.
This is different for the PMHs, which have a much larger and broader width, the median varies between 20 and 60 s, and the spread between the lower and upper quartiles is much broader than for the LMHs. The median, whilst oscillating, actually slowly decreases with increasing magnetic field strength. Also, the maximum width (yellow) is much larger for PMHs.
There seems to be a broadening of the distribution of the depth of the linear MHs as a function of B. In the 2-D histogram an exponential fit was made to the approximate boundary of the high occurrence rate, where for B=1 nT a depth of 0.5 was assumed. This resulted in the green line with with , nT−1, and .
Qu et al. (2007) discussed the gyro-kinetic model of the MM instability and found growth rates of the order of , where Ωi is the ion cyclotron frequency. Based on only linear growth of the structures this would indicate that for stronger B stronger MMs can be expected; however, it should be expected that non-linear behaviour will set in at some point.
Similarly for the PMHs, Fig. 10 shows that the spread in width is broader than for the LMHs, but again with a larger width for stronger B, although there is also a broader distribution for lower magnetic field strengths up to 5 nT. The distribution of the depth is also broader for the lower magnetic field strengths; however, the green exponential curve seems to fit the strongest occurrence rates also rather well.
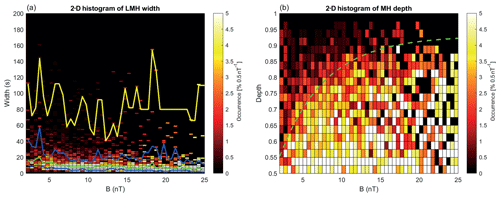
Figure 92-D histogram of the occurrence rate of (a) the width (in seconds) and (b) the depth of the linear MHs as a function of the background magnetic field strength. In panel (a) the 25th (blue), 50th (green), 75th (blue), and 97.5th (yellow) percentiles are shown. In panel (b) the dashed green line is an exponential fit to the approximate upper boundary of the depth of the structures.
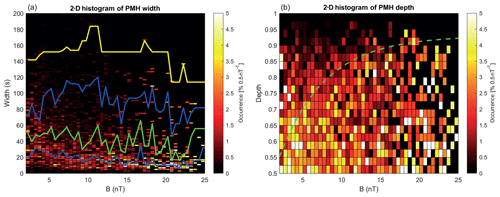
Figure 102-D histogram of the occurrence rate of (a) the width (in seconds) and (b) the depth of the pseudo MHs as a function of the background magnetic field strength. In panel (a) the 25th (blue), 50th (green), 75th (blue), and 97.5th (yellow) percentiles are shown. In panel (b) the dashed green line is the exponential fit to the approximate upper boundary of the depth of the structures from the LHMs in Fig. 9.
This paper only discusses part of the cruise phase of MESSENGER from Earth to Mercury. This is due to strong, spacecraft-produced, disturbances of the magnetic field data between Earth and Venus, before the spacecraft was rotated such that its Sun shield was pointed towards the Sun. Because of the chaotic nature of the disturbances, calibration of the data is not possible (see also p. 14 in Korth and Anderson, 2016).
There are few papers that discuss the development of the MHs as they are transported by the solar wind in interplanetary space. Sperveslage et al. (2000) used the Helios 1 and 2 data to search for MHs in the region between Mercury and Earth, similar to what was done in this paper with the MESSENGER data. Estimated from their Fig. 7 it can be found that averaged over 0.2 AU the width of the MHs slightly increases when moving away from the Sun, from ∼7 s at R∼0.3 AU to ∼10 s at R∼0.8 AU. Looking at the green line in Fig. 7a showing the maximum occurrence rate and the cyan line showing the trend by Sperveslage et al. (2000) shows there is a good match between the two up to the orbit of Venus. A trend to longer structures does exist in the PMHs shown in Fig. 8a, through a slight broadening of the counts between 0.3 and 0.7 AU, also visualized by the green line showing the maximum occurrence rate in each radial bin.
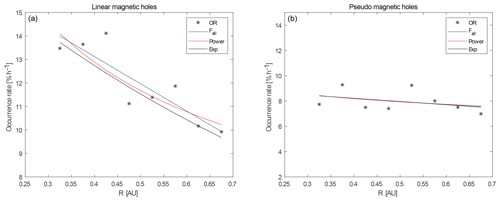
Figure 11(a) The occurrence rate of LMHs as a function of R, to which various fits are made to all points except the last. A linear fit between Mercury and Venus (Fmv, green) and over all points (Fall, blue), a power law (Power, green), and an exponential (Exp, red). See the text for details. (b) The same fits for the occurrence rates of PMHs. See the text for details.
However, there is also the gradual decrease in the occurrence rate of LMHs from Mercury to Venus which can be seen in Fig. 11a. This can have different origins.
-
There can be a constant number of LMHs, but as the solar wind transports them outward they get “diluted” by R−1. Fitting the occurrence rate with a power function aRb gives and with ℛ2=0.74.
-
There could be a decay of the LMHs with an exponential drop aexp {bR} for which the fit returns and with ℛ2=0.77.
-
Looking at the data a linear fit a+bR would also describe the gradient well with and and ℛ2=0.77.
These three fits are shown in Fig. 11a in red, black, and blue respectively. It is clear from the figure and the ℛ2 that none of the fits describe the behaviour of the decrease in occurrence rate very well. It needs to be noted that with these fits it is assumed that the LMHs are created near the Sun and no creation is happening further away, which is unrealistic.
This behaviour also holds for the PMHs. In Fig. 11b the occurrence rates of PMHs are plotted with the same fits, with the following parameters.
-
A power function aRb gives and with ℛ2=0.10.
-
An exponential drop aexp {bR} with and with ℛ2=0.13.
-
A linear fit a+bR with and and ℛ2=0.13.
It is clear from the ℛ2 that the fits for the PMHs are not saying much.
The data in this paper show that the LMHs do not change much in size as they travel from Mercury to Venus, but the distribution of their depths seems to slightly narrow towards smaller values. This means that there is statistically no development of these structures. For the structures with a larger rotation, the PMHs, the minimum width increases as they move away from the Sun.
In general, there is a slight increase in MH width for both types between Mercury and Venus. This would be expected from the Bohm-type diffusion (Hasegawa and Tsurutani, 2011), where the size of MM structures is described by
with λ the scale size, L the travelled distance of the structure with convection velocity u and ρp and ωp,c the proton gyro radius and frequency respectively. The term comes from the maximum growth rate for MM waves. Taking average values for the solar wind (u≈400 km s−1, B≈5 nT) results in for a distance L=0.4 AU between Mercury and Venus. This kind of growth is not observed in Figs. 7 and 8, where there is at most a factor 2–3 in growth. This means that, when MHs behave similarly to MMs, the structures have to be created at all locations between Mercury and Venus and grow over a distance of 80×103–210×103 km and decay again. Joy et al. (2006) state that the decay (or collapse) of these structures is stochastic, that there are different decay times for different structures. Dedicated numerical simulations should cast light on this issue.
It should be noted that the occurrence rate, due to the 300 s distance selection criterion, is a lower limit. In the case of a wave train only the deepest hole is selected, and the train is seen as a single event. However, Winterhalter et al. (1995) found that wave trains mainly appear in mirror-mode unstable regions, whereas in the stable regions solitary magnetic holes are found. They offer the explanation that when MMs are created and move into a MM stable region the weakest MMs diffuse and only the strongest develops into an MH. Therefore, counting a wave train as one event seems to be defensible. For events separated like shown in Fig. 3 there is a slight miscount. Checking for smaller distances between events shows an error of approximately 10 % in counts.
Magnetic holes are ubiquitous in the solar wind. Using the MESSENGER magnetometer data during the cruise phase between Venus and Mercury, the occurrence rate, width, and depth of linear and pseudo magnetic holes (LMH and PMH) were determined during solar minimum conditions.
The main results are the following.
-
There is a slow decrease in the LMH occurrence rate from Mercury to Venus from ∼14 % h−1 to ∼4 % h−1, whereas for the PMHs it is rather constant.
-
The difference between the LMH and PMH occurrence rates over the observation interval basically rules out the “dilution” or “parametric decay” of the structures.
-
There is a narrow range of widths between ∼4 and ∼30 s. Assuming that the MHs also show Bohm-like diffusion argues for a constant creation and diffusion and (stochastic) decay of these structures between Mercury and Venus.
In order to study the characteristics of MHs outside the orbit of Venus, the Rosetta cruise phase (Glassmeier et al., 2007) before hibernation can be used. This covers almost exactly the same time interval as the MESSENGER cruise phase. Also, the cruise phase of the BepiColombo mission (Anselmi and Scoon, 2001) should be used to investigate these structures, where it should be noted that this is also during solar minimum conditions, and so directly comparable with this current study.
The MESSENGER data were obtained from NASA's PDS (https://pds.nasa.gov/, NASA Planetary Date System, 2015). The sunspot numbers were obtained from SILSO (http://www.sidc.be/silso/home, Sunspot Index and Long-term Solar Observations, 2019).
MV initiated this study, collected the data and did the analysis. CG and FP wrote the initial version of the MH finder program and helped interpret the results. TK and DH also assisted in interpreting the results from the analysis. BA as the PI of the MESSENGER magnetometer guaranteed the quality and usability of the data.
The authors declare that they have no conflict of interest.
Part of the work by Charlotte Goetz was financially supported by the German Ministerium für Wirtschaft und Energie and the Deutsches Zentrum für Luft- und Raumfahrt under contract 50 QP 1401. Charlotte Goetz is supported by an ESA Research Fellowship. Daniel Heyner was supported by the German Ministerium für Wirtschaft und Energie and the German Zentrum für Luft- und Raumfahrt under contract 50 QW 1501.
This paper was edited by Anna Milillo and reviewed by two anonymous referees.
Anderson, B. J., Acuña, M. H., Lohr, D. A., Scheifele, J., Raval, A., Korth, H., and Slavin, J. A.: The Magnetometer instrument on MESSENGER, Space Sci. Rev., 131, 417–450, https://doi.org/10.1007/s11214-007-9246-7, 2007. a
Anselmi, A. and Scoon, G. E. N.: BepiColombo, ESA's Mercury Cornerstone mission, Planet. Space Sci., 49, 1409–1420, https://doi.org/10.1016/S0032-0633(01)00082-4, 2001. a
Bohm, D., Burhop, E. H. S., and Massey, H. S. W.: The use of probes for plasma exploration in strong magnetic fields, in: The characteristics of electrical discharges in magnetic fields, edited by: Guthrie, A. and Wakerling, R. K., 13–76, McGraw-Hill, New York, 1949. a
Briand, C., Soucek, J., Henri, P., and Mangeney, A.: Waves at the electron plasma frequency associated with solar wind magnetic holes: STEREO/Cluster observations, J. Geophys. Res., 115, A12113, https://doi.org/10.1029/2010JA015849, 2010. a
Burlaga, L. F.: Directional discontinuities in the interplanetary magnetic field, Sol. Phys., 7, 54–71, https://doi.org/10.1007/BF00148406, 1969. a
Burlaga, L. F., Ogilvie, K. W., and Fairfield, D. H.: Microscale fluctuations in the interplanetary magnetic field, Astrophys. J., 155, L171–L175, https://doi.org/10.1086/180329, 1969. a
Burlaga, L. F., Ness, N. F., and Acuna, M. H.: Linear magnetic holes in a unipolar region of the heliosheath observed by Voyager 1, J. Geophys. Res., 112, A07106, https://doi.org/10.1029/2007JA012292, 2007. a
Buti, B., Tsurutani, B. T., Neugebauer, M., and Goldstein, B. E.: Generation Mechanism for Magnetic Holes in the Solar Wind, Geophys. Res. Lett., 28, 1355–1358, https://doi.org/10.1029/2000GL012592, 2001. a
Gary, S. P., Fuselier, S. A., and Anderson, B. J.: Ion anisotropy instabilities in the magnetosheath, J. Geophys. Res., 98, 1481–1488, 1993. a
Glassmeier, K.-H., Boehnhardt, H., Koschny, D., Kührt, E., and Richter, I.: The Rosetta mission: flying towards the origin of the solar system, Space Sci. Rev., 128, 1–21, 2007. a
Hasegawa, A. and Tsurutani, B. T.: Mirror mode expansion in planetary magnetosheaths: Bohm-like diffusion, Phys. Rev. Lett., 107, 245005, https://doi.org/10.1103/PhysRevLett.107.245005, 2011. a, b
Joy, S. P., Kivelson, M. G., Walker, R. J., Khurana, K. K., and Russell, C. T.: Mirror mode structures in the Jovian magnetosheath, J. Geophys. Res., 111, A12212, https://doi.org/10.1029/2006JA011985, 2006. a, b
Karlsson, T., Liljebad, E., Kullen, A., Raines, J. M., Slavin, J. A., and Sundberg, T.: Isolated magnetic field structures in Mercury's magnetosheath as possible analogues for terrestrial magnetosheath plasmoids and jets, Planet. Space Sci., 129, 61–73, https://doi.org/10.1016/j.pss.2016.06.002, 2016. a, b, c
Korth, H. and Anderson, B.: MESSENGER Magnetometer EDR-to-CDR Processing, available at: https://pds-ppi.igpp.ucla.edu/search/view/?f=yes&id=pds://PPI/MESS-E_V_H_SW-MAG-3-CDR-CALIBRATED-V1.0/DOCUMENT/CALIBRATION_PROCEDURE/MAG_EDR2CDR&o=1 (last access: 10 January 2020), 2016. a
NASA Planetary Date System (PDS): available at: https://pds.nasa.gov/ (last access: 10 January 2020), 2015. a
Plaschke, F., Karlsson, T., Götz, C., Möstl, C., Richter, I., Volwerk, M., Eriksson, A., Behar, E., and Goldstein, R.: First observations of magnetic holes deep within the coma of a comet, Astron. Astrophys., 618, A114, https://doi.org/10.1051/0004-6361/201833300, 2018. a
Qu, H., Lin, Z., and Chen, L.: Gyrokinetic theory and simulation of mirror instability, Phys. Plasma, 14, 042108, https://doi.org/10.1063/1.2721074, 2007. a
Schmid, D., Volwerk, M., Plaschke, F., Vörös, Z., Zhang, T. L., Baumjohann, W., and Narita, Y.: Mirror mode structures near Venus and Comet P/Halley, Ann. Geophys., 32, 651–657, https://doi.org/10.5194/angeo-32-651-2014, 2014. a
Solomon, S. C., McNutt Jr., R. L., Gold, R. E., and Domingue, D. L.: MESSENGER mission overview, Space Sci. Rev., 131, 3–39, https://doi.org/10.1007/s11214-007-9247-6, 2007. a
Southwood, D. J. and Kivelson, M. G.: Mirror instability: 1. Physical mechanism of linear instability, J. Geophys. Res., 98, 9181–9187, 1993. a
Sperveslage, K., Neubauer, F. M., Baumgärtel, K., and Ness, N. F.: Magnetic holes in the solar wind between 0.3 AU and 17 AU, Nonlin. Processes Geophys., 7, 191–200, https://doi.org/10.5194/npg-7-191-2000, 2000. a, b, c, d, e
Stevens, M. L. and Kasper, J. C.: A scale-free analysis of magnetic holes at 1 AU, J. Geophys. Res., 112, A05109, https://doi.org/10.1029/2006JA012116, 2007. a, b, c
Sunspot Index and Long-term Solar Observations (SISLO): WDC-SILSO, Royal Observatory of Belgium, Brussels, available at: http://www.sidc.be/silso/home (last access: 10 January 2020), 2019. a
Turner, J. M., Burlaga, L. F., Ness, N. F., and Lemaire, J. F.: Magnetic holes in the solar wind, J. Geophys. Res., 82, 1921–1924, https://doi.org/10.1029/JA082i013p01921, 1977. a, b
Winterhalter, D., Neugebauer, M., Goldstein, B. E., Smith, E. J., Tsurutani, B. T., Bame, S. J., and Balogh, A.: Magnetic holes in the solar wind and their relation to mirror-mode structures, Space Sci. Rev., 72, 201–204, https://doi.org/10.1007/BF00768780, 1995. a
Winterhalter, D., Smith, E. J., Neugebauer, M., Goldstein, B. E., and Tsurutani, B. T.: The latitudinal distribution of solar wind magnetic holes, Geophys. Res. Lett., 27, 1615–1618, https://doi.org/10.1029/1999GL003717, 2000. a
Zhang, T. L., Russell, C. T., Baumjohann, W., Jian, L. K., Balikhin, M. A., Cao, J. B., Wang, C., Blanco-Cano, X., Glassmeier, K.-H., Zambelli, W., Volwerk, M., Delva, M., and Vörös, Z.: Characteristic size and shape of the mirror mode structures in the solar wind at 0.72 AU, Geophys. Res. Lett., 35, L10106, https://doi.org/10.1029/2008GL033793, 2008. a, b
Definition: the origin is at the centre of the Sun with the fundamental plane in the plane of the Earth's Equator. The primary direction, the x axis, points toward the vernal equinox of year 2000, with a right-handed convention specifying the y axis as pointing 90∘ to the east in the fundamental plane and the z axis along the Earth's north polar axis.


