the Creative Commons Attribution 4.0 License.
the Creative Commons Attribution 4.0 License.
Solar cycle, seasonal, and asymmetric dependencies of thermospheric mass density disturbances due to magnetospheric forcing
Andres Calabia
Shuanggen Jin
Short-term upper atmosphere variations due to magnetospheric forcing are very complex, and neither well understood nor capably modeled due to limited observations. In this paper, mass density variations from 10 years of GRACE observations (2003–2013) are isolated via the parameterization of annual, local solar time (LST), and solar cycle fluctuations using a principal component analysis (PCA) technique. The resulting residual disturbances are investigated in terms of magnetospheric drivers. The magnitude of high-frequency (δ < 10 d) disturbances reveals unexpected dependencies on the solar cycle, seasonal, and an asymmetric behavior with smaller amplitudes in June in the south polar region (SPR). This seasonal modulation might be related to the Russell–McPherron (RM) effect. Meanwhile, we find a similar pattern, although less pronounced, in the northern and equatorial regions. A possible cause of this latitudinal asymmetry might be the irregular shape of the Earth's magnetic field (with the north dip pole close to Earth's rotation axis, and the south dip pole far from that axis). After accounting for the solar cycle and seasonal dependencies by regression analysis to the magnitude of the high-frequency perturbations, the parameterization in terms of the disturbance geomagnetic storm-time index Dst shows the best correlation, whereas the geomagnetic variation Am index and merging electric field Em are the best predictors in terms of time delay. We test several mass density models, including JB2008, NRLMSISE-00, and TIEGCM, and find that they are unable to completely reproduce the seasonal and solar cycle trends found in this study, and show a clear overestimation of about 100 % during low solar activity periods.
- Article
(5577 KB) - Full-text XML
-
Supplement
(462 KB) - BibTeX
- EndNote
The connection between solar drivers and magnetosphere–ionosphere–thermosphere (MIT) phenomenon is very complex and dependent on many processes. One of the most important processes is the variable solar wind plasma combined with a favorable alignment of the IMF (interplanetary magnetic field), which can produce auroral particle precipitation at high latitudes and increment of thermospheric Joule heating via coupled MIT processes linked to the Dungey cycle (Dungey, 1961). This phenomenon can suddenly govern the structure and dynamics of the thermosphere, creating changes in the mass density distribution by way of thermal expansion/contraction and changes in the composition of neutral species (i.e., O∕N2 depletion, Lei et al., 2010). For instance, solar flares increase the X-ray and extreme ultraviolet (EUV) irradiance and produce nearly immediate energy absorption, ionization, and dissociation of molecules. The occurrence of solar flares usually correlates with the rotational variation of the Sun (about 27 d, and subharmonics at about 9, 7, and 5 d), resulting from the secular appearances of bright regions associated with sunspots that persist across solar rotations. Different open and closed magnetic flux domains in the solar corona provide different speeds and densities of the solar wind, forming an outward spiral with fast-moving and slow-moving streams. Fast-moving solar wind tends to overtake slower streams, forming turbulent corotating interaction regions (CIR). In addition, coronal mass ejections (CME) release fast-moving bursts of plasma at the corona of the Sun, which travel at higher speeds than CIRs. CIRs and CMEs create magnetospheric storms, which are mainly driven by the electric fields linked to the Dungey cycle. CMEs can produce stronger storms than CIRs and are usually initiated by a southward IMF, enhancing the night-side convection, and increasing the ring current. When CIRs and CMEs reach Earth, the rapid increase in Poynting flux and particle precipitation along the Earth's magnetic field lines, originating from solar wind/magnetosphere coupling processes, lead to an enhancement in Joule heating and disturbances in thermospheric composition, temperature, density, and winds (e.g., Knipp et al., 2013; Lühr et al., 2004; Lathuillere and Menvielle, 2004; Sutton et al., 2005). Effects of CMEs and CIRs first appear in the auroral zone as an increase in thermospheric mass density, and shortly afterward the perturbation propagates towards the Equator, followed by a global expansion lasting from several hours up to several days.
The thermospheric mass density distribution, particularly during storm-time, is of great importance for precise orbit determination (POD) of low Earth orbit (LEO) satellites, and for the understanding of MIT coupling. Aerodynamic drag associated with neutral-density fluctuations resulting from upper atmospheric expansion/contraction in response to variable solar and geomagnetic activity, increases drag and decelerates low Earth orbits, reducing the life span of space assets, and making tracking difficult. In addition, the energy transfer from the solar wind to the MIT system is complex, not completely described by models and observations, and many studies focus their efforts on a better understanding of all of the physical processes involved. Currently, atmospheric drag from mass density at LEO is the largest uncertainty in orbit determination and prediction, because short-term variations produced by episodic solar activity, for example, are still not well modeled (e.g., Marcos et al., 2010). Currently, the US Naval Research Laboratory Mass Spectrometer And Incoherent Scatter radar model (NRLMSISE-00) (Picone et al., 2002), Jacchia (JB2008) (Bowman et al., 2008), the Drag Temperature Model (DTM-2013) (Bruinsma, 2005), and the Thermosphere-Ionosphere-Electrodynamics General Circulation Model (TIEGCM) (Qian et al., 2014) are some of the most representative models of mass density variations in the upper atmosphere (in this work we compare our results with NRLMSISE-00, JB2008, and TIEGCM). While the mathematical formulation used to model the vertical profile of NRLMSISE-00 is the exponential Bates profile (Bates, 1959), the Jacchia series use the arctangent function to represent an asymptotic behavior for the upper thermosphere. Conversely, the first-principles TIEGCM physical model solves three-dimensional fluid equations for the mutual diffusion of N2, O2, and O, including a coupled ionosphere, where the reactions involve ion species and an energy budget, as well as self-consistent generation of middle- and low-latitude electric fields by neutral winds.
During the last decade, considerable progress has been made with respect to observing and modeling responses to geomagnetic storms in the thermosphere. Villain (1980) first derived mass densities from the CACTUS accelerometer (a French acronym meaning ultrasensitive three-axis capacitive accelerometric detector), whereas Bruinsma and Biancale (2003) extracted mass densities from the Challenging Minisatellite Payload (CHAMP) mission. Following this, Liu et al. (2005) showed two structured arc-shaped enhancements of ∼2000 km diameter in the auroral regions using CHAMP mass density estimates. Liu and Lühr (2005) and Sutton et al. (2005) investigated the severe geomagnetic storm of November 2003 from CHAMP and, shortly afterward, Bruinsma et al. (2006) included the Gravity Recovery and Climate Experiment (GRACE) estimates to investigate the same storm, showing density increases of up to 800 % in a few hours. Rentz and Lühr (2008) studied the climatology of the cusp-related thermospheric mass density anomalies as derived from CHAMP over 4 years (2002–2005), and showed an increase in density anomaly proportional to the square of the merging electric field Em. Sutton et al. (2009) studied the response to variations produced by the July 2004 geomagnetic storm from CHAMP, showing a time response significantly shorter than those used by the empirical models. Based on the variations of the ratio of density estimates between ascending and descending orbits, Müller et al. (2009) showed a slightly better parameterization of mass density employing the Am index instead of the Ap index, although the differences from using both indices still remain unclear. Lathuillère et al. (2008) also showed a better correlation with the magnetic Am index than with the Ap index from 1 year of CHAMP-derived densities and revealed similar behavior between the day- and the night-side variations. Moreover, Guo et al. (2010) and Liu et al. (2010, 2011) investigated a large number of great storms (Dst nT) and showed similar correlations on the day-side to those on the night-side.
Concerning seasonal and interhemispheric asymmetries, several studies have identified and investigated the possible dependence on magnetospheric forcing. For instance, Lu et al. (1994) found a significant difference in the cross-polar-cap potential drop between the two hemispheres (when Bz is positive and ), with a potential drop in the Southern (summer) Hemisphere over 50 % larger than that in the Northern (winter) Hemisphere. Fuller-Rowell et al. (1996) explained that a latitudinal asymmetry of the global thermospheric mass density distribution would be explained in terms of the prevailing summer to winter meridional flow, and Forbes et al. (1996) included the different solar-driven meridional contributions at the day- and night-sides in this explanation. Fuller-Rowell (1998) proposed a new mechanism based on huge turbulent eddy mixing due to the seasonal interhemispheric thermospheric circulation, partially mixing the thermospheric species, and restricting their diffusive separation. The authors suggested that this “thermospheric spoon mechanism” could be triggered during solstice periods by strong interhemispheric prevailing meridional winds originating from a global pressure gradient due to the asymmetric heating of the globe. The resulting interhemispheric asymmetry distribution of mass density could not be created during equinox periods, because of the resulting weak latitude pressure gradients and light meridional winds from an equilibrium between the high-latitude and low-latitude sources of heating. More recently, Bruinsma et al. (2006) also showed a latitudinal asymmetry with higher mass density values at the southern latitudes and suggested an enhanced summer vs. winter Joule heating at high latitudes. Ercha et al. (2012) studied the hemispheric asymmetry of the thermospheric response to geomagnetic storms via a statistical analysis of 102 geomagnetic storms (2001–2007), showing much larger density enhancements in the south polar region (SPR) than in the north polar region (NPR). The authors attributed this phenomenon to the Earth's nonsymmetric magnetic field. Moreover, Deng et al. (2014) examined the high-latitude asymmetry in the Pedersen conductance from electron density profiles from 2008 to 2011, showing larger changes in energy partitioning between the ionospheric E (100–150 km) and F (150–600 km) regions in the Southern Hemisphere than in the Northern Hemisphere.
The above review summarizes the current work being carried out in order to establish a better understanding of mass density variations driven by magnetospheric forcing, and its modeling through correlations to their representative proxies. However, a sufficiently accurate set of drivers, proxies, and interrelations between the geophysical processes involved is still incomplete, and more studies and modeling are needed. For instance, the proper removal of annual, LST, and solar cycle variation is the key to unambiguously resolving the relation between proxies of magnetospheric forcing and mass density disturbances, and none of the abovementioned authors have investigated a sufficiently large and continuous time series of observations, at least to complete a solar cycle, and their statistical analyses were focused only on collections of large storms.
In this paper, we present a comprehensive study of thermospheric density disturbances due to magnetospheric forcing from a 10-year (2003–2013) continuous time series of GRACE accelerometer-based and POD-based mass density estimates, which have been isolated from annual, LST, and solar cycle variations via the parameterization of the principal component analysis (PCA) (Calabia and Jin, 2016). In this scheme, a continuous time series can provide a more realistic representation during both active and quiet magnetospheric conditions, instead of analyzing a collection of large storms. The structure of this paper is presented as follows: Sect. 2 describes the data sets and analysis methods employed; Section 3 presents the results on dependencies and asymmetries from correlations and parameterizations at high and low latitudes; comparison with the current models as well as discussion are given in Sect. 4; and finally summary and conclusions are given in Sect. 5.
2.1 Mass density estimates and geomagnetic indices
We employ thermospheric mass densities inferred from accelerometer and POD measurements made by the GRACE mission (Tapley et al., 2004). The GRACE satellites were launched into a nearly circular orbit on 17 March 2002 with an initial altitude of about 525 km, and a mean altitude of 475 km. The highly sensitive accelerometers onboard the GRACE satellites were initially designed to help to derive the Earth's gravity field, but the measurements of nongravitational forces have provided the unprecedented opportunity to derive and study thermospheric mass density variations. In this scheme, mass density estimates are obtained after removing irradiative accelerations from measured nongravitational accelerations, where the resulting force is the combined effect of atmospheric drag and wind (aerodynamic) and can be expressed as a dynamic pressure applied on a reference area (Jin et al., 2018). The accuracy of the density observations under geomagnetic storm conditions is estimated to be about 10 %–40 %; however, as density perturbations are several hundred percent higher than that during quiet conditions, the uncertainty is still is acceptable for the purpose of this research. A more detailed description of the error budget is given by Bruinsma et al. (2004). After mass density estimates are retrieved along orbits, the normalization to common altitude is performed with the use of an empirical model (Bruinsma et al., 2006). In LEO, the errors caused by the normalization of changes in altitude of ∼100 km are expected to be within 5 %, as discussed in Bruinsma et al. (2006). In this study, we employ accelerometer-based and POD-based mass density estimates computed in Calabia (2017), and we provide the complete set at a 3 min interval in the Supplement.
Space weather and geomagnetic indices are commonly used in upper atmosphere modeling during geomagnetic storms. These indices have been downloaded from the Low Resolution OMNI (LRO) data set from NASA (http://omniweb.gsfc.nasa.gov/form/dx1.html, last access: 1 January 2018) and from the International Service of Geomagnetic Indices (ISGI) website (http://isgi.unistra.fr/data_download.php, last access: 1 January 2018). Liu et al. (2010) demonstrated that the merging electric field, Em, is a physical quantity that closely correlates with mass density variations during geomagnetic storms. The merging electric field, Em, assumes that there is an equal magnitude of the electric field in the solar wind, the magnetosheath, and on the magnetospheric sides of the magnetopause (Kan and Lee, 1979):
where By and Bz are the IMF components, vSW is the solar wind speed, and θ is the IMF clock angle in geocentric solar magnetospheric (GSM) coordinates.
2.2 Parameterization of solar cycle, annual, and LST variations
In order to remove the solar cycle, annual, and LST variations from the initial density estimates, we have parameterized the main PCA modes of variability as done in Calabia and Jin (2016). Other techniques such as wavelets are also widely employed, but in this work we employ a new two-step method (“PCA fit” + “fit of residuals”) for more robust modeling. In brief, the purpose/aim of a PCA technique is to determine a new set of bases that capture the largest variance in the data, based on eigenvalue decomposition of the sample covariance estimated from the initial data. Detailed analyses and the selection of retained modes for static grids can be found in Preisendorfer (1988) and Wilks (1995), and a readily computable algorithm can be found in Bjornsson and Venegas (1997). In this work, more data and a revised analysis have been performed with respect to the data provided by Calabia and Jin (2016). For instance, we have included POD-based estimates to fill the data gaps of accelerometer measurements (Calabia and Jin, 2017), and manually excluded obvious outliers caused by, e.g., geomagnetic storms and artifacts in the data processing. These improvements have provided a better representation of the variability with respect to the results from Calabia and Jin (2016). The combined data set and model is provided in the Supplement. The four leading modes together account for 99.8 % of the total variance and, individually, explain 92 %, 3.5 %, 3 %, and 1.3 % of the total variability. These high values indicate marked patterns of variability. The correlation coefficients between the parameterized time series of PCA modes and the initials are 96 %, 93 %, 90 %, and 83 %, respectively. These high values indicate high accuracy in the model. Then, in order to reflect the magnetospheric contribution via relevant proxies in the residuals, we employ a constant value of Am = 6 in the parameterization given by Calabia and Jin (2016). Herein, we refer the parameterization set of the solar cycle, annual, and LST variations as the “radiation model” (ρmodel), whereas the residual disturbances (ρr) to mass density estimates (ρGRACE) are defined as
Assuming high efficiency in the model (ρmodel), the residual disturbances (ρr) will not only contain variations due to magnetospheric forcing but also disturbances due to other sources, such as lower atmospheric waves and recurrent traveling atmospheric disturbances (TADS) (Bruinsma and Forbes, 2010). These other disturbances are not regarded in this paper and can be investigated in future research after the removal of the presented model. A more complete listing of known thermospheric mass density disturbances is given in Liu et al. (2017).
2.3 Density responses to magnetospheric forcing at different latitudes
Density residuals at poles and equatorial regions are extracted from the residual disturbances to determine their time-dependent relationship to changes in magnetospheric drivers. We denote ρr in Eq. (2) as ρE for the profile at the Equator, and ρN and ρS for the NPR and SPR profiles, respectively. Density profiles for each region (see example in Fig. 1a) correspond to an average value of density of a longitudinal band of 30∘ width (in latitude), centered at the Equator (ρE) and at the geographic poles (ρN, ρS). The Equator profile of density is computed as the mean average between the ascending and descending orbits, so possible LST and time-lag differences between ascending and descending orbits are mitigated (although some studies introduced in Sect. 1.3.3 have shown a negligible LST contribution).
The approach employed in this work is based on the parameterization of the standard deviation, which provides a more robust metric modeling, instead of attempting to fit the direct signal of residual disturbances. Additional smoothing filters are applied to both residual disturbances and proxies as follows. First, we remove the disturbances longer than 1 d (δ) from both ρr and the geomagnetic indices to further standardize the data sets. We divide the approach in two steps, one for sub-daily variations, and the other for those between 1 and 10 d (we arbitrarily decided to employ a 10 d period as it provided the best results after several tests). The removal of longer trends is performed by subtracting the smoothed time series with a 10 d running-window filter, and the sub-daily variations are extracted in a similar way via a 1 d running-window filter. The general form for the mean running-window filter is as follows:
where xi is the time series to filter at each sampling index i, a is half of the increment of time for each corresponding running window, and Filt(xi) is the smoothed time series employed to remove long-term signals.
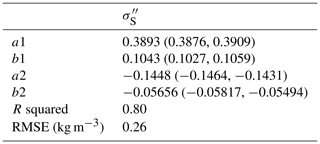
The standard deviation shown in Fig. 2 is calculated for each pair of time series (δ < 1 d, and 1 d < δ < 10 d) via a 30 d running window (we employ a similar form of Eq. (3) to compute the standard deviation instead of the mean value). Figure 2 reveals strong dependencies on the solar cycle; we further parameterize this dependence in terms of solar-flux F10.7 (Fig. 3, Table 1), and the results are given in Fig. 4. A seasonal dependency is shown with weaker disturbances during the June solstice periods, mostly at the SPR. We parameterize this seasonal variation to better fit geomagnetic indices into the residual disturbances (ρr) using the annual period in a Fourier fitting to the normalized disturbance in the SPR (Table 2). After this seasonal variation is removed, the normalized standard deviations of the residual disturbances (ρr) show good agreement with the standard deviations of the geomagnetic indices (see Fig. 4). The fitting of least absolute residuals (which minimizes the absolute difference of the residuals) in a two-variable parameterization (solar cycle and geomagnetic index) is chosen to better characterize singular events of strong geomagnetic activity:
In this equation, Ind corresponds to the geomagnetic index employed (Am, Dst, or Em), and F is the solar radio flux at 10.7 cm. As for the SPR, we easily modulate the parameterized northern profile in terms of the parameterized disturbances at the SPR, σ′′(Table 2):
Finally, the Pearson linear correlation coefficients between each profile of density disturbances and the final parameterizations are calculated with delay times within a range of ±18 h. Analysis results are provided in the next section.
This section is presented in three subsections. Firstly, an analysis of a single event is presented to exercise the typical storm-time behavior and to understand how proxies are employed to represent mass density variations. The second subsection represents the main contribution of this work, with a complete analysis of the 10-year time series. Finally, an estimate of uncertainty and contrasts of the results are made in the last subsections.
3.1 Analysis of a single event
Figure 1a shows the northern (ρN), southern (ρS), and equatorial (ρE) profiles of mass density disturbances, normalized to an altitude of 475 km for a moderate geomagnetic storm (rated as G2 on the NOAA's geomagnetic storm scale) on 18 March 2013. The traces of mass density estimates with the solar cycle, annual, and LST dependencies removed are shown. The following panels display the K-derived planetary indices (ap, an, as); the auroral index horizontal component disturbances (AE and AL); the solar wind (SW) velocity, proton, and temperature; the longitudinally asymmetric horizontal component disturbances (ASY-D, ASY-H); the electric field (Ey); and the Polar Cap index horizontal component disturbances.
In general, density perturbations and space weather and geomagnetic indices remain calm until early morning (∼05:00 UT) on 17 March 2013, and the geomagnetic storm commences. High-latitude mass density profiles exhibit two peaks, a relative maximum at 10:00 UT of kg m−3, and an absolute maximum the same day at 17:00 UT of kg m−3. The equatorial variation shows a delay, starting at the relative maximum at ∼07:00 UT, and reaching the absolute maximum of kg m−3 at 22:00 UT. The maximum of the equatorial density disturbance is less obvious but peaks at 10:00 UT. In this figure, the Dst index shows the best match with the equatorial mass density disturbances. In contrast, the best match for high-latitude density disturbances is found with the K-derived planetary indices (ap, an, as), Em, and the auroral index horizontal component disturbances (AE, AL). This is expected based on the locations of the magnetometer stations that contribute to the corresponding indices. Finally, all indices start to return to the calm state at the end of the day (∼24:00 UT), whereas the mass density profiles remain elevated until the next day at ∼07:00 UT (18 March 2013). This phenomenon is the atmospheric response to equilibrate the global mass density back to the initial calm state. The question that arises from this figure is whether this is a typical storm-time behavior, and the extent to which this behavior could be modeled using their representative proxies in terms of time delay and other possible dependencies, such as an increase in solar flux, or due to latitudinal asymmetries seen in previous studies (e.g., Ercha et al., 2012; Bruinsma et al., 2006; Fuller-Rowell et al., 1996; Forbes et al., 1996).
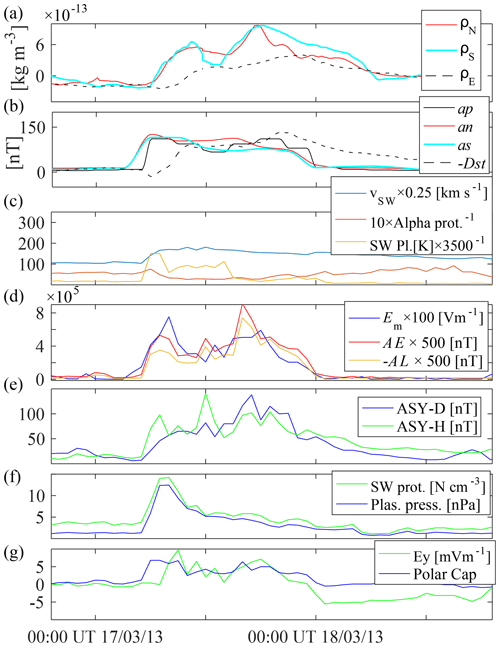
Figure 1In (a), the northern, southern, and equatorial profiles of residual density disturbances (ρr) are shown for the moderate (G2) geomagnetic storm on 18 March 2013 (free from solar cycle, LST, and annual variations, and normalized to an altitude of 475 km). Space weather and geomagnetic indices are plotted below from (b) to (g). Magnitudes have been rescaled as indicated in each legend.
3.2 Analysis of 10-year thermospheric mass density time series
In Fig. 2, the standard deviation calculated over a sliding window of 30 d (σ) is shown for the NPR, Equator, and SPR (σN, σE, and σS, respectively) over the entire span of the 10-year analysis period. Possible unwanted variation with long-term periods, resulting from the process of removing solar cycle, annual, and LST variations have been eliminated by running a 10 d smoothing filter. In order to detect a possible variation of the geographical influence induced by the spatial component of the PCA model (e.g., location of magnetic dip, irregular magnetic field), standard deviations have been separately computed for the initial residual disturbances, and from both sub-daily and 1–10 d (δ) disturbances. As expected, sub-daily disturbances are smaller in magnitude when compared to the longer periods. Concerning the latitudinal differences, disturbances in the southern region (ρS) are larger in amplitude (σS) compared with the northern region (σN). The values are described by the fitting in Fig. 3 and Table 1. At first glance, the residual disturbances show strong alignment with the solar cycle trend (F10.781), indicating that the magnitude of mass density disturbances due to magnetospheric forcing is strongly dependent on the 11-year solar cycle. Figure 2 includes the 81 d averaged F10.7 solar-flux index to show the alignments. Note that these dependencies are intrinsic to the magnitude of disturbances due to magnetospheric forcing and are not from the background LST, seasonal, and solar cycle variations which have been removed by the PCA model and smoothing procedures. In this scheme, the F10.781 index is firstly employed to fit the magnitude of disturbances, and the linear fits are presented in Fig. 3 and Table 1.
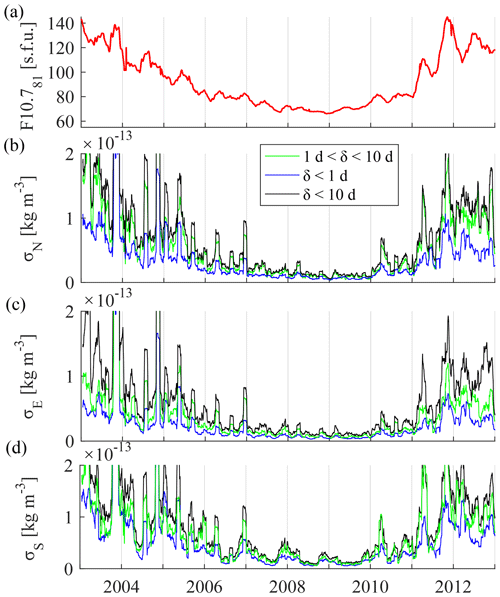
Figure 2From top to bottom, (a) the 81 d averaged F10.7 solar flux index, and the 30 d standard deviation sliding window of residual density disturbances at an altitude of 475 km in (b) the northern, (c) the equatorial, and (d) the southern regions. Calculations filtered at different frequencies are plotted in green, blue, and black.
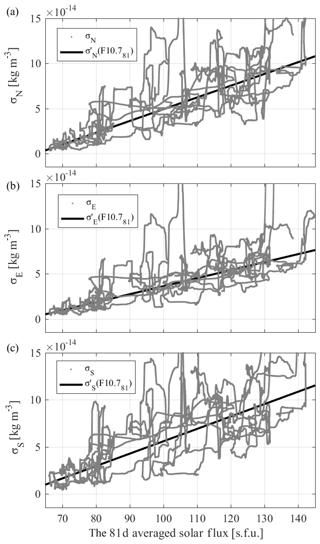
Figure 3Linear fit of 30 d standard deviation sliding window of residual density disturbances at an altitude of 475 km from Fig. 2 at (a) NPR and (b) SPR with respect to the 81 d averaged F10.7 solar flux index. Note that the seasonal variation (Table 3) has not been removed from (c).
An interesting feature in the resulting fit in Fig. 4 is the decrease of the standard deviation in the southern profile (σS) during June, clearly present in both the sub-daily and 1–10 d time series. In contrast, the northern region (σN) is more aligned with the F10.781 solar cycle variation, and without strong signs of a seasonal fluctuation (refer to the next section for more details). The discussion of the possible effects of this seasonal and asymmetric variation is given in the next section. Figure 4a plots the standard deviation computed with a 30 d sliding window of the Am and Dst geomagnetic indices, as well as the Em. After accounting for solar cycle variation effects by data normalization using the parameters given in Table 1, the standard deviation computed using the same 30 d sliding window (Fig. 4b, c, d) shows a much better correspondence with the fitting of Am, Dst, and Em standard deviations; however, in the southern region (Fig. 4d), lower mass density disturbances during the summer seasons are now more obvious, and it has been parameterized in terms of day of the year (doy). The corresponding parameters and goodness of the Fourier fit are given in Table 2. We employ this parameterization to better characterize the fitting scheme of proxy candidates and additional dependencies. From Figs. 3 and 4, a clear contribution of the solar cycle for high and low latitudes is requisite for the fitting scheme (Eq. 4). In addition, the identified seasonal variation prominently modulates the fluctuations in the SPR. The last parameter to account for is the lag time between proxies and density disturbances. The Pearson linear correlation coefficients between each profile of density and the final parameterizations are calculated with delay times with a range of ±18 h. Then, the maximum values for each time series are employed in the fitting.
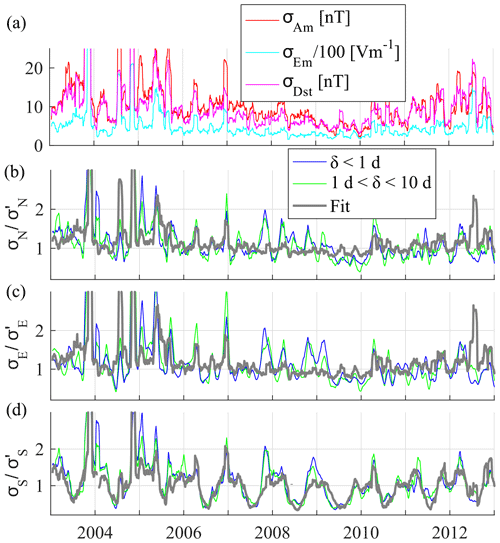
Figure 4From top to bottom, (a) the 30 d moving standard deviation of Am, Dst, and Em, and the solar-flux normalized 30 d standard deviation sliding window of residual density disturbances at an altitude of 475 km at (b) the northern, (c) the equatorial, and (d) the southern regions. Fourier fits in terms of doy and Em are plotted in gray. Calculations filtered at different frequencies are plotted in green and blue.
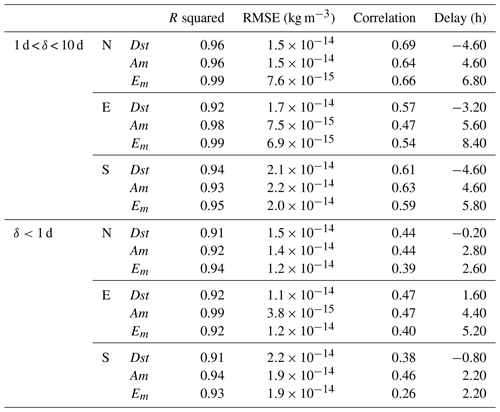
Figure 5 plots the lag-time correlation coefficients between the parameterized perturbations and the three (northern, equatorial, and southern) profiles of residual disturbances (ρr). Figure 5a corresponds to residual disturbances for periods ranging from 1 to 10 d, and Fig. 5b corresponds to sub-daily disturbances. In general, sub-daily disturbances exhibit a smaller range of time lags for correlations with drivers than the longer variations shown in Fig. 5a. A secondary maximum at about 12 h ahead of the absolute maximum might have originated due to TADs reaching the opposite side of the globe, but further study is required to validate this assumption. Negative values proceeding geomagnetic storms could also increase the secondary maximum. Negative values at the Equator prior to geomagnetic storms have been reported in earlier studies (Calabia and Jin, 2017), and further discussion in relation to the Dst index is given in the next section. Both time delays of 1 to 10 d and sub-daily correlations show a similar response to the Dst index, displaying a delay occurring after density disturbances, and revealing a shortcoming for prediction. Conversely, Am and Em have a much higher capability as predictors. For the high-latitude profiles, lag-time correlation of Em at sub-daily fluctuations has a double crest centered at the same time lag as for the Am index. The lag-time correlation of Dst shows a potential capability of prediction for equatorial disturbances with periods shorter than 1 d. The most important feature in Fig. 5 is the correlation with Am and Em between 1 and 10 d, suggesting a great capability for prediction, as seen by the lag-time peak correlations of ∼0.65 for high latitudes and ∼0.45 for low latitudes. Values of the time delay at the maximum correlation and goodness of fit are given in Table 3. Dependencies on solar cycle are similar for both high latitudes, so we modulate the northern parameterization (Eq. 4) for the fitting scheme of the southern parameterization (Eq. 5). The final output is the addition of both sub-daily and 1–10 d parameterizations. The resulting goodness of fits is provided in Table 3, and the parameterizations are provided in the Supplement.
Figure 6 shows the resulting parameterization of the Am index to represent density disturbances (δ < 10 d) during 2006. The seasonal dependence (Fig. 4d) is clearly seen with lower density disturbances in the SPR (ρS) around June. In contrast, density disturbances in the equatorial Region (ρE) and in the NPR (ρN) maintain the magnitude of disturbances. Negative density enhancement precursors to geomagnetic storms are not well represented, probably due to a damping response associated with the nitric oxide cooling effects (Knipp et al., 2013). Note that when applying a 10 d running mean filter, a false negative is introduced in both time series of proxies and data. This is clearly shown in Fig. 6 with several negative values for the fit of Am. However, the residuals have bigger negative values than the Am parameterization (Fig. 6). This is due to negative values already present in the time series (before the application of the running-mean filter). Previous studies have shown that 37 % of CMEs and 67 % of CIRs have an abnormal calm state before geomagnetic storms (Denton et al., 2006; Borovsky and Steinberg, 2006). It has been suggested this effect might be triggered by the Russell–McPherron (RM) effect, via a sector reversal just the upstream of the CIR stream interface.
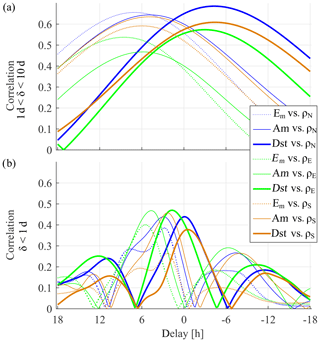
Figure 5Delay/correlation between residual density disturbances at an altitude of 475 km (ρr) and the parameterizations of disturbances in terms of Em, Am, and Dst indices, for (a) periods between 1 and 10 d and (b) sub-daily periods, for the northern (ρN), equatorial (ρE), and southern (ρS) regions.
3.3 Uncertainty analysis
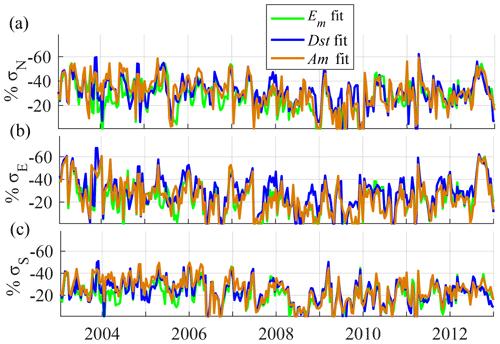
We further investigate the change in the standard deviation of the residual density disturbances (ρr) after the removal of parameterized disturbances, to provide an estimate about the uncertainty of the model, via the multiplication of Fig. 7a–c with Fig. 2b–d. In Fig. 7, the reduction in the percentage of the standard deviation (30 d sliding window) is plotted for the northern, equatorial, and southern regions. Overall, the results show similar accuracy for all of the periods investigated, but with some hemispherical difference. The mean value of the reduction of standard deviation is about 30 %, and peaks over 50 % are seen in all time series, with slightly lower values at the SPR. The accuracy seems to decrease during low solar activity periods, which is most probably related to the difficulties involved in fitting low values of disturbances. Taking Fig. 2 as a reference, a reduction of 30 % represents a reduction of the standard deviation of about kg m−3 during high solar activity periods and about kg m−3 during low solar activity periods, with both being about the 5 % of the background density. The parameterization using the Dst index show a larger reduction of residuals in the equatorial region and mostly during low solar activity, but a larger reduction in high-latitude regions are given by the Am index under high solar activity conditions. Em shows the lowest reduction levels during the decline of the solar cycle 23 (2003–2009), but seems to increase during the current solar cycle 24.
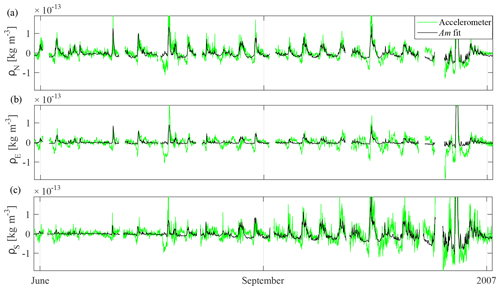
Figure 6Thermospheric mass density disturbances (δ < 10 d) due to magnetospheric forcing at an altitude of 475 km, and the parameterization in terms of the Am index, which is dependent on solar cycle and seasonal variation. From top to bottom, northern, equatorial, and southern profiles are presented. Only June to December in 2006 is presented from the full time series.
3.4 Contrast of results
Comparing the results given in Table 3 with the previous studies, other authors are in good agreement, with a few specific differences; however, no comprehensive analyses have been presented concerning differences between SPR and NPR time-lag responses. For instance, Bruinsma et al. (2006) showed an approximate 2 h time delay at high latitudes with respect to solar wind indices and an approximate 4 h delay for the equatorial regions, and Rentz and Lühr (2008) showed about a 1 h time lag with respect to Em. We obtain similar results for Em at sub-daily fluctuations, but a difference of 2 h (ahead) for longer periods. Zhou et al. (2008) showed time lags of about 0–1 h and about 4 h for the SYM-H and ∑Qindices, respectively, while our results for Dst are also null for sub-daily perturbations and negative for longer periods (note that Dst and SYM-H are similar indices). Müller et al. (2009) showed an approximate 3.5 h delay with respect to the Am index, and our time lag for the same index is similar at sub-daily periods, but about 4–7 h for disturbances between 1 and 10 d. Guo et al. (2010) showed density lag-times of about 3 h for high latitudes and about 4.5 h for low latitudes for IMF-derived indices, and Liu et al. (2010, 2011) showed a delay of about 4.5 h for the Em. Our results show a delay that is about 2 h longer (6–8 h at 1–10 d fluctuations). Zhou et al. (2013) showed delay times of about 1.5, 6, and 4.5 h at high, middle, and low latitudes, respectively, for Em. Iipponen and Laitinen (2015) showed 7.5 and 6 h delays for the auroral electrojet AE and the Ap indices, respectively, while our results agree fairly well with a time lag of 6–7 h for Am for 1 to 10 d disturbances. As the wide range of delay times provided in the literature does not differentiate the main signal from variations below 24 h, and none of the previous authors have investigated at least a complete solar cycle, we recommend the use of the values provided in Table 3.
Finally, we compare our results with three existing upper atmosphere empirical and physical (first-principles) models. We analyze and obtain 10-year profiles of density disturbances from TIEGCM, NRLMSISE-00, and JB2008 in the same fashion as for the GRACE estimates. TIEGCM 2.0 is computed at a 5 min resolution with the 2005 Weimer model (Weimer, 2005) using IMF indices to drive high-latitude electric fields. We then estimate model densities at the same positions and times as the GRACE measurements along its orbital path. Finally, we employ solar cycle, annual, and LST dependencies modeled by the PCA of GRACE and the same filtering techniques detailed in the previous sections. Figure 8 shows the same plots as Fig. 4 for GRACE results, but only for the variations between 1 and 10 d. The Fourier fits in terms of doy and Em from Fig. 4, and the three models (TIEGCM, NRLMSISE-00, and JB2008) are plotted along with the GRACE results for comparison. All three models overestimate the disturbance variability at the NPR during low solar activity (2007–2009). During high solar activity (2003–2006 and 2010–2013), the variations seem to agree fairly well in all cases. Variations at the Equator are in better agreement with the models, while JB2008 slightly overestimates. These differences are most likely related to a mismodeled dependence of the 11-year solar cycle variability into the short-term disturbances of magnetospheric forcing (refer to results shown in Figs. 2 and 3). This missing contribution shows an imbalance for the magnitude of disturbances between low and high solar-flux periods. Concerning the seasonal variation of the magnitude of disturbances in the SPR, the semiempirical JB2008 model shows the best results, with the best correlation to Fourier fits in terms of doy and Em. The assimilation of accelerometer-based densities in the semiempirical JB2008 model (Bowman et al., 2008) might clearly contribute to better representation of the actual thermospheric mass density disturbances due to magnetospheric forcing at the SPR. In contrast, during low solar activity, TIEGCM and NRLMSISE-00 show a larger magnitude of disturbances during December in the opposite hemisphere (NPR). This feature is not shown by GRACE estimates and is less pronounced for JB2008.

Figure 8From top to bottom, the solar-flux normalized 30 d standard deviation sliding window of residual density disturbances at an altitude of 475 km (ρr) in (a) the northern, (b) the equatorial, and (c) the southern regions, for NRLMSISE-00 (left), JB2008 (center), and TIEGCM (right) models. Data from GRACE (green color) and Fourier fits in terms of doy and Em (gray) from Fig. 4 are included for comparison. Only variations between 1 and 10 d are represented.
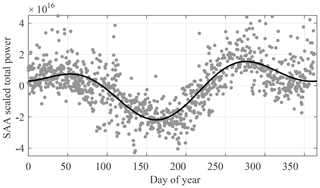
The hemispherical differential variability of thermospheric mass density disturbances due to the semiannual variation of geomagnetic activity needs to be discussed in relation to the lower disturbances seen during the June solstice periods at the SPR (Fig. 4). The equinoctial-axial hypothesis of the semiannual variation in geomagnetic activity was explained by the semiannual variation of the effective southward component of the IMF in Russell and McPherron (1973). The RM effect holds that the southward IMF increases when the angle between the z axis in the geocentric solar magnetospheric (GSM) coordinate system and the y axis in the geocentric solar equatorial (GSEQ) coordinate system decreases. As mentioned above, a southward IMF will produce a more efficient reconnection and more energy can be introduced into the magnetosphere. This variability can be represented as two maxima around equinoxes, and a minimum around solstices (Zhao and Zong, 2012). We consider it to be very probable that this seasonal variation of magnetic range disturbance may transfer high quantities of energy into the MIT system. In fact, Schaefer et al. (2016) have shown a similar pattern in the intensity of the Southern Atlantic Anomaly (SAA). The SAA is a large region where the magnetic field is anomalously low and the radiation belt particles reach much lower altitudes than at similar latitudes around the globe. Similarly, the authors showed that the intensity of the SAA-trapped proton (Van Allen inner radiation belt) has a minimum around solstice and maximum during equinox (Fig. 9). In this scheme, our assumptions might induce a tight coupling between the RM variability and the energy transferred to the MIT system, which is seen in these two cases as (1) an increase of energetic particles trapped in the radiation belts, and (2) an increase of energy transferred into the high-latitude thermosphere. Therefore, we questioned if a similar pattern could be represented by our residuals in the equatorial and northern regions, and the resulting plot is shown in Fig. 10. In Fig. 10, the residuals are only presented to show the seasonal variability, and a clear similitude to the RM effect (Zhao and Zong, 2012) and the pattern of the SAA intensity (Fig. 9) is shown with the minimum values during solstices and maximum values around equinoxes. However, the pattern is more pronounced in the SPR, and a possible explanation for this may be the irregular shape of the Earth's magnetic field.
As mentioned above, the SAA is formed because of the noncoincidence of the southern magnetic dip pole and the Earth's rotating axis. In a similar way, the anomalously low values of the magnetic field in the Southern Hemisphere during summer might facilitate the energy entrance into the thermosphere, creating relatively higher values during December than during June. In addition, previous studies have found that the extension of the SAA decreases during geomagnetic storms, while high-energy protons precipitate from the cusps (Zou et al., 2015). After a sharp decrease due to a geomagnetic storm, the SAA has been shown to recover gradually over several months. However, as the effect of the contribution of the radiation belt on the thermospheric mass density disturbances' variability is questionable, we will address this possible research in future work. In fact, high-energy particles in the Van Allen belts are only a minor source of energy flows into the thermosphere, while the dominant inflows arise from electric fields and auroral particles, such as those linked to the Dungey cycle.
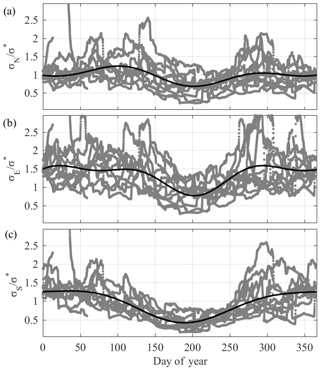
Figure 10Normalized residuals from this study showing only the seasonal variation (same as Fig. 4), for (a) the northern, (b) the equatorial, and (c) the southern regions. The Fourier fit is shown using the black line.
Thus, under these assumptions and based on shreds of evidence, the equinox minimum disturbance in terms of the RM effect offers a reasonable explanation for the seasonal variation in the magnitude of mass density disturbances due to magnetospheric forcing (Fig. 10). In addition, the irregular shape of the magnetic field, i.e., the offset between the southern dip pole and the rotation axis, might enhance the effects in the SPR, creating the latitudinal asymmetric behavior with enhanced disturbances during the summer of the Southern Hemisphere, which is also reflected by the SAA. We suspect that these enhanced disturbances in the SPR during summer may be caused by an increased energy input due to a weaker magnetic field in the noon sector. On the contrary, during the June solstice, as the northern Earth's magnetic dip pole is located near to the rotation axis (∼3∘), the disturbances may be reduced due to the fact that the Earth's magnetic field is less compressed. In fact, the evidence of the SAA is a clear example of the effects of the irregular shape of the magnetic field. These results and interpretations are consistent with the suggestions from of Bruinsma et al. (2006) regarding an enhanced summer vs. winter Joule heating at southern high latitudes; the very weak anomalies in the SPR during June solstice reported by Rentz and Lühr (2008); and the 50 % greater dependence of mass density on the Dst and Ap indices in the SPR than that in the NPR shown in Ercha et al. (2012).
These results support the potential improvement that can be gained from the use of parametric modeling of the density fluctuations with respect to magnetospheric proxies to improve predictions of thermospheric mass density perturbations, the resulting changes in satellite drag, and other derived physical parameters. Future studies resulting from the removal of mass density disturbances caused by the magnetospheric forcing can be addressed, but not restricted, to investigating additional sources of turbulence, such as lower atmospheric waves including tides and planetary waves, recurrent TADs reaching the opposite pole and beyond, or the negative density enhancements during geomagnetic storms.
In this study, we investigated the relationship between indices and mass density disturbances associated with magnetospheric forcing using 10 years (2003–2013) of GRACE observations, after accounting for annual, LST, and solar cycle dependencies via the parameterization of the main PCA modes. In the process, we removed possible long-term trends in the data by focusing on disturbances on timescales shorter than 10 d and dividing the analysis into sub-daily disturbances and those between 1 and 10 d.
The results show an unexpected fluctuation of disturbances due to solar cycle variations and an asymmetric fluctuation with lower values around the June solstice in the SPR, which are hypothetically related to the RM effect and the irregular shape of the Earth's magnetic field. We suspect that in the SPR during summer, when the RM effect is minimal, density enhancements during storm-time periods may be relatively higher than during June, due to increased energy input from a weaker side of the Earth's magnetic field, specifically that from which the SAA originates. Notwithstanding, note that the amount of energy transferred from the Van Allen belts into the thermosphere is only a minor source of energy input, whereas processes linked to the Dungey cycle may dominate the main variability.
Furthermore, we have detected and parameterized annual and solar cycle dependences included in thermospheric mass density disturbances due to magnetospheric forcing. We employ Pearson linear correlation coefficients calculated with delay times with a range of ±18 h between estimates and parameterizations at the three latitude regions to decipher the best fits. The parameterization in terms of the Dst index has shown the best correlation, but without time delay for prediction. The Am index and Em have shown great potential as predictors. The Am and Em indices have provided similar correlation, residuals, and a time delay of prediction at about 5–8 h. Employing the parameterizations presented here, the reduction of the standard deviation of the mass density residual disturbances due to magnetospheric forcing at an altitude of 475 km reaches a mean value of 30 %, and up to 60 % of the total residual on several occasions, with respect to residuals from removing only the solar cycle, seasonal, and LST dependencies. The parameterizations provided in this paper can be rescaled to the required altitude and added to current models, where geomagnetic proxies should be set to Am = 6 or equivalent. The resulting model is available at http://doi.org/10.5281/zenodo.3234582 (Calabia and Jin, 2019).
The main contributions in an easily understood manner are summarized as follows:
-
An unexpected dependence on the solar cycle, seasonal variation, and hemispheric asymmetry is found in the magnitude of high-frequency (δ < 10 d) thermospheric mass density disturbances due to magnetospheric forcing.
-
The seasonal variation produces lower disturbances during the June solstice, and the hypothesis of seasonal dependence on the RM effect is presented.
-
The hemispheric asymmetry produces higher variability in the SPR, and we suspect a dependence on the irregular shape of the Earth's magnetic field.
-
Correlation analysis is conducted using an extensive database (10 years) to provide time-lag values (below 1 h precision) for the currently employed magnetospheric proxies (Am, Em, and Dst) for thermospheric modeling.
-
The high-frequency disturbances (δ < 10 d) have been parameterized in terms of the above dependencies and can be employed to improve current thermospheric models.
These new findings can substantially improve the understanding of the complex MIT system, and help to improve the modeling of thermospheric mass density variations, with the resulting changes in satellite drag.
Comparisons with JB2008, NRLMSISE-00, and TIEGCM models show their incapability to reproduce the seasonal and solar cycle trends of disturbances. Similarities have been found at the equatorial region for the three models; however, strong discrepancies surface during low solar activity for NRLMSISE-00 and TIEGCM, showing a model overestimation of disturbance variability. While NRLMSISE-00 overestimates the disturbances during the low solar activity at the SPR, JB2008 shows an impressive agreement with GRACE results, in terms of our hypothesis on the seasonal variation due to the RM effect, and hemispheric asymmetry due to the irregular Earth's magnetic field.
Underlying research data are available in the Supplement related to this article.
The supplement related to this article is available online at: https://doi.org/10.5194/angeo-37-989-2019-supplement.
AC designed and carried out the experiments and modeling as well as writing the paper. SJ provided supervision, mentorship, funding support, and undertook revision tasks.
The authors declare that they have no conflict of interest.
This article is part of the special issue “Satellite observations for space weather and geo-hazard”. It is not associated with a conference.
The GRACE data were obtained from the Information System and Data Center (ISDC) GeoForschungsZentrum (GFZ) website (http://isdc.gfz-potsdam.de/, last access: 1 June 2016). Mass density estimates and models are provided in the Supplement.
This research has been supported by the National Natural Science Foundation of China–German Science Foundation (NSFC-DFG; grant no. 41761134092), the Startup Foundation for Introducing Talent of NUIST (grant no. 2243141801036), and the Talent Start-Up Funding project of NUIST (grant no. 1411041901010).
This paper was edited by Mirko Piersanti and reviewed by two anonymous referees.
Bates, D. R.: Some problems concerning the terrestrial atmosphere above 100 km level, P. R. Soc. A., 253, 451–462, 1959.
Bjornsson, H. and Venegas, S. A.: A manual for EOF and SVD analyses of climatic data, MCGill Univ., CCGCR Report No. 97-1, Montréal, Québec, 52 pp., 1997.
Borovsky, J. E. and Steinberg, J. T.: The “calm before the storm” in CIR/magnetosphere interactions: Occurrence statistics, solar-wind statistics, and magnetospheric preconditioning, J. Geophys. Res., 111, A07S10, https://doi.org/10.1029/2005JA011397, 2006.
Bowman, B. R., Tobiska, W. K., Marcos, F. A., Huang, C. Y, Lin, C. S., and Burke, W. J.: A new empirical thermospheric density model JB2008 using new solar and geomagnetic indices, AIAA/AAS Astrodynamics Specialist Conference, AIAA 2008–6438, 19 pp., 2008.
Bruinsma, S.: The DTM-2013 thermosphere model, J. Space Weather Space Clim., 5, A1, https://doi.org/10.1051/swsc/2015001, 2015.
Bruinsma, S. and Biancale, R.: Total density retrieval with STAR 2003. On board evaluation of the STAR accelerometer, in: First CHAMP Mission Results for Gravity, Magnetic and Atmospheric Studies, edited by: Reigber, Ch., Lühr, H., and Schwintzer, P., Springer, Berlin, Heidelberg, New York, 193–200, 2003.
Bruinsma, S., Tamagnan, D., and Biancale, R.: Atmospheric densities derived from CHAMP/STAR accelerometer observations, Planet. Space Sci., 52, 297–312, 2004.
Bruinsma, S., Forbes, J. M., Nerem, R. S., and Zhang, X.: Thermosphere density response to the 20–21 November 2003 solar and geomagnetic storm from CHAMP and GRACE accelerometer data, J. Geophys. Res., 111, A06303, https://doi.org/10.1029/2005JA011284, 2006.
Bruinsma, S. L., and Forbes, J. M.: Large-scale traveling atmospheric disturbances (LSTADs) in the thermosphere inferred from CHAMP, GRACE, and SETA accelerometer data, J. Atmos. Sol.-Terr. Phys., 72, https://doi.org/10.1016/j.jastp.2010.06.010, 2010.
Calabia, A.: Thermospheric neutral density variations from LEO accelerometers and precise orbits, Ph.D. Dissertation, Chinese Academy of Sciences, China, 2017.
Calabia, A. and Jin, S. G.: New modes and mechanisms of thermospheric mass density variations from GRACE accelerometers, J. Geophys. Res.-Space, 121, 11191–11212, 2016.
Calabia, A. and Jin, S. G.: Thermospheric density estimation and responses to the March 2013 geomagnetic storm from GRACE GPS-determined precise orbits, J. Atmos. Sol.-Terr. Phys., 154, 167–179, 2017.
Calabia, A. and Jin, S. G.: Supporting Information for “Solar-cycle, seasonal, and asymmetric dependencies of thermospheric mass density disturbances due to magnetospheric forcing”, Zenodo, https://doi.org/10.5281/zenodo.3234582, last access: 29 May 2019.
Deng, Y., Sheng, C., Yue, X., Huang, Y., Wu, Q., Noto, J., Drob, D. P., and Kerr, R. B.: Interhemispheric asymmetry of ionospheric conductance and neutral dynamics, AGU Fall Meeting Abstracts, Vol. 1, SA23D-06, 2014.
Denton, M. H., Borovsky, J. E, Skoug, R. M., Thomsen, M. F., Lavraud, B., Henderson, M. G., McPherron, R. L., Zhang, J. C., and Liemohn, M. W.: Geomagnetic storms driven by ICME- and CIR-dominated solar wind, J. Geophys. Res., 111, A07S07, https://doi.org/10.1029/2005JA011436, 2006.
Dungey, J. W.: Interplanetary magnetic fields and the auroral zones, Phys. Rev. Lett., 6, 47–48, 1961.
Ercha, A., Ridley, A. J., Zhang, D., and Xiao, Z.: Analyzing the hemispheric asymmetry in the thermospheric density response to geomagnetic storms, J. Geophys. Res., 117, A08317, https://doi.org/10.1029/2011JA017259, 2012.
Forbes, J. M., Gonzalez, R., Marcos, F. A., Revelle, D., and Parish, H.: Magnetic storm response of lower thermosphere density, J. Geophys. Res., 101, 2313–2319, 1996.
Fuller-Rowell, T. J.: The “thermospheric spoon”: A mechanism for the semiannual density variation, J. Geophys. Res., 103, 3951–3956, 1998.
Fuller-Rowell, T. J., Codrescu, M. V., Rishbeth, H., Moffett, R. J., and Quegan, S.: On the seasonal response of the thermosphere and ionosphere to geomagnetic storms, J. Geophys. Res., 101, 2343–2353, 1996.
Guo, J., Feng, X., Forbes, J. M., Lei, J., Zhang, J., and Tan, C.: On the relationship between thermosphere density and solar wind parameters during intense geomagnetic storms, J. Geophys. Res., 115, A12335, https://doi.org/10.1029/2010JA015971, 2010.
Iipponen, J. and Laitinen, T.: A method to predict thermospheric mass density response to geomagnetic disturbances using time-integrated auroral electrojet index, J. Geophys. Res.-Space, 120, 5746–5757, 2015.
Jin, S. G., Calabia, A., and Yuan, L.: Thermospheric sensing from GNSS and accelerometer on small satellites, Proc. IEEE, 106, 484–495, https://doi.org/10.1109/JPROC.2018.2796084, 2018.
Kan, J.K., and Lee, L.C.: Energy coupling function and solar wind-magnetosphere dynamo, Geophys. Res. Lett., 6, 577–580, 1979.
Knipp, D., Kilcommons, L., Hunt, L., Mlynczak, M., Pilipenko, V., Bowman, B., Deng, Y., and Drake, K.: Thermospheric damping response to sheath-enhanced geospace storms, Geophys. Res. Lett., 40, 1263–1267, 2013.
Lathuillere, C. and Menvielle, M.: WINDII thermosphere temperature perturbation for magnetically active situations, J. Geophys. Res., 109, A11304, https://doi.org/10.1029/2004JA010526, 2004.
Lathuillère, C., Menvielle, M., Marchaudon, A., and Bruinsma, S.: A statistical study of the observed and modeled global thermosphere response to magnetic activity at middle and low latitudes, J. Geophys. Res., 113, A07311, https://doi.org/10.1029/2007JA012991, 2008.
Lei, J., Thayer, J. P., Burns, A.G., Lu, G., and Deng, Y.: Wind and temperature effects on thermosphere mass density response to the November 2004 geomagnetic storm, J. Geophys. Res., 115, A05303, https://doi.org/10.1029/2009JA014754, 2010.
Liu, H. and Lühr, H.: Strong disturbance of the upper thermospheric density due to magnetic storms: CHAMP observations, J. Geophys. Res., 110, A09S29, https://doi.org/10.1029/2004JA010908, 2005.
Liu, H., Lühr, H., Henize, V., and Köhler, W.: Global distribution of the thermospheric total mass density derived from CHAMP, J. Geophys. Res., 11, A04301, https://doi.org/10.1029/2004JA010741, 2005.
Liu, H., Thayer, J., Zhang, Y., and Lee, W. K.: The non–storm time corrugated upper thermosphere: What is beyond MSIS?, Space Weather, 15, 746–760, 2017.
Liu, R., Lühr, H., Doornbos, E., and Ma, S.-Y.: Thermospheric mass density variations during geomagnetic storms and a prediction model based on the merging electric field, Ann. Geophys., 28, 1633–1645, https://doi.org/10.5194/angeo-28-1633-2010, 2010.
Liu, R., Ma, S.-Y., and Lühr, H.: Predicting storm-time thermospheric mass density variations at CHAMP and GRACE altitudes, Ann. Geophys., 29, 443–453, https://doi.org/10.5194/angeo-29-443-2011, 2011.
Lu, G., Richmond, A. D., Emery, B. A., Reiff, P. H., de la Beaujardière, O., Rich, F. J., Denig, W. F., Kroehl, H. W., R. Lyons, L., Ruohoniemi, J. M., Friis‐Christensen, E., Opgenoorth, H., Persson, M. A. L., Lepping, R. P., Rodger, A. S., Hughes, T., McEwin, A., Dennis, S., Morris, R., Burns, G., and Tomlinson, L.: Interhemispheric asymmetry of the high-latitude ionospheric convection pattern, J. Geophys. Res., 99, 6491–6510, 1994.
Lühr, H., Rother, M., Köhler, W., Ritter, P., and Grunwaldt, L.: Thermospheric up-welling in the cusp region: Evidence from CHAMP observations, Geophys. Res. Lett., 31, L06805, https://doi.org/10.1029/2003GL019314, 2004.
Marcos, F. A., Lai, S. T., Huang, C. Y., Lin, C. S., Retterer, J. M., Delay, S. H., and Sutton, E. K.: Towards next level satellite drag modeling, AIAA 2010–7840, paper presented at the AIAA Atmospheric and Space Environments Conference, Toronto, Ontario, Canada, 2–5 August, https://doi.org/10.2514/6.2010-7840, 2010.
Müller, S., Lühr, H., and Rentz, S.: Solar and magnetospheric forcing of the low latitude thermospheric mass density as observed by CHAMP, Ann. Geophys., 27, 2087–2099, https://doi.org/10.5194/angeo-27-2087-2009, 2009.
Picone, J. M., Hedin, A. E., Drob, D. P., and Aikin, A. C.: NRLMSISE-00 empirical model of the atmosphere: Statistical comparisons and scientific issues, J. Geophys. Res., 107, 1468, https://doi.org/10.1029/2002JA009430, 2002.
Preisendorfer, R.: Principal component analysis in meteorology and oceanography, Elsevier, Amsterdam, 425 p., 1988.
Qian, L., Burns, A. G., Emery, B. A., Foster, B., Lu, G., Maute, A., Richmond, A. D., Roble, R. G., Solomon, S. C., and Wang, W.: The NCAR TIE-GCM, in: Modeling the Ionosphere-Thermosphere System, edited by: Huba, J., Schunk, R., and Khazanov, G., John Wiley & Sons, Ltd, Chichester, UK, 73–83, 2014.
Rentz, S. and Lühr, H.: Climatology of the cusp-related thermospheric mass density anomaly, as derived from CHAMP observations, Ann. Geophys., 26, 2807–2823, https://doi.org/10.5194/angeo-26-2807-2008, 2008.
Russell, C. T. and McPherron, R. L.: Semiannual variation of geomagnetic activity, J. Geophys. Res., 78, 92–108, https://doi.org/10.1029/JA078i001p00092, 1973.
Schaefer, R.K., Paxton, L.J., Selby, C., Ogorzalek, B.S., Romeo, G., Wolven, B.C., and Hsieh, S.-Y.: Observation and modeling of the South Atlantic Anomaly in low Earth orbit using photometric instrument data, Space Weather, 14, 330–342, 2016.
Sutton, E. K., Forbes, J. M., and Nerem, R. S.: Global thermospheric neutral density and wind response to the severe 2003 geomagnetic storms from CHAMP accelerometer data, J. Geophys. Res., 110, A09S40, https://doi.org/10.1029/2004JA010985, 2005.
Sutton, E. K., Forbes, J. M., and Knipp, D. J.: Rapid response of the thermosphere to variations in Joule heating, J. Geophys. Res., 114, A04319, https://doi.org/10.1029/2008JA013667, 2009.
Tapley, B. D., Bettadpur, S., Watkins, M., and Reigber, C.: The gravity recovery and climate experiment: Mission overview and early results, Geophys. Res. Lett., 31, L09607, https://doi.org/10.1029/2004GL019920, 2004.
Villain, J. P.: Traitement des données brutes de l'accéléromètre Cactus. Etude des perturbations de moyenne échelle de la densité thermosphérique Etude des perturbations de moyenne échelle de la densité thermosphérique, Ann. Geophys., 36, 41–49, 1980.
Weimer, D. R.: Improved ionospheric electrodynamic models and application to calculating joule heating rates, J. Geophy. Res., 110, A05306, https://doi.org/10.1029/2004JA010884, 2005.
Wilks, D. S.: Statistical Methods in the Atmospheric Sciences, Academic Press, San Diego, Calif, 676 pp., 1995.
Zhao, H. and Zong, Q.-G.: Seasonal and diurnal variation of geomagnetic activity: Russell-McPherron effect during different IMF polarity and/or extreme solar wind conditions, J. Geophys. Res., 117, A11222, https://doi.org/10.1029/2012JA017845, 2012.
Zhou, Y. L., Ma, S. Y., Lühr, H., Xiong, C., and Reigber, C.: An empirical relation to correct storm-time thermospheric mass density modeled by NRLMSISE-00 with CHAMP satellite air drag data, Adv. Space Res., 43, 819–828, 2008.
Zhou, Y. L., Ma, S. Y., Liu, R. S., Luehr, H., and Doornbos, E.: Controlling of merging electric field and IMF magnitude on storm-time changes in thermospheric mass density, Ann. Geophys., 31, 15–30, https://doi.org/10.5194/angeo-31-15-2013, 2013.
Zou, H., Li, C., Zong, Q., Parks, G.K., Pu, Z., Chen, H., Xie, L., and Zhang, X.: Short-term variations of the inner radiation belt in the South Atlantic anomaly, J. Geophys. Res.-Space, 120, 4475–4486, 2015.


