the Creative Commons Attribution 4.0 License.
the Creative Commons Attribution 4.0 License.
 | 13 Aug 2019
On the radiation belt location during the 23rd and 24th solar cycles
Alexei V. Dmitriev
Within the last two solar cycles (from 2001 to 2018), the location of the outer radiation belt (ORB) was determined using NOAA/Polar-orbiting Operational Environmental Satellite (POES) observations of energetic electrons with energies above 30 keV. It was found that the ORB was shifted a little (∼1∘) in the European and North American sectors, while in the Siberian sector the ORB was displaced equatorward by more than 3∘. The displacements corresponded qualitatively to the change in the geomagnetic field predicted by the IGRF-12 model. However, in the Siberian sector, the model has a tendency to underestimate the equatorward shift of the ORB. The shift became prominent after 2012, which might have been related to a geomagnetic “jerk” that occurred in 2012–2013. The displacement of the ORB to lower latitudes in the Siberian sector can contribute to an increase in the occurrence rate of midlatitude auroras observed in the Eastern Hemisphere.
- Article
(5673 KB) - Full-text XML
-
Supplement
(2801 KB) - BibTeX
- EndNote


The outer radiation belt (ORB) is populated by energetic and relativistic electrons trapped in the magnetosphere at drift shells above L ∼3 (e.g., Ebihara and Miyoshi, 2011). The ORB is very dynamic and exhibits variations in a wide temporal range: short-term storm-time and local-time variations, 27 d solar rotation, and seasonal and solar cycle variations (e.g., Li et al., 2001; Baker and Kanekal, 2008; Miyoshi and Kataoka, 2011). During magnetic storms, the ORB is substantially disturbed and shifted earthward (Baker et al., 2016; Shen et al., 2017). The storm-time variation is the strongest variation for both the ORB location and intensity (Baker and Kanekal, 2008). Magnetic storms are produced by interplanetary coronal mass ejecta (ICME) and high-speed streams (HSS) of the solar wind from coronal holes. The seasonal variations – with maxima at equinoxes – can be explained by the effect of the interplanetary magnetic field (IMF) orientation relative to the geomagnetic dipole (Li et al., 2001; O'Brien and McPherron, 2002; McPherron et al., 2009). The ORB manifests prominent variations with the solar cycle (Fung et al., 2006; Baker and Kanekal, 2008): it has been shown that the ORB maximum is mostly distant from the Earth during solar minima (Miyoshi et al., 2004) and is closest to the Earth during solar maxima (Glauert et al., 2018).
Apparently, the intense variations mask relatively weak long-term changes related to a secular variation of the core and crustal magnetic fields. Recently, a number of authors have reported significant changes in the Earth's magnetic field. The magnetic axial dipole has decreased by 9 % over the past 175 years (e.g., Finlay et al., 2016). It has also been shown that the north magnetic dip pole, the point where the magnetic field inclination is vertical, has drifted from Canada toward Siberia with the speed rapidly increasing from 10 km yr−1 in the 1990s to more than 50 km yr−1 at present (Chulliat et al., 2010; Thebault et al., 2015). Between 1989 and 2002, the most dramatic magnetic field changes of > 50 nT yr−1 were found in the Canadian Arctic and eastern Siberia.
The effects of dipole decay and pole drift are predicted by the 12th generation of the International Geomagnetic Reference Field model (IGRF-12; e.g., Thebault et al., 2015). However, in the Siberian sector, significant anomalies in the main geomagnetic field were found at high latitudes within the 80–130∘ longitudinal range (Gvishiani et al., 2014). In this sense, independent verification of changes in the geomagnetic field at high and middle latitudes is required. Namely, the decrease of the magnetic dipole should result in a global equatorward shift of the magnetospheric domains such as the ORB and the auroral region. The drift of the north magnetic pole should cause a decrease (increase) of the ORB and the auroral latitudes in the Siberian (North American) sectors.
The long-term changes in the location of the auroral region were reported by Smith et al. (2017). They analyzed the latitudinal location of auroral electrojets (AEJs) and revealed a prominent latitudinal displacement of the AEJs by several degrees over the years 2004 to 2014 relative to the previous solar maxima in 1970 and 1980: in the Siberian sector AEJs shifted to lower latitudes; and in the American sector AEJs shifted to higher latitudes. These opposite shifts in different sectors cannot be explained by the solar cycle variation; thus, they have been attributed to the core and crustal magnetic fields. Conversely, the technique of auroral precipitations is hard to use for tracing of the long-term geomagnetic variations due to high variability in the intensity, location and extension of auroras (e.g., Cresswell-Moorcock et al., 2013; Smith et al., 2017).
Additional evidence of prominent changes in the geomagnetic field can be found from a sudden increase in the occurrence of aurora borealis during the years from 2015 to 2017. There were numerous reports of the aurora borealis being observed at middle latitudes in North America, Europe and Russia. Table 1 lists the days when discrete auroras were detected in big Russian cities, such as Moscow (55∘45 N, 37∘37 E), St. Petersburg (59∘57 N, 30∘18 E) and Novosibirsk (55∘1 N, 82∘55 E). It is important to note that while midlatitude discrete auroras are observed quite often in the North American region, this phenomenon is rare at lower magnetic latitudes such as central Europe and, in particular, in central Russia (MacDonald et al., 2015; Vázquez et al., 2016). The previously mentioned low-latitude aurora borealis was observed during extremely strong geomagnetic storms with a minimum Dst < −300 nT in October–November 2003 (e.g., Shiokawa et al., 2005; Mikhalev et al., 2004).
Table 1Observations of discrete auroras in Russia from 2015 to 2017.
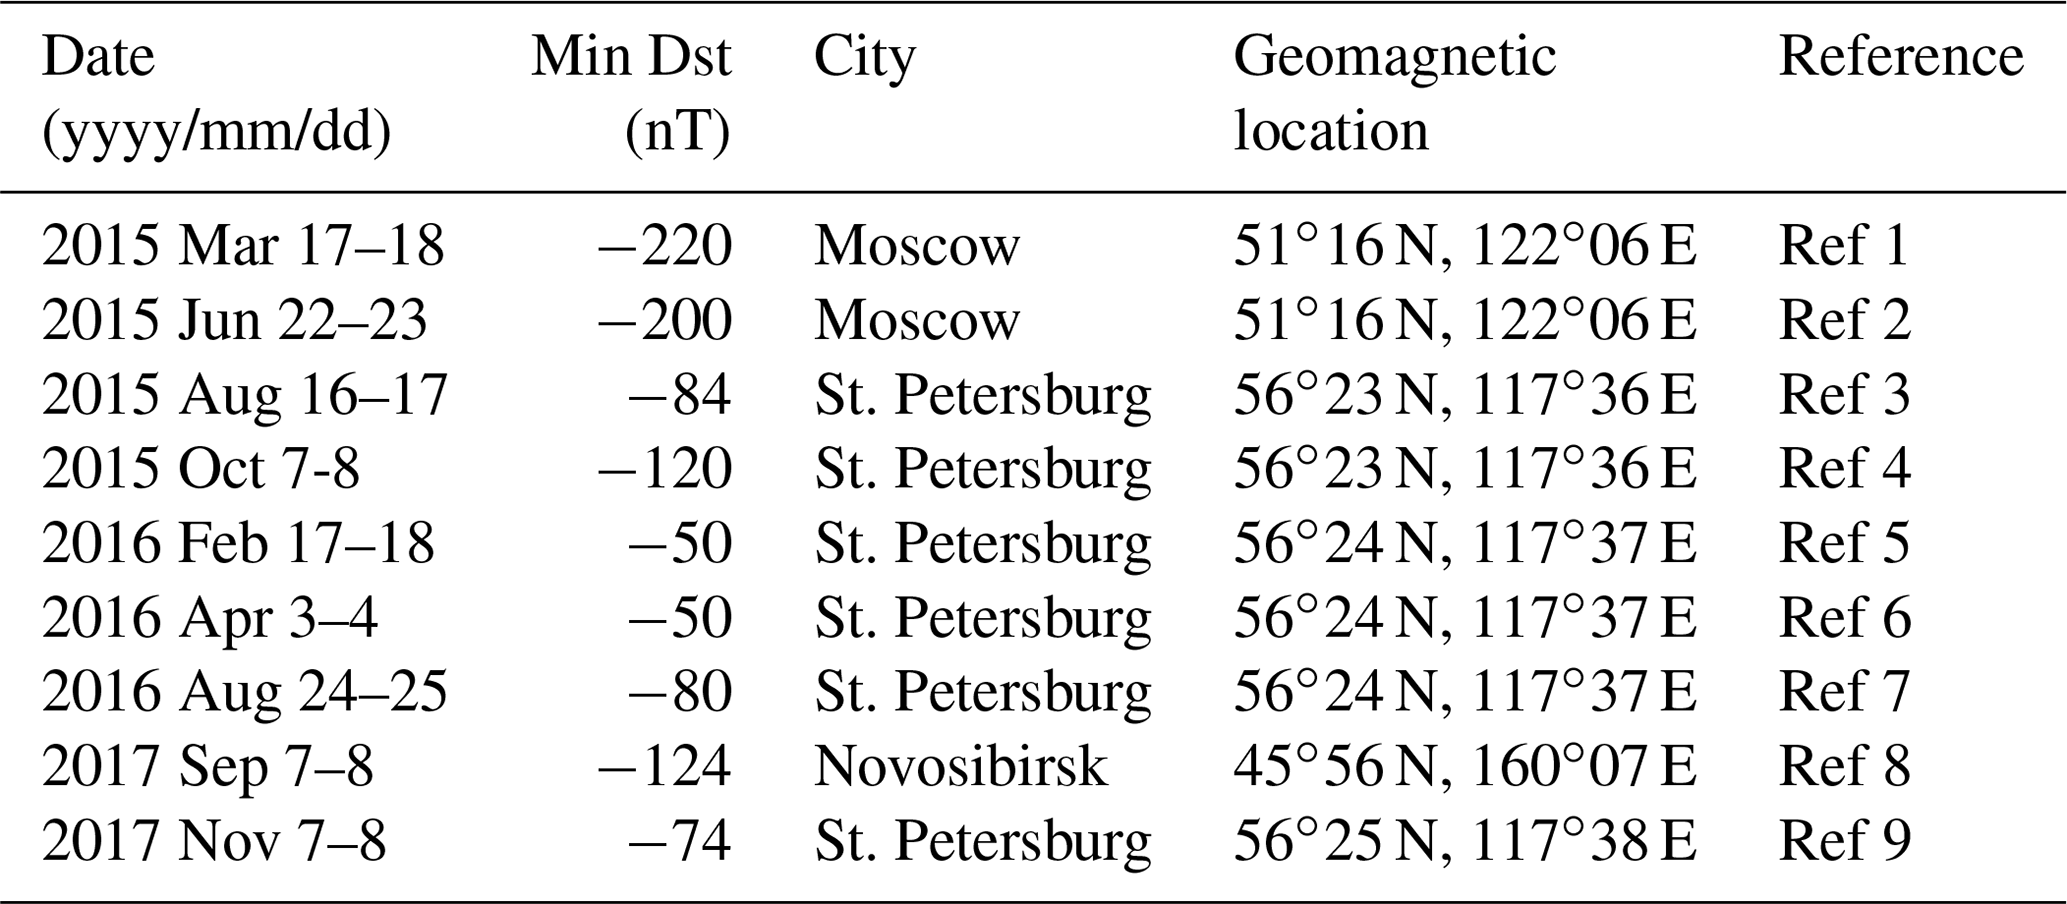
Ref 1: http://www.dp.ru/a/2015/03/18/Severnoe_sijanie_uvideli_zh/, last access: 9 August 2019. Ref 2: http://www.dp.ru/a/2015/06/23/Severnoe_sijanie_uvideli_v/, last access: 9 August 2019. Ref 3: http://http://47news.ru/articles/92419/, last access: 9 August 2019. Ref 4: http://www.dp.ru/a/2015/10/08/Severnoe_sijanie_v_Peterbu/, last access: 9 August 2019. Ref 5: http://www.fontanka.ru/2016/02/17/058/, last access: 9 August 2019. Ref 6: http://www.dp.ru/a/2016/04/03/ZHiteli_Peterburga_deljatsja/, last access: 9 August 2019. Ref 7: http://www.fontanka.ru/2016/08/24/035/, last access: 9 August 2019 and http://www.topnews.ru/news_id_92986.html, last access: 9 August 2019. Ref 8: http://www.ntv.ru/video/1515160/, last access: 9 August 2019. Ref 9: http://www.fontanka.ru/2017/11/07/134/, last access: 9 August 2019.
In contrast, magnetic storms between 2015 and 2017 were not very intense, as one can see from Table 1. The strongest storm on 17–18 March 2015, the so-called St. Patrick's Day storm, had a minimum Dst of −220 nT (e.g., Kataoka et al., 2015). During the St. Patrick's Day storm, the aurora borealis was observed in North America, central Europe (e.g., “Strongest geomagnetic storm of SC24 sparks spectacular aurora display” at https://watchers.news/2015/03/18/, last access: 9 August 2019) and in a number of cities in central Russia and Siberia (e.g., https://www.rt.com/news/241845-aurora-borealis-central-russia/, last access: 9 August 2019). During the storm, Case et al. (2015) found that discrete auroras were observed at unusually low latitudes, which were much lower than those predicted by the models of Roble and Ridley (1987) and Newell et al. (2010).
Auroras are produced by charged particles precipitating from the magnetosphere to the high-latitude atmosphere. The charged particles move along the magnetic field lines and, thus, the location of precipitation is controlled both by the location of the source and by the geomagnetic field configuration. In the present study, we analyze the configuration of the magnetosphere using observations of energetic electrons from the ORB. At low heights, the ORB electrons are observed at middle to high latitudes adjacent to the region of auroral precipitations (Lam et al., 2010). Here we use experimental data on energetic electrons measured by several low-earth orbit (LEO) polar-orbiting satellites during the time period from 2001 to 2016. The method of analysis is described in Sect. 2, results are presented and discussed in Sects. 3 and 4, respectively, and Section 5 offers conclusions.
Energetic electrons in energy ranges > 30, > 100 and > 300 keV are measured at LEO by the Medium Energy Proton and Electron Detector (MEPED) instruments on board the NOAA/Polar-orbiting Operational Environmental Satellite (POES) satellites (Evans and Greer, 2004; Asikainen and Mursula, 2013). Six POES satellites NOAA-16, NOAA-17, NOAA-18, NOAA-19, METOP-01 and METOP-02 (hereafter, P6, P7, P8, P9, P1 and P2, respectively) have sun-synchronous orbits at altitudes of ∼800–850 km in different local time sectors. Different POES satellites were operating during different years as shown in Table 2.
Table 2List of quiet days in June selected for POES observations of the outer radiation belt.
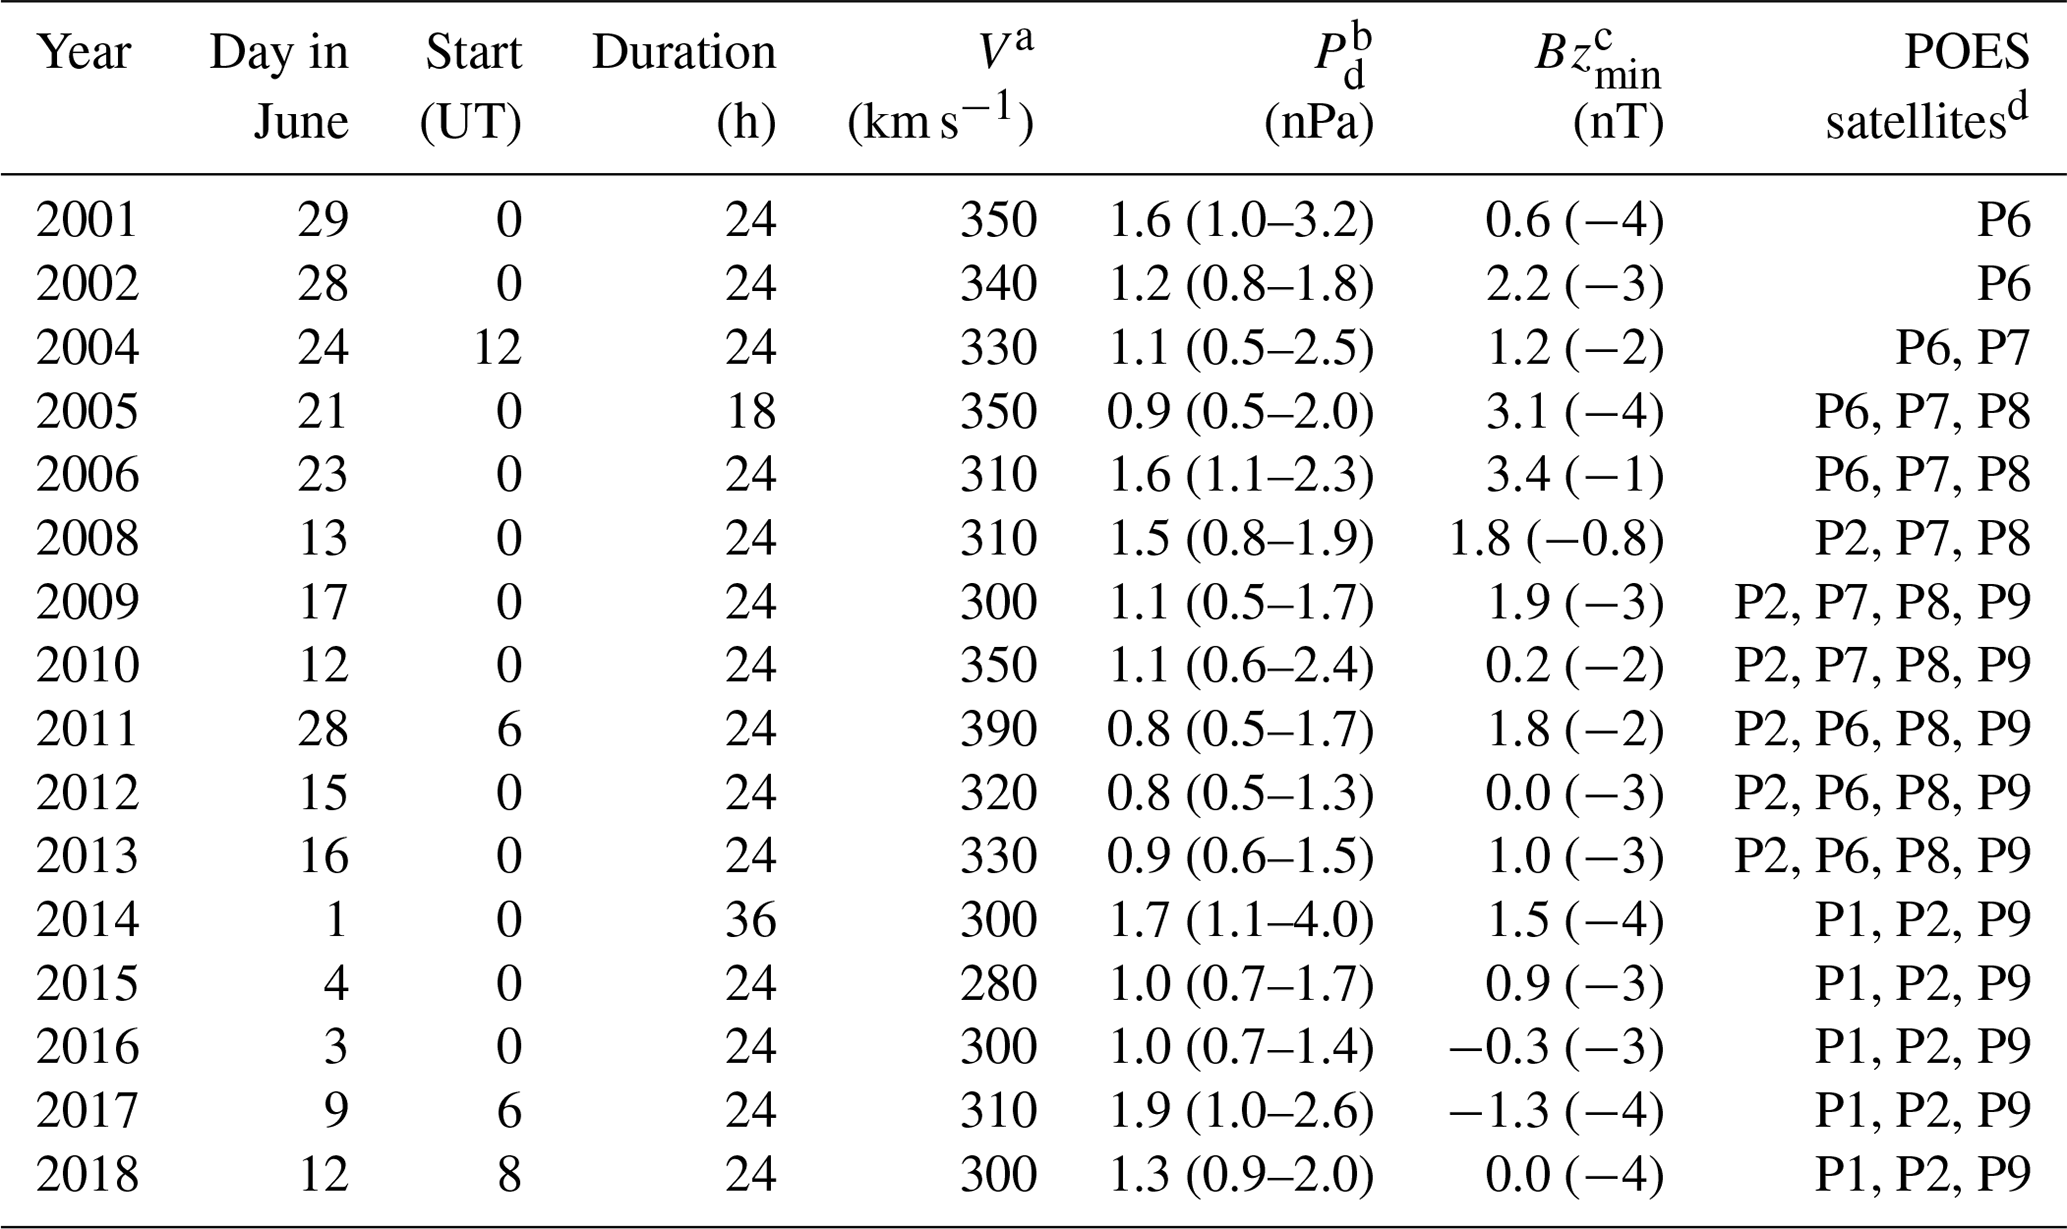
a Daily average of the solar wind velocity. b Daily average of the solar wind dynamic pressure and its minimum and maximum in parentheses. c Daily average Bz component of the interplanetary magnetic field and Bz minimum in parentheses. d POES satellites that observed the outer radiation belt.
The outer magnetosphere and the ORB are very dynamic regions, which are directly controlled by highly variable solar wind plasma streams and the interplanetary magnetic field (IMF). As a result, the location of the ORB and its high-latitude projection to the heights of the LEO vary substantially (e.g., Dmitriev et al., 2010; Rodger et al., 2010). Namely, a strong local time variation is related to the global day–night asymmetry of the magnetosphere such that the ORB is observed at higher latitudes during daytime. Variation of the geomagnetic tilt angle also causes a change in the ORB latitudinal location. Interplanetary and geomagnetic disturbances result in a prominent equatorward shift of the ORB.
In order to eliminate the disturbing factors, we consider so-called “quiet days”. Figure 1 demonstrates an example of geomagnetic conditions and measurements of the solar wind plasma and the IMF acquired from the “Wind” upstream monitor during a quiet day on 23 June 2006. On this day, the solar wind velocity was slow (∼310 km s−1), the solar wind dynamic pressure was slightly varying around ∼1.6 nPa and the IMF had a northward orientation that resulted in very quiet geomagnetic activity (AE < 100 nT, Dst ∼0 nT).
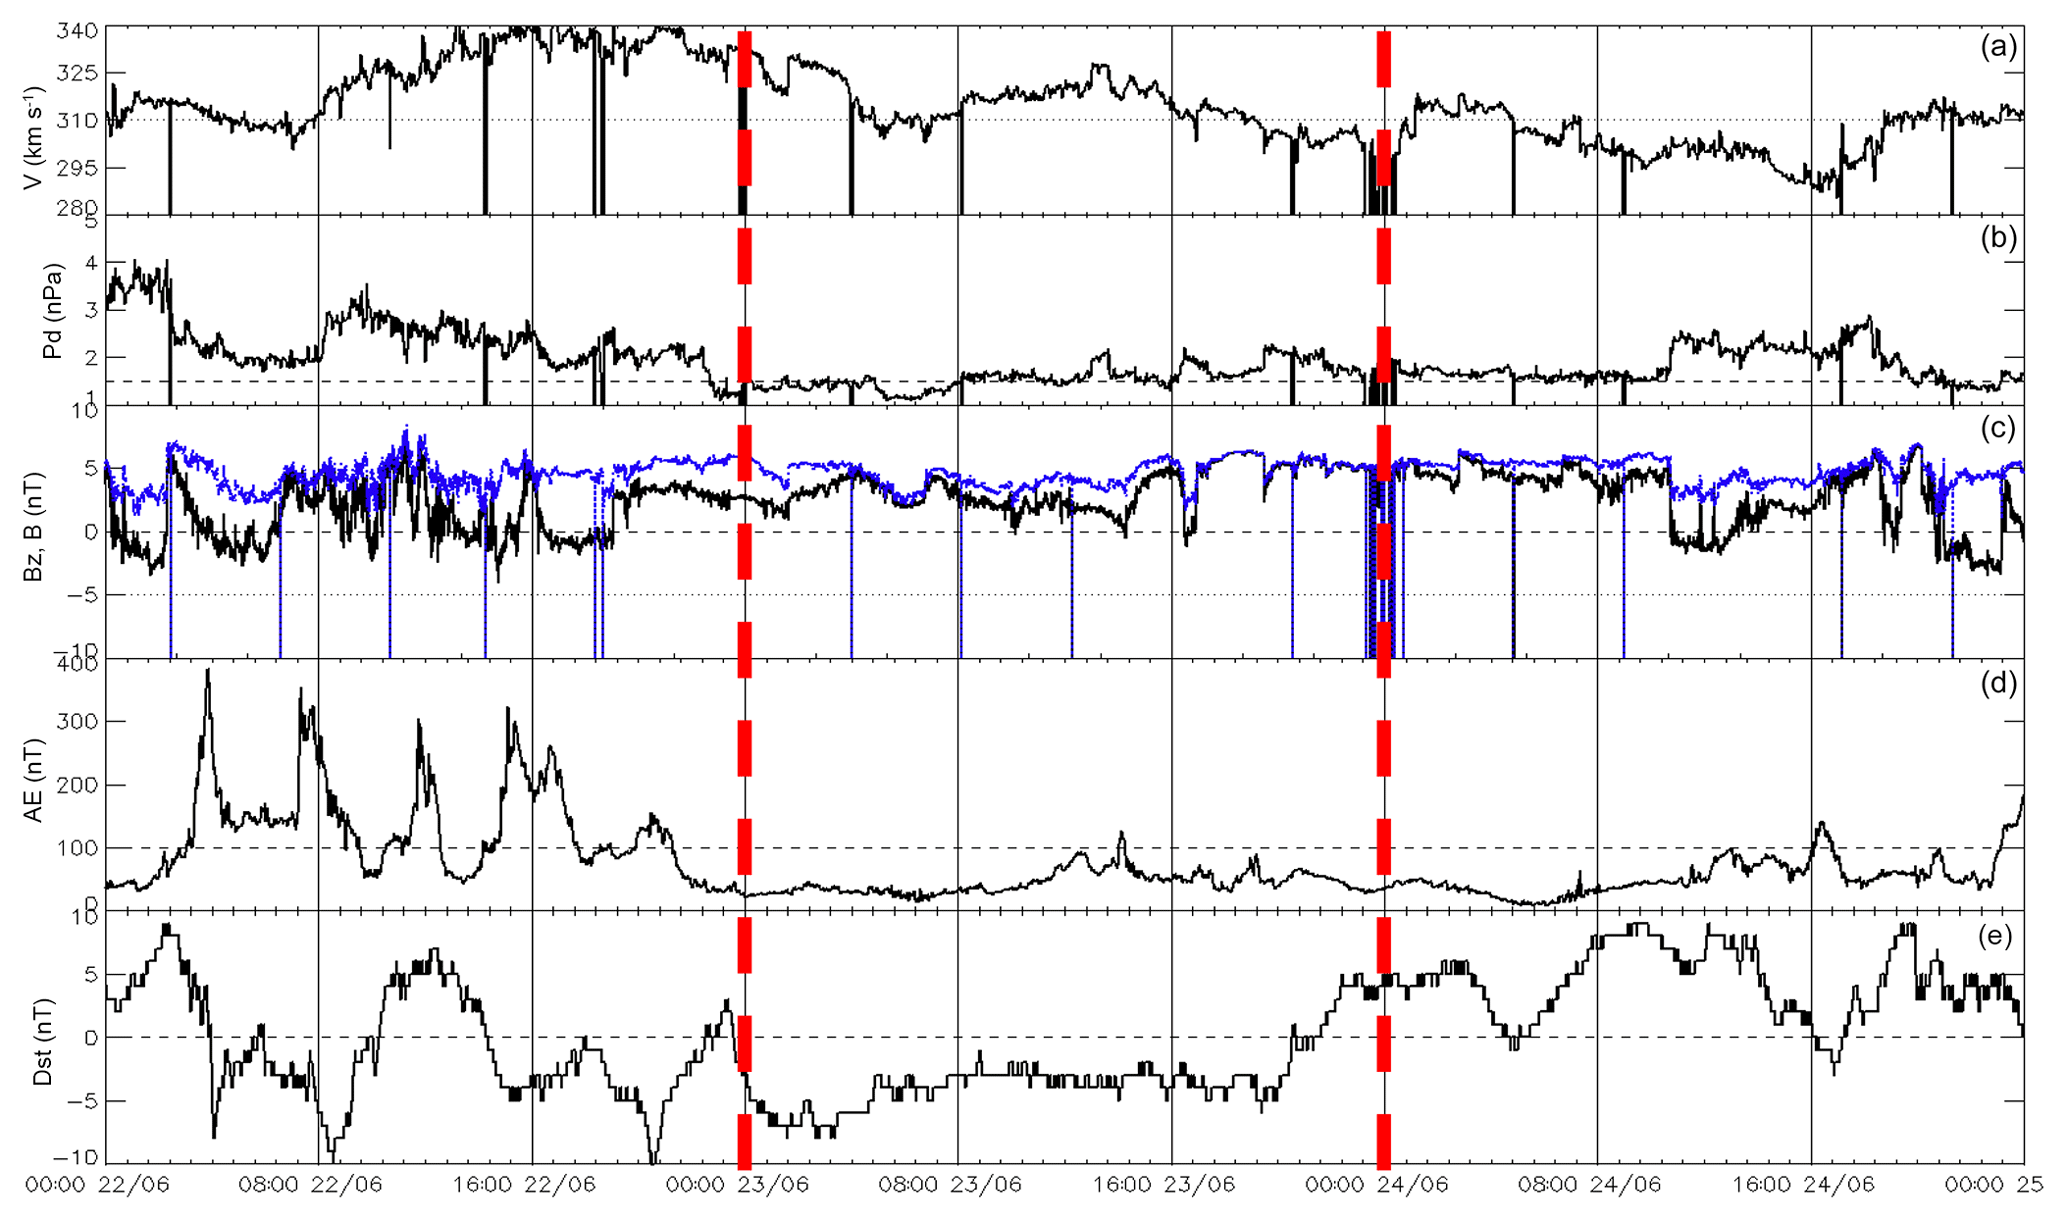
Figure 1Solar wind and geomagnetic conditions from 22 to 24 June 2006: solar wind bulk velocity V (a), solar wind dynamic pressure Pd (b), interplanetary magnetic field magnitude B (blue dotted curve) and Bz component (black solid curve) (c), auroral electrojet index AE (d), and storm-time Dst index (e). The 23 June (indicated by vertical red dashed lines) was very quite with respect to the solar wind and geomagnetic parameters.
The list of quiet days selected during the time interval from 2001 to 2018 is presented in Table 2. The solar wind data were acquired from the Wind upstream monitor. The selection of quiet days was based on the following criteria:
-
The Dst variation was close to 0 and the AE index was lower than 200 nT, i.e., the geomagnetic activity was very weak.
-
The solar wind dynamic pressure Pd varied slightly around its average values falling within the range of ∼1–2 nPa.
-
The solar wind speed was < 400 km s−1 and the amplitudes of the negative IMF Bz were weak (< 4 nT). Note that a solar wind with a speed of V> 400 km s−1 is often associated with HSSs from coronal holes. Fast solar wind streams initiate the Kelvin–Helmholtz instability at the magnetopause and also produce recurrent magnetic storms, which are accompanied by an intensification of wave activity in the outer magnetosphere that results in effective acceleration and radial transport of the ORB electrons (Engebretsone et al., 1998; Tsurutani et al., 2006; Horne et al., 2007; Su et al., 2015).
-
The quiet days were chosen as long as possible after magnetic storms such that storm-time disturbances of the ORB had time to relax. Usually, the quiet days occurred after a long-lasting recovery phase of recurrent magnetic storms (Suvorova et al., 2013).
The local time variation of the ORB latitudinal location was minimized by the choice of a narrow local time (LT) sector around noon (from 10:00 to 14:00 LT). We chose quiet days around the June solstice in order to minimize the tilt angle variations. Note that the June months in 2003 and 2007 were very disturbed; therefore, no quiet days were selected for those years.
Figure 2 shows an example of NOAA/POES measurements of energetic electrons at various geographic coordinates during the quiet days on 23 June 2006 and 3 June 2016. The geographic maps are composed from data retrieved over multiple orbits of the NOAA/POES satellites in the noon sector (12:00 ± 02:00 LT). For each 3∘ (longitude) × 0.5∘ (latitude) bin, we calculate the average flux of electrons measured by the 90∘ detector of the MEPED instrument. At high latitudes, the detector observes trapped electrons with pitch angles close to 90∘, i.e., near the mirror points.
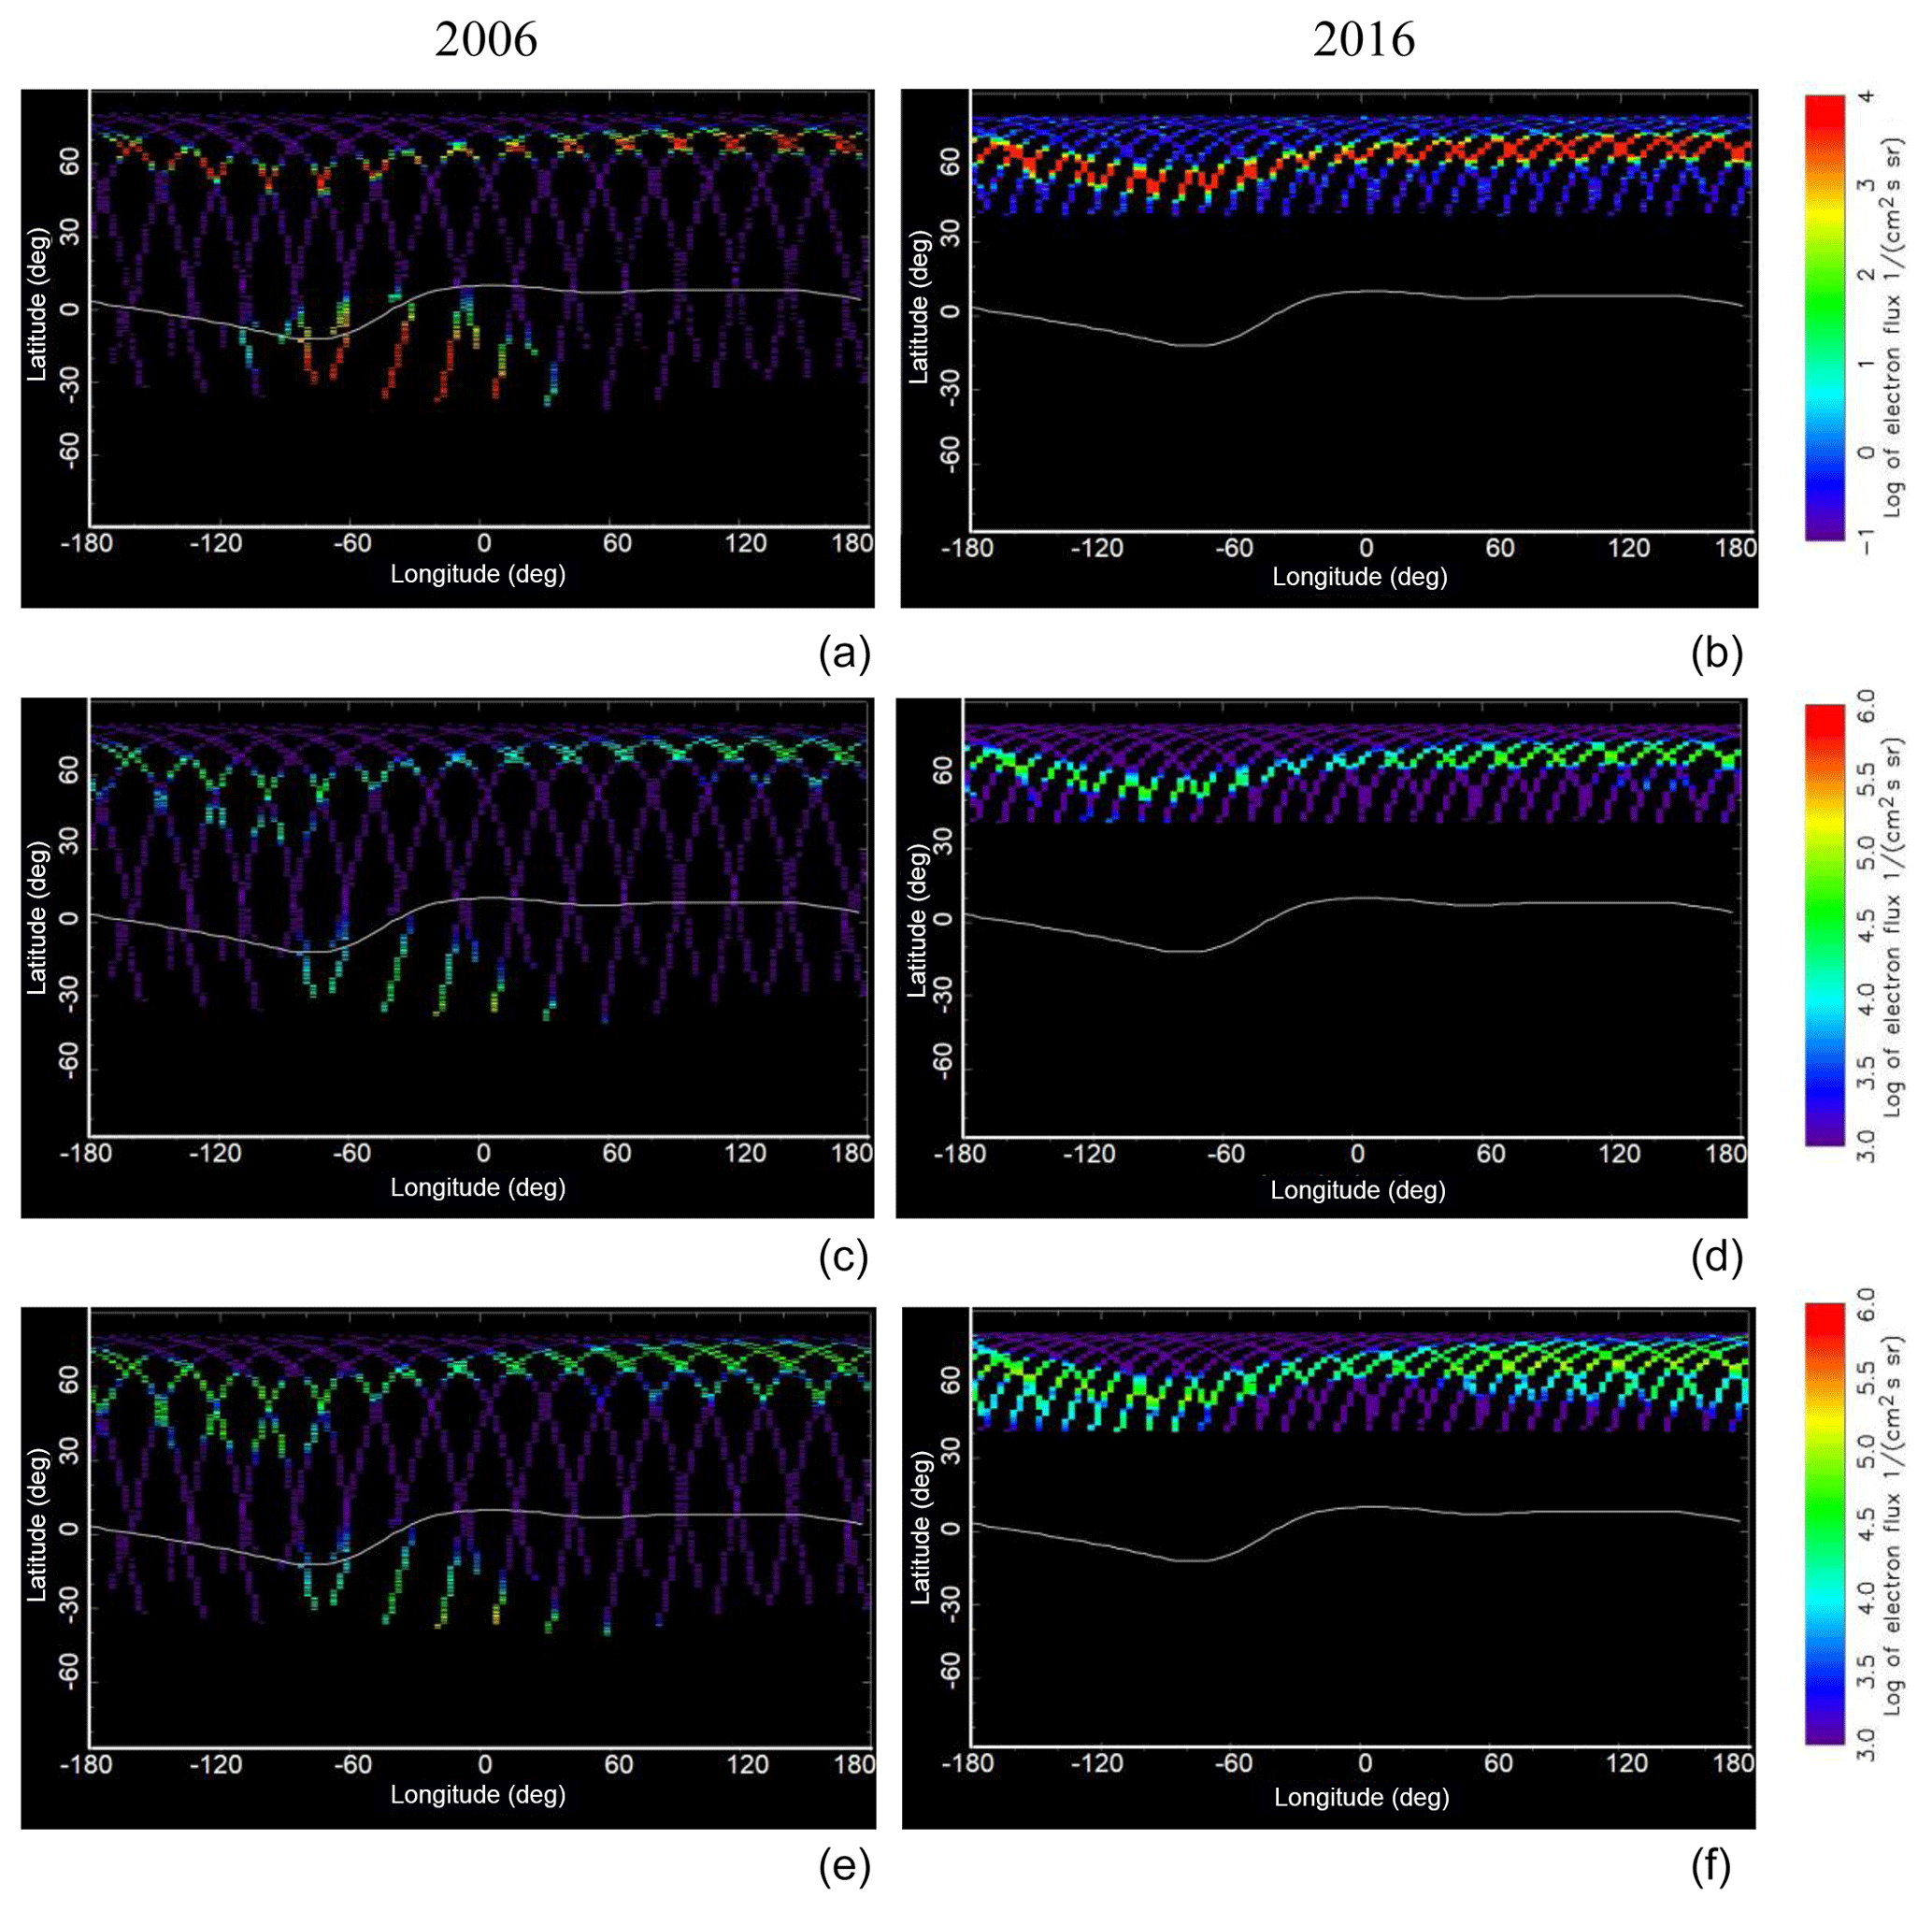
Figure 2Geographic maps of energetic electron fluxes with energies > 300 (a, b), > 100 (c, d), > 30 keV (e, f) and pitch angles of ∼90∘ observed by POES satellites at a height of ∼850 km in the 2 h vicinity of local noon (left column) on 23 June 2006 and (right column) on 2 June 2016. The solid wide curve indicates the geomagnetic Equator. The outer and inner electron belts and a slot region between them are clearly seen (except for > 300 keV electrons), respectively, at high and middle latitudes in the longitudinal range from ∼90∘ E to ∼80∘ W.
The limitation of the ORB measurements at a given local time originate from the fixed local time of POES satellites on sun-synchronous orbits. As one can see from Fig. 2 and Table 2, large statistics in the Northern Hemisphere can be obtained from a number of POES satellites moving in the 2 h vicinity of local noon around the June solstice. The ORB can easily be identified as a wide belt of intense electron fluxes at high latitudes. At middle latitudes, in longitudinal ranges from ∼90 to 180∘ E in the Eastern Hemisphere and from ∼80 to 180∘ W in the Western Hemisphere, one can also see intense electron fluxes from the inner electron belt and a slot region between the outer and inner belts. The slot region almost vanishes in the maps of sub-relativistic electrons with energies > 300 keV. Qualitative examination of the ORB location in Fig. 2 reveals that the outer electron belt in 2016 is located few degrees lower (with respect to latitude) than that in 2006 in the Eastern Hemisphere. The most obvious difference can be found for the slot region, which corresponds to the low-latitude boundary of the ORB.
For quantitative determination of the ORB latitudinal displacement, we analyze electron fluxes in 4∘ vicinities of three longitudes: 80∘ W (the American sector), 0∘ E (the European sector) and 100∘ E (the Siberian sector). Figure 3 shows latitudinal profiles of > 30, > 100 and > 300 keV electron fluxes with pitch angles of ∼90∘ observed by the NOAA/POES satellites around given longitudes during the quiet days in the years from 2001 to 2018. One can easily identify the ORB maximum at high latitudes and the slot region at middle latitudes for the American and Siberian sectors. Above Europe, the slot region is not detected at NOAA/POES orbit altitudes.
It should be noted that after the year 2014, the experimental data on electrons detected by POES are presented in a different format, such that the energy channels of electrons are different from those presented earlier: > 40 keV instead of > 30 keV, > 130 keV instead of > 100 keV and > 290 keV instead of > 300 keV. Owing to this fact, the cross-calibration of the electron detectors is difficult. Conversely, the difference in energies is not very large; thus, it should not strongly affect the location of the ORB. At least the differences are much smaller than the steps between the channels. Therefore, the complex analysis of all three electron channels allows for the minimization of this effect.
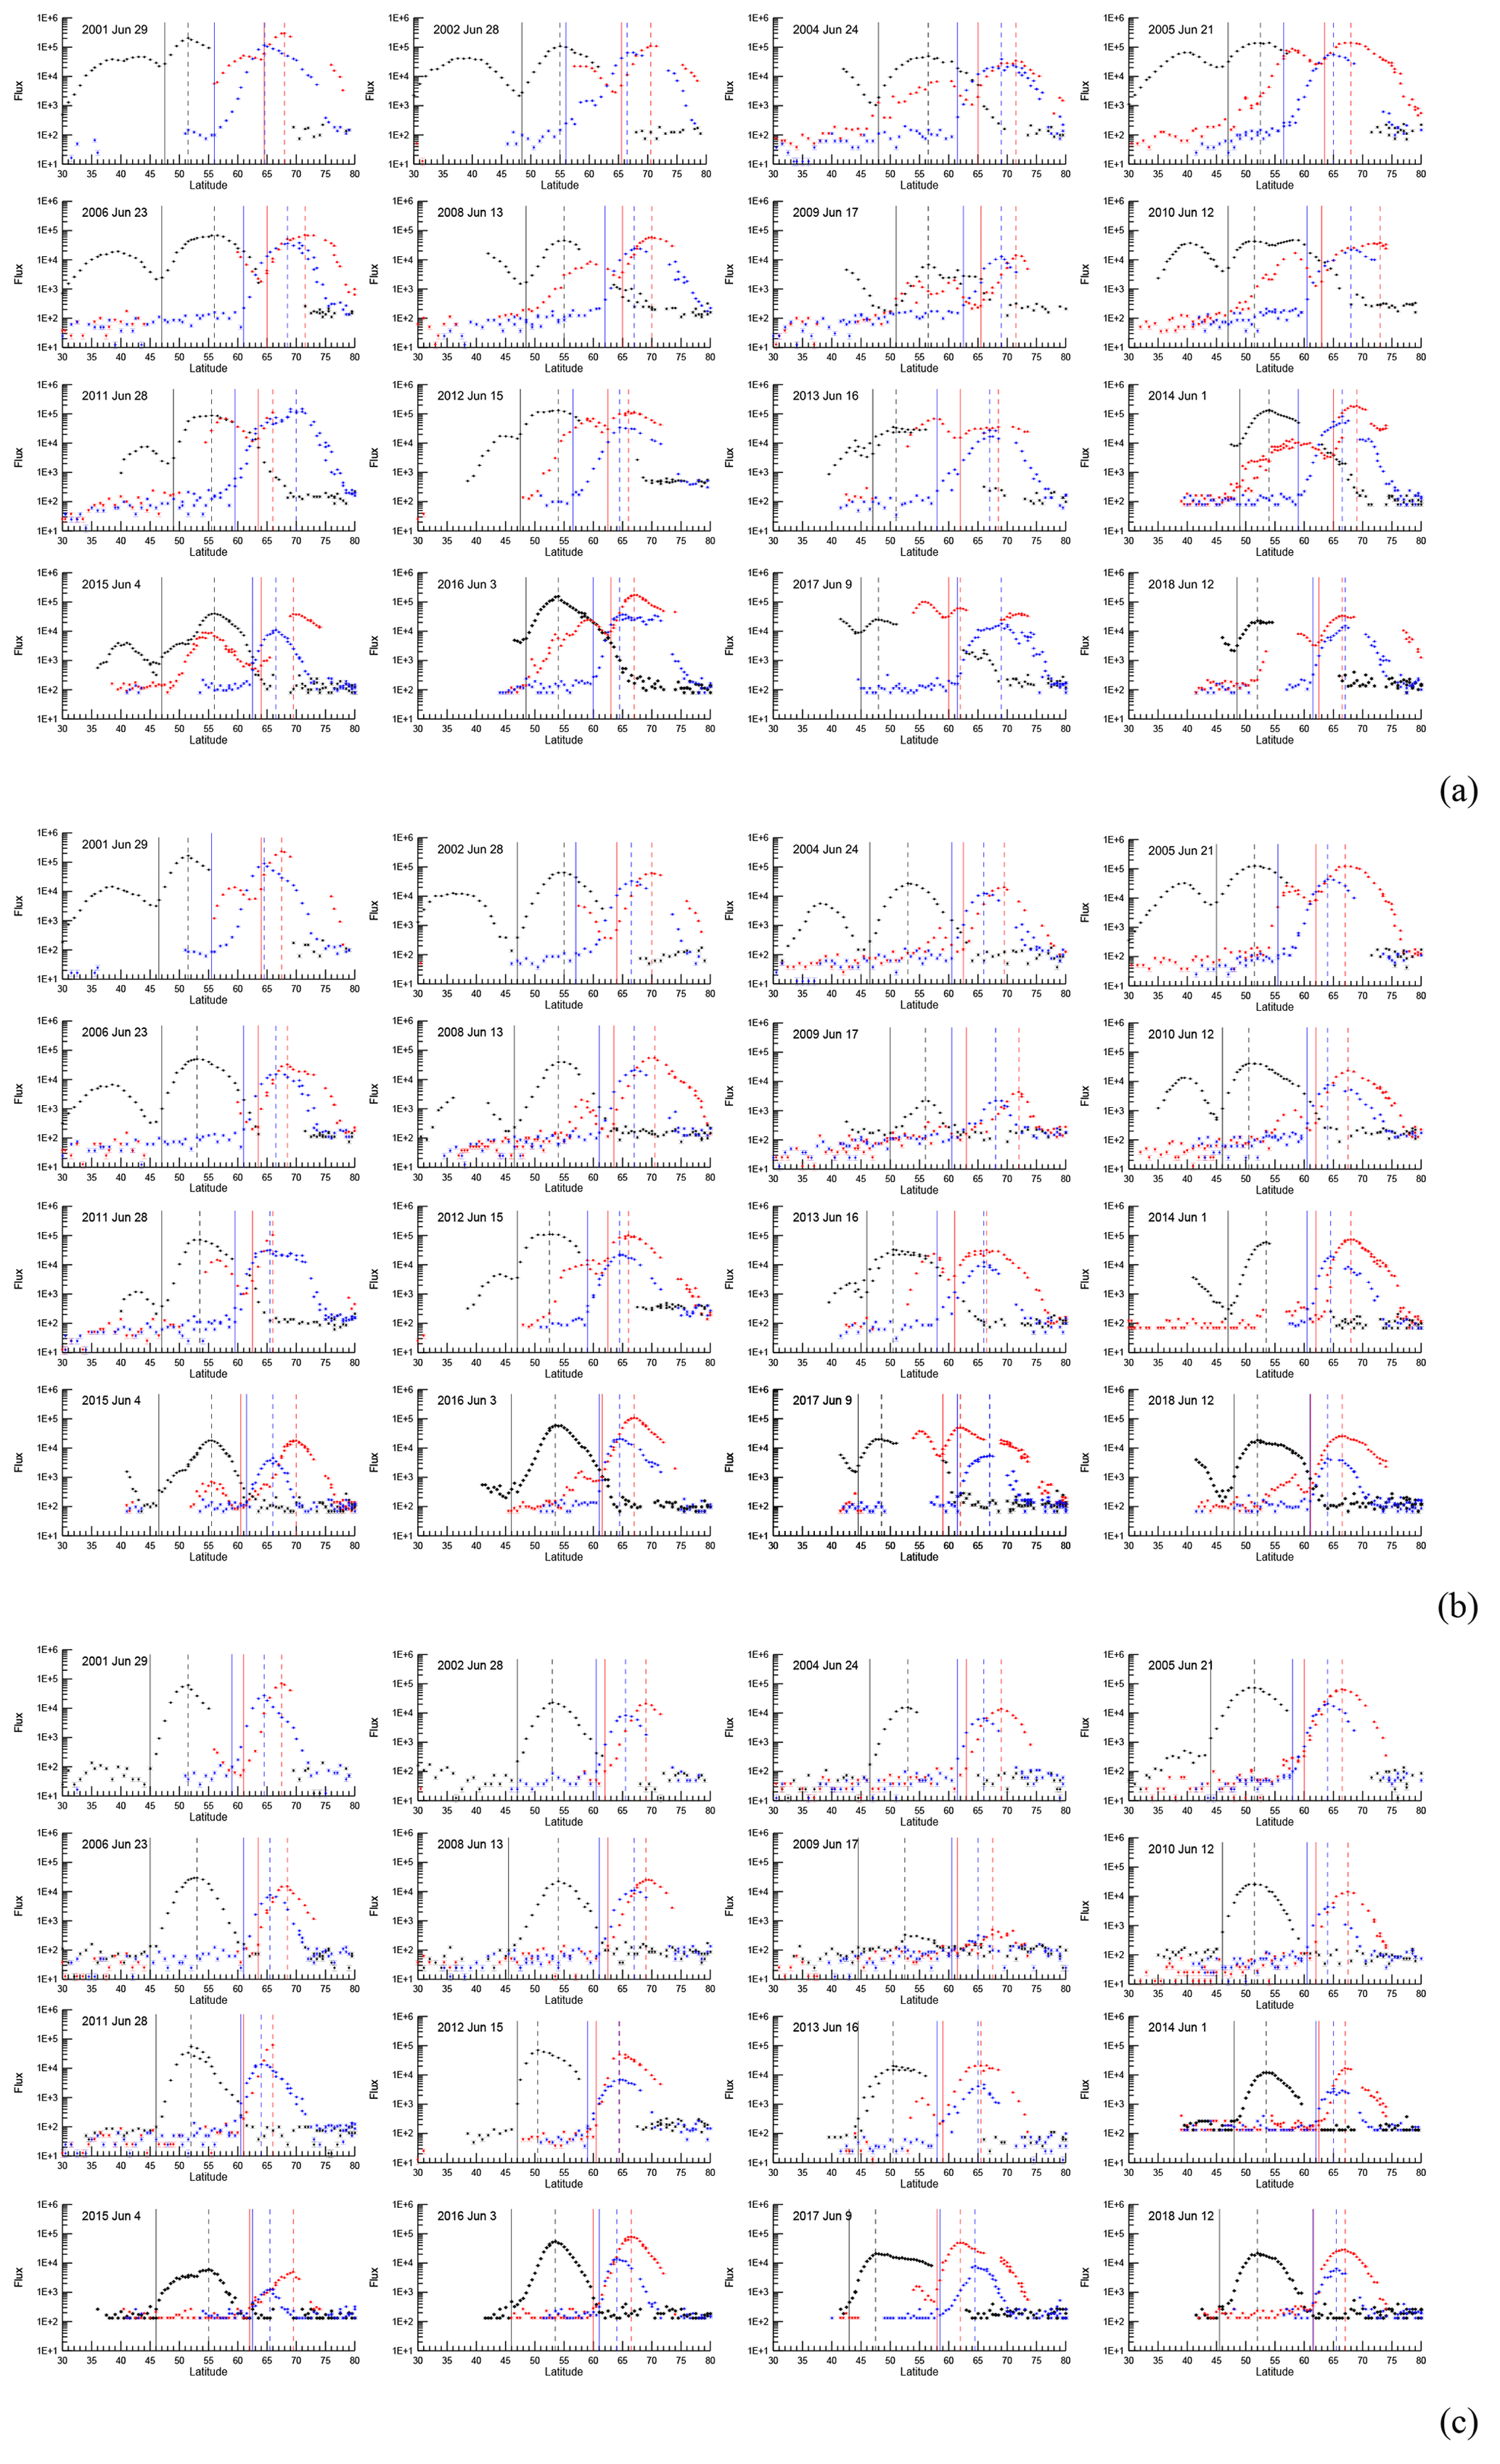
Figure 3Latitudinal profiles of electron fluxes with pitch angles of ∼90 ∘ observed by POES satellites during quiet days in different years at a height of ∼850 km in the vicinity of local noon at longitudes around 100∘ E (red circles), 0∘ E (blue crosses) and 80∘ W (black diamonds) for various energy channels: (a) > 30, (b) > 100 and (c) > 300 keV. Vertical dashed and solid lines indicate latitudes of the maximum and inner edge of the outer radiation belt, respectively.
In Fig. 3, the ORB maxima in the American, European and Siberian sectors can be found in the latitude ranges from 50 to 58∘, from 64 to 70∘ and from 62 to 74∘, respectively. We determine the geographic latitude of the maxima for each year with an accuracy of 0.5 to 1∘. One can see that the location as well as the intensity of the maximum varies from year to year. The intensity is minimal during the solar minimum in 2009. The fluxes of > 300 keV electrons (Fig. 3c) were very weak, such that the determination of the ORB was very difficult. In addition, the ORB maximum above Siberia could not be determined in 2011 due to limited data.
Qualitatively, the position of the ORB maximum above Siberia is closer to 70 and 65∘ in 2001 to 2010 and in 2012 to 2018, respectively. Above Europe and North America, variation in the ORB location is more random. The fluxes of > 30 keV electrons in the outer region of the ORB are very dynamic due to the strong contribution from the auroral population. The latter produced additional maxima at latitudes above 70 and 55∘ in the European–Siberian and American sectors, respectively. The additional maxima were very intense in the 2008, 2010 and 2017, which made it difficult to determine the actual location of the ORB. In those cases, we chose the maximum located at lower latitude. This choice provided good agreement with the ORB maximum location for the > 100 keV electrons and especially for the sub-relativistic > 300 keV electrons, which are practically free from auroral contamination.
In Fig. 3, one can clearly see the slot region between the outer and inner electron belts in the latitudinal ranges from 45 to 50∘ and from 45 to 50∘ above North America and Siberia, respectively. This structure can be well identified and numerically determined, except for > 300 keV electrons. In the case of the slot region, the low-latitude edge of the ORB is determined as the first high-latitude point of gradual flux enhancement after the slot minimum. Apparently, the electron flux enhancements peak in the maximum of the ORB; thus, the location of the ORB maximum can be determined unambiguously. In the European sector and for the electrons with energies > 300 keV, the criterion for determination of the inner edge is not so obvious. It is difficult to define a threshold flux due to strong solar cycle variations of electron fluxes. In this case, the inner edge can be determined as the lowest latitude of gradual decrease of electron fluxes from the ORB maximum toward lower latitudes. As one can see from Fig. 3, the inner edge usually separates the background noise, with sharply varying fluxes at lower latitudes, from the smooth and fast increase of ORB fluxes at higher latitudes. The geographic latitude of the inner edge is determined for each year, with the accuracy varying from 0.5 to 1∘. In the American sector, the inner edge of the ORB is situated at the lowest latitudes from 43 to 51∘, in the European sector it is situated from 55 to 63∘, and in the Siberian sector it is situated at highest latitudes from 58 to 65∘. In Fig. 3, it can be seen that the latitude of the ORB edge above Siberia decreases with time (year) from ∼65 to 60∘ for all electron energy ranges. The change in the ORB location above Europe and North America is not as obvious.
Figures 4 and 5 show long-term variations in the location of the ORB and corresponding predictions of the IGRF-12 model during 17 years from 2001 to 2018. The prediction of IGRF-12 model was calculated in the following manner. First, we took a point with given geographic coordinates and calculated its magnetic coordinates for the quiet day on 29 June 2001 using the IGRF model of epoch 2000. Namely, for the ORB maximum, we took 70∘ N, 80∘ W; 66∘ N, 0∘ E; and 54∘ N, 100∘ E for the American, European and Siberian sectors, respectively, and calculated their geomagnetic coordinates 64.12∘ N, 11.44∘ W; 67.05∘ N, 95.66∘ E; and 59.5∘ N, 174.3∘ E, respectively. For the inner edge of the ORB, we took 46.5∘ N, 80∘ W; 59∘ N, 0∘ E; and 63∘ N, 100∘ E, respectively, with the corresponding respective geomagnetic coordinates of 56.62∘ N, 10.61∘ W; 60.59∘ N, 89.34∘ E; and 52.47∘ N, 173.7∘ E. Following this, we supposed that the geomagnetic coordinates of the points did not change with time, and we used them to calculate geographic coordinates from the IGRF-12 model for the corresponding quiet days listed in Table 2. The geographic coordinates of a point with given magnetic coordinates should change with time due to long-term variation in the geomagnetic field.
In Figs. 4 and 5, one can see that the ORB maximum and the inner edge of > 30 keV electrons are usually located at higher latitudes than those of > 100 keV electrons, and the ORB of sub-relativistic > 300 keV electrons is located at the lowest latitudes. Note that the location of the ORB maximum for > 30 keV electrons is scattered significantly, and it is different from those for the more energetic electrons because of substantial contamination from the auroral electrons. In contrast, the ORB maxima and the inner edge of > 100 and > 300 keV electrons demonstrate very similar dynamics. The location of the ORB manifests the well-known solar cycle variation: the latitudes of the ORB maximum and the inner edge have a tendency to be highest around the solar minimum in 2008 to 2009 and lowest during solar maxima in 2001 and 2012 to 2013. Note that the maximum phases of the 23rd and 24th solar cycles occurred between 2000 and 2001 and between 2012 and April 2014, respectively. The period from 2008 to 2009 is the solar minimum phase. The declining phases lasted from 2003 to 2007 and from 2014 to 2018. In Figs. 4 and 5, one can see that during the declining phase of the current 24th solar cycle (especially from 2016 to 2018), the behavior of the ORB maximum and the inner edge is different from that during the declining phase of the previous 23rd solar cycle; namely, their latitudes increased only slightly or even decreased above North America and especially above Siberia.
Unfortunately, there is no model of the ORB location variation with respect to the solar cycle because the driving mechanisms are not well established. Conversely, the long-term variation in IGRF-12 is almost a linear function of the year, as one can see in Figs. 4 and 5. Hence, as a first approach for comparative analysis, the variations in the ORB location by year are considered to be random around a linear function (indicated by dashed lines in Figs. 4 and 5):
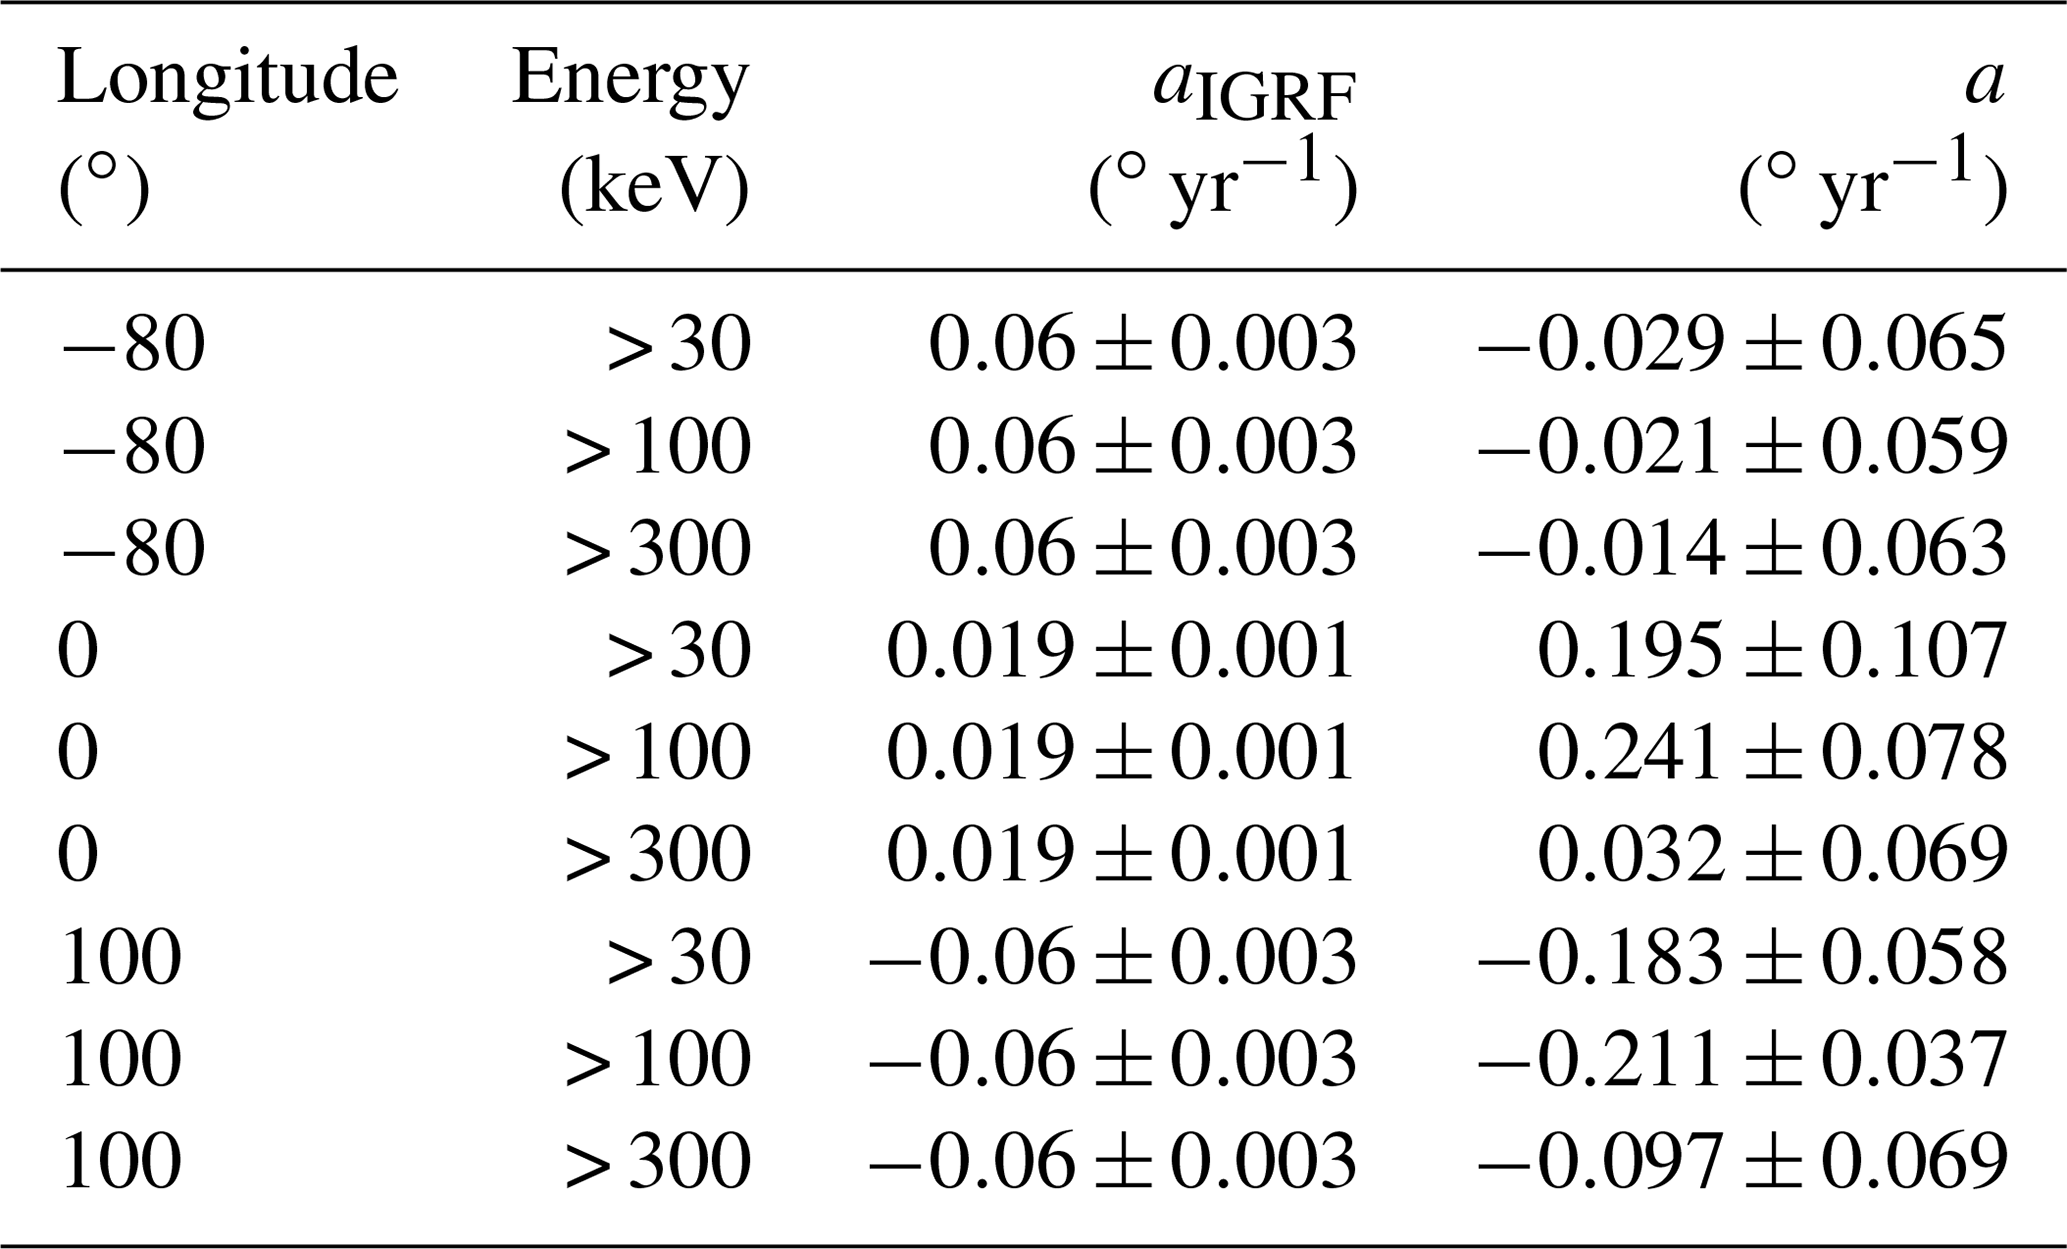
where λ is the latitude of the maximum or inner edge of the ORB. The slope a, parameter b and their standard errors are calculated from a linear regression for various longitudinal regions and various energies of electrons. The results are presented in Tables 3 and 4 for the ORB maximum and the inner edge, respectively. The linear fits are compared with geomagnetic field trends predicted by the IGRF model. The trends are also fitted by a linear function with the slope aIGRF.

Figure 4The geographic latitude of the maximum of the ORB measured at a height of ∼850 km during geomagnetic quiet days around 80∘ W (a), 0∘ E (b) and 100∘ E (c) for electrons with energies of > 30 keV (red circles), > 100 keV (blue crosses) and > 300 keV (green triangles). The dashed curves of corresponding colors show the best linear fit of the latitudinal change of the maximum location by year (see Table 3). Solid black curves show the latitudinal change predicted by the IGRF model of corresponding epochs (see details in the text). The gray curve shows the sunspot number (right y axis).
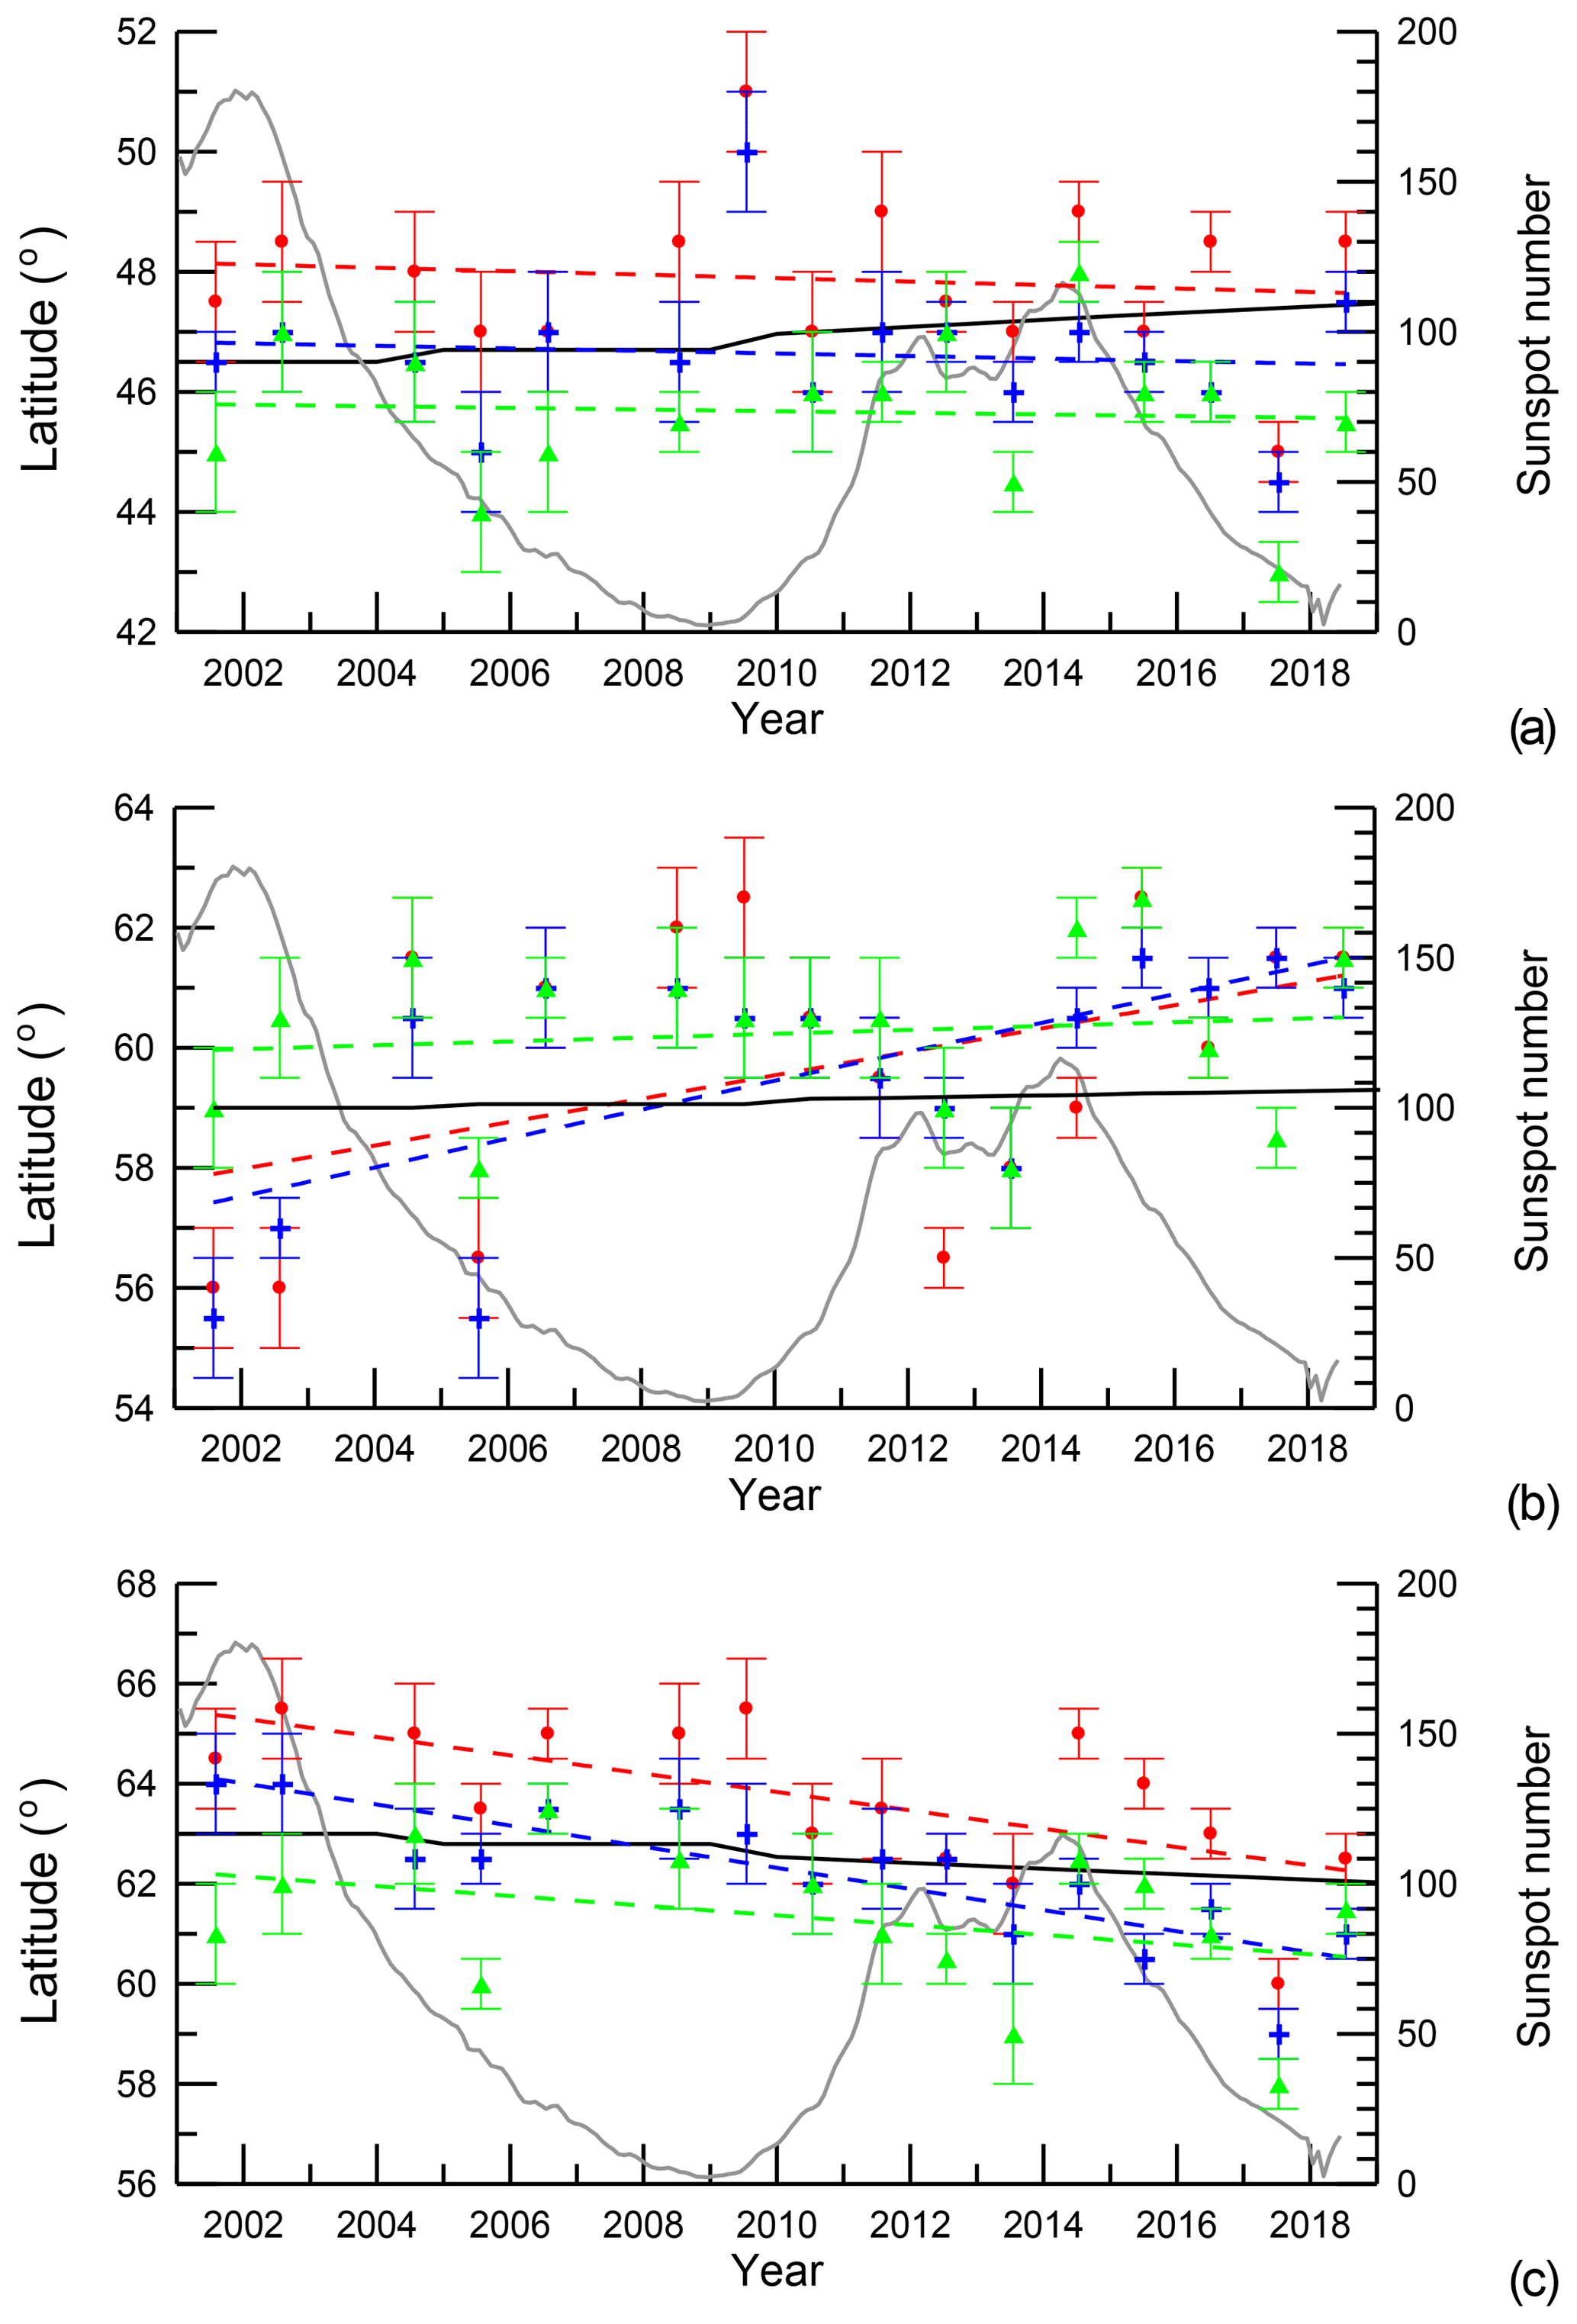
Figure 5The same as Fig. 4 but for the inner edge of the ORB. Coefficients of the best linear fit are presented in Table 4.
In the American sector (see Fig. 4a), the latitude of the ORB maximum demonstrates a little decrease of about 1∘, while the IGRF-12 model predicts an increase of ∼1∘. The decrease results from relatively low latitudes, where the ORB maximum is located from 2013 to 2018. The location of inner edge of the ORB in the American sector (see Fig. 5a) does not practically change within the experimental uncertainty of ∼1∘. Note that the slope a has very large errors (see Tables 3 and 4) in both cases, such that the slope of the IGRF trend, aIGRF=0.06, almost falls into the error ranges. Hence, from a statistical perspective, one can conclude that the model prediction does not contradict the observations.
Table 3Coefficients of the best linear fit of the latitudinal change of the ORB maximum location by year for various longitudes and electron energies.
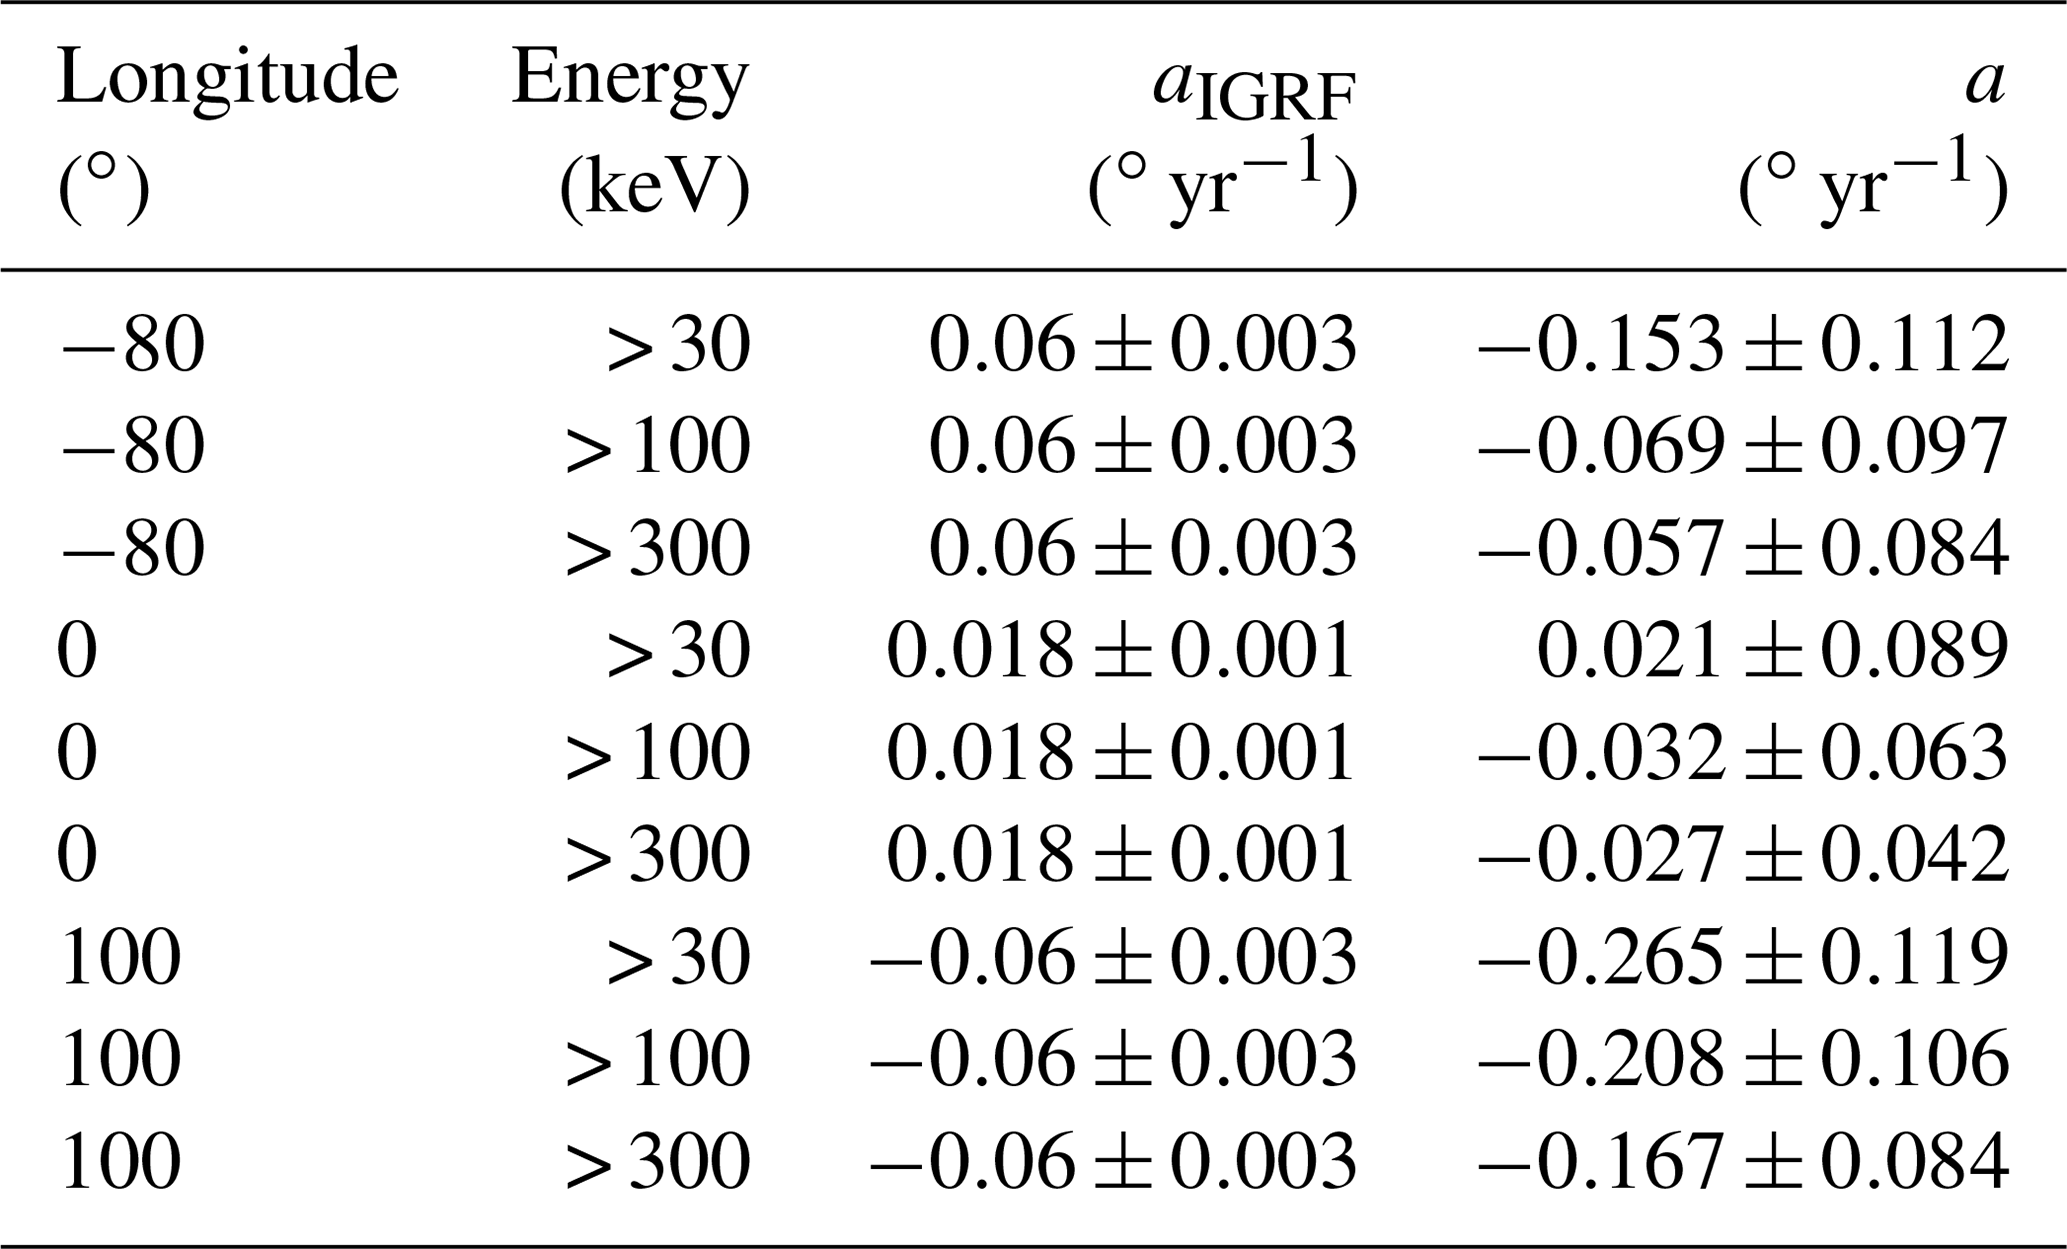
Table 4Coefficients of the best linear fit of the latitudinal change of the ORB inner edge location by year for various longitudes and electron energies.
In the European sector (Figs. 4b, 5b), the IGRF-12 model predicts a very small change of 0.3∘ in the ORB location with the slope aIGRF ∼0.02, which is in good agreement with the ORB maximum dynamics. The location of the ORB inner edge for electrons with energies > 30 and > 100 keV demonstrates an increase of ∼3∘. However, the slope of increase is determined with a substantial error of up to 50 % (see Table 4) that produces an increase of only ∼1.5∘. In addition, the > 300 keV electrons follow the model and do not exhibit any prominent trend. Hence, in the European sector, the IGRF model predicts the ORB dynamics with sufficient accuracy.
In the Siberian sector, the IGRF model predicts a ∼1∘ decrease in the latitude of the ORB maximum and inner edge (see Figs. 4c, 5c) with the slope aIGRF . From the POES observations, we find that the ORB maximum is displaced to lower latitudes by at least ∼3∘ in all electron energy channels: from ∼69 to ∼66∘ for > 300 keV electrons, from ∼70 to 66∘ for > 100 keV electrons and from ∼71 to 67∘ for > 30 keV electrons (see Fig. 4c). The difference is related to the very low latitudes (∼67∘ and less) of the ORB maximum during solar maximum and to the declining phase of the current 24th solar cycle in the years 2012 to 2013 and 2016 to 2018, respectively. In the solar maximum and during the declining phase of the previous 23rd solar cycle (in 2001 and from 2004 to 2006, respectively), the ORB maximum was located at higher latitudes (above 67∘). In Table 3, the slopes for all energy ranges are steeper than the slope of the IGRF. Note that the errors in determination of the slope a are ∼50 %. Hence, statistically, the decrease in latitude might be 2 times smaller, i.e., ∼1.5 to 2∘. This decrease is slightly larger than the 1∘ of the model prediction, within 0.5 to 1∘ statistical uncertainty in the determination of latitude.
A similar pattern can be found for the inner edge of ORB in the Siberian sector (see Fig. 5c). Namely, the IGRF model predicts a decrease of ∼1∘ with the slope aIGRF . The inner edge was shifted toward lower latitudes by ∼3, ∼2 and ∼1∘ for > 30, > 100 and > 300 keV electrons, respectively. From Table 4, one can see that the slopes a are steeper than aIGRF. The slopes are calculated with errors of ∼30 % and ∼20 % for > 30 and > 100 keV electrons, respectively. This means that the decrease in latitude might be ∼2∘ (instead of ∼3∘) and ∼1.5∘ (instead of ∼2∘), respectively. These values are again larger than the 1∘ of the model prediction. Hence, there is the tendency toward model underestimation of the change in the latitudinal location of the ORB maximum. This fact indicates that during the 17 years from 2001 to 2018, the ORB is abnormally displaced toward the lower latitudes in the Siberian sector.
It is interesting to point out the year 2017, when the maximum and inner edge of the ORB shifted to very low latitudes of 62 and ∼59∘, respectively. The shift was observed during 2 quiet days on 9 and 10 June 2017. A similar pattern of displacement can be found during the declining phase of the previous 23rd solar cycle in the year 2005, when the ORB suddenly shifted equatorward by more than ∼2∘. Note that if we exclude the year 2017 from the linear fitting, the results are not practically changed as the ORB is located at relatively low latitudes from 2012 to 2018.
We found up to a 4∘ equatorward displacement of the ORB in the Siberian sector. This displacement is larger than that predicted by the IGRF-12 model. The difference is statistically significant. It might have resulted from both a change in the geomagnetic field and from changes in driving parameters such as geomagnetic activity, the tilt angle, IMF Bz and solar wind dynamic pressure. It is well known that these parameters affect the latitudinal location of domains in the magnetosphere. The effect of geomagnetic activity was eliminated by the choice of quiet days. The other drivers are considered below.
The tilt angle in the noon region at a given longitude (80∘ W, 0 and 100∘ E) varies a little (< 2∘) during the June month. The change of local time in a 2 h vicinity of noon produces a ∼5∘ variation in the tilt angle. The tilt angle variations of a few degrees result in a tiny change of ∼0.1∘ in the ORB latitude (e.g., Dmitriev et al., 2010). Hence, we can neglect the effect of tilt angle.
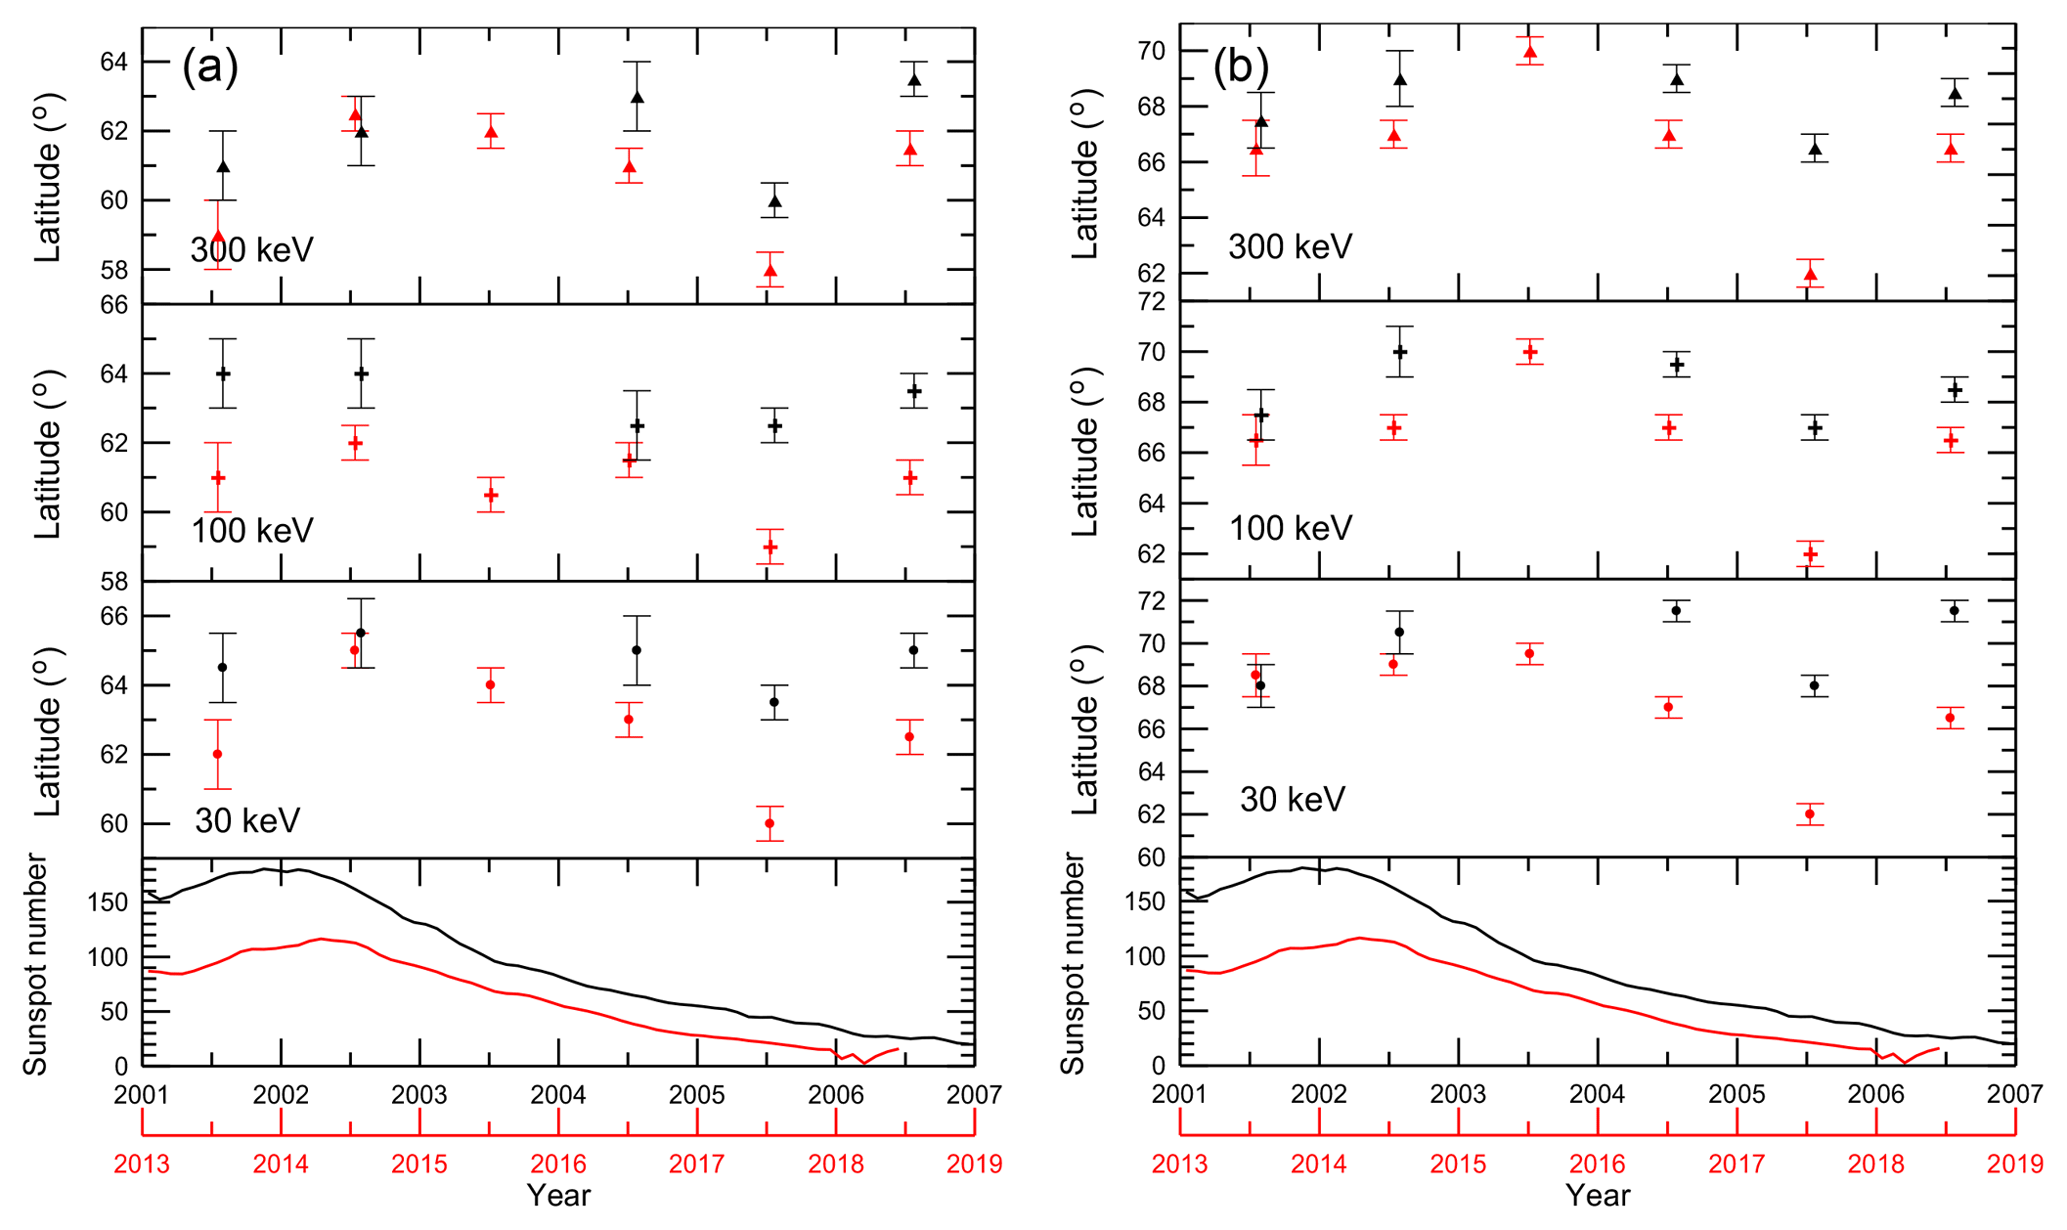
Figure 6Geographic latitude of the inner edge (a) and maximum (b) of the outer radiation belt measured during geomagnetic quiet days at a height of ∼850 km around a longitude of 100∘ E for electrons with energies of > 30 keV (circles), > 100 keV (crosses) and > 300 keV (triangles). Bottom panels show the sunspot number in the 23rd solar cycle (2001–2006, black curves) and in the 24th solar cycle (2013–2018, blue curves). The outer radiation belt location is shown using black and red symbols for the 23th and 24th solar cycles, respectively. It can be seen that the ORB is systematically located at lower latitudes during the declining phase of the 24th solar cycle compared with the its location during the 23rd solar cycle.
The effect of solar wind parameters, including the IMF Bz and dynamic pressure (Pd), on the ORB location is not obvious. It is found that the slot region location can be related to the plasmapause but the relation is ambiguous (Darrouzet et al., 2013; Baker et al., 2014). We can indirectly estimate the effect using the dependence of the cusp location on the solar wind parameters (Kuznetsov et al., 1993; Newell et al., 2006). The equatorward edge of the cusp separates the open and closed magnetic field lines in the dayside magnetosphere. Hence, the latitude of the equatorward edge can be considered as a proxy of the ORB outer edge. In the first approach, we assume that the effect of solar wind parameters on the ORB location can be represented by the dynamics of the ORB outer edge or the cusp equatorward edge. It can be shown that nT results in a less than 0.5∘ equatorward shift of the cusp and a change of Pd from 1 to 2 nPa results in a ∼0.2∘ decrease in the latitude of the cusp equatorward edge. Hence, the effects of both Pd and IMF Bz are several times weaker than the difference of 3∘.
Another possible effect is the solar cycle variation. Variations of the ORB location from cycle to cycle and during different phases of solar cycles are still poorly investigated. It is well established that the ORB is located at highest and lowest latitudes during solar minima and maxima, respectively (Miyoshi et al., 2004; Glauert et al., 2018). From these findings, we can speculate that lower (higher) solar activity results in an increase (a decrease) in the ORB latitudes. In Fig. 3, one can see that the intensities of electrons are weaker after the beginning of the 24th solar maximum in 2012 in comparison with the 23rd solar cycle. Note that the 23rd solar cycle was stronger than the 24th cycle. Following this logic, the ORB should be located at relatively higher latitudes during the weak 24th solar cycle than during the strong 23rd solar cycle.
In Figure 6, the ORB location is compared during the maximum and declining phases of the23rd (the years 2001 to 2006) and 24th (the years 2013 to 2018) solar cycles. During these time intervals, the sunspot numbers for both cycles correlate very well. The ORB location also demonstrates very similar solar cycle variations. The ORB latitude increased after the solar maximum in 2001 to 2002 (and in 2013 to 2014). During these years, the ORB location was quite close for the both cycles. The difference of ∼1∘ can be explained by the secular variation predicted by the IGRF model. During the declining phase in 2004 to 2005 (2015 to 2017), the ORB was shifted to lower latitudes and then moved slightly poleward in 2006 (2018), when the solar minimum was approached.
From Fig. 6, one can clearly see that the ORB is located at lower latitudes (by several degrees) during the declining phase of the 24th solar cycle compared with its location during the 23rd solar cycle. It is interesting to point out the year 2017, when the maximum and inner edge of ORB were shifted to very low latitudes of 62 and ∼59∘, respectively. The shift was observed during 2 quiet days on 9 and 10 June 2017. A similar pattern of strong displacement by more than ∼2∘ can be found during the declining phase of the previous 23rd solar cycle in 2005, the year corresponding to a similar stage of solar activity. Hence, the ORB dynamics in the year of 2017, as well as during the whole declining phase from 2014 to 2018, was not anomalous in the sense of solar cycle variations. However, the ORB latitudes were abnormally low. The difference of several degrees cannot be explained by the IGRF model. As a result, we found the totally opposite effect: the ORB over Siberia is located at lower latitudes during the weak 24th solar cycle compared with the strong 23rd solar cycle. It should be noted that if one excludes the year 2017 from the linear fitting, the results are not practically changed because the ORB is generally located at relatively low latitudes during the whole declining phase of the 24th solar cycle.
From the above, we can conclude that the difference between the observations and predictions may rather originate from the anomalous dynamics of the geomagnetic field. This idea is supported by the observations of the ORB location over Europe and North America, where the ORB displacement is well predicted by the IGRF-12 model. An additional support for this inference can be found from the results of long-term magnetic observations in Siberia, where significant anomalies of the main geomagnetic field have been revealed in the 80–130∘ longitudinal range (Gvishiani et al., 2014). Namely, the IGRF-12 model predicted that the magnetic field is up to 300 nT stronger than that measured by ground-based magnetic stations, which was close to 0.5 % of the total magnetic filed in this region. For the geodipole, a stronger magnetic field corresponds to higher latitudes.
In Figs. 4c and 5c, one can see that the decrease of the ORB latitude in the Siberian sector is most prominent after 2012. Conversely, in the years 2012 to 2013, a sudden change was found in the acceleration of the secular variation in the geomagnetic field (Finlay et al., 2016). Analyzing the time interval from 1999 to 2015, Finlay et al. (2016) revealed three pulses in the time evolution of the mean-square secular acceleration power: in 2006, in 2009 and from 2012 to 2013. Chulliat et al. (2015) attribute these pulses, or so-called sharp geomagnetic “jerks”, to magnetic field variations originating in the Earth's core. We can assume that the abnormal ORB displacement might be related to the geomagnetic jerks. While there is no prominent change in the ORB location in 2006, a very high ORB latitude can be seen in 2009. Note that the jerk in 2009 coincided with the abnormally deep solar minimum; hence, it could be hard to distinguish between the two effects. However, we found a significant change in the ORB dynamics after 2012 to 2013.
The equatorward displacement of ORB in the Siberian sector by several degrees indicates an equatorward shift of all domains in the magnetosphere, including the region of auroral precipitations. Apparently, the shift contributes to the increase in the occurrence rate of midlatitude auroras in Siberia and, perhaps, throughout Russia. In addition, Finlay et al. (2016) expect that the next jerk might occur around 2016. We do not have any reports about the recent jerks yet; however, the very strong decrease of the ORB latitude observed in 2017 might indicate a sudden change in the geomagnetic field.
The NOAA/POES observations of electrons with energies of few tens to hundreds of kiloelectron volts ( keV) have allowed for a latitudinal displacement of the ORB during last 18 years to be revealed and measured. The displacement corresponds (qualitatively) to the change in the geomagnetic field predicted by the IGRF-12 model. However, in the Siberian sector, the model has a tendency to underestimate the equatorward shift of the ORB. The shift became prominent after 2012, which might have been related to the geomagnetic jerk that occurred in 2012–2013. The increase in the occurrence rate of midlatitude auroras in the Eastern Hemisphere can be explained, at least partially, by the equatorward displacement of the high-latitude projection of the magnetosphere domains.
The experimental data were acquired from various sources. The NOAA/POES data on electrons are available at https://ngdc.noaa.gov/stp/satellite/poes/dataaccess.html (NOAA, 2019), last access: 9 August 2019. The IGRF-12 model and geomagnetic indices Dst and AE are provided by Kyoto World Data Center for Geomagnetism: http://wdc.kugi.kyoto-u.ac.jp/wdc/Sec3.html (World Data Center for Geomagnetism, 2019), last access: 9 August 2019. The experimental data on upstream solar wind conditions are acquired from Coordinated Data Analysis Web (CDAWeb): https://cdaweb.gsfc.nasa.gov/index.html/ (NASA, 2019), last access: 9 August 2019. The sunspot number is provided by WDC-SILSO, Royal Observatory of Belgium, Brussels: http://www.sidc.be/silso/datafiles (Royal Observatory of Belgium, 2019), last access: 9 August 2019.
The supplement related to this article is available online at: https://doi.org/10.5194/angeo-37-719-2019-supplement.
The authors declare that they have no conflict of interest.
The authors thank a NOAA Polar Orbiting Environmental Satellites (POES) team for providing experimental data regarding energetic particles, the CDAWeb for providing the Wind solar wind data, the Kyoto World Data Center for Geomagnetism (http://wdc.kugi.kyoto-u.ac.jp/igrf/point/index.html, last access: 9 August 2019) for providing the geomagnetic indices and computation of the IGRF-12 model and the WDC-SILSO Royal Observatory of Belgium, Brussels, for providing sunspot numbers (http://www.sidc.be/silso/datafiles, last access: 9 August 2019).
This research has been supported by the Ministry of Science and Technology, Taiwan (grant no. MOST-106-2111-M-008-015) and the Ministry of Science and Technology, Taiwan (grant no. MOST-107-2923-M-008-001-MY3/18-55-52006MHT_a).
This paper was edited by Elias Roussos and reviewed by three anonymous referees.
Asikainen, T. and Mursula, K.: Correcting the NOAA/MEPED energetic electron fluxes for detector efficiency and proton contamination, J. Geophys. Res.-Space, 118, 6500–6510, https://doi.org/10.1002/jgra.50584, 2013.
Baker, D. N. and Kanekal, S. G.: Solar cycle changes, geomagnetic variations, and energetic particle properties in the inner magnetosphere, J. Atmos. Sol.-Terr. Phys., 70, 195–206, https://doi.org/10.1016/j.jastp.2007.08.031, 2008.
Baker, D. N., Jaynes, A. N., Hoxie, V. C., Thorne, R. M., Foster, J. C., Li, X., Fennell, J. F., Wygant, J. R., Kanekal, S. G., Erickson, P. J., Kurth, W., Li, W., Ma, Q., Schiller, Q., Blum, L., Malaspina, D. M., Gerrard, A., and Lanzerotti, L. J.: An impenetrable barrier to ultrarelativistic electrons in the Van Allen radiation belts, Nature, 515, 531–534, https://doi.org/10.1038/nature13956, 2014.
Baker, D. N., Jaynes, A. N., Kanekal, S. G., Foster, J. C., Erickson, P. J., Fennell, J. F., Blake, J. B., Zhao, H., Li, X., Elkington, S. R., Henderson, M. G., Reeves, G. D., Spence, H. E., Kletzing, C. A., and Wygant, J. R.: Highly relativistic radiation belt electron acceleration, transport, and loss: Large solar storm events of March and June 2015, J. Geophys. Res.-Space, 121, 6647–6660, https://doi.org/10.1002/2016JA022502, 2016.
Case, N. A., MacDonald, E. A., and Patel, K. G.: Aurorasaurus and the St Patrick's Day storm, Astron. Geophys., 56, 13–14, https://doi.org/10.1093/astrogeo/atv089, 2015.
Chulliat, A., Hulot, G., and Newitt, L. R.: Magnetic flux expulsion from the core as a possible cause of the unusually large acceleration of the north magnetic pole during the 1990s, J. Geophys. Res., 115, B07101, https://doi.org/10.1029/2009JB007143, 2010.
Chulliat A., Alken, P., and Maus, S.: Fast equatorial waves propagating at the top of the Earth's core, Geophys. Res. Lett., 42, 3321–3329, https://doi.org/10.1002/2015GL064067, 2015.
Cresswell-Moorcock, K., Rodger, C. J., Kero, A., Collier, A. B., Clilverd, M. A., Häggström, I., and Pitkänen, T.: A reexamination of latitudinal limits of substorm-produced energetic electron precipitation, J. Geophys. Res.-Space, 118, 6694–6705, https://doi.org/10.1002/jgra.50598, 2013.
Darrouzet, F., Pierrard, V., Benck, S., Lointier, G., Cabrera, J., Borremans, K., Ganushkina, N. Yu., and Keyser, J. De: Links between the plasmapause and the radiation belt boundaries as observed by the instruments CIS, RAPID and WHISPER onboard Cluster, J. Geophys. Res.-Space, 118, 4176–4188, https://doi.org/10.1002/jgra.50239, 2013.
Dmitriev, A. V., Jayachandran, P. T., and Tsai, L.-C.: Elliptical model of cutoff boundaries for the solar energetic particles measured by POES satellites in December 2006, J. Geophys. Res., 115, A12244, https://doi.org/10.1029/2010JA015380, 2010.
Ebihara, Y., and Miyoshi, Y.: Dynamic inner magnetosphere: A tutorial and recent advances, in: The dynamic magnetosphere, edited by: Liu, W. and Fujimoto, M., 145–187, https://doi.org/10.1007/978-94-007-0501-2_9, 2011.
Engebretson, M., Glassmeier, K.-H., Stellmacher, M., Hughes, W. J., and Luhr, H.: The dependence of high-latitude Pc5 wave power on solar wind velocity and on the phase of high-speed solar wind streams, J. Geophys. Res., 103, 26271–26283, https://doi.org/10.1029/97JA03143, 1998.
Evans, D. S. and Greer, M. S.: Polar Orbiting Environmental Satellite Space Environment Monitor: 2. Instrument Descriptions and Archive Data Documentation, Tech. Memo. Version 1.4, NOAA Space Environ. Lab., Boulder, Colorado, 51 pp., 2004.
Fung, S. F., Shao, X., and Tan L. C.: Long-term variations of the electron slot region and global radiation belt structure, Geophys. Res. Lett., 33, L04105, https://doi.org/10.1029/2005GL024891, 2006.
Finlay, C. C., Aubert, J., and Gillet, N.: Gyre-driven decay of the Earth's magnetic dipole, Nat. Commun., 7, 10422, https://doi.org/10.1038/ncomms10422, 2016.
Glauert, S. A., Horne, R. B., and Meredith, N. P.: A 30-year simulation of the outer electron radiation belt, Space Weather, 16, 1498–1522, https://doi.org/10.1029/2018SW001981, 2018.
Gvishiani, A., Lukianova, R., Soloviev, A., and Khokhlov, A.: Survey of Geomagnetic Observations Made in the Northern Sector of Russia and New Methods for Analysing Them, Surv. Geophys., 35, 1123–1154, https://doi.org/10.1007/s10712-014-9297-8, 2014.
Horne, R. B., Thorne, R. M., Glauert, S. A., Meredith, N. P., Pokhotelov, D., and Santolik, O.: Electron acceleration in the Van Allen radiation belts by fast magnetosonic waves, Geophys. Res. Lett., 34, L17107, https://doi.org/10.1029/2007GL030267, 2007.
Kataoka, R., Shiota, D., Kilpua, E., and Keika, K.: Pileup accident hypothesis of magnetic storm on 17 March 2015, Geophys. Res. Lett., 42, 5155–5161, https://doi.org/10.1002/2015GL064816, 2015.
Kuznetsov, S. N., Suvorova, A. V., and Tolstaya, E. D.: Relationship of the cleft latitude to interplanetary parameters and DST variations, Cosmic Res., 31, 409–415, 1993.
Lam, M. M., Horne, R. B., Meredith, N. P., Glauert, S. A., Moffat-Griffin, T., and Green, J. C.: Origin of energetic electron precipitation > 30 keV into the atmosphere, J. Geophys. Res., 115, A00F08, https://doi.org/10.1029/2009JA014619, 2010.
Li, X., Baker, D. N., Kanekal, S. G., Looper, M., and Temerin, M.: Long term measurements of radiation belts by SAMPEX and their variations, Geophys. Res. Lett., 28, 3827–3830, https://doi.org/10.1029/2001GL013586, 2001.
MacDonald, E. A., Case, N. A., Clayton, J. H., Hall, M. K., Heavner, M., Lalone, N., Patel, K. G., and Tapia, A.: Aurorasaurus: A citizen science platform for viewing and reporting the aurora, Space Weather, 13, 548–559, https://doi.org/10.1002/2015SW001214, 2015.
McPherron, Baker, D. N., and Crookeret, N. U.: Role of the Russell-McPherron effect in the acceleration of relativistic electrons, J. Atmos. Sol.-Terr. Phys., 71, 1032–1044, https://doi.org/10.1016/j.jastp.2008.11.002, 2009.
Mikhalev, A. V., Beletsky, A. B., Kostyleva, N. V., and Chernigovskaya, M. A.: Midlatitude Auroras in the South of Eastern Siberia during Strong Geomagnetic Storms on 29–31 October 2003 and 20–21 November 2003, Cosmic Res., 42, 591–596, 2004.
Miyoshi, Y. and Kataoka, R.: Solar cycle variations of outer radiation belt and its relationship to solar wind structure dependences, J. Atmos. Sol.-Terr. Phys., 73, 77–87, https://doi.org/10.1016/j.jastp.2010.09.031, 2011.
Miyoshi, Y. S., Jordanova, V. K., Morioka, A., and Evans, D. S.: Solar cycle variations of the electron radiation belts: Observations and radial diffusion simulation, Space Weather, 2, S10S02, https://doi.org/10.1029/2004SW000070, 2004.
NASA's Goddard Space Flight Center: Space Physics Data Facility, available at: https://cdaweb.gsfc.nasa.gov/index.html/, last access: 10 August 2019.
Newell, P. T., Sotirelis, T., Liou, K., Meng, C.-I., and Rich, F. J.: Cusp latitude and the optimal solar wind coupling function, J. Geophys. Res., 111, A09207, https://doi.org/10.1029/2006JA011731, 2006.
Newell, P. T., Sotirelis, T., and Wing, S.: Seasonal variations in diffuse, monoenergetic, and broadband aurora, J. Geophys. Res., 115, A03216, https://doi.org/10.1029/2009JA014805, 2010.
NOAA's National Centers for Environmental Information: Direct Access to POES SEM data, available at: https://ngdc.noaa.gov/stp/satellite/poes/dataaccess.html, last access: 10 August 2019.
O'Brien, T. P. and McPherron, R. L.: Seasonal and diurnal variation of Dst dynamics, J. Geophys. Res., 107, 1341, https://doi.org/10.1029/2002JA009435, 2002.
Roble, R. G. and Ridley, E. C.: An auroral model for the NCAR thermospheric general circulation model (TGCM), Ann. Geophys., 5, 369–382, 1987.
Rodger, C. J., Clilverd, M. A., Green, J. C., and Lam, M. M.: Use of POES SEM-2 observations to examine radiation belt dynamics and energetic electron precipitation into the atmosphere, J. Geophys. Res., 115, A04202, https://doi.org/10.1029/2008JA014023, 2010.
Royal Observatory of Belgium: Sunspot Index and Long-term Solar Observations, available at: http://www.sidc.be/silso/datafiles, last access: 10 August 2019.
Shen, X.-C., Hudson, M. K., Jaynes, A., Shi, Q., Tian, A., Claudepierre, S., Qin, M.-R., Zong, Q.-G., and Sun, W.-J.: Statistical study of the storm time radiation belt evolution during Van Allen Probes era: CME- versus CIR-driven storms, J. Geophys. Res.-Space, 122, 8327–8339, https://doi.org/10.1002/2017JA024100, 2017.
Shiokawa, K., Ogawa, T., and Kamide, Y.: Low-latitude auroras observed in Japan: 1999–2004, J. Geophys. Res., 110, A05202, https://doi.org/10.1029/2004JA010706, 2005.
Smith, A. R. A., Beggan, C. D., Macmillan, S., and Whaler, K. A.: Climatology of the auroral electrojets derived from the along-track gradient of magnetic field intensity measured by POGO, Magsat, CHAMP, and Swarm, Space Weather, 15, 1257–1269, https://doi.org/10.1002/2017SW001675, 2017.
Su, Z., Zhu, H., Xiao, F., Zong, Q.-G., Zhou, X.-Z., Zheng, H., Wang, Y., Wang, S., Hao, Y.-X.., Gao, Z., He, Z., Baker, D. N., Spence, H. E., Reeves, G. D., Blake, J. B., and Wygant, J. R.: Ultra-low-frequency wave-driven diffusion of radiation belt relativistic electrons, Nat. Commun., 6, 10096, https://doi.org/10.1038/ncomms10096, 2015.
Suvorova, A. V., Dmitriev, A. V., Tsai, L.-C., Kunitsyn, V. E., Andreeva, E. S., Nesterov, I. A., and Lazutin, L. L.: TEC evidence for near-equatorial energy deposition by 30 keV electrons in the topside ionosphere, J. Geophys. Res.-Space, 118, 4672–4695, https://doi.org/10.1002/jgra.50439, 2013.
Thebault, E., Finlay, C. C., Beggan, C. D., Alken, P., Aubert, J., Barrois, O., Bertrand, F., Bondar, T., Boness, A., Brocco, L., Canet, E ., Chambodut, A., Chulliat, A., Coisson, P., Civet, F., Du, A., Fournier, A., Fratter, I., Gillet, N., Hamilton, B., Hamoudi, M., Hulot, G., Jager, T., Korte, M., Kuang, W., Lalanne, X., Langlais, B., Leger, J.-M., Lesur, V., Lowes, F. J., Macmillan, S., Mandea, M., Manoj, C., Maus, S., Olsen, N., Petrov, V., Ridley, V., Rother, M., Sabaka, T. J., Saturnino, D., Schachtschneider, R., Sirol, O., Tangborn, A., Thomson, A., Toffner-Clausen, L., Vigneron, P., Wardinski, I., and Zvereva, T.: International Geomagnetic Reference Field: the 12th generation, Earth Planet. Space, 67, 2–19, https://doi.org/10.1186/s40623-015-0228-9, 2015.
Tsurutani, B. T., Gonzalez, W. D., Gonzalez, A. L. C., Guarnieri, F. L., Gopalswamy, N., Grande, M., Kamide, Y., Kasahara, Y., Lu, G., Mann, I., McPherron, R., Soraas, F., and Vasyliunas, V.: Corotating solar wind streams and recurrent geomagnetic activity: A review, J. Geophys. Res., 111, A07S01, https://doi.org/10.1029/2005JA011273, 2006.
Vázquez, M., Vaquero, J. M., Gallego, M. C., Roca Cortés, T., and Pallé, P. L.: Long-Term Trends and Gleissberg Cycles in Aurora Borealis Records (1600–2015), Sol. Phys., 291, 613–642, https://doi.org/10.1007/s11207-016-0849-6, 2016.
World Data Center for Geomagnetism, Kyoto: Geomagnetic Data Service, available at: http://wdc.kugi.kyoto-u.ac.jp/wdc/Sec3.html, last access: 10 August 2019.