the Creative Commons Attribution 4.0 License.
the Creative Commons Attribution 4.0 License.
Quasi-separatrix layers induced by ballooning instability in the near-Earth magnetotail
Ping Zhu
Zechen Wang
Jun Chen
Xingting Yan
Magnetic reconnection processes in the near-Earth magnetotail can be highly three-dimensional (3-D) in geometry and dynamics, even though the magnetotail configuration itself is nearly two-dimensional due to the symmetry in the dusk–dawn direction. Such reconnection processes can be induced by the 3-D dynamics of nonlinear ballooning instability. In this work, we explore the global 3-D geometry of the reconnection process induced by ballooning instability in the near-Earth magnetotail by examining the distribution of quasi-separatrix layers associated with plasmoid formation in the entire 3-D domain of magnetotail configuration, using an algorithm previously developed in the context of solar physics. The 3-D distribution of quasi-separatrix layers (QSLs) as well as their evolution directly follow the plasmoid formation during the nonlinear development of ballooning instability in both time and space. Such a close correlation demonstrates a strong coupling between the ballooning and the corresponding reconnection processes. It further confirms the intrinsic 3-D nature of the ballooning-induced plasmoid formation and reconnection processes, in both geometry and dynamics. In addition, the reconstruction of the 3-D QSL geometry may provide an alternative means of identifying the location and timing of 3-D reconnection sites in the magnetotail from both numerical simulations and satellite observations.
- Article
(9665 KB) - Full-text XML
- BibTeX
- EndNote
There has been a long-standing controversy over whether the magnetic reconnection or the ballooning instability in the magnetotail actually triggers the onset of substorms, since both mechanisms found support in observation and simulation (e.g., Baker et al., 1996; Lui, 1991; Angelopoulos et al., 2008; Panov et al., 2012). To resolve the controversy, it may be necessary to study and understand the evolution of the magnetotail in the substorm growth phase, and to identify and predict the signatures of magnetic reconnection and ballooning instability in the magnetotail, as well as their potential connections. In practice, the conventional two-dimensional reconnection models with spatial symmetries in both in-flow and out-flow regions are often used to identify and interpret the signatures of reconnection processes from observational data. However, one fundamental question that remains to be addressed is whether the magnetic reconnection in the magnetotail, when it does occur, can always be interpreted in the conventional two-dimensional picture, and if not, how one may characterize its intrinsically three-dimensional geometry.
The overall evolution of the magnetotail-like configuration has been studied for many years (Schindler, 2007, and references therein). In particular, the plasmoid formation process was investigated in detail in earlier 3-D resistive magnetohydrodynamic (MHD) simulations by Birn and Hones Jr. (1981) and by Hesse and Birn (1991), for example. Recently, our simulations based on the 3-D full MHD equations implemented in the NIMROD code (Sovinec et al., 2004) have found a plasmoid formation process in the generalized Harris sheet that is often used as an approximate configuration of the near-Earth magnetotail prior to a substorm onset (Zhu and Raeder, 2013, 2014). Those simulations demonstrate that the embedded thin current is unstable to ballooning-mode perturbations, and the nonlinear development of the ballooning instability is able to induce the onset of reconnection and the formation of plasmoids in the current sheet where there is no pre-existing X-point or X-line.
In comparison to the low-S (i.e., Lundquist number) regime, where S∼102 considered in the earlier simulations by Birn and Hones Jr. (1981), our recent simulations are in the higher-S regime, where S≥104, which may be more relevant to the collisionless regime of plasmas in the magnetotail. In the low-S regime, the magnetotail plasma is linearly unstable to resistive tearing modes, and the associated reconnection process is initially a linear process. In contrast, in the higher-S regime considered in our recent work (Zhu and Raeder, 2013, 2014), the generalized Harris sheet is linearly stable to resistive tearing modes. The onset of reconnection is a consequence of the nonlinear development of ballooning instability, and the subsequent reconnection is a nonlinear process. Thus, the reconnection processes in the low-S regime reported in the earlier work by Birn and Hones Jr. (1981) and by Hesse and Birn (1991) are essentially 2-D, whereas the reconnection process in the higher-S regime in our simulations is an intrinsically 3-D process that does not exist in the 2-D geometry. This key difference distinguishes our recent work (Zhu and Raeder, 2013, 2014) from the previous work by Birn and Hones Jr. (1981) and by Hesse and Birn (1991).
Although our previous work has demonstrated in MHD simulations the formation of plasmoids induced by ballooning instability in the generalized Harris sheet (Zhu and Raeder, 2013, 2014), the global 3-D structure of the ballooning-induced reconnection was not clear. In particular, the reconnection process in our simulations is no longer invariant along the equilibrium current direction, unlike in a conventional 2-D reconnection process. This leads to general questions as to where and how reconnection takes place in the 3-D configuration, as well as how the global structure of the 3-D reconnection process can be characterized and captured in ways different from the more familiar 2-D reconnection process. More fundamentally, it has remained unclear whether this 3-D reconnection process can be reducible to or interpretable in terms of the conventional 2-D reconnection processes.
Whereas the overall evolution of the magnetotail-like configuration has been studied in the space community for many years, the irreducible dimensionality of the reconnection process associated with the evolution of ballooning instability has never been addressed before in the literature, including the papers by, e.g., Birn and Hones Jr. (1981) and Hesse and Birn (1991) which were reviewed in the book by Schindler (2007). There is also a long history of work trying to identify the possible role of out-of-plane instabilities in reconnection (see, for example, Pritchett, 2013, and Sitnov et al., 2014). Different from those previous works, in this work we intend to identify the geometry features associated with the intrinsically 3-D reconnection process induced by the ballooning instability in the near-Earth magnetotail, in light of those questions raised in the previous paragraph.
Similarly to the magnetic island, the plasmoid presented in this work is identified in the x−z plane as a finite region of closed magnetic flux bounded by a separatrix with a single X-point (Otto et al., 1990; Zhu and Raeder, 2014). It is a two-dimensional projection onto the x−z plane of three-dimensional magnetic field lines in regions of magnetic reconnection. Whereas the plasmoid structure itself appears out of a two-dimensional projection, its occurrence in the x−z plane is periodic in the y direction in our simulations, which indicates that the overall reconnecting field-line structure is intrinsically 3-D. Such a relation between the 2-D plasmoid and the 3-D reconnection is indeed possible, as demonstrated in our simulations, and may be more quantitatively captured in the 3-D structure and distribution of quasi-separatrix layers (QSLs).
The QSL has long been a powerful concept and method for the analysis and understanding of magnetic structures in the solar atmosphere (Titov and Démoulin, 1999; Titov et al., 2002). Recently the concept of QSLs has also been effectively applied to the analysis of laboratory reconnection experiments (Lawrence and Gekelman, 2009). Previously, we calculated the spatial distribution and the structure of the QSLs, as well as their temporal emergence and evolution, within the equatorial plane (Zhu et al., 2017), based on the earlier simulation results on the formation of plasmoids induced by ballooning instability in the magnetotail (Zhu and Raeder, 2013, 2014). There we found the QSL structures are not invariant along any direction within the 2-D equatorial plane; instead they are disconnected and isolated local structures. Those initial findings start to reveal the intrinsic 3-D nature of the reconnection induced by ballooning instability in the generalized Harris sheet, which is irreducible to 2-D reconnection processes in geometry and dynamics within the 2-D equatorial plane. In this work, we extend our previous study within the 2-D equatorial plane to the entire 3-D domain of the near-Earth magnetotail. Using a newly developed implementation for efficiently computing the squashing degree of magnetic field lines in any 3-D domain (Liu et al., 2016), we obtain the 3-D distribution of QSLs as well as their evolution in the near-tail plasma sheet. The intersection of the 3-D distribution of QSLs with the equatorial plane recovers results from our previous work. More importantly, the calculated 3-D distribution of QSLs provides a complete and global view of the geometric structure of the 3-D reconnections associated with the plasmoid formation induced by the nonlinear ballooning instability in the near-Earth magnetotail.
The rest of the paper is organized as follows. We first briefly review our previous simulation results for the plasmoid formation process induced by ballooning instability in Sect. 2. Next in Sect. 3 we describe the method we use for efficiently evaluating the squashing degrees of entire magnetic fields. Both 2-D and 3-D distributions of QSLs revealed from the squashing degree calculation are reported and analyzed in Sect. 4. Finally, summary and discussion are given in Sect. 5.
Our recent MHD simulations are developed to demonstrate the dynamic process of plasmoid formation induced by nonlinear ballooning instability of the near-Earth magnetotail. In these simulations, the magnetic configuration of the near-Earth magnetotail is modeled using the generalized Harris sheet, which can be defined in a Cartesian coordinate system as , , , and λ is the characteristic width of the current sheet. The conventional Harris sheet is recovered when F(x)=1. The configuration can be further specified with a particular Bz profile that features a minimum region along the x axis, corresponding to an embedded thin current sheet (Fig. 1), such as those often found in global MHD simulations and inferred from satellite observations in the near-Earth magnetotail.
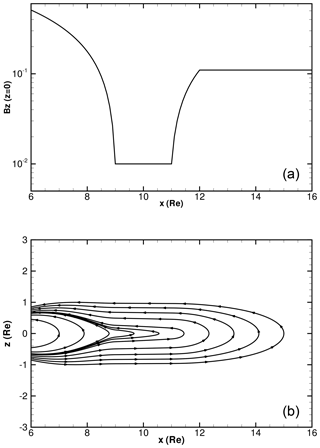
Figure 1 profile (a) and magnetic field lines (b) of a generalized Harris sheet as a proxy to the near-Earth magnetotail configuration.
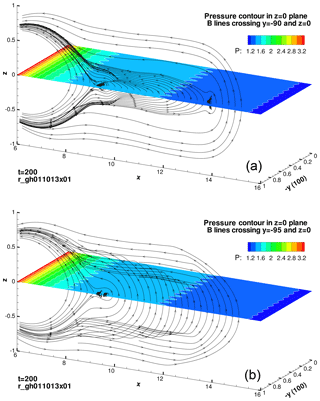
For a sufficiently small magnitude of the Bz minimum, the magnetotail becomes unstable to ballooning instability, whose nonlinear development leads to the formation of tailward receding plasmoids in the magnetotail (Fig. 2). The magnetic reconnection process in these simulations is no longer invariant along the equilibrium current direction, unlike in a conventional 2-D reconnection process. For example, at a time after the formation of plasmoids, those field lines crossing the line in the z=0 plane encounter a totally different plasmoid structure from the field lines crossing the line in the z=0 plane (Fig. 3). Questions arise as to where and how a reconnection takes place in the 3-D configuration, as well as how the global structure of the 3-D reconnection process can be characterized and captured in ways different from the more familiar 2-D reconnection process. Further, it remains unclear whether this 3-D reconnection process can be reducible to or interpretable in terms of the conventional 2-D reconnection processes.
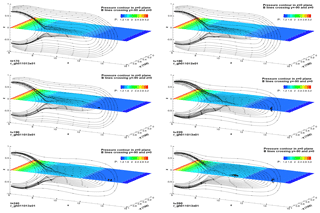
Figure 2Total pressure contours in the z=0 plane and magnetic field lines crossing the intersection of the z=0 and planes at selected time slices (t = 170, 180, 190, 220, 240, 260). The unit of all the coordinate axes is Earth radius RE. The time unit is Alfvénic time τA.
To address these questions in this work, we for the first time apply the concept of a quasi-separatrix layer (QSL) to the analysis of the geometry of magnetic reconnection induced by ballooning instability in a generalized Harris sheet that represents the magnetotail. QSL has been adopted for the analysis of the reconnection structures involved in the solar corona for a long time (e.g., Titov and Démoulin, 1999; Titov et al., 2002). It has also been effectively applied to the analysis of laboratory reconnection experiments (Lawrence and Gekelman, 2009). A QSL is a 3-D structure defined by a steep gradient in the field-line connectivity, which is quantified by mapping field lines across a specified volume. A surface, S, must first be defined to enclose this volume. Divide S into two subspaces, S0 and S1, where S0 and S1 represent the surfaces on which field lines enter and leave the volume, respectively. The initial footpoint is defined as in S0. One then traces the field line from the initial footpoint through the enclosed volume until the field line leaves the volume through S1 at the point . The Jacobian transformation matrix and the norm of the mapping from (u0,v0) to (u1,v1) are defined as
A QSL is the region where the gradient of this mapping is large compared to the average mapping, i.e., N≫1.
Mathematically, the squashing degree Q is defined as , where Δ is the determinant of the Jacobian matrix (Titov et al., 2002; Priest and Démoulin, 1995). The variation of Q among different field lines reflects the deformation of the magnetic flux tubes. A high squashing degree corresponds to a large variation in the cross-sectional area of an elemental flux tube from one footpoint to another. Quasi-separatrix layers turn into separatrices in the limit where the layer thickness goes to zero or the corresponding squashing degree goes to infinity. The physical significance of QSL is that current sheets preferentially form on these layers for reconnection.
A newly developed implementation for efficiently computing the squashing degree of magnetic field lines in any 3-D domain has been successfully applied to investigating the evolution of magnetic flux ropes in a coronal magnetic field extrapolated from a photospheric magnetic field (Liu et al., 2016). The method utilizes the field-line mappings between a cutting plane and the footpoint planes to give optimal results for mapping the squashing factor in the cutting plane. In order to avoid spurious high squashing degree structures for field lines touching the cutting plane, a new plane perpendicular to the particular field line can be introduced and switched to using the same method. We adopt this new method to recover our previous results on 2-D QSL distribution based on the calculation of bald patches. We further use the new method to find the 3-D distribution of QSLs in the entire domain.
In this section, we compute the squashing degrees and analyze the 2-D and 3-D QSL distributions of the magnetic field configuration as well as its evolution in the near-Earth magnetotail, in an attempt to understand the global geometry of the magnetic field and the 3-D nature of the magnetic reconnection process in association with the plasmoid formation process induced by ballooning instability.
4.1 2-D spatial distribution of QSLs in equatorial plane
We first review the development of QSLs in the equatorial plane of the magnetotail (i.e., the z=0 plane) based on the computation of squashing degrees, as shown in Fig. 4, for the same time sequence of nonlinear ballooning development that leads to the formation of tailward receding plasmoids in the magnetotail (Fig. 2). Similar results on QSLs are also obtained in our previous work, where the QSLs are identified based on the computation of bald patches (Zhu et al., 2017). Here the QSLs are identified as the boundaries of white patches in a plane, on which the squashing degree becomes singularly large.
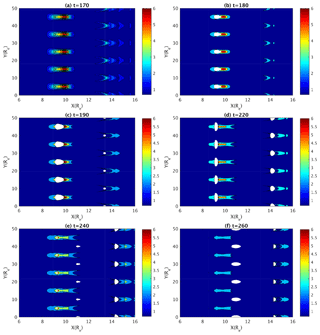
Figure 4Contours of the logarithm of squashing degree in the z=0 plane at t=170 (a), t=180 (b), t=190 (c), t=220 (d), t=240 (e), and t=260 (f). White circles denote the locations where the squashing degree becomes singular.
In the initial and early stages of ballooning instability evolution, QSLs are absent in the z=0 plane (t=170) (Fig. 4, upper left). By the time t=180 the first set of QSLs denoted as the white enclosed regions starts to form periodically along the y direction within the z=0 plane around the line of x=9.5 (Fig. 4, upper right). As the ballooning instability continues to evolve, a second set of QSLs starts to form in the equatorial plane near the radially extending fronts of ballooning fingers around x≲13.5 (t=190) (Fig. 4, middle left). The circular shape of each of these QSLs is smaller in radius than the first set of QSLs. Their spatial distribution pattern is similar to the first set of QSLs, but their locations are shifted in the y direction from the first set by one half distance between two adjacent QSLs. After reaching their maximum sizes, the first set of QSLs begins to shrink into ellipses squeezed in the x direction and eventually disappears (t = 220–260) (Fig. 4, middle right, lower left, and lower right). In addition, the locations of the QSLs also evolve, particularly those of the second set. As the ballooning finger tips extend in the positive x direction, the QSLs behind each finger tip in the second set move along in the same tail direction. Furthermore, as the first set of QSLs nearly shrinks into disappearance, a third set of QSLs starts to emerge at x=11 between the first two sets around t=240 (Fig. 4, lower left). This set of QSLs later becomes dominant in size after the first set disappears and the second set also shrinks in size. Different from the first set, the third set of QSL circles has the same locations in the y direction as those in the second set. The timings and locations of the emergence of these QSL structures correlate well with those of the plasmoid development as shown in Fig. 2.
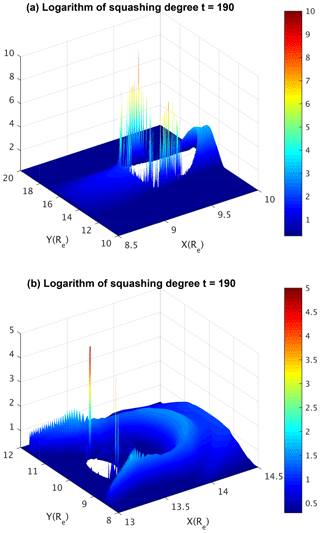
Even within the 2-D equatorial plane (z=0), the isolated and discrete distribution of QSLs in both the x and y directions indicates the 3-D feature of the corresponding reconnection process. In other words, the X-line in conventional 2-D reconnection has broken into a group of disconnected locations of reconnections as represented by QSLs. A close examination of one of the QSLs centered around x=9.5, y=15 and another centered around x=13.5, y=10 at t=190 finds that the variation of squashing degree at the QSL on the boundary of an isolated region is rather spiky instead of smooth (Fig. 5). Away from the QSL, the logarithms of squashing degree are close to zero and their variation is flat and smooth. The QSL structures are indeed located surrounding well-isolated regions, which are the outcome of the irreducible 3-D nature of the corresponding reconnection process.
4.2 3-D spatial distribution of QSLs
We further examine the 3-D distribution of QSLs in the entire simulation domain of the magnetotail. Not only are QSLs located in isolated regions in the 2-D plane, but they are also localized in isolated and confined regions in the 3-D domain (Fig. 6). As shown in Fig. 6, the circles representing QSLs in the 2-D plane are extended to the iso-surfaces representing QSLs in 3-D space. Such regions of QSLs are localized along the equilibrium field line near the equatorial plane, such as those shown in Fig. 1 (lower panel). This is consistent with field-line structure during the nonlinear development of ballooning instability, where the plasmoids are centered around the equatorial plane with north–south (z) symmetry. The distributions of the QSL structures are periodic along the west–east (y) direction (Figs. 7 and 8), same as the QSL distribution within the 2-D equatorial plane. The 3-D distribution of QSLs provides a global and complete view of where the reconnection takes place. They further confirm the irreducible 3-D nature of the corresponding reconnection process.
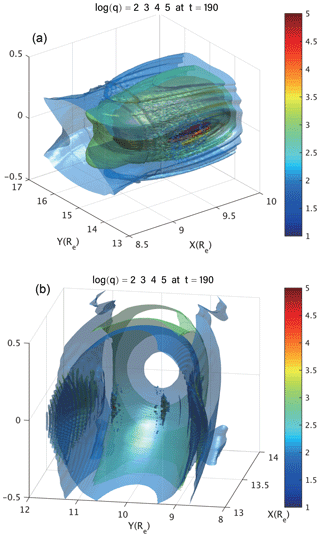
Figure 6Iso-surfaces of the logarithm of squashing degree in the 3-D domains centered at x=9.5, y=15, z=0 (a) and x=13.4, y=10, z=0 (b), respectively, at t=190.
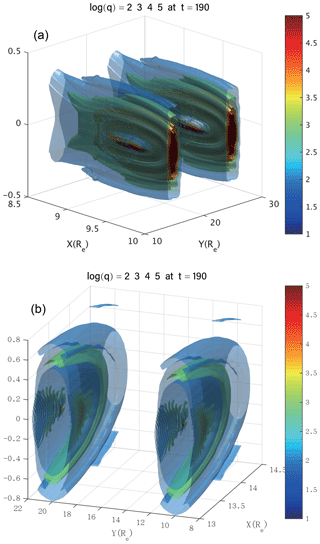
Figure 7Iso-surfaces of the logarithm of squashing degree in the broader 3-D domains, which include two periods of repeating QSL distribution from x=9.5, y=15, z=0 to x=9.5, y=25, z=0 (a) and from x=13.4, y=10, z=0 to x=13.4, y=20, z=0 (b), respectively, at t=190.
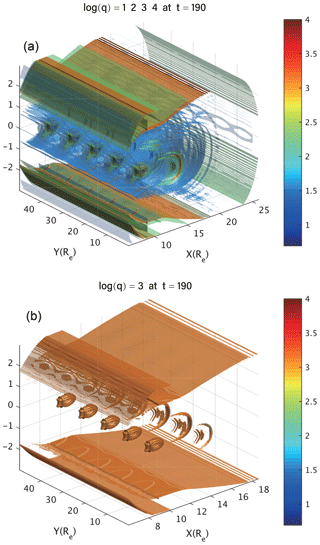
Figure 8(a) Iso-surface of the logarithm of squashing degree in the broader 3-D domains, which include five periods of repeating QSL distribution at t=190; (b) same as the upper panel, except that only the iso-surface of the logarithm of squashing degree equaling 3 is plotted.
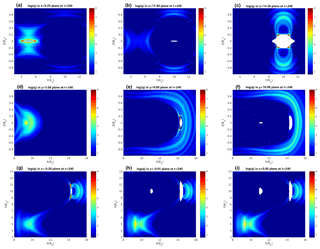
Another approach to characterizing the 3-D distribution of QSLs in the near-Earth magnetotail is to examine the squashing degree contours on various strategically selected 2-D slices parallel or perpendicular to coordinate axes. For example, at an earlier time t=190, the squashing degree distributions in the y−z planes show two elliptically shaped QSL regions centered around at x=9.45 and at x=13.38, respectively, which again are represented by the white space where the squashing degree becomes singular (Fig. 9, upper row). In the x−z plane, the corresponding two QSL regions manifest themselves as two round areas of singular squashing degree located around at y=5 and at y=10 (Fig. 9, middle row). In the x−y planes with equal distance off the equatorial plane ( and z=0.03), the QSL regions are similar to those within the equatorial plane shown in Fig. 4 in both location and shape, and the QSL distributions in those two x−y plane are symmetric with respect to z=0 (Fig. 9, lower row). However, those QSL regions disappear as the x−y planes move further away from the equatorial plane, indicating the localized nature of the 3-D reconnection regions.
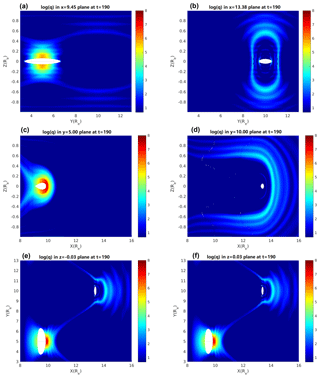
Figure 9Contours of the logarithm of squashing degree in the x=9.45 and x=13.38 planes (a–b); in the y=5 and y=10 planes (c–d); and in the and z=0.03 planes (e–f) at t=190.
The above approach also helps in visualizing the development of 3-D distribution of QSLs over time. At a later time t=240, three QSL regions appear along the x axis at x=9.25, 11.0, and 14.3, which can be first seen from the squashing degree contours within the y−z planes (Fig. 10, upper row). This is in contrast with the earlier time at t=190, when QSLs only appear in two y−z planes along the x axis (Fig. 9, upper row). At the same time, the three QSL regions also show up in the x−z planes, individually or together, depending on where the plane is located in the y direction (Fig. 10, middle row). For example, the two QSL regions in the x−z plane around and (Fig. 10, middle row, right panel) correspond to the two QSL regions in the y−z plane around , but one in the x=11.0 plane (Fig. 10, upper row, middle panel) and another in the x=14.3 plane (Fig. 10, upper row, right panel), respectively. Furthermore, the time development of QSL 3-D distribution can also be viewed from the variation of squashing degree contours in the x−y planes along the z direction (Fig. 10, lower row). In particular, in comparison to the earlier time at t=190, the dominant QSL regions have shifted from around (Fig. 9, lower row) to about near the z=0 equatorial plane by the time t=240 (Fig. 10, lower row). Together, and over time, these slices with different but complementary orientations comprise a complete view of the development of the global 3-D distribution of QSLs. In comparison with the timings and locations of the emergence of the plasmoid development shown in Fig. 2, one can see that 3-D distribution of QSLs as well as their evolution directly follow the plasmoid formation during the nonlinear development of ballooning instability in both time and space. More importantly, the 3-D QSL distribution and evolution provide a more global and complete view of the 3-D geometry of magnetic reconnection processes induced by the nonlinear ballooning instability in the near-Earth magnetotail.
In summary, the 3-D distribution of quasi-separatrix layers (QSLs), as well as its evolution directly following the nonlinear development of ballooning instability in the near-Earth magnetotail, has been thoroughly evaluated and examined based on previous resistive MHD simulation data on the plasmoid formation process induced by the ballooning instability. The quasi-separatrix layers have been identified by locating the regions of high squashing degree throughout the entire 3-D domain of the model near-Earth magnetotail in simulation. It is found that the 3-D distribution of QSLs correlates well not only with the 2-D-mode structures of ballooning instability within the x−y plane, but also with the 3-D ballooning-mode structures as projected onto the x−z and y−z planes, both spatially and temporally during the evolution of the magnetotail configuration. Such a close correlation demonstrates a strong coupling between the ballooning and the corresponding reconnection processes. It also further confirms the intrinsic 3-D nature of the ballooning-induced plasmoid formation and reconnection processes, in both geometry and dynamics. In addition, the reconstruction of the 3-D QSL geometry may provide an alternative means for identifying the location and timing of 3-D reconnection sites in the magnetotail from both numerical simulations and satellite observations.
Whereas the near-Earth magnetotail can become ballooning unstable under substorm conditions, the nonlinear evolution of ballooning instabilities, by themselves, may not always lead to the near-explosive growth. The coupling between ballooning and reconnection could be an alternative, though not the necessary, route to substorm onset. Previous studies (Pritchett and Coroniti, 1999, 2010, 2013; Zhu et al., 2004) have demonstrated the persistent presence of ballooning instabilities in generalized Harris sheet and magnetotail configurations. The models have varied from the global scales in the ideal MHD models to the meso scales of two-fluid models, and eventually to the microscopic scales of kinetic models of plasmas. Since the intrinsic 3-D nature of the reconnection process reported in this work derives from the nature of ballooning instability, the global 3-D geometry structure of the ballooning-induced reconnection process is expected to persist in the presence of two-fluid and kinetic effects, particularly on the macroscopic scales where both MHD and kinetic models should agree. The QSL is purely a geometric feature of the magnetic field configuration. Thus the QSL method only relies on the magnetic field geometry in order to identify the reconnection sites. It is independent of how the plasma is modeled, be it fluid or particle. Therefore the QSL method should be applicable for particle-in-cell simulations of reconnection caused in the course of a kinetic ballooning instability.
Although this work was in part motivated by the substorm problem in magnetospheric physics, it should not be seen as one confined only to the space plasma physics community. Rather, with our first application of QSL to the magnetotail configuration represented by the generalized Harris sheet, this work provides new insight into the ubiquitous 3-D reconnections in nature and laboratory by identifying and characterizing 3-D reconnection induced by ballooning instability.
Because the 2-D perception of magnetic reconnection has been the conventional paradigm for interpreting and understanding most phenomena and processes associated with reconnection in both natural and laboratory plasmas since the beginning, our work and results provide a dramatically different and refreshing view on one of the most fundamental processes in all plasmas. It touches the core question as to what exactly defines a reconnection or whether reconnections in two dimensions and three dimensions are qualitatively different. Different answers to such a question can lead to vastly contrasting or contradicting interpretations and conclusions. These issues would continue to be addressed in future work.
The QSL method may potentially be applied to in situ observation data analysis as well, since it is the knowledge of the magnetic field lines' connectivity itself only that is required for the calculation of QSLs. The in situ observation data from both single-point and multi-point spacecraft measurements, with additional assumptions and modeling, have been used in various reconstruction methods for the magnetic field-line geometry in the magnetotail. These include the global MHD simulations of magnetotail evolution calibrated using the in situ observation data in general (e.g., Raeder et al., 2008), the Grad–Shafranov (GS) method for two-dimensional (2-D) magnetohydrostatic structure based on the single-spacecraft data analysis technique (e.g., Hasegawa et al., 2014), and the magnetic field rotation analysis (MRA) method based on four-point measurements of the magnetic field (e.g., Shen et al., 2007). The reconstructed region of interest using these methods and in situ observation data can then be subject to the calculation of QSL. We plan on exploring such a potential application of the QSL method to in situ observation analysis in the near future.
Data used in this study are available for download at http://plasma.ustc.edu.cn/publication/19/zhu19a/data/ (last access: 12 May 2019).
PZ was responsible for providing the simulation results and the original idea, the planning, coordinating, and executing of the overall QSL analyses, as well as the writing of the entire paper.
ZW performed the QSL calculations and plotted the corresponding results.
JC provided the Fortran and IDL programs for QSL calculations.
XY converted the simulation data into the format for QSL calculations and aided in figure revisions and paper preparation.
RL was responsible for the QSL algorithm implemented in the Fortran program used in the QSL calculation and contributed to paper writing, revisions, and responses to the referees.
The authors declare that they have no conflict of interest.
The computational work used the NSF XSEDE resources provided by TACC under grant no. TG-ATM070010 and the resources of NERSC, which is supported by the DOE under contract no. DE-AC02-05CH11231.
This research has been supported by the National Natural Science Foundation of China (grant no. 41474143) and the U.S. Department of Energy (grant nos. DE-FG02-86ER53218 and DE-SC0018001).
This paper was edited by Christopher Owen and reviewed by Andrei Runov and one anonymous referee.
Angelopoulos, V., McFadden, J., Larson, D., Carlson, C., Mende, S., Frey, H., Phan, T., Sibeck, D., Glassmeier, K.-H., Auster, U., Donovan, E., Mann, I., Rae, I., Russell, C., Runov, A., Xhou, X., and Kepko, L.: Tail reconnection triggering substorm onset, Science, 321, 931–935, https://doi.org/10.1126/science.1160495, 2008. a
Baker, D. N., Pulkkinen, T. I., Angelopoulos, V., Baumjohann, W., and McPherron, R. L.: Neutral line model of substorms: Past results and present view, J. Geophys. Res., 101, 12975–13010, 1996. a
Birn, J. and Hones Jr., E. W.: Three-dimensional computer modeling of dynamic reconnection in the geomagnetic tail, J. Geophys. Res., 86, 6802––6808, https://doi.org/10.1029/JA086iA08p06802, 1981. a, b, c, d, e
Hasegawa, H., Sonnerup, B. U. O., Hu, Q., and Nakamura, T.: Reconstruction of an evolving magnetic flux rope in the solar wind: Decomposing spatial and temporal variations from single-spacecraft data, J. Geophys. Res.-Space, 119, 97–114, https://doi.org/10.1002/2013JA019180, 2014. a
Hesse, M. and Birn, J.: Plasmoid evolution in an extended magnetotail, J. Geophys. Res., 96, 5683–5696, 1991. a, b, c, d
Lawrence, E. E. and Gekelman, W.: Identification of a Quasiseparatrix Layer in a Reconnecting Laboratory Magnetoplasma, Phys. Rev. Lett., 103, 105002, https://doi.org/10.1103/PhysRevLett.103.105002, 2009. a, b
Liu, R., Kliem, B., Titov, V. S., Chen, J., Wang, Y., Wang, H., Liu, C., Xu, Y., and Wiegelmann, T.: Structure, Stability, and Evolution of Magnetic Flux Ropes from the Perspective of Magnetic Twist, Astrophys. J., 818, 148, https://doi.org/10.3847/0004-637X/818/2/148, 2016. a, b
Lui, A. T. Y.: Extended Consideration of a Synthesis Model for Magnetic Substorms, in: Magnetospheric Substorms, edited by: Kan, J. R., Potemra, T. A., Kokubun, S., and Ijima, T., Vol. 64, p. 43, AGU Monogr. Ser., American Geophysical Union, Washington D.C., USA, 1991. a
Otto, A., Schindler, K., and Birn, J.: Quantitative study of the nonlinear formation and acceleration of plasmoids in the Earth's magnetotail, J. Geophys. Res., 95, 15023–15037, https://doi.org/10.1029/JA095iA09p15023, 1990. a
Panov, E. V., Sergeev, V. A., Pritchett, P. L., Coroniti, F. V., Nakamura, R., Baumjohann, W., Angelopoulos, V., Auster, H. U., and McFadden, J. P.: Observations of kinetic ballooning/interchange instability signatures in the magnetotail, Geophys. Res. Lett., 39, L08110, https://doi.org/10.1029/2012GL051668, 2012. a
Priest, E. R. and Démoulin, P.: Three-dimensional magnetic reconnection without null points: 1. Basic theory, J. Geophys. Res., 100, 23443–23463, 1995. a
Pritchett, P. L.: The onset of magnetic reconnection in three dimensions, Phys. Plasmas, 20, 080703, https://doi.org/10.1063/1.4817961, 2013. a
Pritchett, P. L. and Coroniti, F. V.: Drift ballooning mode in a kinetic model of the near-Earth plasma sheet, J. Geophys. Res., 104, 12289–12300, 1999. a
Pritchett, P. L. and Coroniti, F. V.: A kinetic ballooning/interchange instability in the magnetotail, J. Geophys. Res., 115, A06301, https://doi.org/10.1029/2009JA014752, 2010. a
Pritchett, P. L. and Coroniti, F. V.: Structure and consequences of the kinetic ballooning/interchange instability in the magnetotail, J. Geophys. Res., 118, 146–159, https://doi.org/10.1029/2012JA018143, 2013. a
Raeder, J., Larson, D., Li, W., Kepko, L., and Fuller-Rowell, T.: OpenGGCM Simulations for the THEMIS Mission, Space Sci. Rev., 141, 535–555, https://doi.org/10.1007/s11214-008-9421-5, 2008. a
Schindler, K.: Physics of Space Plasma Activity, Cambridge University Press, Cambridge, UK, 2007. a, b
Shen, C., Li, X., Dunlop, M., Shi, Q. Q., Liu, Z. X., Lucek, E., and Chen, Z. Q.: Magnetic field rotation analysis and the applications, J. Geophys. Res.-Space, 112, A06211, https://doi.org/10.1029/2005JA011584, 2007. a
Sitnov, M. I., Merkin, V. G., Swisdak, M., Motoba, T., Buzulukova, N., Moore, T. E., Mauk, B. H., and Ohtani, S.: Magnetic reconnection, buoyancy, and flapping motions in magnetotail explosions, J. Geophys. Res.-Space, 119, 7151–7168, https://doi.org/10.1002/2014JA020205, 2014. a
Sovinec, C., Glasser, A., Barnes, D., Gianakon, T., Nebel, R., Kruger, S., Schnack, D., Plimpton, S., Tarditi, A., Chu, M., and the NIMROD Team: Nonlinear Magnetohydrodynamics with High-order Finite Elements, J. Comput. Phys., 195, 355–386, https://doi.org/10.1016/j.jcp.2003.10.004, 2004. a
Titov, V. S. and Démoulin, P.: Basic topology of twisted magnetic configurations in solar flares, Astron. Astrophys., 351, 707–720, 1999. a, b
Titov, V. S., Hornig, G., and Démoulin, P.: Theory of magnetic connectivity in the solar corona, J. Geophys. Res., 107, 1164, https://doi.org/10.1029/2001JA000278, 2002. a, b, c
Zhu, P. and Raeder, J.: Plasmoid formation in current sheet with finite normal magnetic component, Phys. Rev. Lett., 110, 235005, https://doi.org/10.1103/PhysRevLett.110.235005, 2013. a, b, c, d, e
Zhu, P. and Raeder, J.: Ballooning Instability Induced Plasmoid Formation in Near-Earth Plasma Sheet, J. Geophys. Res.-Space, 119, 131–141, https://doi.org/10.1002/2013JA019511, 2014. a, b, c, d, e, f
Zhu, P., Bhattacharjee, A., and Ma, Z. W.: Finte-ky ballooning instability in the near-Earth magnetotail, J. Geophys. Res., 109, A11211, https://doi.org/10.1029/2004JA010505, 2004. a
Zhu, P., Bhattacharjee, A., Sangari, A., Wang, Z.-C., and Bonofiglo, P.: Three-dimensional geometry of magnetic reconnection induced by ballooning instability in a generalized Harris sheet, Phys. Plasmas, 24, 024503, https://doi.org/10.1063/1.4976994, 2017. a, b


