the Creative Commons Attribution 4.0 License.
the Creative Commons Attribution 4.0 License.
Connection between the length of day and wind measurements in the mesosphere and lower thermosphere at mid- and high latitudes
Sven Wilhelm
Gunter Stober
Vivien Matthias
Christoph Jacobi
Damian J. Murphy
This work presents a connection between the density variation within the mesosphere and lower thermosphere (MLT) and changes in the intensity of solar radiation. On a seasonal timescale, these changes take place due to the revolution of the Earth around the Sun. While the Earth, during the northern-hemispheric (NH) winter, is closer to the Sun, the upper mesosphere expands due to an increased radiation intensity, which results in changes in density at these heights. These density variations, i.e., a vertical redistribution of atmospheric mass, have an effect on the rotation rate of Earth's upper atmosphere owing to angular momentum conservation. In order to test this effect, we applied a theoretical model, which shows a decrease in the atmospheric rotation speed of about ∼4 m s−1 at a latitude of 45∘ in the case of a density change of 1 % between 70 and 100 km. To support this statement, we compare the wind variability obtained from meteor radar (MR) and Microwave Limb Sounder (MLS) satellite observations with fluctuations in the length of a day (LOD). Changes in the LOD on timescales of a year and less are primarily driven by tropospheric large-scale geophysical processes and their impact on the Earth's rotation. A global increase in lower-atmospheric eastward-directed winds leads, due to friction with the Earth's surface, to an acceleration of the Earth's rotation by up to a few milliseconds per rotation. The LOD shows an increase during northern winter and decreases during summer, which corresponds to changes in the MLT density due to the Earth–Sun movement. Within the MLT the mean zonal wind shows similar fluctuations to the LOD on annual scales as well as longer time series, which are connected to the seasonal wind regime as well as to density changes excited by variations in the solar radiation. A direct correlation between the local measured winds and the LOD on shorter timescales cannot clearly be identified, due to stronger influences of other natural oscillations on the wind. Further, we show that, even after removing the seasonal and 11-year solar cycle variations, the mean zonal wind and the LOD are connected by analyzing long-term tendencies for the years 2005–2016.
- Article
(2056 KB) - Full-text XML
- BibTeX
- EndNote
According to the first Kepler law, the Earth travels in a good approximation on an elliptical trajectory around the Sun. Within a year the distance between both celestial bodies changes. During the northern-hemispheric (NH) winter the range is approximately 3.29 % shorter than in the NH summer. Due to the inverse square law, where the intensity I of the radiation is inversely proportional to the Earth–Sun distance squared, this shorter distance between the Sun and the Earth during boreal winter leads to an increased heating of the mesosphere and lower thermosphere (MLT) resulting in an expansion of the MLT and thermosphere, compared to the annual mean. Another effect on the expansion–shrinking of the MLT is given by the variability of solar radiation due to the 11-year solar cycle effect. Figure 1 shows a scheme of the Earth–Sun constellation and the resulting effects, which will be explained in the following. Previous studies such as Walterscheid (1989), Marsh et al. (2007), Emmert (2015), and Lee et al. (2018) showed that solar cycle variations affect the atmospheric density, temperature, chemical composition, and winds over the whole atmosphere, but in particular in the MTI (mesosphere–thermosphere–ionosphere) system. A model simulation by Marsh et al. (2007) showed responses to changes in the 11-year solar cycle for the whole atmosphere. For example, they showed that due to differences in the solar radiation between solar maximum and solar minimum temperature changes by over 100 K occur in the lower thermosphere. Further, they showed the occurrence of tropospheric wind and temperature changes due to changes in solar radiation. But they also mention that changes in the climatology due to solar radiation are too complex to be explained by simplified methods. Stober et al. (2014) showed that a solar cycle effect between 2002 and 2013 led to changes in the neutral density within the MLT region by up to 2.5 %. Furthermore, satellite measurements showed on global scales a neutral density decrease by up to ∼30 % between solar maximum and solar minimum at about 400 km (Emmert et al., 2010). For the 2009–2010 winter season, Stober et al. (2012) showed a connection between the neutral density and the expansion–shrinking of the atmosphere by using meteor radar (MR) winds, lidar, and Microwave Limb Sounder (MLS) satellite temperature measurements. Further, they showed a strong anti-correlation of neutral air density and prevailing zonal winds. This indicates that an increase/decrease in the neutral density occurs almost simultaneously with a decrease/increase in zonal wind speed, respectively.
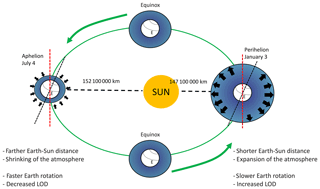
Figure 1Schema of Earth and Sun correlation and the resulting effects on the thickness of the atmosphere and the Earth's rotation velocity.
Changes in the thickness of the atmosphere, resulting from differences in the distance between the Earth and Sun as well as from solar cycle effects, go along with changes in the Earth's rotation speed. Based on the conservation of angular momentum L, the angular velocity ω for an altitude-defined atmospheric layer a, with the thickness ao−ai, can be estimated by
where J is the moment of inertia for a spherical shell, which rotates about an axis through the center; ai and ao are the inner and outer radius of the spherical shell; and m is the atmospheric mass. On this occasion the atmospheric mass is calculated according to Trenberth and Guillemot (1994) by
where is the density of air at longitude λ and latitude ϕ, and r is the distance from the Earth's center, while r=r0 at the surface of the Earth. In a good approximation the Earth's surface can be described as an ellipsoid , where a is the equatorial radius, is related to the flattening, and b is the polar radius. With respect to the height above the surface z, this results in and . Further, under the assumption that , the atmospheric mass can be derived by
The integral with respect to z and the relation to the measurements of the surface pressure ps can be estimated by solving
where g is the acceleration due to gravity. Considering that g is a function of height and latitude, the total atmospheric mass can be written in numerical terms as , where m is given in kilograms and is given in hectopascal, for standard gravity at 45∘ latitude. More detailed information about the estimation of the total mass of the atmosphere can be found in Trenberth and Guillemot (1994). According to Trenberth and Smith (2004) the total mean mass of the atmosphere is 5.148×10¹⁸ kg and varies slightly on annual scales mainly due to the amount of available water vapor.
A method to measure variations in the rotation speed of the solid Earth is estimating the time the Earth needs for a full rotation. In the following, we define the crust, mantle, and core of the Earth as solid Earth. To estimate the percentage of the atmospheric rotation velocity from the solid Earth rotation velocity, their rotation rate and their variations are necessary. The time the Earth needs for a full rotation is not constant. The rate of rotation and the orientation of the Earth's axis varies in time and space. Perturbations in the Earth's rotation rate are caused either by external forces, such as the influence of celestial bodies, or by internal torques, which are large-scale geophysical processes (Brzezinski et al., 2001). These internal torques are a combination of relative movements and mass reallocation of Earth's core, mantle, crust, oceans tides, and the atmosphere. Geographical differences in wind pattern and oceans cause shifts in the air and in the water masses. Earthquakes displacing the Earth's mantle might also influence the Earth's rotation on longer timescales (Carter and Robertson, 1986).
On timescales less than a year the dominant geophysical process to influence the duration of the Earth's rotation is the atmosphere (Volland, 1988). Every large-scale momentum exchange in the Earth's atmosphere on the Earth's surface increases or decreases the Earth's surface rotation, due to the law of conservation of total angular momentum within its system. The total angular momentum of the Earth's atmosphere M can be approximately written as
where Lapc is the angular momentum of an air parcel of unit mass, ρapc the density of the air parcel, urel the relative velocity, and ω×r the velocity due to the rotation of the Earth (Madden and Speth, 1995).
The total angular momentum and the velocities can be split into two parts. The mass part Mω represents the value the angular momentum would take if the atmosphere were vertically and horizontally stationary relative to the ground, and the relative part Mr describes the part of the atmosphere angular momentum that is due to the motion of the atmosphere relative to the Earth's rotation. Following Madden and Speth (1995), Egger et al. (2007), and Driscoll (2010) these parts of angular momentum can be written as
Thus, changes in the atmospheric angular momentum depend on the sum of different torques others. Here TF is the friction torque, TM is the mountain torque, and others torques include, for example, the gravity wave torque, which is small compared to the other two mentioned. The friction torque is exerted on the Earth's surface mainly due to frictional forces between the wind and the surface. If eastward-directed surface winds are prevailing on a global scale, this torque leads to an increase in the rotation rate due to a transfer of angular momentum from the atmosphere to the Earth's surface. The mountain torque is based on the surface pressure and orography, and it is the torque which is exerted on the Earth's surface due to a difference in pressure on two sides of a mountain. Both torques vary according to their global location and reach values in the range of 1019 Nm (Driscoll, 2010; Egger et al., 2007; de Viron and Dickey, 2014). The dominant exchange of the angular momentum between the atmosphere and Earth takes place in the atmospheric boundary layer, which, depending on the orography and latitude, has a typical thickness of about 1 km at midlatitudes (Volland, 1988).
Already in the 1960s and 1970s scientists showed that fluctuations in the orientation of the Earth's rotation axis, on seasonal timescales, are associated with changes in the east–west tropospheric wind on a global scale and therefore accompanied with a transfer of angular momentum between the Earth's crust and the atmosphere (Lambeck, 1978; Munk and MacDonald, 1961). Changes in the speed of the Earth's rotation axis can be seen in fluctuations in the duration around a day. These fluctuations have been measured since the 1960s using the very long baseline interferometry (VLBI) technique. The fluctuation in the day length is the difference between the astronomically determined duration of a full day 2π∕D and the standard 86 400 s, whereby D is the angular velocity (Aoki et al., 1981). Henceforth, we use the acronym LOD for the fluctuations in the length of day. The LOD can be written as
Within the estimation of the LOD the sidereal time gets converted into solar time, by taking into account the Earth's position, nutation, precession, and motion with respect to the stars. Detailed information about the transformation from sidereal time into solar time can be found in Aoki et al. (1981); Schnell (2006).
Carter and Robertson (1986) studied the influence of geophysical processes of the atmosphere on the duration of a day. They showed that, when the globally averaged mean winds from east to west increase, the rotation rate of the Earth decreases and the day gets longer. Rosen and Salstein (1991) showed that the effect of the wind on the LOD decreases with heights, by showing that winds in the atmospheric layer between 1000 and 10 hPa contribute 0.5 ms, winds from 10 to 1 hPa contribute 0.03 ms, and winds above 1 hPa contribute less than 4 µs to the interannual LOD budget. The impact of large-scale geophysical processes like El Niño (Dickey et al., 1994) and the stratospheric quasi-biennial oscillation (QBO) can also be seen in the LOD (e.g., Eubanks et al., 1988; Volland, 1988).
On short timescales a change in the Earth rotation can lead to an uneven heating of the Earth's surface, which results in temperature differences between the surface and the atmosphere above. This can further cause convection currents, which leads to pressure differences in the atmosphere and results in a different wind formation, which can influence the day length. The influence of the solar radiation is stronger for higher altitudes and also for longer time series. An increase in the solar radiation, which can be caused due to a slowing of the Earth's rotation, leads to an expansion of the higher atmosphere, which further results, due to the conversion of angular momentum, in a slower rotation of the atmosphere. What further needs to be considered is, for example, the influence of volcanic eruptions, which influence the Earth's rotation as well as the atmospheric chemistry and temperature (She et al., 2015). Changes in these parameters can further lead to changes in the neutral density.
Within this study, we focus on heights between 60 and 100 km. These heights are sensitive enough to density changes due to the changes in the intensity of solar radiation. After we describe the data we used in this study in Sect. 2, we show results and discuss the theoretical change in the rotation speed due to an expanding–shrinking atmosphere in Sect. 3. We will show that due to the expansion–shrinking effect, even under the assumption of equal density distribution between the Northern and Southern Hemisphere (SH), differences in the prevailing wind occur. Furthermore, we will show a connection between the LOD and the prevailing wind by showing correlations in the MLT region by using MR and MLS data for one polar and two midlatitude locations. We use the LOD data to show how deep the influence of solar radiation penetrates into the atmosphere. The conclusions are found in Sect. 4.
The wind data we use in this study are derived from MR and MLS satellite measurements. The MRs are located at the northern high-latitude station Andenes (32.5 MHz; 69.3∘ N, 16.0∘ E; Norway), the midlatitude stations Juliusruh (32.5 MHz; 54.6∘ N, 13.4∘ E; Germany) and Collm (36.2 MHz; 51.3∘ N, 13.0∘ E; Germany) on the Northern Hemisphere, and the southern high-latitude station Davis (33.2 MHz, 68.6∘ S, 78.0∘ E, Antarctic). The radars cover an altitude range between 75 and 110 km and the obtained winds have an hourly temporal resolution and a vertical altitude resolution of 2 km in the applied analysis. At 90 km altitude, the observed volume of each radar has a diameter of approximately ∼400 km, and the mean wind above each station is a weighted average over this volume. In the case of the Andenes, Davis, and Collm, MR data are available between 2005 and 2016 and for Juliusruh since 2008. We focus on an altitude range between 78 and 100 km where we obtain continuous measurements. The statistical uncertainties of winds are obtained from a fitting procedure by taking into account the number of detected meteors per altitude and time bin, as well as a full nonlinear error propagation of the radial wind errors. Therefore the resulting uncertainties for the hourly winds vary in a range between 2 and 6 m s−1 with larger errors at the upper and lower part the of the meteor layer. More information about the all-sky meteor radars and the wind estimation method used can be found in Hocking et al. (2001), Holdsworth et al. (2004), and Stober et al. (2017). For this research, we focus primarily on the zonal wind component, because a connection between winds and changes in day length will be mainly seen in the main rotation direction of the Earth.
In addition to local radar observations, we use satellite data from the Microwave Limb Sounder to extend the vertical coverage. MLS onboard the Aura satellite (Livesey et al., 2015; Waters et al., 2006) has a global coverage from 82∘ N to 82∘ S and an useful height range from approximately 11 to 90 km (261 to 0.001 hPa). The vertical resolution varies between ∼4 km in the stratosphere and ∼14 km at the mesopause (Livesey et al., 2007). The geometric heights are approximately estimated from pressure levels as described in Matthias et al. (2013): , where h is the altitude in km and p the pressure in hPa. Furthermore, we are aware about a difference between the geometric and geopotential heights, which increase especially above 80 km. Therefore, we focus in this work on the height range between 60 and 80 km (if not otherwise specified) to investigate a connection between the LOD and the density depending on zonal wind within these heights. Daily quasi-geostrophic winds for the years between 2005 and 2016 are derived from MLS geopotential height observations. For this study we use three different horizontal grids which are located around Andenes (70∘ N and 0–20∘ E) and around Juliusruh and Collm (50–60∘ N, 0–20∘ E), which are further referred to as northern high- and midlatitude stations, respectively. For the SH we use a horizontal grid around Davis (70∘ S, 60–80∘ E).
Further we use in this study combined data from the international Earth Rotation and Reference System Service (IERS, 2017). The use of interferometry between several stations, which observe radio sources, leads to fundamental geodetic information such as changes in the Earth's spinning or in the Earth orientation (Altamimi et al., 2007; Boeckmann, 2010; Rothacher, 2002). Based on this information the mean rotation rate and the astronomical duration of the day were computed according to Eq. (6) (Aoki et al., 1981). The IERS provides uncertainties for the day length measurements, which most of the time vary by ∼5 %. More information about the data provided by IERS and their algorithm to estimate the duration of a day can be found in Bizouard et al. (2017).
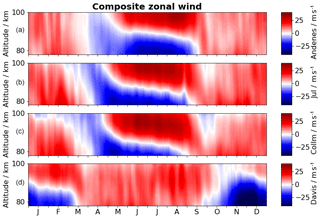
Figure 2Composites of zonal wind for the Northern Hemisphere stations Andenes (a), Juliusruh (b), and Collm (c). (d) shows the southern-hemispheric station of Davis. The composite for Andenes, Collm, and Davis includes 12 years of meteor radar data and that of Juliusruh includes 9 years. Positive values correspond to eastward-directed winds and negative to westward-directed winds.
3.1 LOD and neutral air density at the MLT
Figure 2 shows composites of zonal winds from MR measurements at Andenes, Juliusruh, Collm, and Davis. These data are estimated by using a mean wind adaptive spectral filter (Stober et al., 2017). It uses a 1-day sliding window, which mainly removes the impact of short-term variations, such as atmospheric tides and gravity waves. All three NH stations show almost similar wind patterns, with typical mesospheric eastward-directed winds during the winter, with mean values of up to 10 m s−1, and a wind reversal during spring. The spring wind reversal occurs earlier at midlatitudes than at polar latitudes. During the summer considerable vertical wind shear is present with westward-directed winds below 90 km for Andenes, below 88 km for Juliusruh, and below 85 km for Collm. Above these heights a strong eastward jet occurs. The westward and the eastward jets reach wind values of up to 40 m s−1 at all three locations. These annual wind climatologies are consistent with previous studies, e.g., Manson et al. (2004), Hoffmann et al. (2010), and Jacobi (2012). Compared to Andenes a nearly opposite wind pattern can be seen for Davis. A dominant eastward-directed wind occurs between March and September for the complete observation range. Between September and March a vertical wind shear occurs, which reaches heights above 100 km around October. Compared to the NH stations the summer vertical wind shear remains mainly below 90 km.
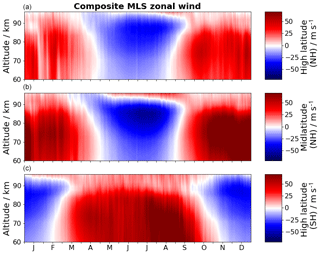
Figure 3Composite of zonal wind for the high-latitude location (a) and midlatitude location (b). The composite of both figures includes 12 years of wind data derived from MLS geopotential height data. Positive values corresponds to eastward-directed winds and negative to westward-directed winds. The altitude is given in geopotential height.
Besides the radar data, we additionally use MLS data within this study to extend the vertical coverage down to 60 km. In Fig. 3 the zonal wind is shown for the high-latitude location of Andenes, for middle latitudes at Collm, and for the southern latitude location Davis. The altitude ranges between ∼60 and ∼90 km geopotential height. A comparison of the MLS composite winds with MR composite winds results in a qualitatively good agreement for the seasonal amplitudes and phases. Both NH locations show eastward-directed winds between September and April for nearly all altitudes, with values of up to 40 m s−1 for the high-latitude area and up to 60 m s−1 for the midlatitudes. During summer westward-directed wind dominates below 95 km and reaches values of up to 30 m s−1 for the high latitudes. For the middle latitude, below 90 km, the wind reaches values of up to 50 m s−1. A similar pattern of an eastward-directed wind occurs in both cases during summer above 90 km geometric height. The SH location also shows a similar wind pattern to the observed MR data. In the following discussion we will focus on the MLS altitude range 60–80 km and use the MR data for the altitudes between 80 and 100 km.
According to previous studies such as Emmert et al. (2004) and Stober et al. (2012), a connection exists between the thickness of an atmospheric layer and the density fluctuation within that layer. Stober et al. (2012) explained the occurrence of this connection by showing variations in the neutral density, based on MLS and MR observations, together with changes in the MLT geometric height. Furthermore they showed a strong anti-correlation between the simultaneous occurrence of the zonal wind and the density change within the mesosphere.
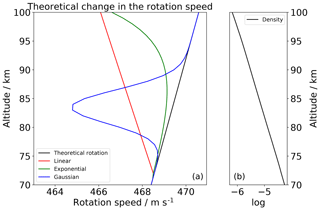
Figure 4Theoretical change in the rotation speed (left side) for a rigid atmospheric layer. In black we show the theoretical rotation speed of the Earth's atmosphere and in colors the change due to a density increase of 1 % according the legend. On the right side the density progress is shown for specific altitudes.
To underline this statement, we show in the following part the connection between the expanding MLT and the atmospheric rotation speed. Figure 4 shows, as an example, the theoretical variation in the atmospheric rotation velocity with height due to a density increase up to 1 % between 70 and 100 km. The calculation is done in 2 km height layers and for the latitude of 45∘. Different latitudes lead to slightly different values of g, which is used in Eq. (4). The density increase takes place for longer timescales during a solar maximum (Emmert et al., 2010) and on annual timescales during the winter, when the Earth–Sun distance is smaller. Both cases influence the temperature within this atmospheric layer as well as their expansion compared to the annual mean. Overall the density variation during an 11-year solar cycle is stronger than the variation caused by the changes in the Earth–Sun distance. According to Eqs. (1)–(4), we estimated for three different cases (linear, red; exponential, green; and a Gaussian-shaped, blue, density increase) the resulting theoretical change in the rotation speed within these heights, with the solid Earth rotation speed (black) as background flow. Based on the conserved quantity of the angular momentum within a narrow atmospheric layer (2 km vertical) this sums up, according to each case, to a decrease in the rotation speed by up to ∼2–4 m s−1, with the strongest variation within the Gaussian-shaped curve. These results fit to the observations by Stober et al. (2012) and show the dependence of the rotation speed within an atmospheric layer due to changes in the neutral density. However, we are not able to extract a specific wind value only based on wind measurements.
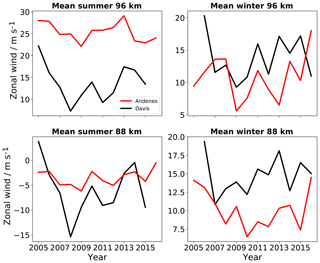
Based on ERA40 data, Trenberth and Smith (2004) showed that the global mean of the surface pressure is nearly constant, and surface pressure anomalies at the Northern and the Southern Hemisphere are nearly identical, but the fluctuations are opposite in sign. These anomalies are mainly due to the changing amount of available water vapor in the atmosphere. Under the assumption of opposite surface pressure anomalies within both hemispheres and therefore by neglecting other factors such as different gravity wave forcing between the hemispheres, we assume, on annual scales, similar pressure values within the MLT region. Therefore the prevailing wind within the MLT region should be similar in magnitude between Andenes and Davis, which are located at the same latitude in the Northern and Southern Hemisphere. To underline the influence of the intensity of the solar radiation on the density and also on the amplitude of the zonal wind, we compare the evolution of the seasonal mean wind measurements from the NH station Andenes (69.3∘ N) and SH station Davis (68.3∘ S). Figure 5 shows, for both stations, the winter and summer mean wind for the altitudes at 88 and 96 km. The northern winter includes the mean of the months of December, January, and February and the southern winter the months June, July, and August. The northern winter period comes along with the perihelion, which is the point where the Earth comes nearest to the Sun. At the perihelion, the intensity of the solar radiation on the upper atmosphere is stronger during the aphelion. While during the winter season the wind values are higher over Davis for both altitudes, they are higher over Andenes during the summer season, especially at 96 km, with values of up to 10–20 m s−1. Both seasonal wind differences are consistent with the change in the average density within the upper mesosphere, resulting from the different distance between the Earth and Sun and leading to the variation of the averaged zonal wind, as shown in Stober et al. (2012). We have to note that others factors exists, which are more dominant for the wind differences between both locations at theses altitudes. Other physical processes also have a strong effect on the hemispheric wind differences, e.g., the topography, chemical composition of the atmosphere (Lee et al., 2018; Marsh et al., 2007), and the occurrence and propagation of gravity waves. These waves are the main drivers of the atmospheric wind circulation and therefore also influence the local wind differences at both hemispheres. Furthermore, gravity waves lead, compared to the annual mean, to a colder summer mesosphere and a warmer winter mesosphere (Lübken et al., 2014). These temperature differences also fit well to the atmospheric expansion–shrinking. Unfortunately, we are not able to estimate a precise value on how strong the connection is between mean zonal wind and the LOD based only on wind measurements. For a more detailed understanding of these phenomena global density observations would be required.
3.2 Correlation of mean winds and LOD
In the following we want to show that the LOD (fluctuations in the length of a day) correlates with the prevailing wind from the four stations. If the Earth's rotation is constant the LOD should be zero; however, small wobbles of the Earth's rotation between the days cause tiny fluctuations in the day length. These have to be compensated for by a momentum transfer between the different parts of the Earth including the atmosphere. As the atmosphere is slaved to the Earth crust, because the atmospheric momentum and mass are much smaller than that of the Earth core, the atmosphere has to respond to changes in the rotation velocity. So far we use the LOD explicitly as reference for the changes in the rotation speed, which can be seen in the zonal wind, as well as to verify up to which height the solar-driven density effect is dominant. Therefore, Figs. 6 and 7 show wind values for Andenes, Collm, and Davis at different altitudes and the LOD by using the same filtering method as done for the winds. Two different altitudes in the MLT are considered from the MR winds for all locations: (1) 80 km, where within a year a change between eastward- and westward-directed wind occurs; and (2) 96 km, which is the altitude where the wind, during each hemispheric summer, shows the opposite direction compared to at 80 km (see Fig. 2). Positive wind values correspond to eastward-directed winds and positive LOD values correspond to a longer duration of the day. If not explicitly mentioned, the results of the two midlatitude stations are nearly identical. Therefore we only show the results for the location around Collm.
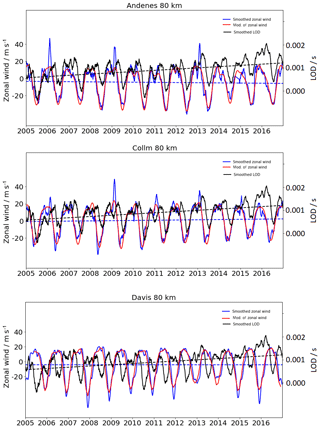
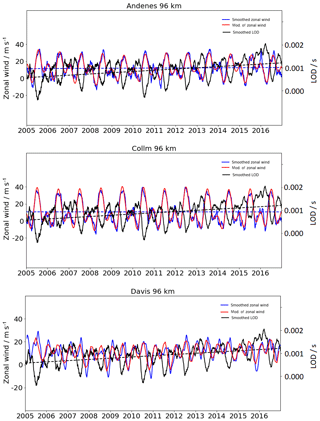
Figure 6Smoothed zonal wind (blue) values based on meteor radar wind data at 80 km and smoothed LOD (black) values. The modulation of the smoothed zonal wind is displayed in red after removing the impact of the solar cycle. All curves are done by smoothing over several days, without removing the day-to-day variations, to show the seasonal pattern of the parameters. The dashed lines correspond to the tendency of the wind and LOD based on linear regression.
At 80 km (Fig. 6) the oscillation pattern of the smoothed zonal wind (blue) and the smoothed LOD (black) are similar for Andenes. According to previous studies the LOD consists of superpositions of several periods, such as 0.5 years, 1 year (Vondrák and Burša, 1977), 2–3 years (Buffet, 1996), 5.9 years (Abraca del Rio et al., 1999), and others (e.g., Holme and de Viron, 2013; Munk and MacDonald, 1961). According to Abarca del Rio et al. (2003) an accurate estimation of the impact of the solar radiation is quite complicated, due to the fact that internal oscillations in the climate system show variations with the same frequency as the 11-year solar cycle. Further, Gray et al. (2010) support this statement and mention that the problem is further complicated due to the small influence of the solar forcing on the climate. Nevertheless, Chapanov and Gambis (2008) showed that, based on a decomposition of the LOD, the solar activity (10.47 years) is included. Also the zonal wind includes a superposition of several periods such as the solar cycle, diurnal and semidiurnal tides, and more (e.g., Emmert et al., 2010; Hoffmann et al., 2010). Therefore, we additionally show with the red line a smoothed zonal wind after removing variations due to the 11-year solar cycle. The influence of the solar cycle on the daily zonal wind is relatively small; therefore the smoothness of the red line is enhanced for better visualization. Changes in the LOD are sluggish compared to variations in the wind, due to the amount of momentum which is needed to influence the Earth's rotation speed. According to Dickey et al. (1994), a direct effect between the stratospheric and tropospheric zonal wind and the day length exists on annual timescales due to long-term geophysical effects, such as QBO and El Niño. They found that the stratosphere cannot be neglected in the Earth's angular momentum. Around 20 % of the LOD relative to the atmosphere below 100 hPa belongs to the impact of the stratosphere. Furthermore, they mentioned a small lag (10–20 days) between the LOD and variations in the angular momentum, but the lag does not appear to be statistically significant. Therefore only comparisons on seasonal and longer timescales are useful to consider. All parameters which are displayed in Fig. 6 show a seasonal pattern. First we describe the results for the NH stations. For the NH the zonal wind and the LOD show decreasing values during summer and increasing values during winter. Beside the striking seasonality, short time fluctuations within a year are observable during the winter in the zonal wind for some years. During the winter of 2010 and 2011, and on even shorter timescales such as a few months during the winter 2006, 2014, and 2015, decreases in the LOD together with decreases in the zonal wind are visible. The LOD varies between −1 and 4 ms. The LOD oscillation shows seasonal variations of a fluctuation with shorter day lengths during NH summer and longer day lengths during winter, which fits to the density increase and decrease in the MLT as described above. For the midlatitude station the oscillation patterns in the LOD and the wind are qualitatively similar, but shifted in time. The wind peaks occur earlier in the year than the LOD peaks, which goes along with the earlier wind transition at midlatitudes that can be seen in Fig. 2. For Davis a time shift of approximately 6 months occurs between the zonal wind and the LOD, due to the opposite seasonal wind pattern.
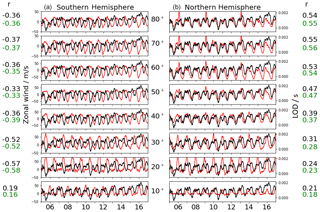
Figure 8Zonal MLS wind (red) and LOD (black) at ∼80 km geometric height for 0–20∘ E. The left part shows the values for the Southern Hemisphere and the right for the Northern Hemisphere for every 10∘ latitude. The black correlation coefficients (r) are estimated for the mean between 0 and 20∘ E, and the green coefficients correspond to the global average over all longitudes.
Table 1Correlation coefficients between the zonal wind and the LOD. Positive values corresponds to the occurrence of an eastward-directed mean zonal wind together with a positive fluctuation in the LOD.

In the summer wind transition altitude, a time shift occurs between both parameters. The altitude of the wind transition in these cases is defined as the height between the above-located eastward and the below-located westward wind during summer. At these heights the wind and the LOD are almost uncorrelated. Above the summer wind transition altitude the oscillation patterns between the LOD and the winds are quite opposite to those for 80 km altitude, with a 180∘ shift between both parameters, which can be seen in Fig. 7. The phase shift, which is pronounced during the summer, obviously results from the opposite wind regime compared to the 80 km altitude. Nevertheless, above the transition height, changes in the density, due to the intensity of the solar radiation, are more pronounced than at lower heights. Therefore the existing seasonal wind pattern fits well to the atmospheric density increase and decrease at these layers.
Additionally, we show in Table 1 correlation coefficients for the four locations for the altitudes between 80 and 98 km. Positive correlation values correspond to the occurrence of an eastward-directed wind together with an increased LOD. The values of the NH follow a similar pattern, with positive coefficients below the vertical transition height and negative ones above. Davis shows a different pattern, with overall negative correlation coefficients. This is owing to the opposite zonal wind pattern compared to the NH. Theoretically, a time shift of ∼6 months would lead to a similar correlation pattern to that in the NH.
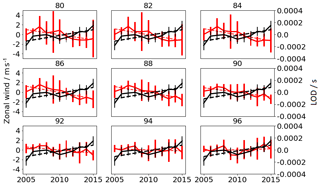
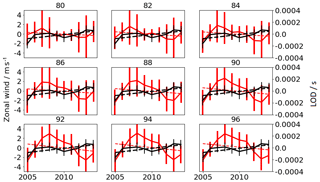
Figure 9Annual mean values for the LOD (black) and the zonal wind (red), for the station Collm, after removing seasonal variations and the solar cycle for the altitudes between 80 and 100 km. The error bars correspond to the standard deviation. The dashed lines represents the tendency.
Figure 8 shows the mean zonal wind at ∼80 km geometric height, based on MLS data, and the LOD. These mean zonal winds include wind values within the longitude grid between 0 and 20∘ E, which is comparable to the NH stations. The figure is divided in 10∘ latitude steps centered at latitudes from 80 to 10∘ S/N. Each latitude grid includes values for . For the MLS observations the comparisons between the wind and the LOD are similar to the 80 km meteor results at the respective latitudes. Furthermore, the occurrence of a time shift of 6 months between both polar hemispheres can be seen. A 180∘ phase shift would lead to the wind–LOD pattern of the opposite hemisphere. Furthermore, the strongest correlation between both parameters can be seen at northern polar latitudes. Due to an increase in the difference between the geometric and geopotential heights, we do not show comparisons for higher altitudes. We added correlation coefficients (black) between the mean zonal wind and the LOD for each latitude. A correlation increase towards the northern high latitudes is visible. The same would be seen if a 180∘ phase shift is added to the time series. Additionally, we present global correlations (green) by averaging mean zonal wind data over all longitudes, whereby possible stationary planetary waves are filtered. The global correlation coefficients are nearly similar to the values for previous average winds between 0 and 20∘ E. The shape of the curves between the global average winds is also nearly equal; therefore we did not add them in the figure.
In Figs. 9 and 10, long-term changes in annual LOD (black) and annual mean zonal winds (red) are shown for Collm and for Davis. At this point, we have to mention that the tendency over a long time series is not linear in time. Parameters which influence the tendency of the wind and the LOD also vary over time. Such changes are often approximated by a piecewise linear trend model (e.g., Jacobi et al., 2011; Merzlyakov et al., 2009; Tomé and Miranda, 2004), where different linear fit tendencies are estimated for different time periods. Nevertheless, due to the length of the available data series we decided not to use a piecewise linear trend model. The wind values exclude seasonal and solar cycle variations and the LOD excludes the seasonal variations. As an example for the location of Collm (Fig. 9), the altitudes between 80 and 96 km are displayed. The error bars correspond to the annual variance for each height and the dotted lines show the long-term tendency for each parameter. Figure 9 shows that a long-term increase in the LOD occurs together with a long-term decrease in the zonal wind. Above 94 km the tendency reverses into a slightly positive wind. This reversal can be explained by the stronger influence due to gravity wave filtering, which has to be considered and cannot be excluded by filtering the data. The tendencies of an increased value for the LOD and a decreased value for the mean zonal wind can be seen for all midlatitude locations and also for Davis (see Fig. 10). Andenes shows for all altitudes an increased tendency in the zonal wind (not shown). The results indicate that the connection between the LOD and the wind is more pronounced at lower latitudes and is simply explainable by the rotation velocity, which is higher at the middle latitude stations than at the polar latitudes like at Andenes and Davis. The results of an increase in the LOD and a decrease in zonal wind agree with the relation between fluctuations in the neutral density and the zonal wind, as shown in Stober et al. (2012).
Within this work we show that the mesospheric winds are affected by an expansion–shrinking of the upper atmosphere that takes place due to changes in the intensity of the solar radiation, which affects the density within the atmosphere. A reason for this, besides the solar cycle effect, is the annual movement of the Earth around the Sun, which leads to a shorter distance between both celestial bodies during the NH winter and a longer distance during summer. This leads to a shrinking/expansion of the atmosphere during the NH summer/winter. This shrinking effect mainly takes place in the upper atmosphere, where the amount of mass is small enough to be sensitive enough to changes to the intensity of solar radiation, as well as temperature changes. According to Stober et al. (2012) an increase in the neutral density together with a decrease in the zonal wind in the MLT region occurs. Based on these findings we showed that a theoretical density increase of 1 % between 70 and 100 km leads to a decrease in the atmospheric rotation speed, within a defined layer, of up to 4 m s−1. The influence of the Earth–Sun distance on the wind speed was further investigated using winds from four stations in total, whereby two stations are located at similar high latitudes for the Northern and Southern Hemisphere. The other two meteor radar systems are located at the northern midlatitudes. Based on summer and winter mean wind, we found that during the perihelion, where the MLT expands, a decrease in the zonal wind speed for the respective location occurs together with an increase in the LOD. During the opposite aphelion, an increase in the zonal wind occurs beside a decrease in the day length.
Further, we showed that even after removing the seasonal and the 11-year solar cycle variations the zonal wind and the LOD (fluctuations in the length of a day) are connected. We showed on the basis of annual timescales that an increase in the LOD occurs together with a stronger pronounced westward-directed wind for the middle latitude locations. This effect is weaker at the polar station and is, on the one hand, due to a smaller radius, which affects the rotation speed of the atmospheric layer. On the other hand, there are further natural factors, such as the gravity wave drag, that strongly influence these tendencies. Further, we were only able to investigate the connection between these parameters on timescales which are at least 1 year. On shorter timescales a connection between the LOD and the winds cannot be figured out; the LOD consists of oscillations with at least a 6-month period and with the currently available data we are not able to fully resolve the superpositions of both parameters. Future work remains necessary to fully understand these effects when global density data measurements are available. Additionally, in future work the estimation of a time lag between the LOD and the winds needs to be considered.
We want to mention that based on our findings a connection between the zonal wind and the LOD exists, which we explain by the variation of the available atmospheric density. Furthermore, we only compare global LOD data with local measurements, and within the MLT stronger geophysical effects which drive the wind regime at these altitudes exist. Within this work we only want to point out this effect, and for closer investigations we need global longtime density data.
The Andenes and Juliusruh radar data are available upon request from Gunter Stober (stober@iap-kborn.de). The Collm radar data are available upon request from Christoph Jacobi (jacobi@rz.uni-leipzig.de). The Davis radar data are available upon request from Damian Murphy (damian.murphy@aad.gov.au). The Microwave Limb Sounder data are available at https://mls.jpl.nasa.gov/ (Matthias, 2018).
SW wrote the manuscript with input from all authors. Furthermore, all co-authors contributed to the data interpretation. GS provided the high-resolution meteor wind data analysis for all stations and ensured the operation of the Andenes and Juliusruh meteor radar. VM provided the wind analysis used for the Microwave Limb Sounder data. CJ ensured the operation of the Collm meteor radar and DM the Davis meteor radar.
The authors declare that they have no conflict of interest. Christoph Jacobi is one of the Editors in Chief of Annales Geophysicae.
This work was supported by the WATILA project (SAW-2015-IAP-1 383). The
operation of the Davis meteor radar was supported through Australian
Antarctic Science projects 2668 and 4025. We thank IERS for providing the LOD data used, which can be found under https://datacenter.iers.org (last access: 4 April 2017).
Furthermore we acknowledge the IAP technicians for the technical support and
Jorge L. Chau for discussions at an early stage of the work.
The publication of this article was funded by the
Open Access Fund of the Leibniz Association.
Edited by: Andrew J. Kavanagh
Reviewed by: Chris Meek and one anonymous referee
Abarca del Rio, R., Gambis, D., Salstein, D., Nelson, P., and Dai, A.: Solar activity and earth rotation variability, J. Geodyn., 36, 423–443, https://doi.org/10.1016/S0264-3707(03)00060-7, 2003. a
Abraca del Rio, R., Gambis, D., and Salstein, D.: Interannual signal in length of day and atmospheric angular momentum, Ann. Geophys., 18, 347–364, https://doi.org/10.1007/s00585-000-0347-9, 1999. a
Altamimi, Z., Collilieux, X., Legrand, J., Garayt, B., and Boucher, C.: ITRF2005: A new release of the International Terrestrial Reference Frame based on time series of station positions and Earth Orientation Parameters, J. Geophys. Res., 112, B09401, https://doi.org/10.1029/2007JB004949, 2007. a
Aoki, S., Guinot, B., Kaplan, G., Kinoshita, H., McCarthy, D., and Seidelmann, P.: The new Definition of Universal Time, Astron. Astrophys., 105, 359–361, 1981. a, b, c
Bizouard, C., Lambert, S., Becker, O., and Richard, J.: Combined solution C04 for Earth Rotation Parameter consistent with International Terrestrial Reference Frame 2014, available at: https://hpiers.obspm.fr/iers/eop/eopc04/C04.guide.pdf, last access: 26 July 2017. a
Boeckmann, S.: Robust determination of station positions and Earth orientation parameters by VLBI intra-technique combination, Ph.D. thesis, Friedrich-Wilhelms-University, available at: http://hss.ulb.uni-bonn.de/diss_online (last access: 13 July 2017), 2010. a
Brzezinski, A., Bizouard, C., and Petrov, S.: Influence of the atmosphere on earth rotation: what we can be learned from the recent atmospheric angular momentum estimates?, Surv. Geophys., 23, 33–69, https://doi.org/10.1023/A:1014847319391, 2001. a
Buffet, B. A.: Gravitational oscillations in the length of day, Geophys. Res. Lett., 23, 2279–2282, 1996. a
Carter, W., E. and Robertson, D., S.: Studying the Earth by Very-Long-Baseline Interferometry, Sci. Am., 255, 46–54, 1986. a, b
Chapanov, Y. and Gambis, D.: Correlation between the solar activity cycle and the Earth rotation, available at: https://syrte.obspm.fr/jsr/journees2007/pdf/s4_18_Chapanov.pdf (last access: 2 August 2018), 2008. a
de Viron, O. and Dickey, J., O.: The two types of El Nino and their impacts on the length of day, Geophys. Res. Lett., 41, 3407–3412, https://doi.org/10.1002/2014GL059948, 2014. a
Dickey, J., O., Marcus, S., L., Hide, R., Eubanks, T., M., and Boggs, D., H.: Angular momentum exchange among the solid Earth, atmosphere, and oceans: A case study of the 1982–1983 El Nino event, J. Geophys. Res., 99, 23921–23937, 1994. a, b
Driscoll, S.: The Earth's Atmospheric Angular Momentum budget and its representation in reanalysis observation data and climate models, Ph.D. thesis, University of Reading, 2010. a, b
Egger, J., Weickmann, K., and Hoinka, K.-P.: Angular momentum in the global atmospheric circulation, Rev. Geophys., 45, RG4007, https://doi.org/10.1029/2006RG000213, 2007. a, b
Emmert, J. T.: Altitude and solar activity dependence of 1967–2005 thermospheric density trends derived from obrital drag, J. Geophys. Res.-Space, 120, 2940–2950, https://doi.org/10.1002/2015JA021047, 2015. a
Emmert, J. T., Lean, J. L., and Picone, J. M.: Record-low thermospheric density during the 2008 solar minimum, Geophys. Res. Lett., 37, L12102, https://doi.org/10.1029/2010GL043671, 2010. a, b, c
Emmert, J., T., Picone, J., M., Lean, J., L., and Knowles, S., H.: Global change in the thermosphere: Compelling evidence of a secular decrease in density, J. Geophys. Res., 109, 1–12, https://doi.org/10.1029/2003JA010176, 2004. a
Eubanks, T., Steppe, J., and Dickey, J.: The Earth's Rotation and Reference Frame for Geodesy and Geodynamics, chap.: The atmospheric excitation of rapid polar motions, Springer, 1988. a
Gray, L. J., Beer, J., Geller, M., Haigh, J. D., Lockwood, M., Matthes, K., Cubasch, U., Fleitmann, D., Harrison, G., Hood, L., Luterbacher, J., Meehl, G. A., Shindell, D., van Geel, B., and White, W.: Solar influence on climate, Rev. Geophys., 48, 1–53, https://doi.org/10.1029/2009RG000282, 2010. a
Hocking, W. K., Fuller, B., and Vandepeer, B.: Realtime determination of meteor-related parameters utilizing modern digital technology, J. Atmos. Sol.-Terr. Phys., 69, 155–169, https://doi.org/10.1016/S1364-6826(00)00138-3, 2001. a
Hoffmann, P., Becker, E., Singer, W., and Placke, M.: Seasonal variation of mesospheric waves at northern middle and high latitudes, J. Atmos. Sol.-Terr. Phys., 72, 1068–1079, https://doi.org/10.1016/j.jastp.2010.07.002, 2010. a, b
Holdsworth, D. A., Tsutsumi, M., Reid, I. M., Nakamura, T., and Tsuda, T.: Interferometric meteor radar phase calibration using meteor echoes, Radio Sci., 39, 1–12, https://doi.org/10.1029/2003RS003026, 2004. a
Holme, R. and de Viron, O.: Charaterization and implications of intradecadal variations in length of day, Nature, 499, 202–204, https://doi.org/10.1038/nature12282, 2013. a
IERS: Earth orientation data, https://datacenter.iers.org/data/latestVersion/224_EOP_C04_14.62-NOW.IAU2000A224.txt, last access: 4 April 2017. a
Jacobi, C.: 6 year mean prevailing winds and tides measured by VHF meteor radar over Collm (51.3∘ N, 13.0∘ E), J. Atmos. Sol.-Terr. Phys., 78/79, 8–18, https://doi.org/10.1016/j.jastp.2011.04.010, 2012. a
Jacobi, C., Hoffmann, P., Liu, R., Q., Merzlyakov, E., G., Portnyagin, Yu., I., Manson, A., H., and Meek, C., E.: Long-term trends, their changes, and interannual variability of Northern Hemisphere midlatitude MLT winds, J. Atmos. Sol.-Terr. Phys., 75/76, 81–91, https://doi.org/10.1016/j.jastp.2011.03.016, 2011. a
Lambeck, K.: Progress in geophysical aspects of the rotation of the Earth, in: Ninth Geodesy and Solid Earth and Ocean Physics Research Conference, 1–11, 1978. a
Lee, J., N., Wu, D., L. R. A., and Fontenla, J.: Solar cycle variations in mesopheric carbon monoxide, J. Atmos. Sol.-Terr. Phys., 170, 21–34, https://doi.org/10.1016/j.jastp.2018.02.001, 2018. a, b
Livesey, N., J., Read, W., G., Lambert, A., Cofield, R., E., Cuddy, D., T., Froidevaux, L., Fuller, R., A., Jarnot, R., F., Jiang, J., H., Jiang, Y., B., Knosp, B., W., Kovalenko, L., J., Pickett, H., M., Pumphrey, H., C., Santee, M., L., Schwartz, M., J., Stek, P., C., Wagner, P., A., Waters, J., W., and Wu, D., L.: EOS MLS Version 2.2 Level 2 Data Quality and Description Document., Technical Report Version 2.2 D-33509, Jet Propulsion Lab., California Institute of Technology, Pasadena, California 91198-8099, 2007. a
Livesey, N., Santee, M. L., and Manney, G.: A Match-based approach to the estimation of polar stratospheric ozone loss using Aura Microwave Limb Sounder observations, Atmos. Chem. Phys., 15, 9945–9963, https://doi.org/10.5194/acp-15-9945-2015, 2015. a
Lübken, F.-J., Höffner, J., Kaifler, B., and Morris, R., J.: Winter/summer mesopause temperature transition at Davis (69∘ S) in 2011/2012, Geophys. Res. Lett., 41, 5233–5238, https://doi.org/10.1002/2014GL060777, 2014. a
Madden, R., A. and Speth, P.: Estimates of atmospheric angular momentum, friction, and mountain tourques during 1987–1988, J. Atmos. Sci., 52, 3681–3694, 1995. a, b
Manson, A. H., Meek, C. E., Hall, C. M., Nozawa, S., Mitchell, N. J., Pancheva, D., Singer, W., and Hoffmann, P.: Mesopause dynamics from the scandinavian triangle of radars within the PSMOS-DATAR Project, Ann. Geophys., 22, 367–386, https://doi.org/10.5194/angeo-22-367-2004, 2004. a
Marsh, D., R., Garcia, R., R., Kinnison, D., E., Boville, B., A., Sassi, F., Solomon, S., C., and Matthes, K.: Modeling the whole atmosphere response to solar cycle changes in radiative and geomagnetic forcing, J. Geophys. Res., 112, 1–20, https://doi.org/10.1029/2006JD008306, 2007. a, b, c
Matthias, V., Hoffmann, P., Manson, A., Meek, C., Stober, G., Brown, P., and Rapp, M.: The impact of planetary waves on the latitudinal displacement of sudden stratospheric warmings, Ann. Geophys., 31, 1397–1415, https://doi.org/10.5194/angeo-31-1397-2013, 2013. a
Matthias, V.: MLS/Aura Level 2 Geopotential Height V004, available at: https://mls.jpl.nasa.gov/, last access: 2 January 2018. a
Merzlyakov, E., G., Jacobi, C., Portnyagin, Yu., I., and Solovjova, T., V.: Structural changes in trend parameters of the MLT winds based on wind measurements at Obninsk (55∘ N, 37∘ E) and Collm (52∘ N, 15∘ E), J. Atmos. Sol.-Terr. Phys., 71, 1547–1557, https://doi.org/10.1016/j.jastp.2009.05.013, 2009. a
Munk, W. H. and MacDonald, G. J. F.: The Rotation of the Earth. A Geophysical Discussion, vol. 98, Cambridge University Press, https://doi.org/10.1017/S0016756800060726, 1961. a, b
Rosen, R. D. and Salstein, D.: Comment on “A Seasonal budget of the Earth's axial angular momentum” by Naito and Kikuchi, Geophys. Res. Lett., 18, 8033–8041, https://doi.org/10.1029/91GL02312, 1991. a
Rothacher, M.: Proceedings of the IERS Workshop on Combination Research and Global Geophysical Fluids, Bavarian Academy of Sciences, Munich, Germany, chap.: Towards a Rigorous Combination of Space Geodetic Techniques, International Earth Rotation and Reference Systems Service (IERS), IERS Technical Note, No. 30, Verlag des Bundesamtes für Kartographie und Geodäsie, ISBN 3-89888-877-0, 18–21, 2002. a
Schnell, D.: Quality aspects of short duration VLBI observations for UT1 determinations, Rheinischen Friedrich-Wilhelms-Universität zu Bonn, available at: http://hss.ulb.uni-bonn.de/2006/0918/0918.htm (last access: 22 November 2018), 2006. a
She, C., Krueger, D., A., and Yuan, T.: Long-term midlatitude mesopause region temperature trend deduced froom quarter century (1990–2014) NA lidar observations, Ann. Geophys., 33, 363–369, https://doi.org/10.5194/angeocom-33-363-2015, 2015. a
Stober, G., Jacobi, C., Matthias, V., Hoffmann, P., and Gerding, M.: Neutral air density variations during strong planetary wave activity in the mesopause region derived from meteor radar observations, J. Atmos. Sol.-Terr. Phys., 74, 55–63, https://doi.org/10.1016/j.jastp.2011.10.007, 2012. a, b, c, d, e, f, g
Stober, G., Matthias, V., Brown, P., and Chau, J. L.: Neutral density variation from specularmeteor echo observations spanning one solar cycle, Geophys. Res. Lett., 41, 6919–6925, https://doi.org/10.1002/2014GL061273, 2014. a
Stober, G., Matthias, V., Jacobi, C., Wilhelm, S., J., H., and Chau, J. L.: Exceptionally strong summer-like zonal wind reversal in the upper mesosphere during winter 2015/16, Ann. Geophys., 35, 711–720, https://doi.org/10.5194/angeo-35-711-2017, 2017. a, b
Tomé, A., R. and Miranda, P., M. A.: Piecewise linear fitting and trend changing points of climate parameters, Geophys. Res. Lett., 31, 1–4, https://doi.org/10.1029/2003GL019100, 2004. a
Trenberth, K., E. and Guillemot, C., J.: The total mass of the atmosphere, J. Geophys. Res.-Atmos., 99, 23079–23088, https://doi.org/10.1029/94JD02043, 1994. a, b
Trenberth, K., E. and Smith, L.: The Mass of the Atmosphere: A Constraint on Global Analyses, J. Clim., 18, 864–875, https://doi.org/10.1175/JCLI-3299.1, 2004. a, b
Volland, H.: Atmospheric effects on the Earth's rotation, Proceedings of a Workshop held at the Center for Interdisciplinary Research (ZiF), in: Earth's Rotation from Eons to Days, edited by: Brosche, P. and Suendermann, J., Springer-Verlag, 127–140, 1988. a, b, c
Vondrák, J. and Burša, M.: The rotation of the earth between 1955.5 and 1976.5, Stud. Geophys. Geod., 21, 107–117, https://doi.org/10.1007/BF01634821, 1977. a
Walterscheid, R., L.: Solar Cycle effects on the upper atmosphere: Implications for Satellite Drag, J. Spacecraft Rockets, 26, 439–444, https://doi.org/10.2514/3.26089, 1989. a
Waters, J. W., Froidevaux, L., Harwood, R. S., Jarnot, R. F., Pickett, H. M., Read, W. G., Siegel, P. H., Cofield, R. E., Filipiak, M. J., Flower, D. A., Holden, J. R., Lau, G. K., Livesey, N. J., Manney, G. L., Pumphrey, H. C., Santee, M. L., Wu, D. L., Cuddy, D. T., Lay, R. R., Loo, M. S., Perun, V. S., Schwartz, M. J., Stek, P. C., Thurstans, R. P., Boyles, M. A., Chandra, K. M., Chavez, M. C., Chen, G.-S., Chudasama, B. V., Dodge, R., Fuller, R. A., Girard, M. A., Jiang, J. H., Jiang, Y., Knosp, B. W., LaBelle, R. C., Lam, J. C., Lee, K. A., Miller, D., Oswald, J. E., Patel, N. C., Pukala, D. M., Quintero, O., Scaff, D. M., Snyder, W. V., Tope, M. C., Wagner, P. A., and Walch, M. J.: The Earth observing system microwave limb sounder (EOS MLS) on the aura Satellite, IEEE T. Geosci. Remote, 44, 1075–1092, https://doi.org/10.1109/TGRS.2006.873771, 2006. a


