the Creative Commons Attribution 4.0 License.
the Creative Commons Attribution 4.0 License.
 | 22 Jan 2018
Study of ionospheric disturbances over the China mid- and low-latitude region with GPS observations
Yafei Ning
Ionospheric disturbances constitute the main restriction factor for precise positioning techniques based on global positioning system (GPS) measurements. Simultaneously, GPS observations are widely used to determine ionospheric disturbances with total electron content (TEC). In this paper, we present an analysis of ionospheric disturbances over China mid- and low-latitude area before and during the magnetic storm on 17 March 2015. The work analyses the variation of magnetic indices, the amplitude of ionospheric irregularities observed with four arrays of GPS stations and the influence of geomagnetic storm on GPS positioning. The results show that significant ionospheric TEC disturbances occurred between 10:30 and 12:00 UT during the main phase of the large storm, and the static position reliability for this period are little affected by these disturbances. It is observed that the positive and negative disturbances propagate southward along the meridian from mid-latitude to low-latitude regions. The propagation velocity is from about 200 to 700 m s−1 and the amplitude of ionospheric disturbances is from about 0.2 to 0.9 TECU min−1. Moreover, the position dilution of precession (PDOP) with static precise point positioning (PPP) on storm and quiet days is 1.8 and 0.9 cm, respectively. This study is based on the analysis of ionospheric variability with differential rate of vertical TEC (DROVT) and impact of ionospheric storm on positioning with technique of GPS PPP.
Keywords. Ionosphere (ionospheric disturbances)
- Article
(2922 KB) - Full-text XML
- BibTeX
- EndNote


The development of precise positioning techniques and the increasing number of global positioning system (GPS) tracking stations make it possible to use GPS observation data in a wide range of applications. The most important of them for user groups is a precise positioning service. However, GPS systems are also a powerful tool in climatological research, especially used as a remote sensing technique for ionospheric monitoring which measures the temporal and spatial variations of total electron content (TEC) of the ionosphere. The ionospheric variations are related to the space climatological conditions. The coupling processes between magnetic field and solar wind can drive ionospheric disturbances which may affect satellite navigation and positioning. The irregular variation refers typically to the effects of travelling ionospheric disturbances (TIDs) associated with geomagnetic storms.
Over the past two decades, studies of ionospheric disturbances and its monitoring have caught the attention of the scientific community (Pi et al., 1997; Afraimovich et al., 1998; Tsugawa et al., 2004; Hernández-Pajares et al., 2006; Ding et al., 2007; Trichtchenko et al., 2007; Bergeot et al., 2011; Tang et al., 2016; Yao et al., 2017; Zolotukhina at al., 2017). Stankov et al. (2006) presented several case and statistical studies of ionospheric storm, which were clearly showing the generation and propagation of ionospheric disturbances. They also discussed that global navigation satellite system (GNSS) techniques were a powerful tool for monitoring ionospheric perturbations. Hernández-Pajares et al. (2011) provided ionospheric monitoring based on GNSS measurements and assessed TIDs, solar flares, ionospheric storms and scintillation. Habarulema et al. (2013) estimated the propagation characteristics of large-scale TIDs (LSTIDs) during geomagnetic storm, and showed that disturbances were mostly propagating nearly equatorward. Ding et al. (2014) comparatively investigated ionospheric disturbances over North America and China based on GPS dense regional observations. Sieradzki (2015) studied the monitoring of ionospheric irregularities oval at high northern latitudes and found that TEC fluctuations were significantly related with ionospheric storm. Borries et al. (2017) revealed additional information on the dynamics of TIDs over Europe during 2003 great storm and presented the complex interaction processes with analysing the source mechanisms for the observed TIDs. On the other hand, Bergeot et al. (2011) used GPS observations to investigate the influence of ionospheric disturbances induced by geomagnetic storm on kinematic GPS positioning. Wautelet and Warnant (2014) demonstrated climatological study of irregularities over European mid-latitude region and analysed occurrence rate of ionospheric irregularities associated with solar and geomagnetic activity. Sieradzki and Paziewski (2016) proposed the influence of ionospheric TEC fluctuations on rapid static positioning at high-latitudes.
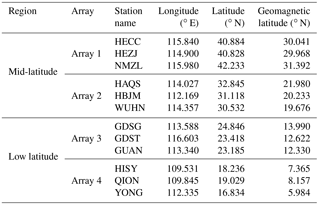
Table 1Geographic and geomagnetic coordinates of stations from GPS arrays.
For the research studies of the 2015 severe geomagnetic storm, Ramsingh et al. (2015) investigated the ionospheric disturbances related with the severe storm at equatorial and low-latitude and showed an interesting characteristic of TIDs with disturbance meridional wind surge and strong vertical drifts over Equator. Borries et al. (2016) studied perturbations over the European–African sector observed in TEC. They found storm-induced LSTIDs which were propagating towards the Equator and had large wave parameters. Nava et al. (2016) used different kinds of data and analysis techniques to obtain different features of ionospheric disturbance over the Asian, African, American, and Pacific sector. Heine at al. (2017) presented temporal and frequency study with GPS observations and demonstrated the occurrence of ionospheric disturbances in mid-latitudes with TEC maps and GPS TEC time series.
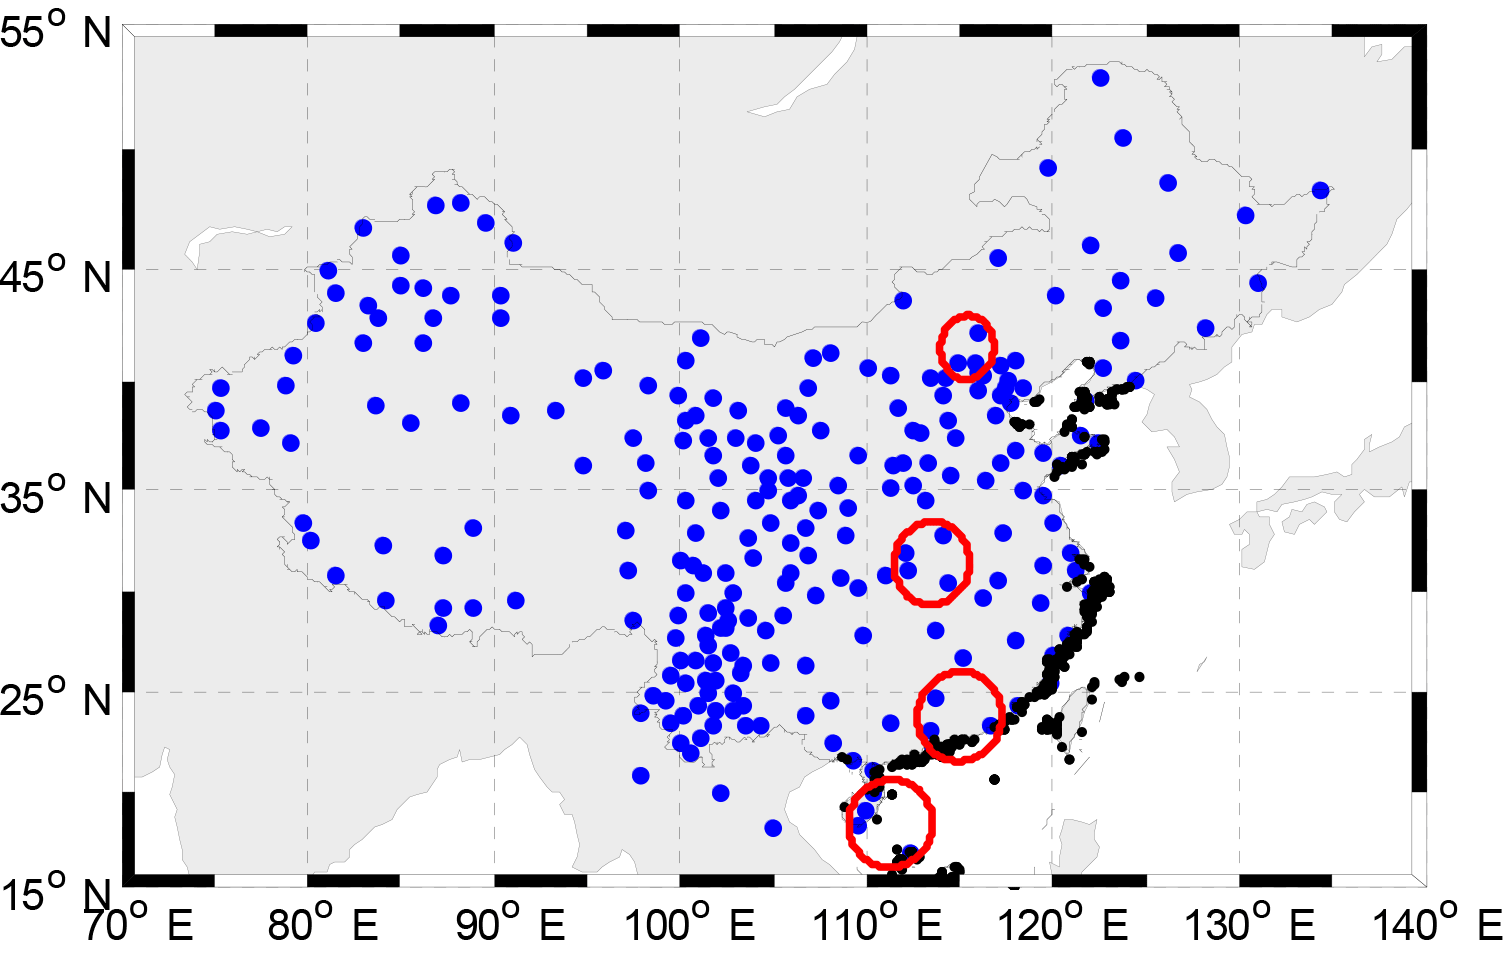
Figure 1Location of GPS receiver stations. The four red circles denote the given stations of four arrays which are Array 1 (HECC-HEZJ-NMZL), Array 2 (HAQS-HBJM-WUHN), Array 3 (GDSG-GDST-GUAN), and Array 4 (HISY-QION-YONG).
Previous studies have given the concept of investigating the state of the ionosphere using GPS measurements or the effect of ionospheric disturbances on GPS positioning. However, all these studies only focused on either a given type of disturbances or the influence of disturbances on GPS precise positioning. In this paper, we will use GPS observation data from the Crustal Movement Observation Network of China (CMONOC) to study the characteristics of disturbances and the influence of disturbances on GPS precise positioning in China. Simultaneously, the differential rate of vertical TEC (DROVT) and technique of GPS precise point positioning (PPP) is applied to detect ionospheric variability and analyse impact of ionospheric storm on positioning, respectively.
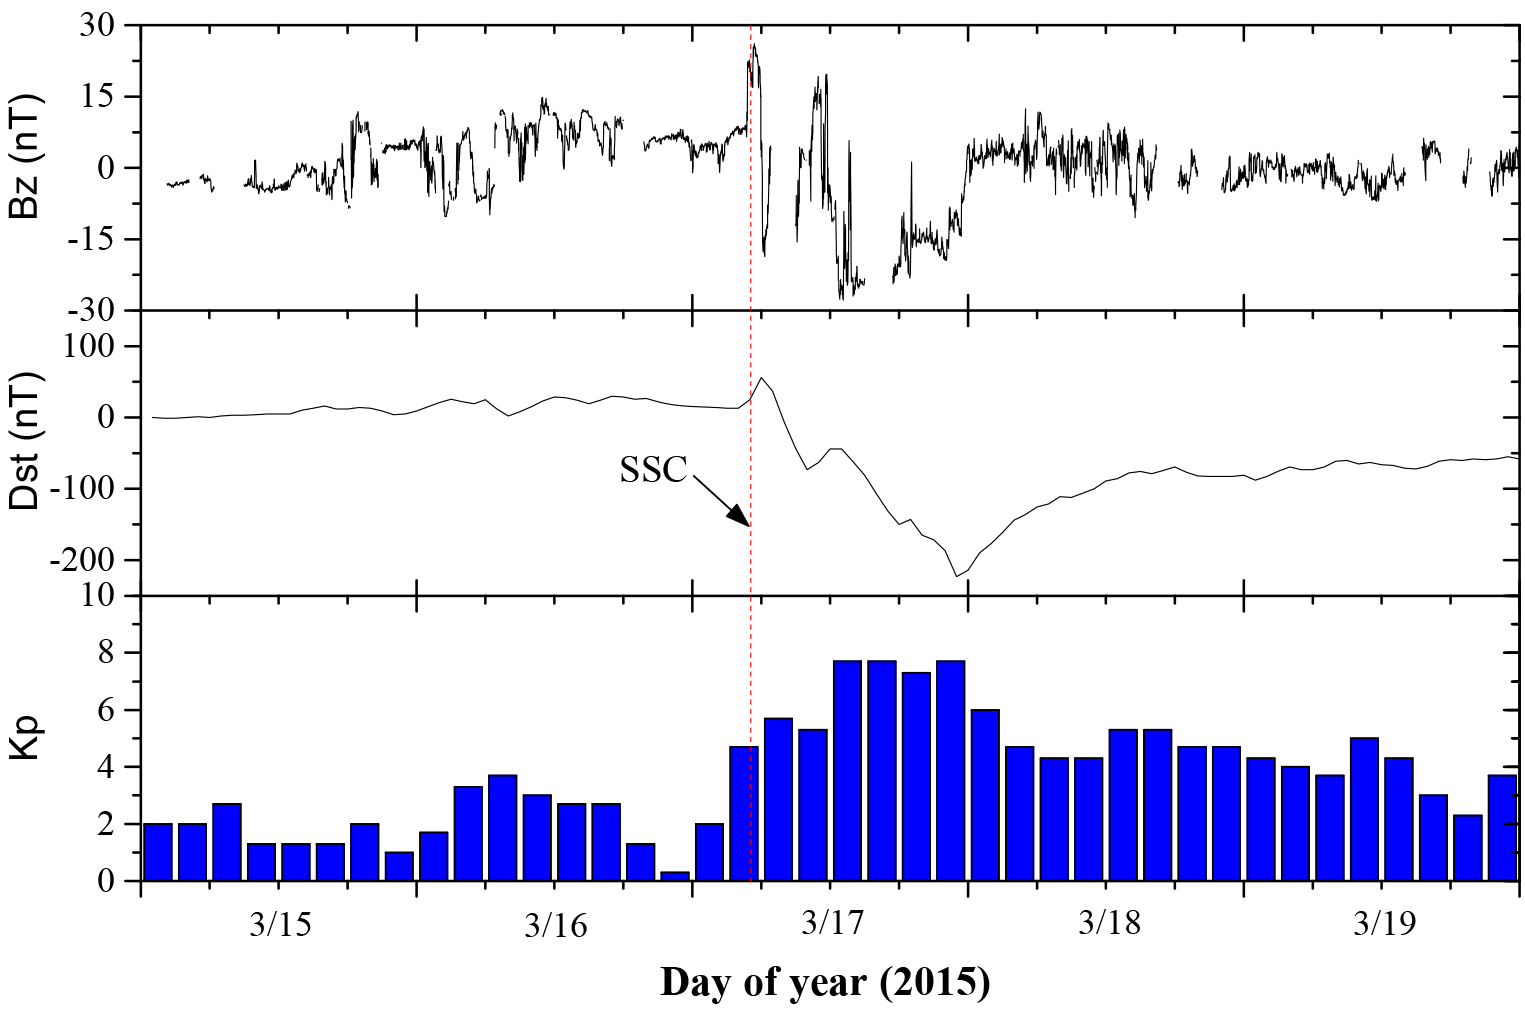
Figure 2Variations of geomagnetic conditions IMF Bz component, Dst index, and Kp index during 15–19 March 2015.
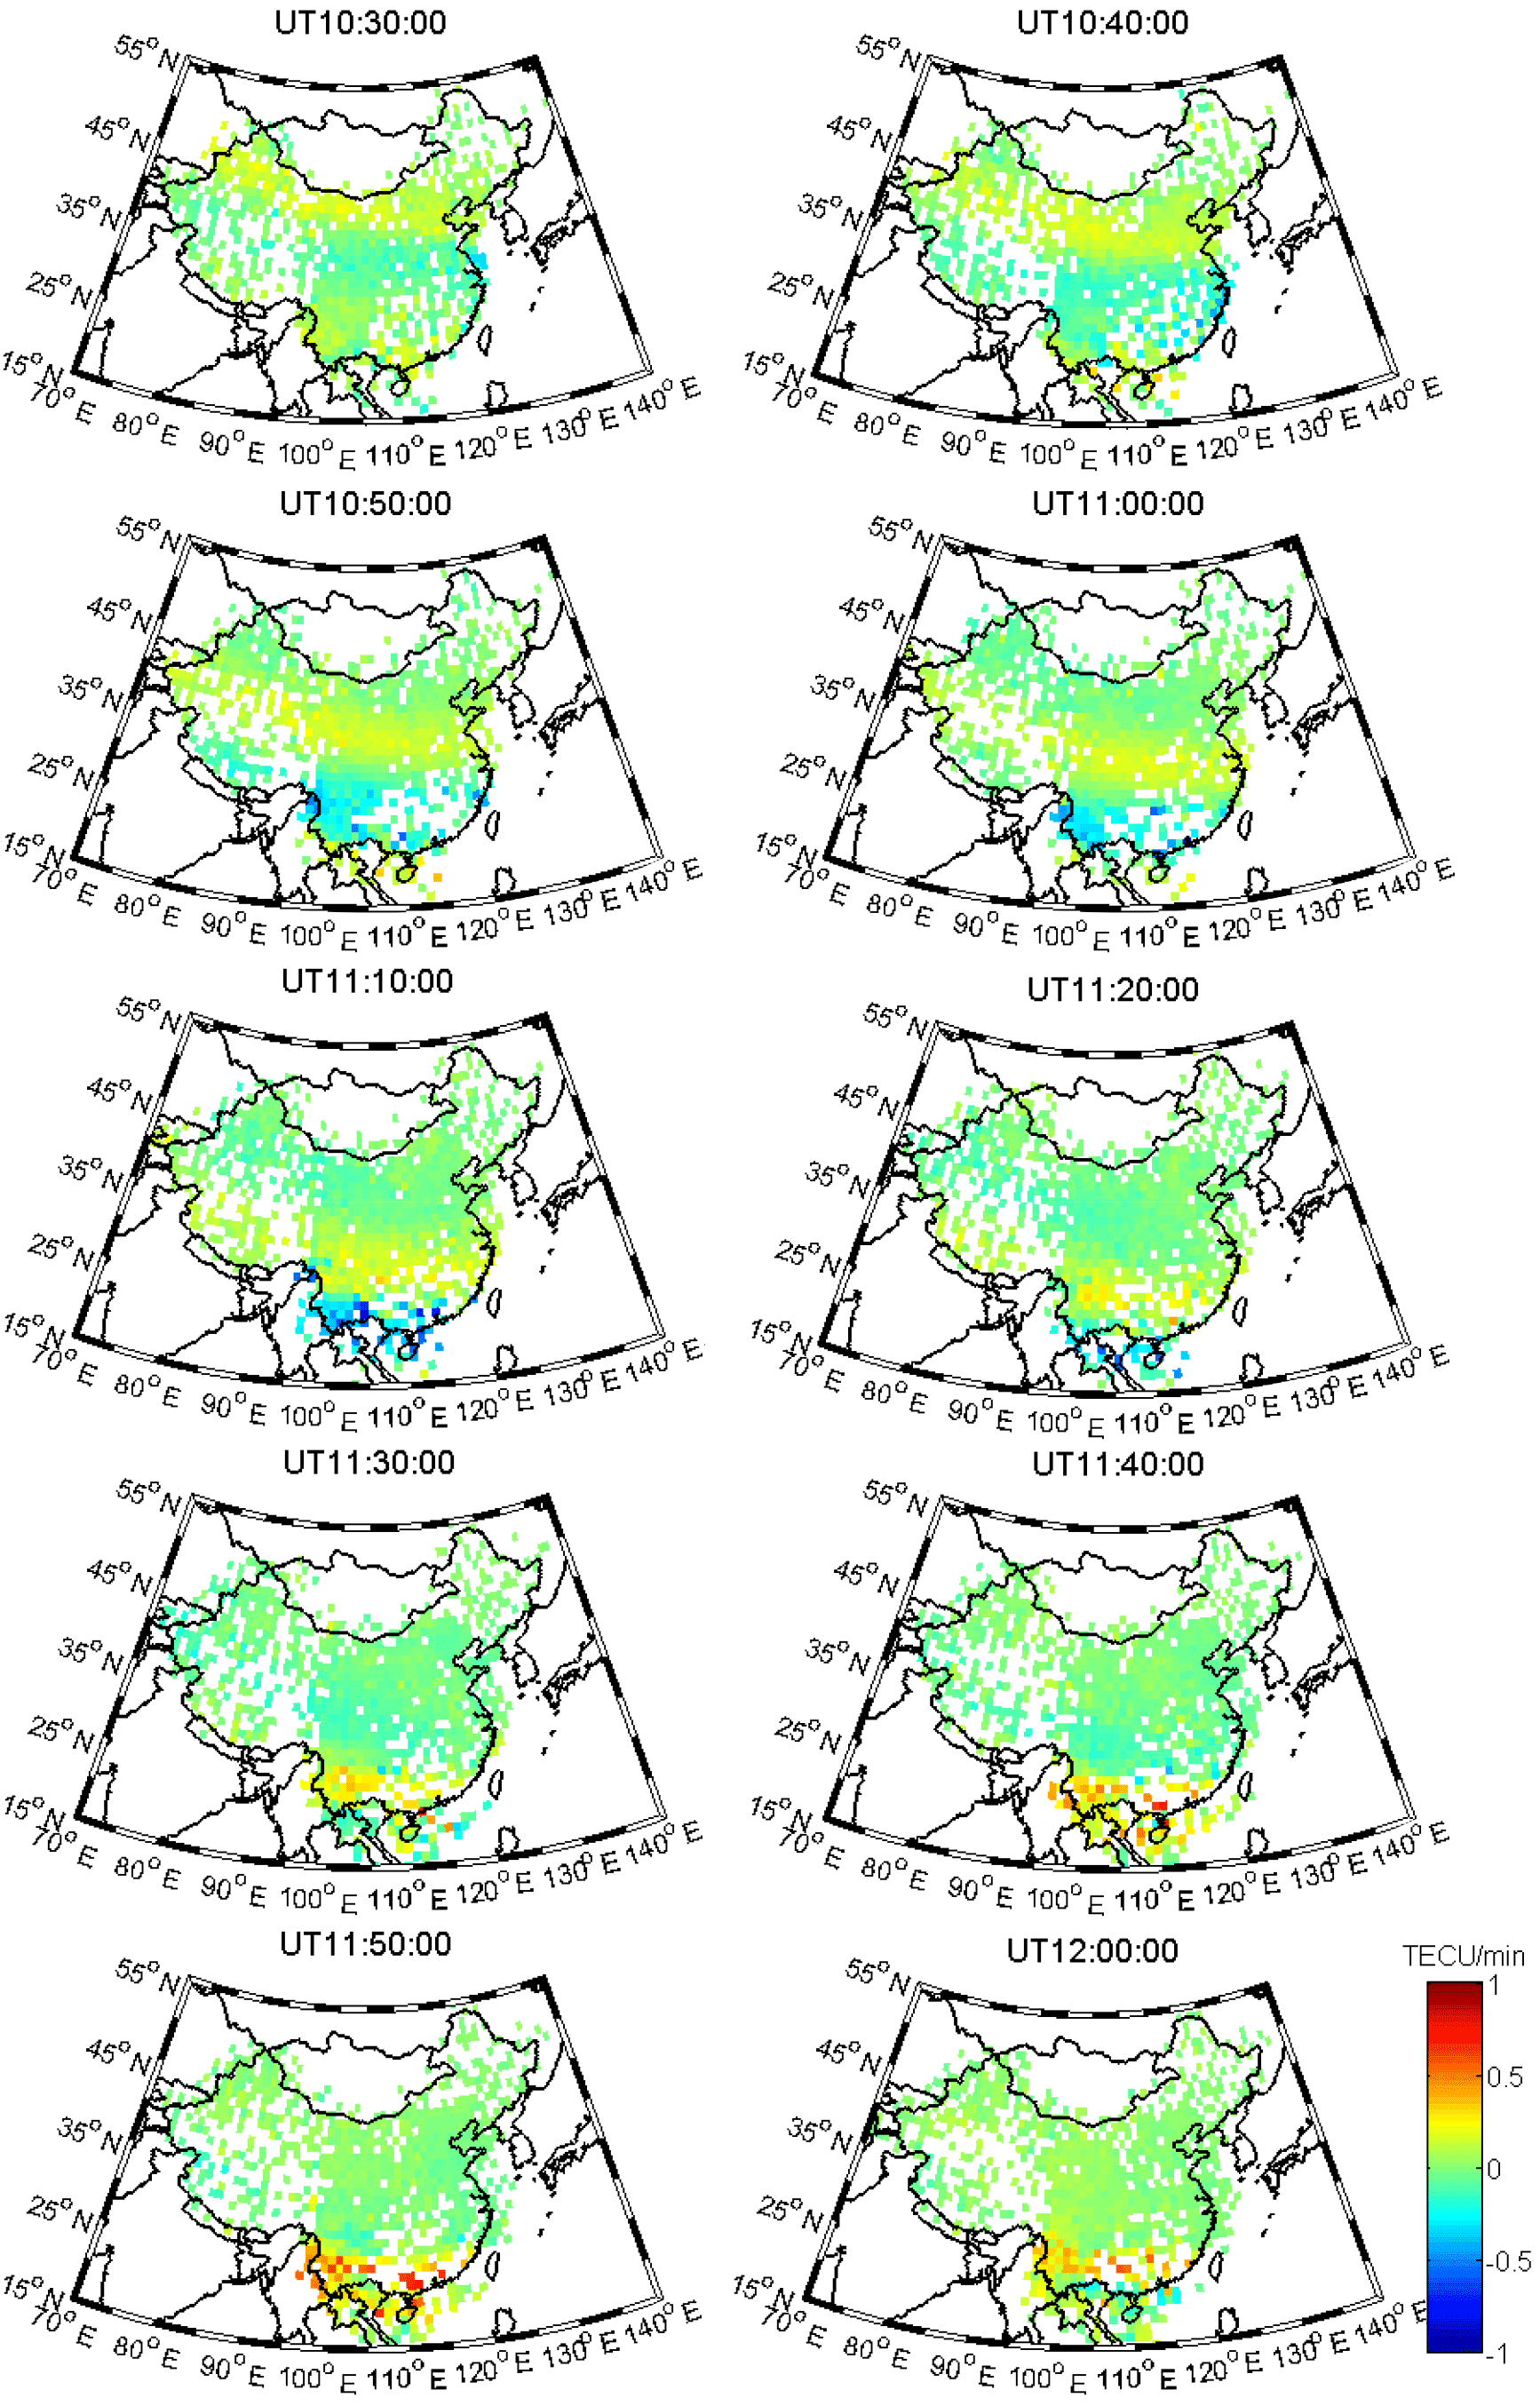
Figure 3Snapshots of DROVT maps at various time epochs from 10:30 to 12:00 UT on 17 March 2015.
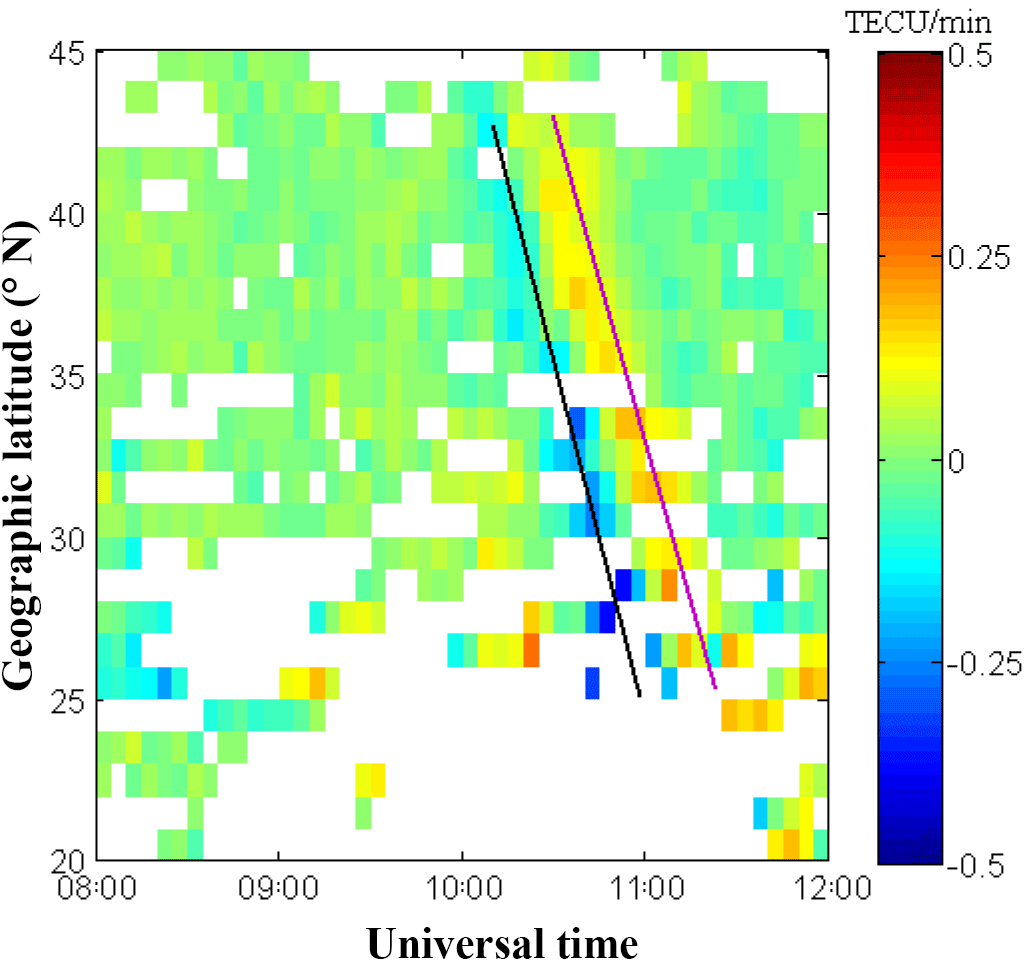
Figure 4Snapshots of DROVT maps at the longitude of 115∘ E from 08:00 to 12:00 UT on 17 March 2015.
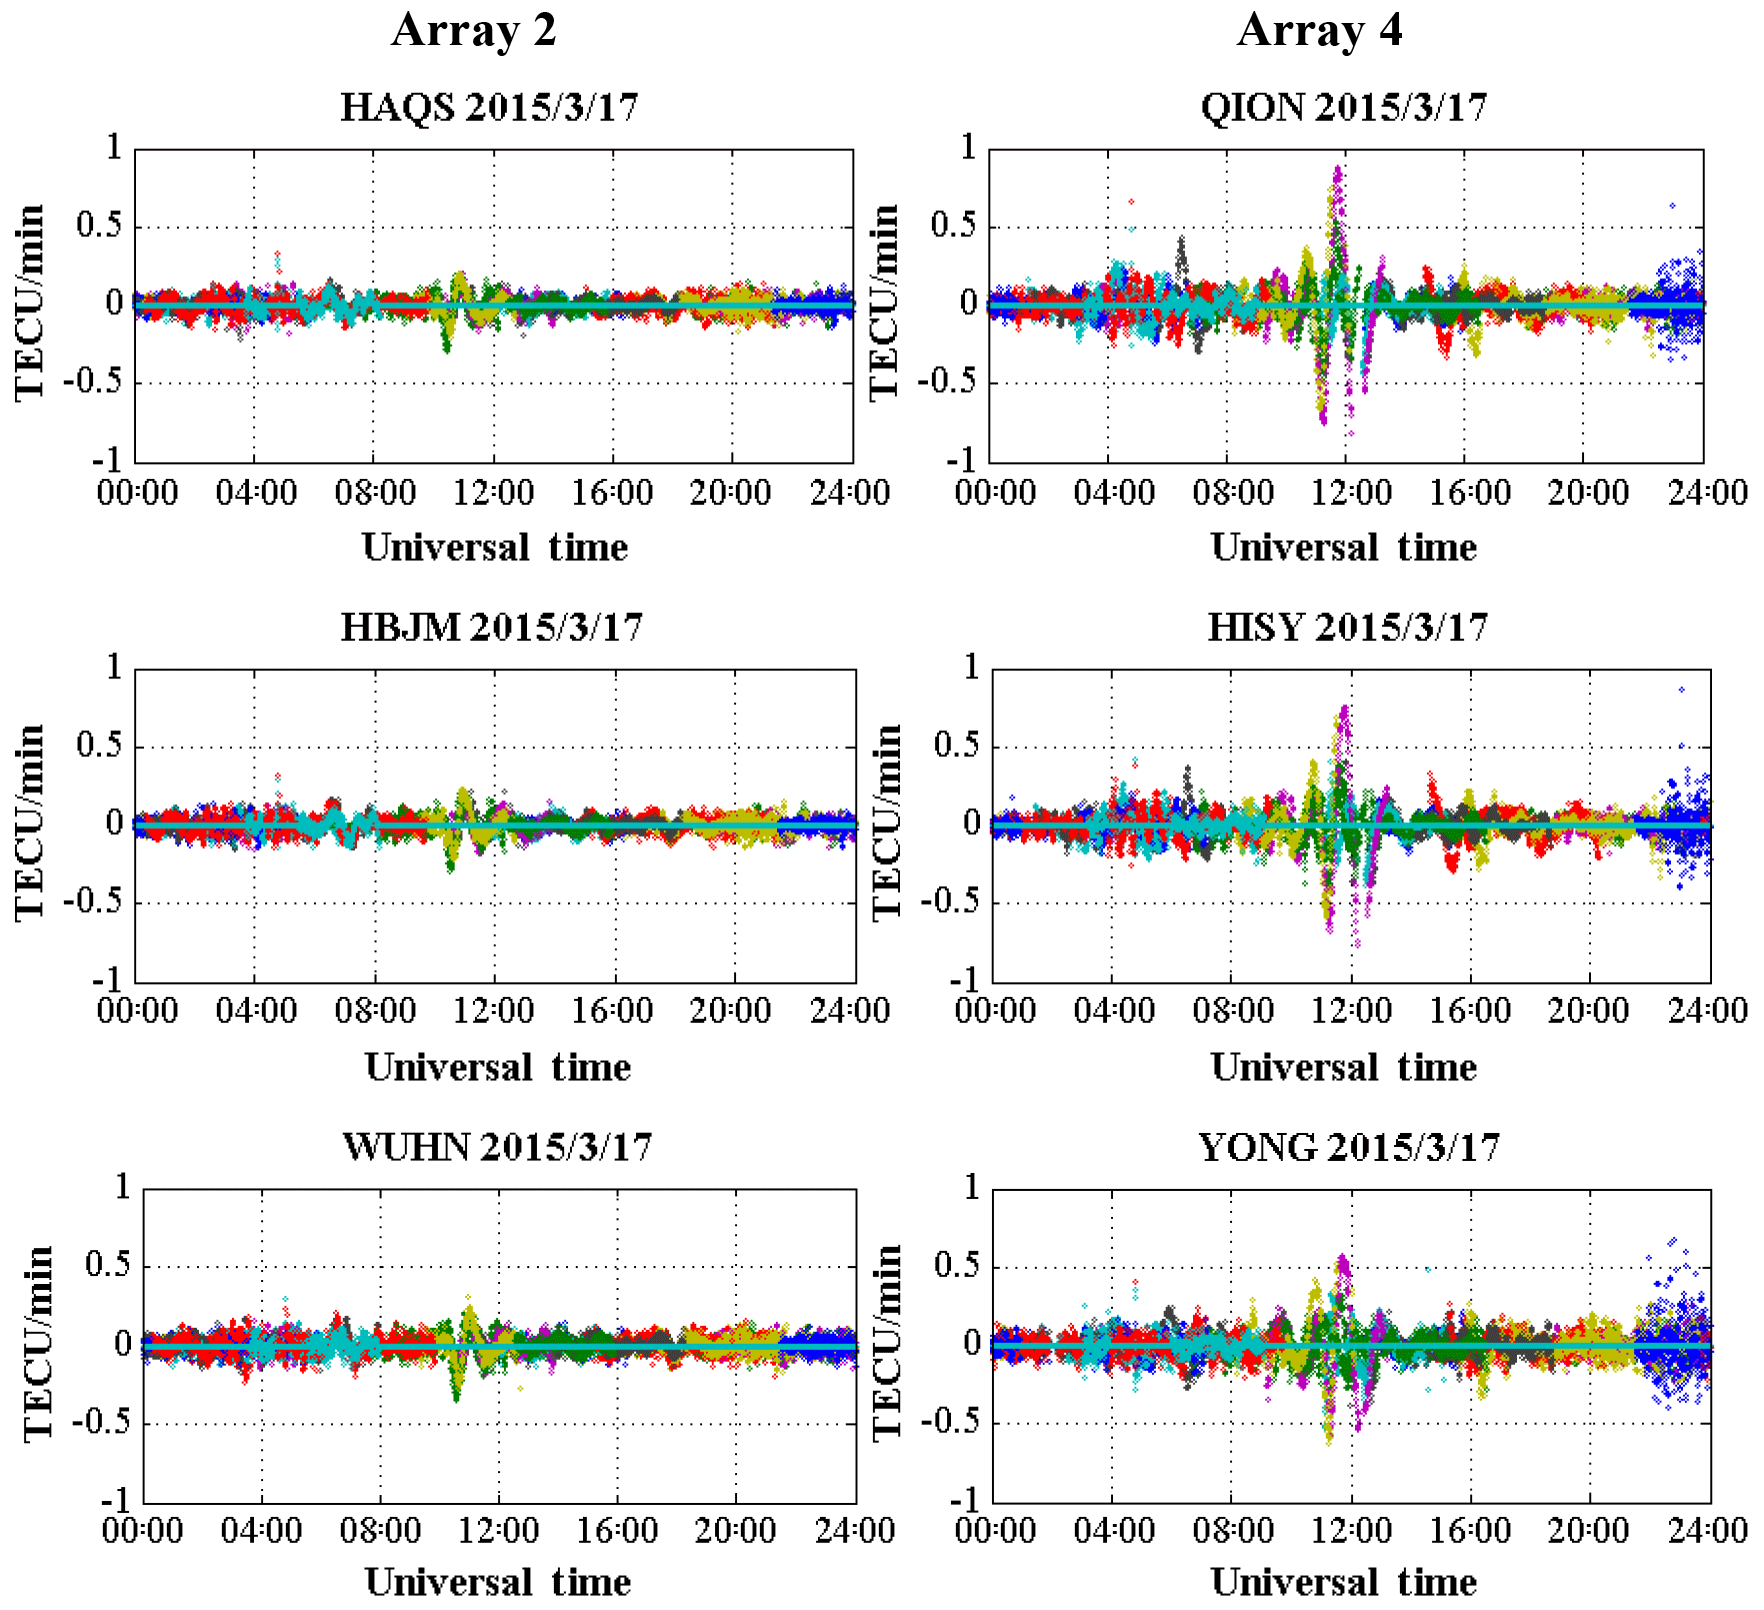
Figure 5Time series of DROVT obtained in GPS stations with Array 2 (HAQS-HBJM-WUHN) and Array 4 (HISY-QION-YONG) on 17 March 2015.

Figure 6Time series of DROVT from the PRN 19 satellite observed in GPS stations with Array 2 (HAQS-HBJM-WUHN) and Array 4 (HISY-QION-YONG) on 17 March 2015.
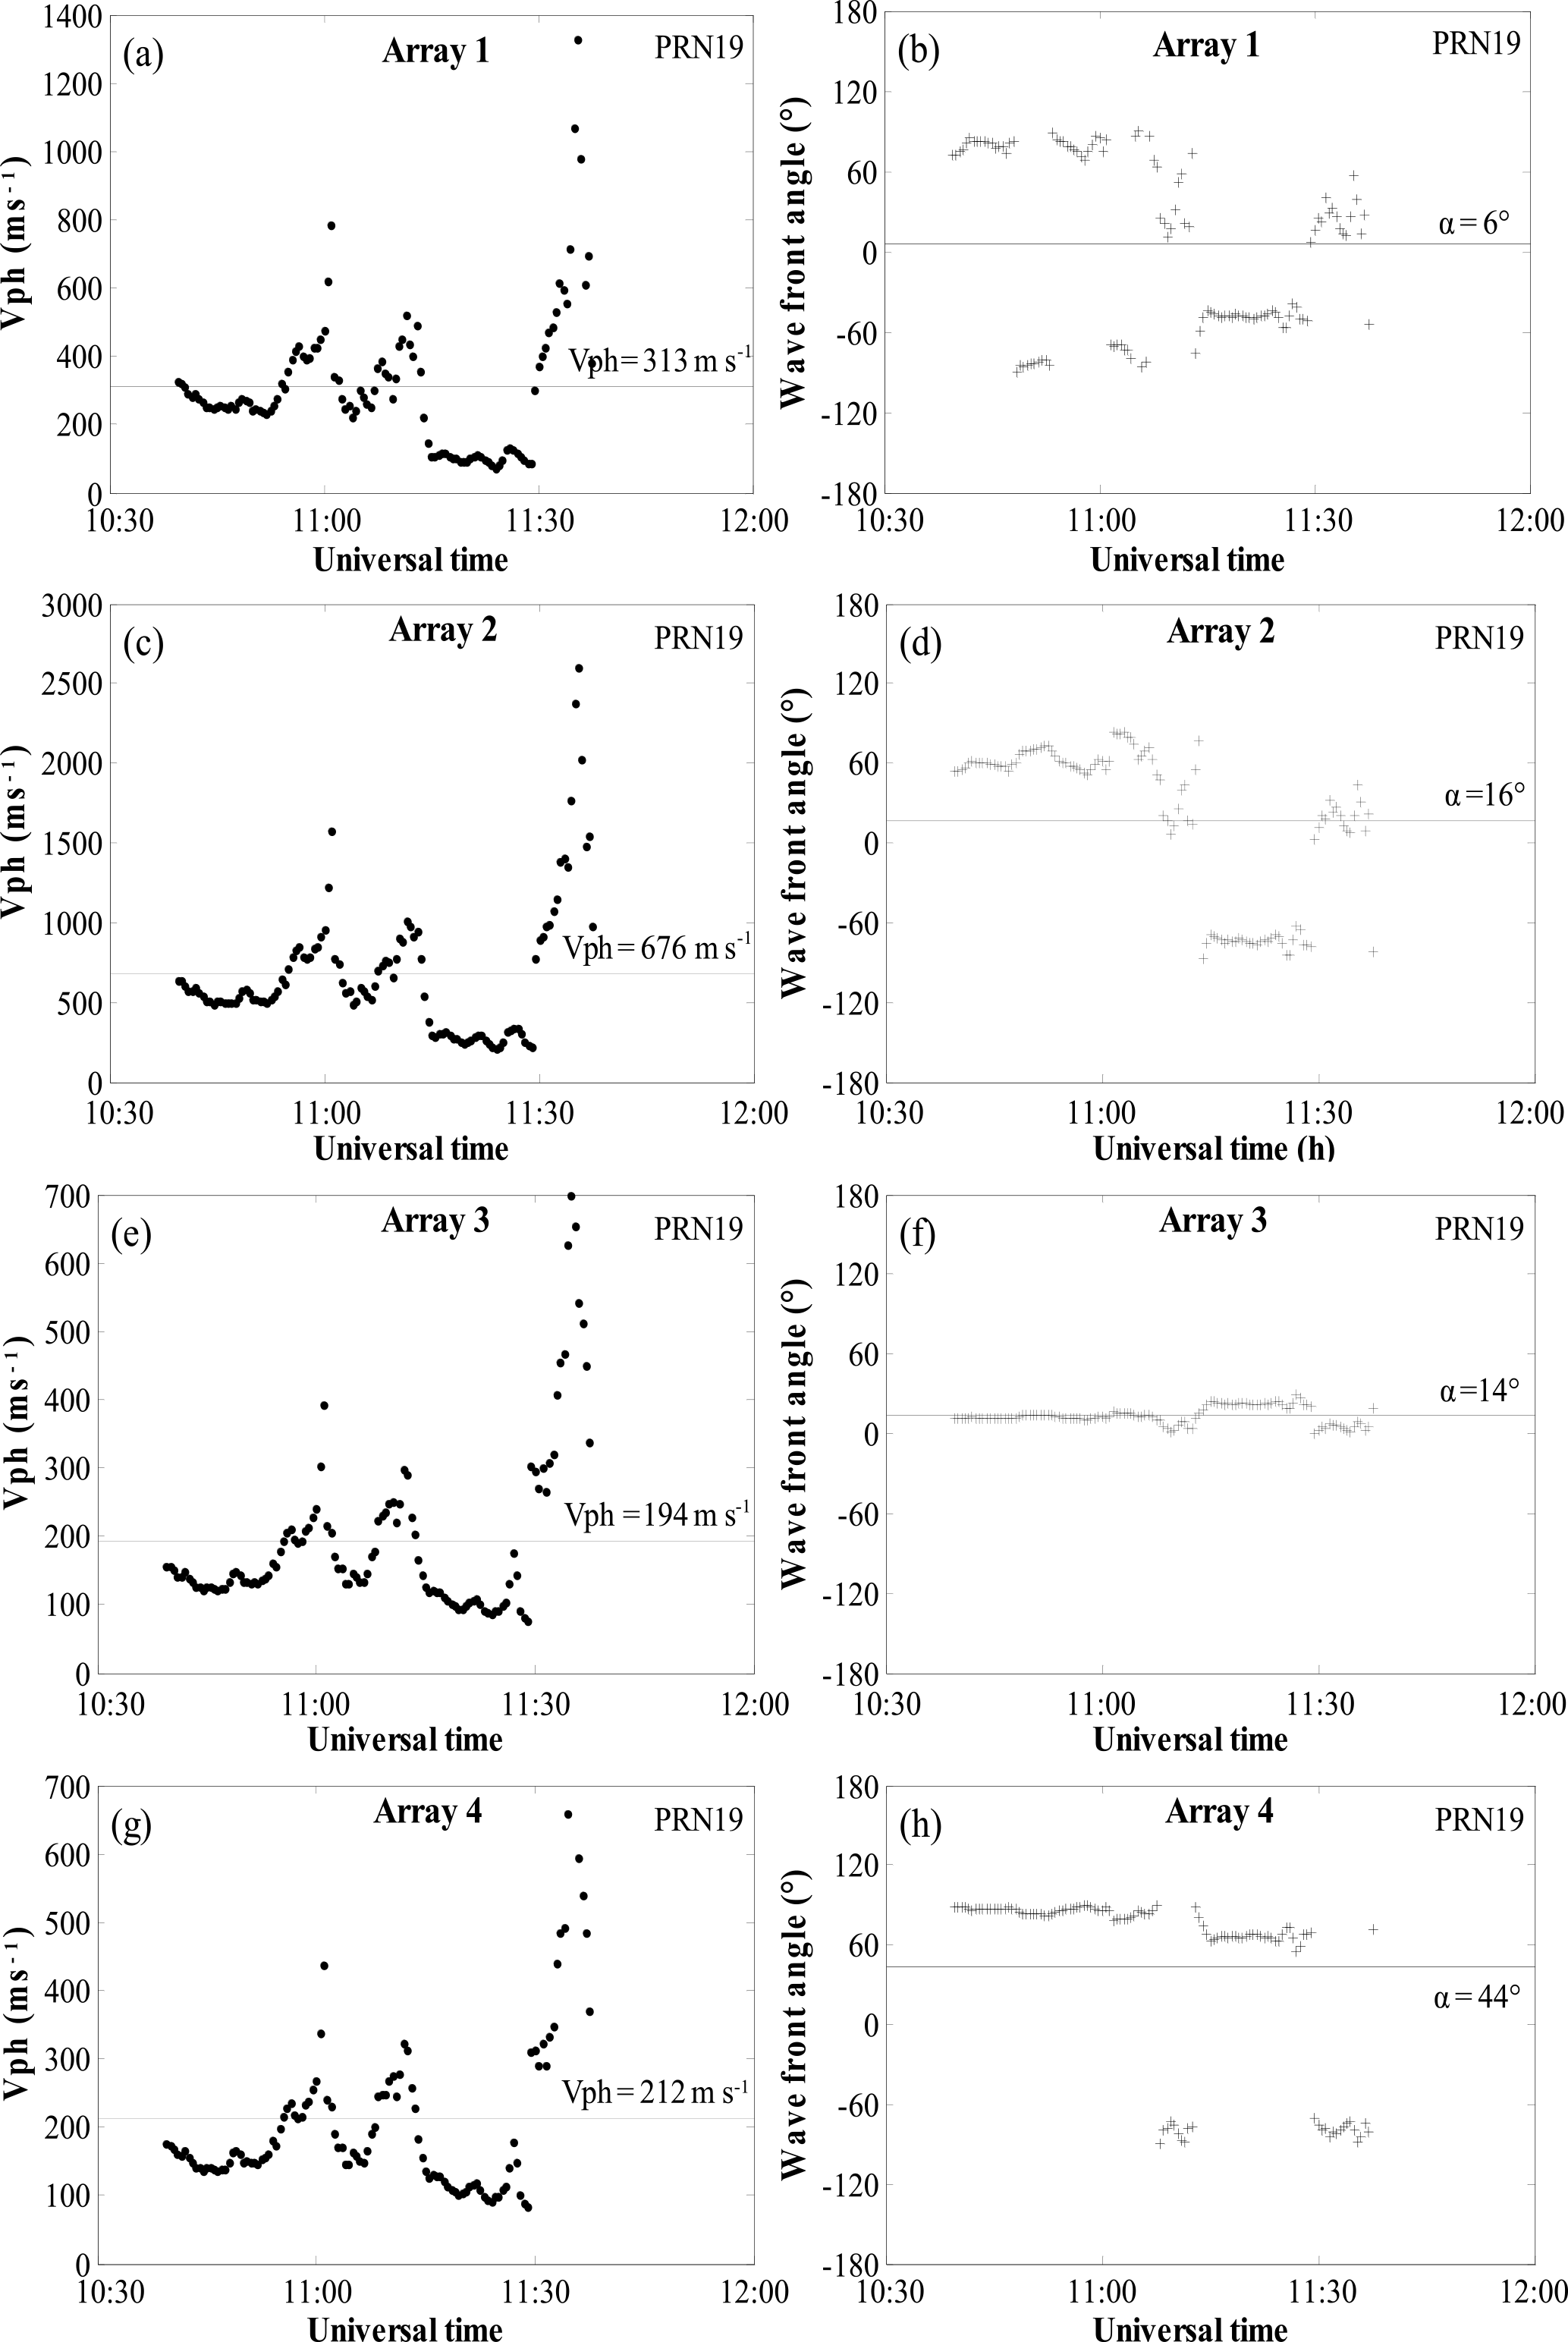
Figure 7The characteristics of ionospheric disturbances for PRN 19 satellite on 17 March 2015 for four GPS arrays.
In this paper, we make use of GPS observations provided by the CMONOC, consisting of about 250 stations, with a 30 s sampling rate to detect ionospheric disturbances over the China mid- and low-latitude region. As shown in Fig. 1, the blue dots denote the locations of GPS receiver stations. Coordinates of four GPS arrays (i.e. Array 1: HECC-HEZJ-NMZL; Array 2: HAQS-HBJM-WUHN; Array 3: GDSG-GDST-GUAN; Array 4: HISY-QION-YONG) located at the longitude of about 115∘ E are provided in Table 1. These arrays are used to estimate characteristics of ionospheric disturbances and analyse the effect of disturbances on positioning on 17 March 2015.
In the study of ionosphere based GPS, we use the variations of DROVT to determine ionospheric disturbances and the PPP technique to analyse the positioning variations with ionospheric disturbance. To obtain values of TEC, the differential phase and pseudorange values of L1 and L2 are used (Calais and Minster, 1995; Yuan, 2002; Yuan et al., 2015). We calculate ionospheric piercing point (IPP) of line of sight, assuming a thin layer of ionosphere at the height with maximum electron density of the F2 layer. Previous studies (Pi et al., 1997; Ma et al., 2006; Rungraengwajiake et al., 2015) have used the rate of TEC (ROT) as a measure of ionospheric disturbances to detect the presence of ionospheric irregularities. However, large fluctuations existed, which can mask small disturbances. In this paper, we propose the use of DROVT. The approach is more stable and can easily detect small ionospheric disturbances. To analyse the ionospheric disturbances, we can calculate the STEC change (differential STEC) between continuous epochs ti and ti−1, denoted ROT, which is expressed as
where ROVT is in TEC units (TECU) min−1 and zIPP is the satellite zenith distance. TEC is usually denoted in TEC units with 1 TECU = 1016 el m−2. The ROVT values are calculated for GPS data with an elevation cut-off angle of 30∘. Then, polynomials are fitted to the ROVT of different visible satellite data. The ROVT values which are ROVT0 form fitted polynomial functions act as background values. To extract variations in ionosphere, the background trend can be determined for each arc of satellites and then subtracted from the ROVT time series. It can be expressed as
where DROVT is the differential rate of vertical TEC. The method is used to retrieve specific characteristics of ionospheric disturbances.
PPP is a positioning technique with single receiver using undifferenced dual-frequency GPS code and phase observations to obtain high-precision station coordinates. A more detailed description of PPP has been given by Zumberge et al. (1997). The influences of ionospheric disturbances on GPS positioning at low, middle, and high latitudes have been examined by Moreno et al. (2011), Stankov and Jakowski (2007), and Sieradzki et al. (2016), respectively. To study how ionosphere disturbance affects the GPS position, we use the Bernese GNSS software developed by the Astronomical Institute of the University of Bern (AIUB) to calculate station coordinates.
Ionospheric disturbances are closely associated with active geomagnetic conditions (storms). A magnetic storm occurred on 17 March 2015 in the ionosphere–plasmasphere–magnetosphere system. Figure 2 shows various geomagnetic conditions highlighting the characteristics of the period from 15 to 19 March 2015. The sudden storm commencement (SSC) was recorded at about 04:45 UT on 17 March 2015. The Bz component turned southward around 06:05 UT and reached the value of −17 nT around 06:15 UT. At about 09:30 UT, the Bz component turned northward until about 12:00 UT. After 12:00 UT, the Bz component turned southward again and remained southward until about 24:00 UT. During the first period of southward Bz, the Dst index reached the minimum value of −73 nT at about 09:00 UT. During the second period of southward Bz, the Dst index reached the minimum value of −223 nT at about 23:00 UT. The Kp index was between 5 and 8 after the SSC and reached the maximum value of 8 from 12:00 to 24:00 UT. According to the geomagnetic conditions, we can determine that the storm of 17 March 2015 belongs to severe magnetic storm. The storm had a very long compression phase from about 04:45 to 06:15 UT. Thereafter, the main phase of this storm started.
Figure 3 shows snapshots of DROVT maps at various time epochs from 10:30 to 12:00 UT on 17 March 2015. It is observed that an obvious positive and negative ionospheric disturbances are observed between longitudes of about 80 and 130∘ E from 45 to 30∘ N, and between longitudes of about 100 and 115∘ E from 30 to 15∘ N. The positive disturbances occur from 10:30 to 12:00 UT, and the negative disturbances occur from 10:40 to 11:20 UT. Figure 4 shows the DROVT maps in time and latitude at the longitude of 115∘ E, with time from 08:00 to 12:00 UT and latitude from 20 to 45∘ N. The peaks and troughs are clearly seen along the purple and black lines, respectively, in this map. The disturbances propagate from high to low latitude and have positive and negative features; these are also seen from Fig. 3.
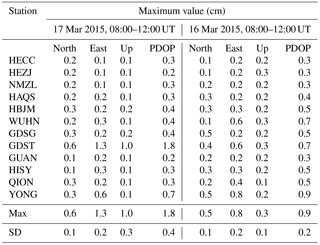
Table 2Maximum values of NEU components from 08:00 to 12:00 UT during a storm day of 17 March 2015 and a quiet day of 16 March 2015.
Also, we demonstrate two GPS arrays (Array 2: HAQS-HBJM-WUHN; Array 4: HISY-QION-YONG) in Fig. 5, which shows time series of different satellites DROVT. The six stations show obvious fluctuations from about 10:00 to 13:00 UT. The DROVT values of the three stations from Array 2 have an amplitude of about 0.2 TECU min−1 and those from Array 4 have an amplitude of about 0.9 TECU min−1. Figure 6 shows the time series of DROVT from the PRN 19 satellite observed in GPS stations with Array 2 (HAQS-HBJM-WUHN) and Array 4 (HISY-QION-YONG) on 17 March 2015. It can be seen that the six curves present a wavy shape and have phase differences. This indicates that the ionosphere at this time has a wave shape of a non-uniform structure. Due to the non-uniform wave movement of the ionosphere, we determine that there are fluctuations in the ionosphere at this time. In addition, Fig. 6 shows the crest and trough arrive at the station at higher latitudes first, indicating that the ionospheric disturbances propagate from high to low latitude. Storm-time behaviour of TEC (e.g. the ionospheric disturbances in general) depends on season, storm intensity, and storm time elapsed as shown by Stankov et al. (2010). Based on a superposed epoch analysis, consistent features in the storm-time behaviour have been revealed during different latitudes. During intense storms, the relative TEC deviations have showed generally stronger positive and negative phases.
Table 2 shows maximum values of the “north, east and up” (NEU) components from 08:00 to 12:00 UT during a storm day of 17 March 2015 and a quiet day of 16 March 2015. For the four arrays, the maximum values of the static PPP positioning reach 0.6, 1.3, and 1.0 cm in the NEU components, respectively, during the storm day. Meanwhile, the maximum values of the static PPP positioning reach 0.5, 0.8, and 0.3 cm in the NEU components, respectively, during the quiet day. The position dilution of precession (PDOP) on storm and quiet days is 1.8 and 0.9 cm, respectively. It can be seen that the effect of the ionospheric disturbances on elevation (“up” component) is slightly larger than those on horizontal position (“north” and “east” components).
Figure 7 shows the characteristics of ionospheric disturbances for PRN 19 satellite on 17 March 2015 for four GPS arrays. It demonstrates the characteristics of ionospheric disturbances using GPS observations, which fully take the satellite motion into account. In this paper, the propagation velocities are obtained through maximum entropy cross spectral analysis method (Ma et al., 1998). The average horizontal velocities are estimated as about 313, 676, 194, and 212 m s−1 in Fig. 7a, c, e, and g, respectively. The wave front angles are estimated as about 6, 16, 14, and 44∘ in Fig. 7b, d, f, and h, respectively. It is observed that the positive and negative disturbances propagate southward along the meridian from mid-latitude to low-latitude regions. In Figs. 3 and 4, the positive disturbances appear before than negative disturbances and last longer. The fluctuation velocity increases between 45 and 30∘ N, then decreases between 30 and 15∘ N with the reduction of latitude. The amplitudes of sector between the longitude of about 80 and 130∘ E from 45 to 30∘ N are smaller than those between the longitude of about 100 and 115∘ E from 30 to 15∘ N. However, the velocities of the former are greater than the latter. The disturbances mainly propagate to the south along the meridian as well as the wave front angles estimated in Fig. 7.
Fuller-Rowell et al. (1994) have explained that Joule heating at high latitudes raises the temperature of the upper thermosphere and ion drag drives high-velocity neutral winds. The heat source drives a global wind surge to propagate to low latitudes. Previous studies have reported the fact, validated by a number of observations, that a significant source of ionospheric disturbances and different storm-time phenomenon (e.g. TID propagation) is Joule heating at high latitudes (de Abreu et al., 2010; Nava et al., 2016; Yao et al., 2017). Due to the impact of magnetic storms of 17 March 2015, the ionosphere appeared characteristics of peaks and troughs. The characteristics present wavelike features at mid- and low-latitude from 10:30 to 12:00 UT. The results show that the disturbances propagate to low latitudes. To be exact, this disturbances propagate southwestward. Many previous studies showed that the propagation of TIDs was not always toward the Equator (Tsugawa et al., 2004; Song et al., 2012). In this paper, we note that the directions of the propagation are 6, 16, 14, and 44∘ southwest in Fig. 7.
In order to understand the characteristics of ionospheric disturbances and the influence of disturbances on GPS precise positioning, we have used GPS-based measurements of the DROVT and values of PPP from the CMONOC consisting of about 250 GPS stations over the China mid- and low-latitude region during the intense storm. We obtain two-dimensional maps of the DROVT fluctuations over China and show that the technique may be a useful research tool in periods of geomagnetic storm. During the main phase of the analysed geomagnetic storm of 17 March 2015, significant ionospheric disturbances are between 10:30 and 12:00 UT. The positive and negative disturbances propagate southward along the meridian from mid-latitude to low-latitude regions. The wave front is between the longitude of about 80 and 130∘ E from 45 to 30∘ N, and between the longitude of about 100 and 115∘ E from 30 to 15∘ N. The propagation velocity estimated is from about 200 to 700 m s−1 and the amplitude of ionospheric disturbances is from about 0.2 to 0.9 TECU min−1. In particular, the PDOP of the static PPP positioning on storm and quiet days is 1.8 and 0.9 cm, respectively. The standard deviation on storm and quiet days is 0.4 and 0.2 cm, respectively. The reliability of PPP solutions for static stations during the analysed period of the March 2015 storm has been found to be affected insignificantly.
The GPS data are provided by the CMONOC (http://neiscn.org/chinsoftdmds/ltwshujugongxinag/index.jhtml), through the GNSS Center at Wuhan University, China. The magnetic index data can be taken from NASA/GSFC (Goddard Space Flight Center) OMNI site (https://omniweb.gsfc.nasa.gov/form/dx1.html).
The authors declare that they have no conflict of interest.
The authors acknowledge the CMONOC for providing the GPS data via the GNSS
Center at Wuhan University and the Goddard Space Flight
Center for providing the magnetic index data. This
work was supported in part by the National Natural Science Fund of China
(NSFC) (grant no. 41504025, 41761089, 41231064, and 41674022), by the
Collaborative Precision Positioning Project Funded by the Ministry of
Science and Technology of China (grant no. 2016YFB0501900), by the China
Postdoctoral Science Foundation (CPSF) (grant no. 2015M582312), by the
Natural Science Foundation of Jiangxi Province (grant no. 20161BAB213087)
and by the Foundation of Jiangxi Educational Committee (grant no. GJJ160473).
The topical editor, Dalia Buresova, thanks two anonymous referees for help in evaluating this paper.
Afraimovich, E. L., Palamartchouk, K. S., and Perevalova, N. P.: GPS radio interferometry of travelling ionospheric disturbances, J. Atmos. Solar-Terr. Phy., 60, 1205–1223, 1998.
Bergeot, N., Bruyninx, C., Defraigne, P., Pireaux, S., Legrand, J., Pottiaux, E., and Baire, Q.: Impact of the Halloween 2003 ionospheric storm on kinematic GPS positioning in Europe, GPS Solut., 15, 171–180, https://doi.org/10.1007/s10291-010-0181-9, 2011.
Borries, C., Mahrous, A. M., Ellahouny, N. M., and Badeke, R.: Multiple ionospheric perturbations during the Saint Patrick's Day storm 2015 in the European-African sector, J. Geophys. Res., 121, 11333–11345, https://doi.org/10.1002/2016JA023178, 2016.
Borries, C., Jakowski, N., Kauristie, K., Amm, O., Mielich, J., and Kouba, D.: On the dynamics of large-scale traveling ionospheric disturbances over Europe on 20 November 2003, J. Geophys. Res., 122, 1199–1211, https://doi.org/10.1002/2016JA023050, 2017.
Calais, E. and Minster, J. B.: GPS detection of ionospheric perturbations following the January 17, 1994, Northridge Earthquake, Geophys. Res. Lett., 22, 1045–1048, 1995.
de Abreu, A. J., Fagundes, P. R., Sahai, Y., de Jesus, R., Bittencourt, J. A., Brunini, C., Gende, M., Pillat, V. G., Lima, W. L. C., Abalde, J. R., and Pimenta, A. A.: Hemispheric asymmetries in the ionospheric response observed in the American sector during an intense geomagnetic storm, J. Geophys. Res., 115, A12132, https://doi.org/10.1029/2010JA015661, 2010.
Ding, F., Wan, W., Ning, B., and Wang, M.: Large-scale traveling ionospheric disturbances observed by GPS total electron content during the magnetic storm of 29–30 October 2003, J. Geophys. Res., 112, A06309, https://doi.org/10.1029/2006JA012013, 2007.
Ding, F., Wan, W., Li, Q., Zhang, R., Song, Q., Ning, B., Liu, L., Zhao, B., and Xiong, B.: Comparative climatological study of large-scale traveling ionospheric disturbances over North America and China in 2011–2012, J. Geophys. Res., 119, 519–529, https://doi.org/10.1002/2013JA019523, 2014.
Fuller-Rowell, T. J., Codrescu, M. V., Moffett, R. J., and Quegan, S.: Response of the thermosphere and ionosphere to geomagnetic storms, J. Geophys. Res., 99, 3893–3914, 1994.
Habarulema, J. B., Katamzi, Z. T., and McKinnell, L.: Estimating the propagation characteristics of large scale travelling ionospheric disturbances using ground-based and satellite data, J. Geophys. Res., 118, 7768–7782, https://doi.org/10.1002/2013JA018997, 2013.
Heine, T. R. P., Moldwin, M. B., and Zou, S.: Small-scale structure of the midlatitude storm enhanced density plume during the 17 March 2015 St. Patrick's Day storm, J. Geophys. Res., 122, 3665–3677, https://doi.org/10.1002/2016JA022965, 2017.
Hernández-Pajares, M., Juan, J. M., and Sanz, J.: Medium-scale traveling ionospheric disturbances affecting GPS measurements: Spatial and temporal analysis, J. Geophys. Res., 111, A07S11, https://doi.org/10.1029/2005JA011474, 2006.
Hernández-Pajares, M., Juan, J. M., Sanz, J., Aragón-Àngel, À., García-Rigo, A., Salazar, D., and Escudero, M.: The ionosphere: effects, GPS modeling and the benefits for space geodetic techniques, J. Geodesy, 85, 887–907, https://doi.org/10.1007/s00190-011-0508-5, 2011.
Ma, G. and Maruyama, T.: A super bubble detected by dense GPS network at east Asian longitudes, Geophys. Res. Lett., 33, L21103, https://doi.org/10.1029/2006GL027512, 2006.
Ma, S. Y., Schlegel, K., and Xu, J. S.: Case studies of the propagation characteristics of auroral TIDS with EISCAT CP2 data using maximum entropy cross-spectral analysis, Ann. Geophys., 16, 161–167, 1998.
Moreno, B., Radicella, S., de Lacy, M. C., Herraiz, M., and Rodriguez-Caderot, G.: On the effects of the ionospheric disturbances on precise point positioning at equatorial latitudes, GPS Solut., 15, 381–390, https://doi.org/10.1007/s10291-010-0197-1, 2011.
Nava, B., Rodríguez-Zuluaga, J., Alazo-Cuartas, K., Kashcheyev, A., Migoya-Orué, Y., Radicella, S. M., Amory-Mazaudier, C., and Fleury, R.: Middle- and low-latitude ionosphere response to 2015 St. Patrick's Day geomagnetic storm, J. Geophys. Res., 121, 3421–3438, https://doi.org/10.1002/2015JA022299, 2016.
Pi, X., Mannucci, A. J., Lindqwister, U. J., and Ho, C. M.: Monitoring of global ionospheric irregularities using the worldwide GPS network, Geophys. Res. Let., 24, 2283–2286, 1997.
Ramsingh, Sripathi, S., Sreekumar, S., Banola, S., Emperumal, K., Tiwari, P., and Kumar, B. S.: Low-latitude ionosphere response to super geomagnetic storm of 17/18 March 2015: Results from a chain of ground-based observations over Indian sector, J. Geophys. Res., 120, 10864–10882, https://doi.org/10.1002/2015JA021509, 2015.
Rungraengwajiake, S., Supnithi, P., Saito, S., Siansawasdi, N., and Saekow, A.: Ionospheric delay gradient monitoring for GBAS by GPS stations near Suvarnabhumi airport, Thailand, Radio Sci., 50, 1076–1085, https://doi.org/10.1002/2015RS005738, 2015.
Sieradzki, R.: An analysis of selected aspects of irregularities oval monitoring using GNSS observations, J. Atmos. Sol.-Terr. Phys., 129, 87–98, https://doi.org/10.1016/j.jastp.2015.04.017, 2015.
Sieradzki, R. and Paziewski, J.: Study on reliable GNSS positioning with intense TEC fluctuations at high latitudes, GPS Solut., 20, 553–563, https://doi.org/10.1007/s10291-015-0466-0, 2016.
Song, Q., Ding, F., Wan, W., Ning, B., and Liu, L.: Global propagation features of large-scale traveling ionospheric disturbances during the magnetic storm of 7∼10 November 2004, Ann. Geophys., 30, 683–694, https://doi.org/10.5194/angeo-30-683-2012, 2012.
Stankov, S. M. and Jakowski. N.: Ionospheric effects on GNSS reference network integrity, J. Atmos. Sol.-Terr. Phys., 69, 485–499, https://doi.org/10.1016/j.jastp.2006.08.008, 2007.
Stankov, S. M., Jakowski, N., Tsybulya, K., and Wilken, V.: Monitoring the generation and propagation of ionospheric disturbances and effects on Global Navigation Satellite System positioning, Radio Sci., 41, RS6S09, https://doi.org/10.1029/2005RS003327, 2006.
Stankov, S. M., Stegen, K., and Warnant, R.: Seasonal variations of storm-time TEC at European middle latitudes, Adv. Space Res., 46, 1318–1325, https://doi.org/10.1016/j.asr.2010.07.017, 2010.
Tang, J., Yao, Y., Kong, J., and Zhang, L.: Large-scale traveling ionospheric disturbances using ionospheric imaging at storm time: A case study on 17 March 2013, J. Atmos. Sol.-Terr. Phys., 145, 12–30, https://doi.org/10.1016/j.jastp.2016.04.006, 2016.
Trichtchenko, L., Zhukov, A., van der Linden, R., Stankov, S. M., Jakowski, N., Stanisławska, I., Juchnikowski, G., Wilkinson, P., Patterson, G., and Thomson, A. W. P.: November 2004 space weather events: Real-time observations and forecasts, Adv. Space Res., 5, S06001, https://doi.org/10.1029/2006SW000281, 2007.
Tsugawa, T., Saito, A., and Otsuka, Y.: A statistical study of large-scale traveling ionospheric disturbances using the GPS network in Japan, J. Geophys. Res., 109, A06302, https://doi.org/10.1029/2003JA010302, 2004.
Wautelet, G. and Warnant, R.: Climatological study of ionospheric irregularities over the European mid-latitude sector with GPS, J. Geodesy, 88, 223–240, https://doi.org/10.1007/s00190-013-0678-4, 2014.
Yao, Y., Liu, L., Kong, J., and Zhai, C.: Analysis of the global ionospheric disturbances of the March 2015 great storm, J. Geophys. Res., 121, 12157–12170, https://doi.org/10.1002/2016JA023352, 2017.
Yuan, Y.: Theory and method research of GPS-based ionospheric monitoring and delay correction, Institute of Geodesy and Geophysics, CAS, Wuhan, 2002.
Yuan, Y., Li, Z., Wang, N., Zhang, B., Li, H., Li, M., Huo, X., and Ou, J.: Monitoring the ionosphere based on the Crustal Movement Observation Network of China, Geodesy Geodyn., 6, 73–80, https://doi.org/10.1016/j.geog.2015.01.004, 2015.
Zolotukhina, N., Polekh, N., Kurkin, V., Rogov, D., Romanova, E., and Chelpanov, M.: Ionospheric effects of St. Patrick's storm over Asian Russia: 17–19 March 2015, J. Geophys. Res., 122, 2484–2504, https://doi.org/10.1002/2016JA023180, 2017.
Zumberge, J. F., Heflin, M. B., Jefferson, D. C., Watkins, M. M., and Webb, F. H.: Precise point positioning for the efficient and robust analysis of GPS data from large networks, J. Geophys. Res., 102, 5005–5017, 1997.