the Creative Commons Attribution 4.0 License.
the Creative Commons Attribution 4.0 License.
 | 24 May 2018
Statistical analysis of mirror mode waves in sheath regions driven by interplanetary coronal mass ejection
Matti M. Ala-Lahti
Emilia K. J. Kilpua
Andrew P. Dimmock
Adnane Osmane
Tuija Pulkkinen
Jan Souček
We present a comprehensive statistical analysis of mirror mode waves and the properties of their plasma surroundings in sheath regions driven by interplanetary coronal mass ejection (ICME). We have constructed a semi-automated method to identify mirror modes from the magnetic field data. We analyze 91 ICME sheath regions from January 1997 to April 2015 using data from the Wind spacecraft. The results imply that similarly to planetary magnetosheaths, mirror modes are also common structures in ICME sheaths. However, they occur almost exclusively as dip-like structures and in mirror stable plasma. We observe mirror modes throughout the sheath, from the bow shock to the ICME leading edge, but their amplitudes are largest closest to the shock. We also find that the shock strength (measured by Alfvén Mach number) is the most important parameter in controlling the occurrence of mirror modes. Our findings suggest that in ICME sheaths the dominant source of free energy for mirror mode generation is the shock compression. We also suggest that mirror modes that are found deeper in the sheath are remnants from earlier times of the sheath evolution, generated also in the vicinity of the shock.
Keywords. Interplanetary physics (plasma waves and turbulence; solar wind plasma) – space plasma physics (waves and instabilities)
- Article
(1671 KB) - Full-text XML
-
Supplement
(390 KB) - BibTeX
- EndNote


Mirror mode (MM) waves generated by the mirror instability arise from the antiphase, low-frequency fluctuations of the magnetic field and plasma density when a sufficient temperature anisotropy is present in the plasma. Assuming cold electrons and bi-Maxwellian ions, the criterion for mirror unstable plasma is
where Cm is the mirror instability threshold value and β⟂ and β∥ express the ratios of perpendicular and parallel thermal pressure to magnetic pressure (Hasegawa, 1969). MM waves are linearly polarized structures that appear as sharp increases and decreases in the magnetic field data (peaks and dips). They are frequently observed in heliospheric plasma, in particular in different sheath structures. They are the most widely studied in the planetary magnetosheaths (e.g., Tsurutani et al., 1982; Hellinger et al., 2003; Soucek et al., 2008, 2015; Volwerk et al., 2008; Génot et al., 2009b; Herčík et al., 2013; Schmid et al., 2014; Volwerk et al., 2016), but also found in cometosheaths (e.g., Russell et al., 1991; Glassmeier et al., 1993; Tsurutani et al., 1999; Schmid et al., 2014), in the heliosheath (e.g., Liu et al., 2007; Génot, 2008; Tsurutani et al., 2011a) and ahead of the dipolarization front (Wang et al., 2016). MMs are also studied in the solar wind (e.g., Hellinger et al., 2006, 2017; Bale et al., 2009; Russell et al., 2009), behind interplanetary shocks (Russell et al., 2009) and in addition in interplanetary coronal mass ejections (ICMEs; Siu-Tapia et al., 2015).
However, to our knowledge, there are only a few studies on MMs in the sheath regions of ICMEs (Liu et al., 2006; Kilpua et al., 2017). ICMEs are interplanetary counterparts of coronal mass ejections (CMEs), large-scale eruptions of plasma and magnetic flux that are ejected from the Sun on a regular basis. The speed of an ICME often exceeds the magnetosonic speed in the solar wind frame, and a shock wave and a sheath form upstream of the ICME. A large fraction of ICMEs expand as they propagate away from the Sun, primarily due to the decrease in the total solar wind pressure (e.g., Démoulin and Dasso, 2009). Observations show that the expansion is still significant at the orbit of the Earth (e.g., Klein and Burlaga, 1982; Kilpua et al., 2017) and ceases at about 10–15 AU (e.g., von Steiger and Richardson, 2006, and references therein). In addition, due to the small deflection speed, the solar wind plasma accumulates along the face of the body of the propagating ICME over long distances (Siscoe and Odstrcil, 2008). As a consequence, ICME-driven sheaths contain layers of plasma and magnetic field that have accumulated at different times and from different sources. ICME-driven sheaths are of great interest for solar–terrestrial studies as they are strong drivers of geomagnetic activity (e.g., Tsurutani et al., 1988; Huttunen et al., 2002; Huttunen and Koskinen, 2004; Siscoe et al., 2007; Kilpua et al., 2017, see also Echer et al., 2011; Oliveira and Raeder, 2014; Lugaz et al., 2016), and their shocks have a key role in the acceleration of solar energetic particles (e.g., Reames, 1999; Manchester et al., 2005). Similarly to planetary magnetosheaths (e.g., Soucek et al., 2008; Osmane et al., 2015), MM waves may have large-scale effects on ICME sheaths.
Studies of planetary magnetosheaths have shown that peak-like MMs occur in mirror unstable plasma, whereas dip-like MMs are observed in both mirror stable and unstable plasma (e.g., Soucek et al., 2008; Califano et al., 2008; Génot et al., 2009a). Furthermore, in 2-D hybrid simulations, dip-like MMs were formed in low β plasma, whereas peak-like structures were generated in high β plasma (Shoji et al., 2012). Both MM types are observed near the instability threshold (Cm≃0.5, see Eq. 1), whereas peak-like MMs become dominant when the instability threshold is clearly exceeded (Cm ≳ 1). The cases where MMs occur in mirror stable plasma may be remnants of MMs that were generated earlier in time, when the mirror instability threshold was exceeded (e.g., Winterhalter et al., 1994; Zhang et al., 2009). The peak-like MMs are proposed to form by the nonlinear saturation of mirror instability and dissipate rapidly in mirror stable plasma, while the dynamic evolution of pre-existing large amplitude plasma perturbations generate dip-like MMs that can also exist in the plasma below the mirror instability threshold (Kuznetsov et al., 2007, see also Califano et al., 2008).
One of the key questions related to MMs is the source of free energy for generation of these waves. In planetary magnetosheaths, two primary mechanism have been identified to produce temperature anisotropy: the quasi-perpendicular shock compression, which heats the ions perpendicular to the magnetic field, and magnetic field line draping, which happens near the magnetopause as the field lines drape around the magnetic obstacle (e.g., Tátrallyay and Erdős, 2002, 2005). The shock compression has been argued to be a source of free energy that generates peak-like MMs and likely both sources need to be available in order to generate the largest amplitude MMs (Tsurutani et al., 2011b). In the heliosheath and cometosheaths, the ion pickup process is also identified as a free energy source (e.g., Tsurutani et al., 1999, 2011a, b; Schmid et al., 2014).
In the magnetosheath of the Earth, the occurrence of mirror peaks is highest in the central magnetosheath, whereas mirror dips occur most frequently in the flank magnetosheath and close to the magnetopause (e.g., Soucek et al., 2015). MMs also occur more frequently when the Alfvén Mach number (MA) upstream of the bow shock is large (e.g., Soucek et al., 2015), and when the shock is quasi-perpendicular (e.g., Génot et al., 2009b; Hoilijoki et al., 2016). However, MMs have typically larger amplitudes behind quasi-parallel shocks (Génot et al., 2009b). In addition, while also isolated MMs exist (Winterhalter et al., 1994; Zhang et al., 2008), most MMs in planetary magnetosheaths occur as sequences of peaks or dips, so called MM trains (Tsurutani et al., 2011b).
The previous studies on MMs in ICME-driven sheath regions are either case studies or they have investigated only general plasma and magnetic field conditions that favor generation of MMs. For example, Liu et al. (2006) found signatures of MMs (anticorrelated fluctuations in the density and magnetic field magnitude, enhanced temperature anisotropy and high plasma beta) in front of an ICME, which was identified as a magnetic cloud. In addition, the authors used a superposed epoch analysis to investigate how the occurrence of MMs depends on the ICME properties. They discovered MM favoring conditions in the sheath regions of magnetic clouds (i.e., a subset of ICME featuring enhanced magnetic field, smooth rotation of the magnetic field direction and low plasma beta; e.g., Burlaga et al., 1981) and ICMEs with preceding shocks, whereas ICMEs without magnetic cloud structures and preceding shocks lacked these features.
In this paper, we conduct the first extensive statistical analysis of MMs in 91 ICME-driven sheath regions detected by the Wind spacecraft. We develop a semi-automated method to detect MMs in the magnetic field data. This method can also be directly extended to find MMs in other environments, e.g., in planetary magnetosheaths. Using the identified MMs, we study their occurrence and properties, including duration, amplitude and whether MMs tend to occur as isolated or as trains. The mirror instability threshold condition is also investigated. In particular, we study the dependence of MM occurrence and properties on the fractional distance from the leading ICME shock to the ICME leading edge, and on the shock strength and configuration (quasi-parallel and quasi-perpendicular). We also discuss the dominant sources of free energy for MM generation in ICME-driven sheath regions, and how our results compare with the results in planetary magnetosheaths.
The paper is organized as follows: in Sect. 2, we introduce the used data sets and describe the methods used to identify MMs in ICME-driven sheath plasma data. Section 3 presents the statistical results of MM occurrence frequency and MM properties. Finally, we discuss results and conclusions in Sect. 4.
2.1 Data sets
We examine 91 ICME-driven sheath regions as listed by Palmerio et al. (2016). The sheaths were observed between January 1997 and April 2015. In our statistical analysis, we investigate measurements from the Wind spacecraft launched in November 1994 to a halo orbit around the L1 Lagrangian point with the exception of a complex trajectory between 1999 and 2004. We use magnetic field data with 3 s time resolution from the Wind Magnetic Fields Investigation (MFI) instrument (Lepping et al., 1995), and the proton number density (np) and proton thermal speed data, both parallel (v∥) and perpendicular (v⟂) to the magnetic field, from the Wind Solar Wind Experiment (SWE) instrument (Ogilvie et al., 1995). The data are obtained from the NASA Goddard Space Flight Center Coordinated Data Analysis Web (CDAWeb, http://cdaweb.gsfc.nasa.gov/, last access: November 2017).
To study the sheath plasma, we compute β∥ and β⟂ defined as , where μ0 is the vacuum permeability, kB is the Boltzmann constant and B is the magnitude of the magnetic field. Temperatures and are computed from the thermal speed data as , where mp is the proton mass.
To characterize the shocks preceding the sheaths, we use the Alfvén Mach number (MA) and the shock angle (θBn) given by the Heliospheric Shock Database (http://ipshocks.fi/, last access: November 2017), developed and maintained at the University of Helsinki. If the database did not include the shock parameters determined by the Wind spacecraft data (e.g., due to data gaps around the shock) and the corresponding shock was identified by the ACE spacecraft (located also at L1), the shock parameters from ACE were used. In our event set, there were only four such cases.
2.2 Mirror mode (MM) identification
To identify MMs, it is important to know their expected timescales in the region of interest. The timescale of MMs in the solar wind at 0.72 AU is reported to vary from a few seconds up to 40 s (Zhang et al., 2009). Similar durations are also reported in the magnetosheath of the Earth (Soucek et al., 2008). We therefore expect the MMs to have similar durations in ICME-driven sheath regions. The 3 s magnetic field data from the Wind MFI instrument should thus have sufficient resolution to detect most MMs.
Previous studies have mostly utilized linear polarization and compression of MM waves when identifying these structures (e.g., Tátrallyay and Erdős, 2005; Soucek et al., 2008; Dimmock et al., 2015; Osmane et al., 2015). In practice, these studies have computed both the maximum variance direction of the magnetic field vector (Bm; Sonnerup and Cahill, 1967) and its direction with respect to the average magnetic field direction , where the subscripts 1, 2 and 3 denote the components of the magnetic field vector, by applying the minimum variance analysis (MVA). Furthermore, the eigenvalues of the magnetic variance matrix are compared to each other to ensure that Bm is well defined.
When determining whether MMs occur in ICME-driven sheaths, we investigate every 1 min data interval that has no missing data points. Because the magnetic field data have 3 s time resolution, two successive intervals may overlap by 57 s with each other. Similarly to Soucek et al. (2008), Dimmock et al. (2015) and Osmane et al. (2015), we use the MVA to calculate the eigenvalues of the maximum (λmax), intermediate (λint) and minimum (λmin) variance directions and the angle (θbm) between Bm and b0. We also require that , and for an interval to pass the MVA test. Overlapping intervals that pass the MVA test are combined into one wider interval.
To identify individual MMs, we investigate the minima and maxima in the magnetic field data of the combined intervals that have passed the MVA test by applying methods used by Zhang et al. (2008, 2009). The standard deviation (δ) is computed as , where are the data points of the magnetic field magnitudes during the interval and is their average. Skewness (S) is defined as , where , and the variance σ=δ2. Skewness describes the asymmetry of a distribution and is positive for intervals with peaks and negative for intervals with dips (see e.g., Osmane et al., 2015).
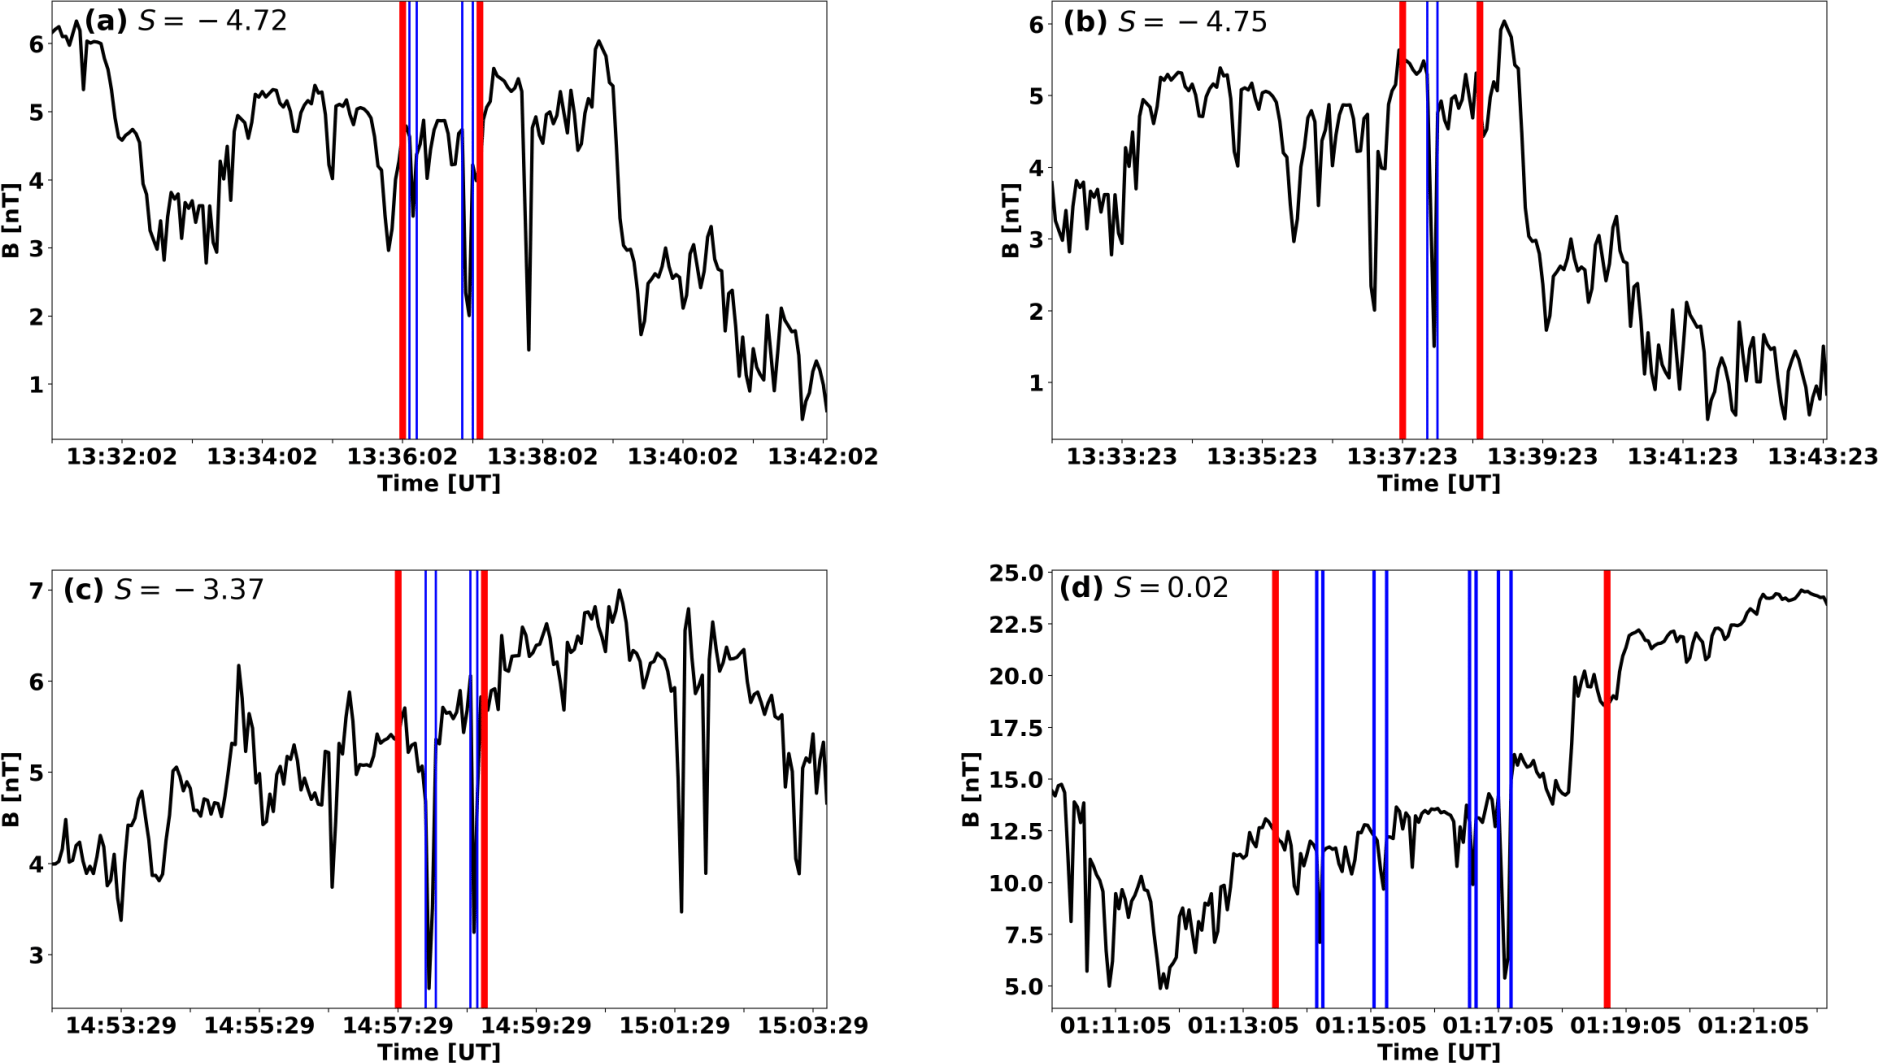
Figure 1Examples of individual mirror modes (MMs) in ICME-driven sheath regions. The shock preceding the ICME passed the Wind spacecraft at 11:10 UT on 16 April 1999 (a–c) and at 18:30 UT on 29 May 2003 (d). The investigated intervals are bounded by the red vertical lines and the detected MMs are the structures limited by the blue vertical lines. The skewness (S) of the investigated interval is given in each panel. The angular changes in the magnetic field direction over the MM structures (from left to right) are (a) 1.1 and 2.7∘, (b) 2.3∘, (c) 6.7 and 4.4∘, and (d) 6.1, 3.2, 1.7 and 4.5∘.
We define a MM as a structure through which the magnetic field direction changes less than 10∘ (Tsurutani et al., 2011b). Similarly to Zhang et al. (2008, 2009), the start and end of each MM structure are defined as the nearest points of the magnetic field minimum or maximum that satisfy the requirements and B>1.25 BMIN when a minimum is studied, and and B<0.75 BMAX when a maximum is studied. If a structure contains more than two minima or maxima, it is rejected. The angular change is calculated as the directional change of the magnetic field vector between these edges. Minima and maxima satisfying these conditions are called dips and peaks. Figure 1a–c show examples of MM structures that were identified by the above-mentioned selection criteria.
The skewness of the interval is compared to the number of detected dips and peaks. The interval is considered to contain dip (peak)-like MMs if the number of dips (peaks) exceeds the number of peaks (dips) and the skewness has a negative (positive) value. If the value of skewness contradicts with the number of detected dips and peaks, one can pose a question whether MMs occur in the interval.
In ICME-driven sheaths, the magnetic field magnitude may vary strongly thus affecting the value of skewness. Figure 1d shows an example, where dip-like MMs are identified and the skewness is positive. In addition, in some cases the magnetic field data can include series with both peak and dip-like MMs. These series may contain, for example, a peak-like mode that has the maximum close to the surrounding average field magnitude, located between two dip-like MMs with the edges in the minima of the dips. To distinguish whether the series contains dip- or peak-like MMs and to detect MMs also in similar conditions as in Fig. 1d, we compare the value of the skewness in the above-described manner.
The identified MMs are classified as singles and trains. If a studied interval contains more than one MM, it is considered a train of MMs. In addition, the absolute (A) and relative (AR) amplitudes of every identified MM are calculated as and , where η is the sum of the magnetic field magnitudes of the left and right edges of the structure, i.e., and Bdip∕peak is the magnetic field minimum or maximum of the structure depending on which one is being studied.
Here we define the threshold value of the mirror instability as given by Eq. (1), i.e., (see Sect. 1), where the positive values of Cm refer to mirror unstable plasma. We compute Cm for every data point in the sheath region, and in the surroundings of each detected MM using plasma beta averages within 150 s from the extreme magnetic field magnitude of the MM.
As discussed in Sect. 1, the source of free energy may be different in different parts of a sheath. In addition, ICME-driven sheaths at 1 AU have typically developed over the several days it takes for an ICME to travel from the Sun to the Earth orbit. Similarly to Palmerio et al. (2016), we divide the ICME-driven sheaths into sub-regions – near-shock, mid-sheath and near leading edge (near-LE) regions – using a fractional distance parameter (F) that gives the relative location in a sheath with values between zero (at the shock) and one (at the leading edge of the ICME ejecta).
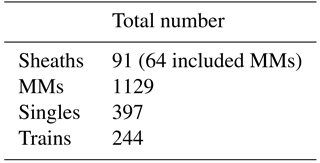
Table 1Statistics of mirror mode (MM) occurrence and the number of single MMs and MM trains.
3.1 Mirror mode (MM) occurrence frequency
In total, 1129 MM structures were identified using the scheme described in Sect. 2. We found MMs within 64 of the total 91 ICME-driven sheath regions. Thus, 70 % of the sheaths contained MMs, while about one-third of the sheaths lacked MMs completely (see Table 1). Practically all identified MMs (1080, 96 %) were dip-like.
The pie diagrams in Fig. 2 show how the identified MMs were distributed to singles and trains (left), and the distribution of the number of MMs in trains (right). The total number of events is shown in parentheses. The diagram on the left indicates that the majority of MMs occurred in trains (65 %). However, the diagram on the right reveals that 38 % of the trains had only two MMs, i.e., 60 % of all identified MMs in this study were singles or trains of two MMs. Only 14 % of the trains had more than seven MMs. The largest number of MMs in a train was 27 and we checked that data gaps do not have significant impact on this.
Figure 3 shows the frequency histogram of ICME-driven sheaths as a function of the total number of MMs identified within the sheath. The majority of sheaths had only a few MMs and the distribution is skewed to the right with a long tail. The top row in Table 2 gives the median, the lower and upper quartiles (LQ and UQ) of the number of MMs in those 64 sheaths that had MMs, and the percentage of the sheaths that had more MMs than the UQ. The median number of MMs in a sheath is 9, and 50 % of the observations fall between 3 and 24. The maximum number of MMs identified within one sheath region was 109. We also note that 70 % of all detected MMs occurred in those 16 sheaths that had more than 24 MMs.
As described in Sect. 2, we divided the sheaths into three sub-regions: near-shock, mid-sheath and near-LE sub-regions. Table 2 also gives the median, LQ and UQ for the observed MMs in these sub-regions. The last column again shows the percentage of sheaths with more than 24 MMs in the sub-region in question. All sub-regions have approximately the same median and LQ, while the UQ has the highest value in the near-shock sub-region and the lowest value in the near-LE sub-region.
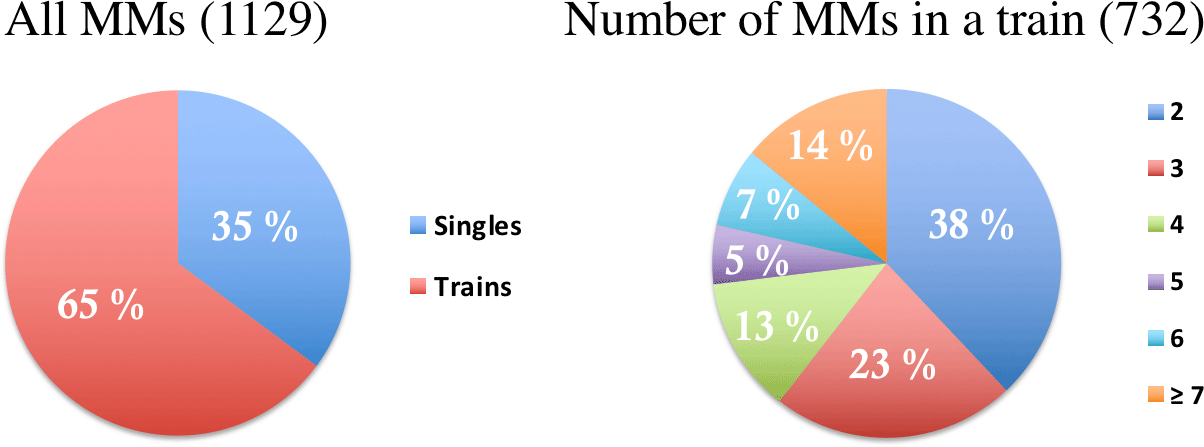
Figure 2Division of detected MMs to individual ones and the ones in MM trains and the division of MM trains according to the number of MMs in them.
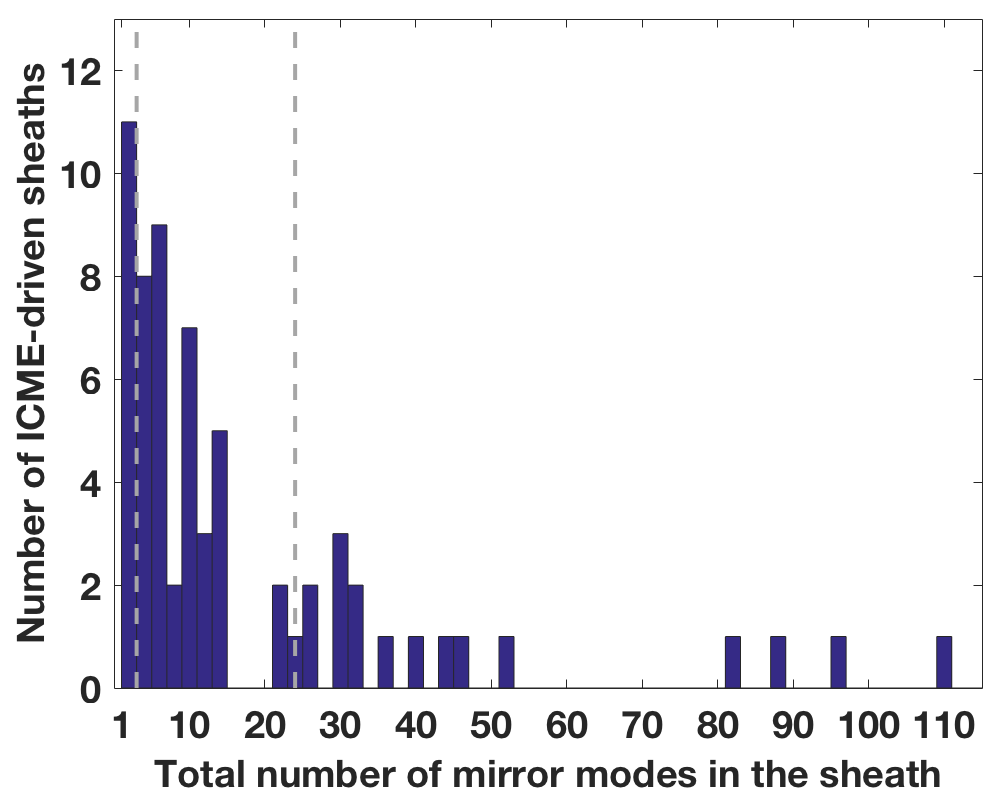
Figure 3The frequency histogram of ICME-driven sheaths as a function of number of MMs within the sheath in bins of 2 MMs. The grey dashed lines show the lower (3) and upper (24) quartiles of the number of MMs.
Table 2Quartiles of ICME-driven sheath regions (whole sheath) and different sub-regions according to the number of MMs in them. The quartiles are computed for those ICME-driven sheaths and sub-regions that contained MMs. The last column shows the percentage of sheaths with more than 24 MMs in the sub-region in question.
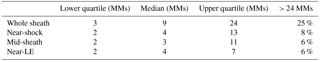
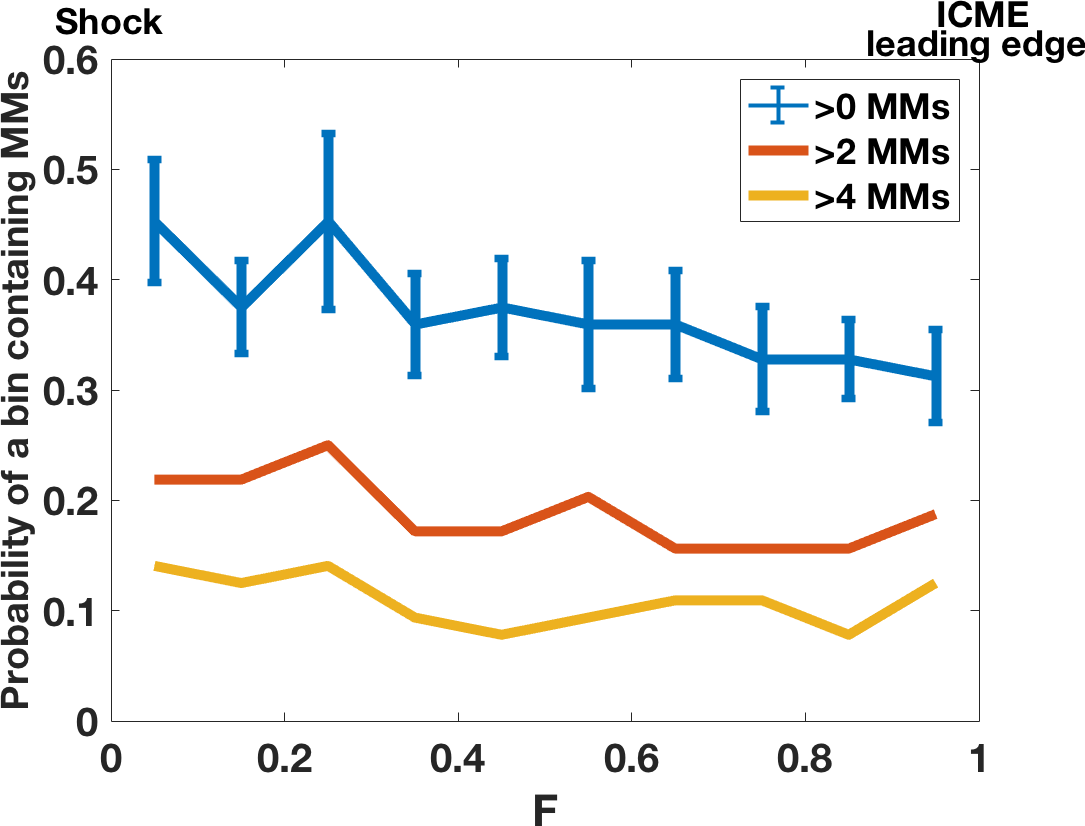
Figure 4Probability of observing MMs within a 0.1 fractional distance (F) bin as a function of F from the ICME-driven shock (F=0 refers to the shock and F=1 to the ICME leading edge). The colors show different requirements for the number of MMs in a bin. The probability is defined as the ratio of the number of intervals containing MMs to the total number of intervals within each bin (64 for all intervals). The error bars of the blue curve represents the division of MMs within the whole sheath and are defined as the ratio of the number of MMs observed within each bin to the total number of MMs within the whole F interval from 0 to 1. We only consider here those ICME-driven sheaths that contained MMs. We have checked that the distributions are not biased due to the sheaths containing a large number of MMs.
The occurrence of MMs in the sheath is further examined in Fig. 4, which shows the probability of a fractional distance interval (F) containing MMs in 0.1 bins. The color of the curves indicates the lower limit of the number of MMs that we required to be in each bin (> 0, > 2 or > 4 MMs). The probability is the ratio of the bins that contained MMs to the total number of bins considered. The error bars of the blue curve in the figure represents the division of all observed MMs in this study as a function of F and thus the sum of all the error bars gives 1.0. MMs were evidently observed everywhere in the sheath and the median fractional distance for detecting a MM is F=0.47 (i.e., at the middle of the sheath). Only the blue curve in Fig. 4 shows a clear decreasing trend when moving from the shock towards the ICME leading edge, while the other two curves have relatively flat profiles. In addition, the size of the error bars does not have drastic variations throughout the sheath but the largest portion of MMs was observed in the bin within the near-shock sub-region. We have checked that the results shown in Fig. 4 are not biased by the sheaths having a large number of MMs. Furthermore, 39 % of all observed MMs were located in the near-shock sub-region. The corresponding percentages are 31 and 29 % for the mid-sheath and near-LE sub-regions, respectively. This is in agreement with Table 2, which shows that the large number of MMs (> 24 MMs) was detected most frequently in the near-shock sub-region.
3.2 MM properties
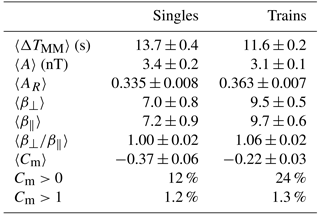
Statistics on the duration and amplitudes of the detected MMs are illustrated in Fig. 5 and summarized in the three first rows of Table 3. Figure 5a presents the MM frequency histogram for the duration of a MM structure in 3 s bins. After the peak in the 9 s bin, the occurrence of MMs drops quickly with increasing duration. The average duration of MMs for our data set is ∼12 s (Table 3). The average durations are similar for each investigated sub-region. Table 4 further shows MM properties in singles and trains. Single MMs have slightly larger duration (13.7 s) than MMs in trains (11.6 s).
The MM frequency histograms for the amplitude and relative amplitude in 0.7 nT and 0.04 bins are shown in Fig. 5b and c. The amplitudes of MMs are biased towards small values (1–3 nT), and the average amplitude is 3.2 nT (Table 3). However, we identified some MMs with relatively large amplitudes (> 10 nT). Similarly, the distribution of relative amplitude is strongly weighted towards smaller values with an average 0.35. Table 3 also shows that the amplitudes are on average largest in the near-shock region and smallest in the near-LE sub-region. The relative amplitudes, however, are very similar between all sub-regions. The absolute amplitudes are slightly larger for single MMs than for MMs in trains but there are no significant differences between relative amplitudes (Table 4).

Figure 5Statistics of the properties of MMs in ICME-driven sheath regions. (a) The distribution of detected mirror modes (MMs) according to their duration (ΔTMM) and in 3 s bins. (b) MM occurrence as a function of their amplitude (A) in 0.7 nT bins. (c) MM occurrence as a function of the relative amplitude of a structure (AR) in 0.04 bins. We have checked that the distributions are not biased due to the sheaths containing a large number of MMs.
Figure 6 gives relative frequency distributions for perpendicular plasma beta (β⟂), parallel plasma beta (β∥), plasma beta anisotropy () and mirror instability threshold (Cm) values. We calculated the distributions for both the MM structures including their 5 min surroundings (black curves), and the parts of the sheath that lacked MMs, i.e., for the “non-MM sheath” (blue curves). Figure 6a and b show that β⟂ and β∥ are clearly higher in MMs than in non-MM parts of the sheath.
Figure 6c and d also show that the distributions for the plasma beta anisotropy and Cm have clear differences between the regions where MMs were detected and not detected. Firstly, the plasma beta anisotropy distribution is wider for the non-MM sheath and has a distinct tail extending to high values of . The distribution of regions with MMs peaks at slightly higher values, but averages and medians (see the Supplement) of the plasma beta anisotropy are about the same. The average beta anisotropies for MMs are very similar in all investigated sub-regions but in non-MM parts, the anisotropy is highest in the near-shock sub-region. MMs in trains have on average slightly larger values than single MMs (Table 4).
Secondly, the Cm distribution for non-MM sheath has almost solely negative values, indicating mirror stable plasma. According to Table 3, 96 % of the non-MM sheath has Cm<0. Interestingly, also 80 % of the MMs have Cm<0 and a significant part of the distribution resides in the mirror stable region (Fig. 6d). However, we emphasize that the Cm values are generally larger for MMs than elsewhere in the sheath. We also note that only a very small fraction of Cm values are greater than 1. This is consistent with nearly all of the identified MMs being classified as dip-like MMs. As we discussed in Sect. 1, in planetary magnetosheaths, peak-like MMs occur predominantly in plasmas with Cm>1. Again, MMs in different sheath sub-regions have very similar Cm values and the percentages of Cm>0 observations. The percentage of Cm>1 observations is, however, highest in the near-shock sub-region. In non-MM parts, the average Cm value and the percentages of Cm>0 and Cm>1 observations are highest near the shock. The average Cm decreases towards the ICME leading edge but the percentages do not vary significantly between the mid-sheath and near-LE sub-regions. Table 4 shows that MMs in trains (24 %) occur more often in mirror unstable plasma than single MMs (12 %).
We also examine the statistical significance of the differences between the and Cm distributions of MMs and non-MM sheath by using Student's t test and assuming unequal variances between the distributions (Welch, 1938). The p values indicating the probability that the averages between two distributions are the same are 0.003 and for the distributions of and Cm, respectively. The values are clearly below the nominal significance level 0.05 (see for example Ruxton, 2006) suggesting a high statistical significance.
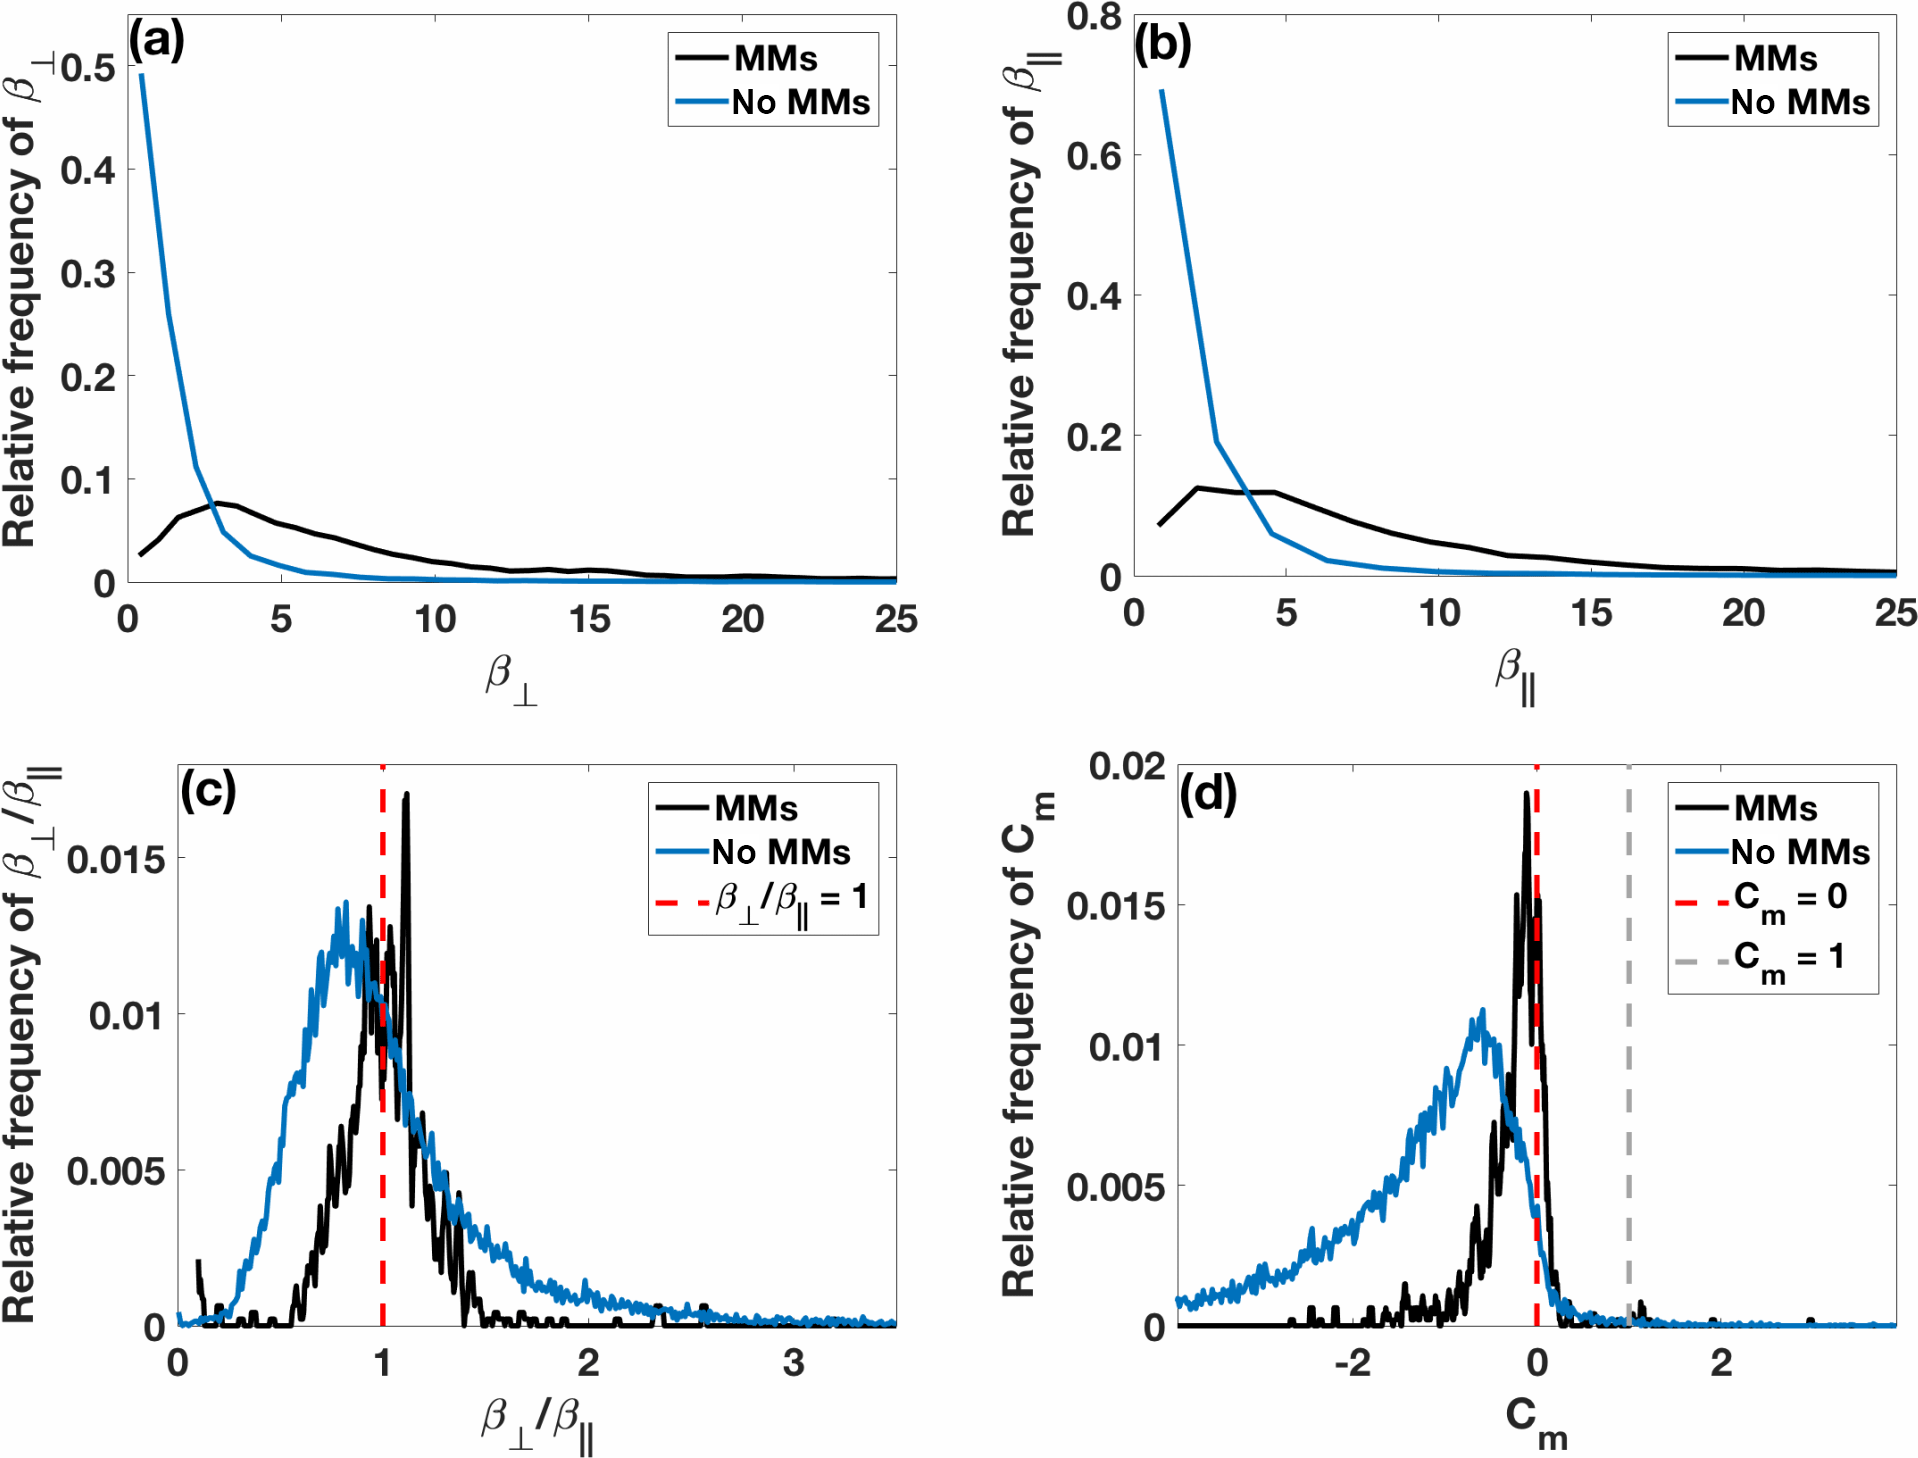
Figure 6Relative frequency of (a) perpendicular plasma beta (β⟂), (b) parallel plasma beta (β∥), (c) plasma beta anisotropy () and (d) mirror instability threshold (Cm) values in the surroundings of detected MMs (black curves) and in the parts of the sheath where MMs were not detected (blue curves). In panels (c) and (d), the red dashed vertical lines show the threshold values for mirror unstable plasma, i.e., and Cm=0. See details from Sect. 1. The grey dashed line in panel (d) marks Cm=1, i.e., the threshold for detecting peak-like MMs. We have checked that the distributions are not biased due to the sheaths containing a large number of MMs.
Table 3Average properties of MMs and their division to the individual ones and the ones in trains in different sheath sub-regions (the percentages in parentheses indicate the division of singles and MMs in trains between different sub-regions). The typical plasma betas, plasma beta anisotropy and mirror instability threshold values and the relative amount of plasma in a certain sub-region that is above the mirror instability threshold (Cm=0) and that exceeds Cm=1 in both plasma containing MMs and non-MM plasma are given. The last column shows the properties of MMs and plasma in the ICME-driven sheaths generally, i.e., in whole fractional distance interval from 0 to 1. The standard error of the mean (SE) defines the errors and is defined as , where δ is the standard deviation and n is the size of a sample.
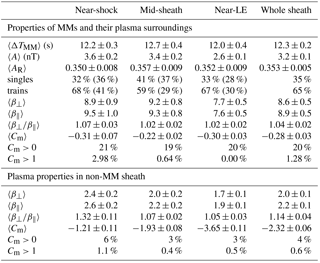
Table 4Average properties of both individual MMs and the ones in MM trains and their plasma properties. The errors are defined by SE. The relative amount of plasma that is above the mirror instability threshold (Cm=0) and that exceeds Cm=1 in the surroundings of both types of MM are given.
3.3 Dependence on shock properties
Next, we examine how MM occurrence and plasma properties of an ICME sheath depend on the shock angle (θBn) and shock Alfvén Mach number (MA), i.e., on the strength of the shock.
Figure 7 shows the sheath frequency distributions for these parameters. The majority of the shocks were quasi-perpendicular (Q⟂, ) with a median angle θBn of 59∘. Interplanetary shocks are typically weak (e.g., Kilpua et al., 2015), and also in our data set the Alfvén Mach numbers were typically less than 4. The median MA is 3.2, but the shock MA distribution has a tail that extends to MA values up to 14. The average values of the shock parameters are and .
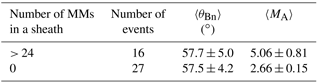
Table 5 shows the average values and standard errors of the parameters for non-MM sheaths (i.e., sheaths in which we did not identify any MMs) and sheaths that had more MMs than the upper quartile (see Table 2). On average, the sheaths with more than 24 MMs were associated with higher MA shocks than non-MM sheaths. The p value of the MA distributions is 0.01 indicating that the difference is statistically significant. In addition, although the average shock angle does not differ between these two subsets, we note that the median MA is 6.8 for those sheaths that had more than 24 MMs and that were preceded by a quasi-parallel shock (Q∥, ) (5 events), whereas the corresponding median for the sheaths with more than 24 MMs that were preceded by a quasi-perpendicular shock (11 events) is only 3.8.
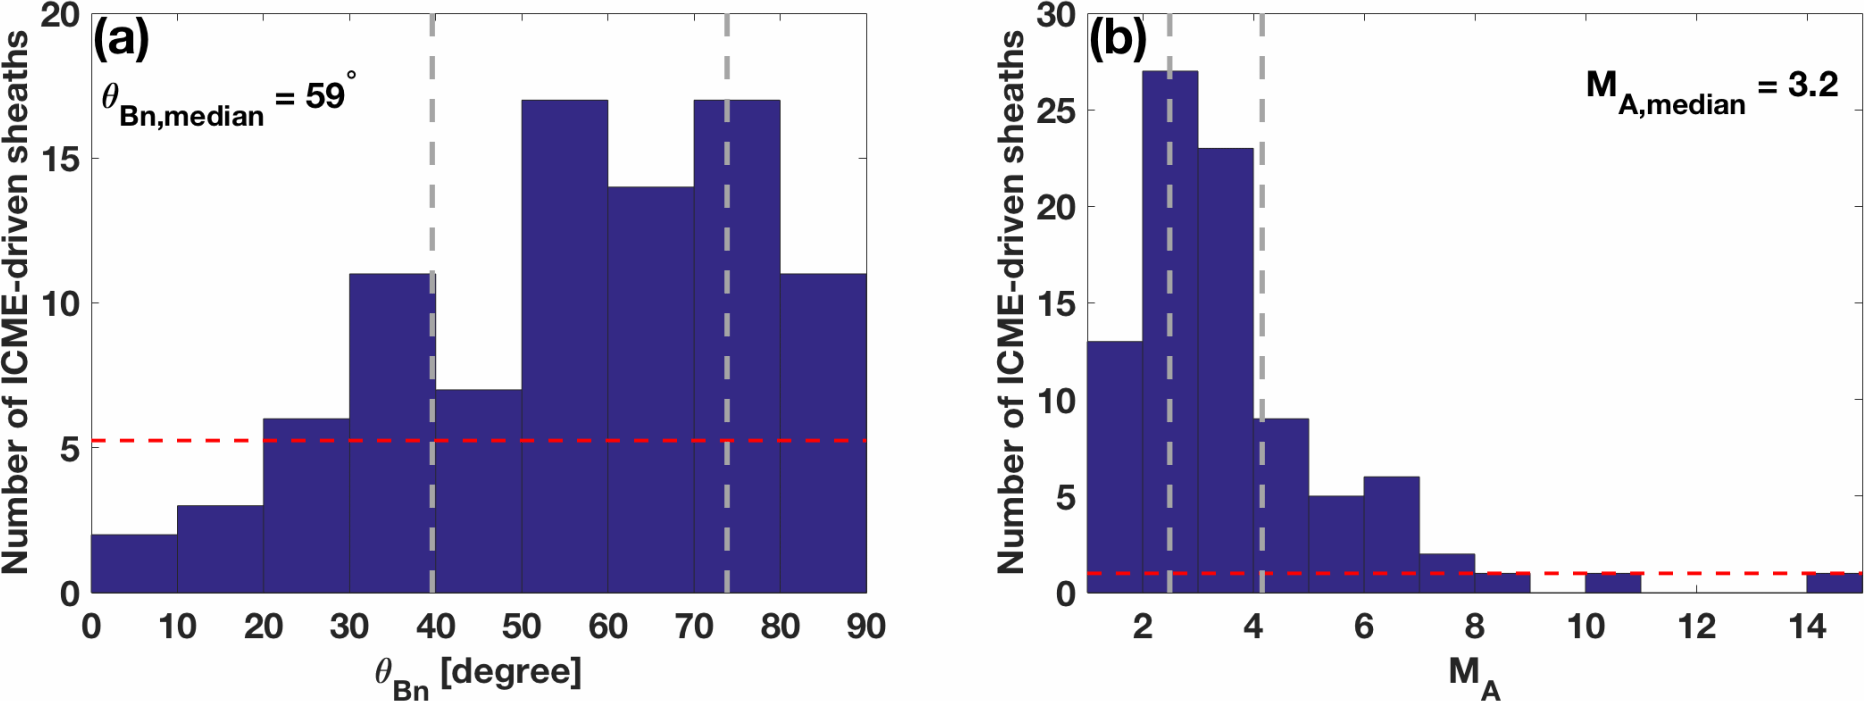
Figure 7The frequency histograms of (a) preceding shock angle (θBn) in 10∘ bins and (b) Alfvén Mach number (MA) in bins of unity for investigated ICME-driven sheath regions. The grey dashed vertical lines divide both shock parameter distributions to quartiles. The red dashed horizontal lines indicate the lower quartiles according to the number of ICME-driven sheaths in each shock parameter interval.
Table 5The averages of the shock parameters of the ICME-driven sheaths that had more than 24 MMs and that did not have any MMs. The errors are defined by SE.
We next investigate in more detail the occurrence of MMs depending on the shock angle and shock strength (Fig. 8). We consider here only the near-shock region because, as discussed in Sect. 1, sheaths observed at 1 AU have accumulated over the several days that the ICME has propagated through the heliosphere, and the plasma near the shock has been most recently passed across the shock. In the middle of the sheath and near the ICME leading edge, additional processes, such as the draping of the interplanetary magnetic field around the ejecta, may play a role in regulating the plasma.
Figure 8 shows the probability of a near-shock sub-region containing more than 4 MMs as a function of investigated shock parameters. The probability is calculated by requiring that more than four MMs had to be detected in the near-shock sub-region and the fractional numbers giving the probabilities are also given above the bars. Figure 8a shows that no near-shock sub-regions with more than four MMs were found if the preceding shock had , while the probability is the highest for the bins in the range . For each bin within the interval , the probability is approximately 0.20. The concurrent dependence of the probability on the both shock parameters is discussed later in this section and the results of the analysis are shown in Table 6.
Figure 8b shows a clear dependence between the probability and shock strength. MMs were detected most frequently (probability ∼1) when the shock MA was high. The probability decreases significantly with decreasing MA and for MA<4, it is <0.2.
The importance of the shock angle and shock strength for generating MMs is further investigated in Table 6. The near-shock sub-regions were divided into different sub-groups according to the shock parameters associated with them. For these different sub-groups, Table 6 shows the probability of a near-shock sub-region containing MMs when a different lower limit of MMs was required to be contained in a sub-region (> 0, > 2 or > 4 MMs). In addition, we calculated the average θBn and MA of each sub-group.

Figure 8Probability of a near-shock sub-region containing more than four MMs in one-dimensional bins of corresponding shock parameters. Probability is defined as the ratio of the number of the near-shock sub-regions containing more than four MMs to the total number of the near-shock sub-regions within each bin. The ratio is also given as a fractional number above each bin.
On the first two rows of Table 6, the sub-regions are divided into sub-groups according to the shock strength. The importance of MA is again obvious. While the average θBn does not vary much between these sub-groups, all the probabilities of the sub-group whose shock strength was above the average MA are clearly higher than the corresponding ones of the sub-group whose shock Alfvén Mach numbers were below the average. Moreover, all the probabilities of the sub-group having MA> 〈MA〉 are ≥50 % while the probability of the other group is not higher than 38 %.
Table 6Probability of a near-shock sub-region to contain a different number of MMs. The near-shock sub-regions are divided into different sub-groups according to the associated shock parameters. The average θBn and MA values of each sub-group are also shown. The values in bold in brackets are the corresponding values when the sheaths whose shock had and MA>8 were omitted from the analysis (see Fig. 7). The errors are defined by SE.
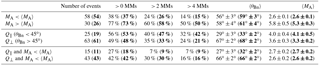
The near-shock sub-regions associated with a quasi-parallel shock contained MMs more frequently than the ones associated with a quasi-perpendicular shock (see the third and fourth rows of Table 6). However, the quasi-parallel shocks tend to have larger MA than the quasi-perpendicular shocks and this difference becomes stronger if the cases below the lower quartiles of θBn and MA distributions are omitted (see Fig. 7). Moreover, we note that 40 % of all quasi-parallel shocks had MA> 〈MA〉, while this was the case for 32 % of quasi-perpendicular shocks. Furthermore, 50 % of the shocks that had had MA> 〈MA〉 explaining the high probability in this θBn interval (see Fig. 8a).
Although generally a near-shock sub-region associated with a quasi-parallel shock contained MMs more frequently than the ones with a quasi-perpendicular shock, the two lowest rows in Table 6 imply that if the shock Alfvén Mach number is below the average of this study, the probability of a near-shock sub-region containing MMs is higher when the shock is quasi-perpendicular than if it is quasi-parallel. When examining the probabilities of the most loose lower limit (> 0 MMs) in the two lowest sub-groups in Table 6, we note that the probability of a sub-region having MMs is 42 % for the sub-group that is associated with a quasi-perpendicular shock but only 27 % for the quasi-parallel sub-group. Also, the probabilities of the other lower limits are higher for quasi-perpendicular shocks than for the quasi-parallel ones. The average MA, however, does not vary much between these sub-groups.
Finally, in Fig. 9, we study how β⟂, and Cm in the near-shock sub-region depend on shock properties and vary when moving downstream from the shock towards the ICME leading edge. Both averages and medians are shown.
The top row of Fig. 9 investigates the variations with the shock angle θBn. The first panel, Fig. 9a, shows that both the average and median of β⟂ peak in the bin. The median then decreases with increasing shock angle and increases only slightly for the most perpendicular bin, while the average values increase again considerably for the two most perpendicular bins. Both the average and median of the plasma beta anisotropy increase generally with the increasing shock angle. The error bars, however, are large in the perpendicular regime. For Cm, in turn, there is no obvious trend with the shock angle (Fig. 9c).
The middle row gives the dependence on the shock strength (MA). We first note that β⟂ (Fig. 9d) increases with increasing shock strength. This explains the sharp peak of β⟂ in the bin we noted previously in Fig. 9a (see also the Supplement). Figure 9e suggests that the beta anisotropy is smallest when the shock is strong. The large peaks in averages for both panels (d) and (e) for the MA=6–7 bin are due to a few exceptionally large values of β⟂ (). The mirror instability threshold value Cm, in turn, generally increases as a function of MA (Fig. 9f).
The variations with the fractional distance are given in the bottom row. Figure 9g shows that after reaching its maximum in the bin, β⟂ decreases almost monotonically as a function of F. The average value shows another, weaker peak in the bin. The beta anisotropy (Fig. 9h) and Cm (Fig. 9i) both peak right after the shock and then decrease with increasing F. The averages again show a peak in the bin, explained by the corresponding maximum in β⟂.
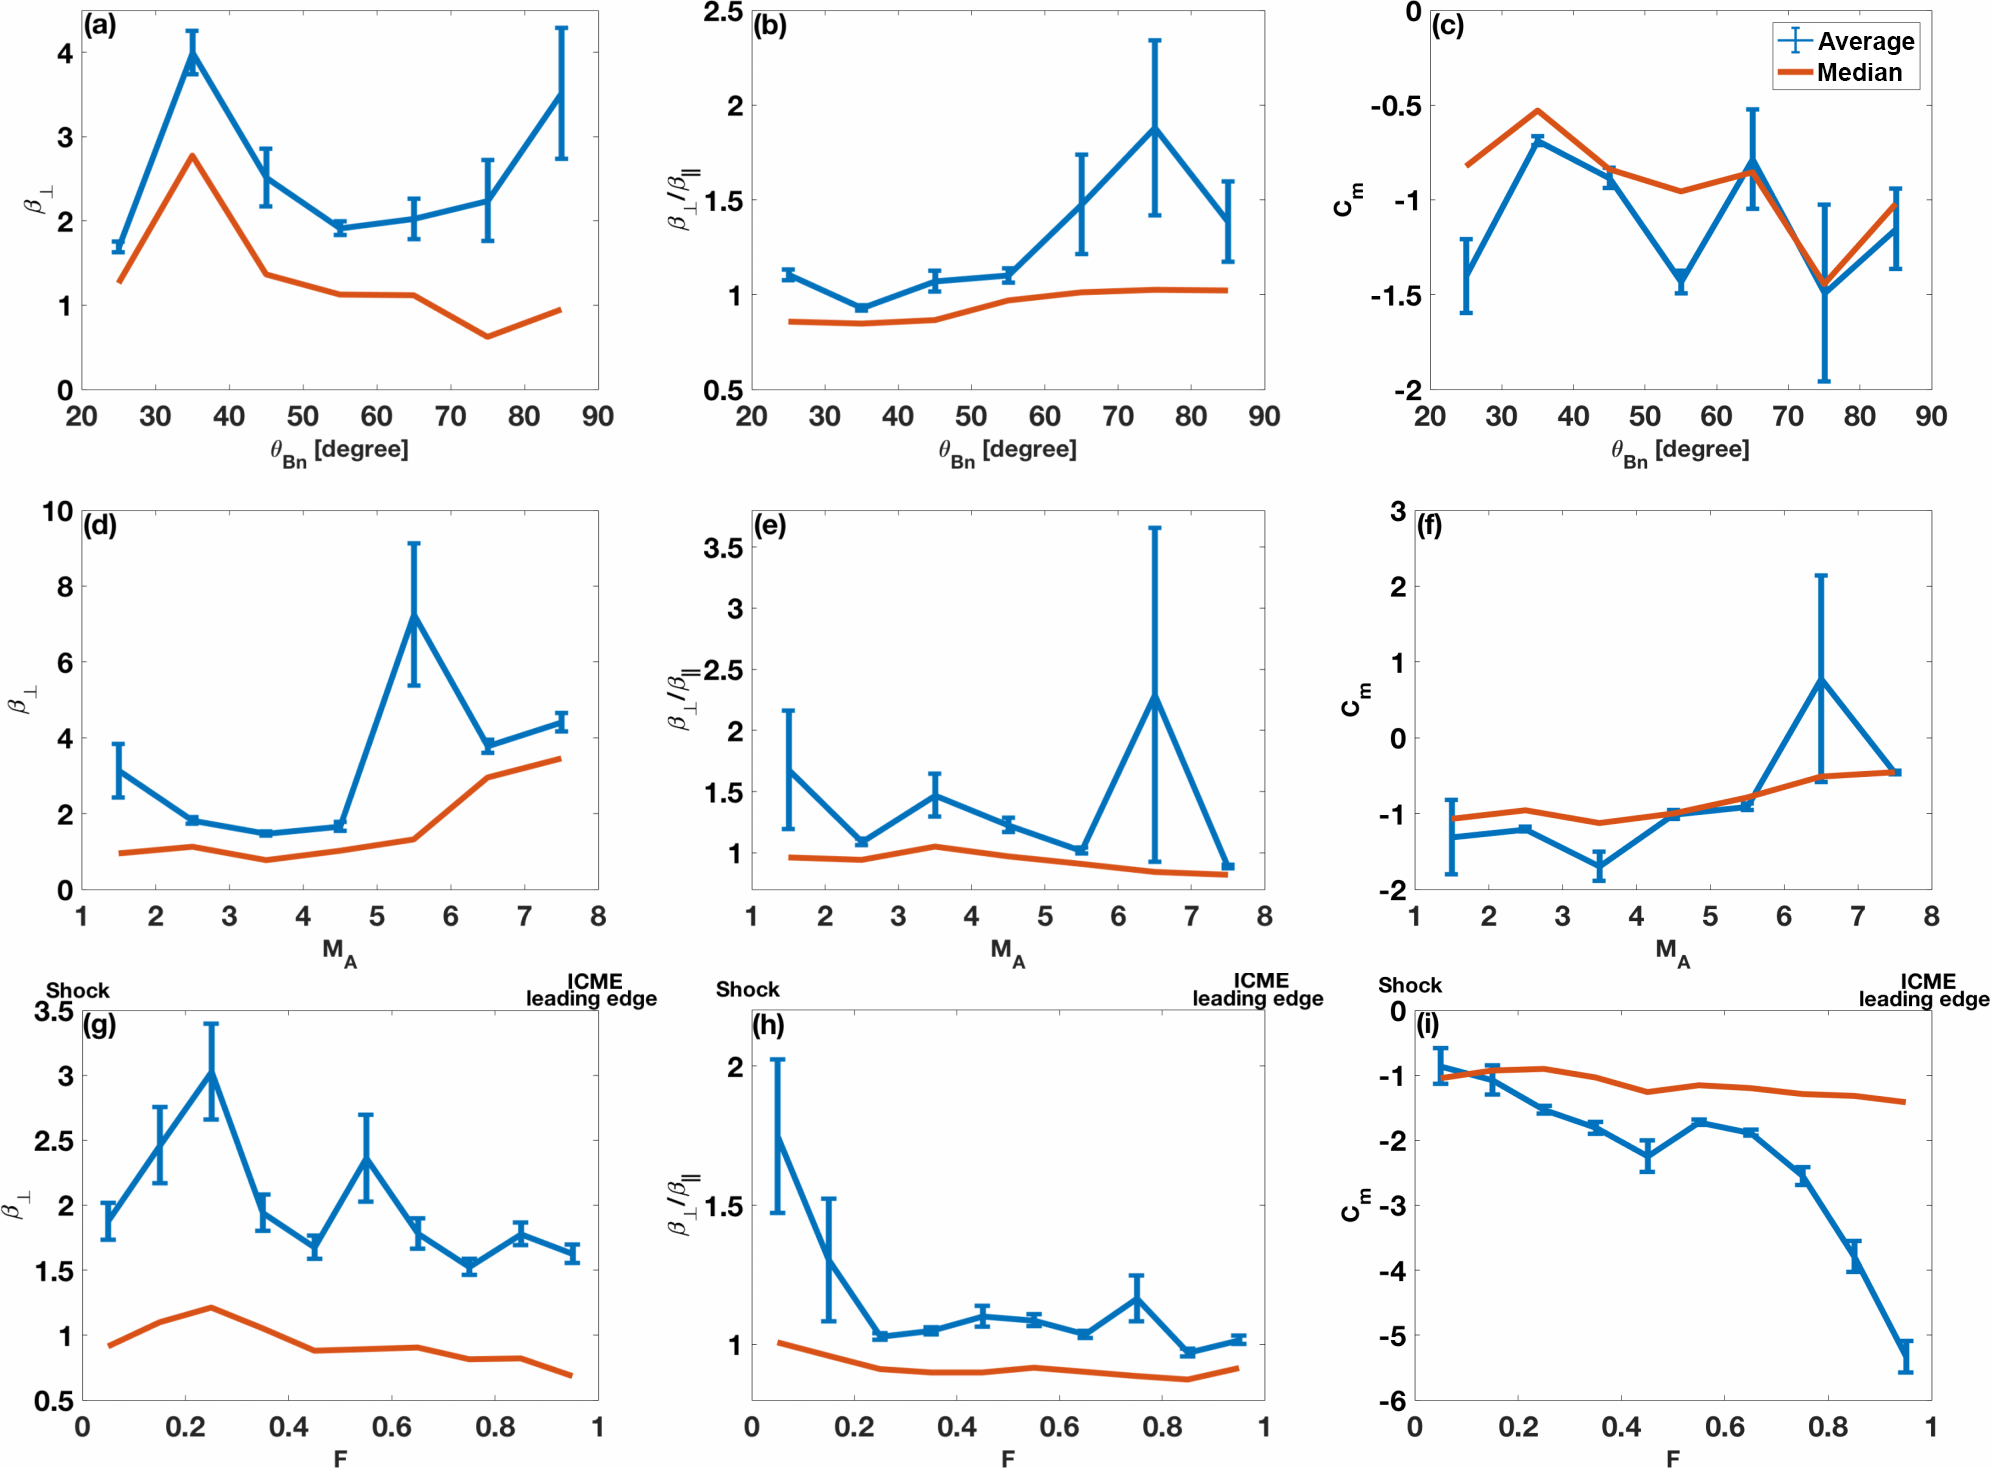
Figure 9Average and median β⟂, and Cm (see panel c for color codes) in the near-shock sub-region as functions of θBn (a–c) and MA (d–f) in bins of 10∘ and unity, respectively. (g–i) Show the plasma parameters as a function of F in bins of 0.1. Due to low statistics, the sheaths whose shock had are omitted in panels (a–c) and the ones whose shock had MA>8 are omitted in panels (d–f) (see Fig. 7). The error bars are defined by SE.
In this paper, we have identified mirror modes (MMs) from 91 ICME-driven sheaths using a semi-automated method and investigated their occurrence and properties.
We summarize the key findings of this study as follows:
-
Approximately 70 % of the investigated sheaths had MMs.
-
Practically all MMs (96 %) in ICME sheaths were dip-like.
-
80 % of MMs occurred in mirror stable plasma.
-
Single and train MMs had no drastic differences in their properties. Single MMs were slightly longer in duration and had slightly larger amplitudes than MMs in trains. In addition, MMs in trains occurred more frequently in mirror unstable plasma than single MMs (24 and 12 %, respectively).
-
MMs were observed throughout the sheath.
-
MMs had similar properties throughout the sheath, except that their amplitudes were larger for MMs occurring near the shock.
-
Shock strength was the most important parameter in controlling the occurrence of MMs.
-
The perpendicular plasma beta and plasma beta anisotropy increased with increasing shock strength and shock angle, respectively.
-
The mirror instability threshold value generally decreased when moving from the shock towards the ICME leading edge.
Similarly to the Earth's magnetosheath (e.g., Lucek et al., 1999), we found that MMs are fairly common structures in ICME-driven sheath regions. More than two-thirds of the investigated 91 ICME-driven sheaths had at least one MM structure. However, sheaths that contain a larger number of MMs (> 24) were relatively rare, and on average only a few MMs were detected per sheath. In addition, because MMs are relatively narrow structures, they cover only a small portion of the sheath, e.g., in our study only 3 % for the sheath that contained the largest number of MMs.
Similar to planetary magnetosheaths (e.g., Tsurutani et al., 2011b), we found that MMs tend to occur in trains also in ICME sheaths. However, 60 % of all observed MMs occurred as singles or trains of two. We point out that the concept of a MM train is less important when MMs are dip-like; an individual dip-like MM forms a magnetic bottle and is stable by itself. In the case of peak-like MMs, in turn, a train of at least two MMs are required to create a structure between which ions are trapped (e.g., Balikhin et al., 2009, 2010). Thus, two dip-like MMs in the same MVA test interval are not necessarily related in any way.
We found MMs everywhere in the ICME-driven sheaths, i.e., from the shock to the ICME leading edge. The number of MMs was largest near the shock and consistently we found that both perpendicular plasma beta and the mirror instability threshold value generally decreased as a function of fractional distance. The probability of observing MMs, instead, did not vary significantly as a function of fractional distance. In planetary magnetosheaths, MMs are also found from the bow shock to the magnetopause, but their occurrence rate is highest in the central or inner magnetosheath (e.g., Tátrallyay and Erdős, 2005; Génot et al., 2009b; Dimmock et al., 2015; Soucek et al., 2015).
The fact that the clear majority (80 %) of MMs in our study occurred in mirror stable plasma, i.e., where Cm<0 is consistent with practically all of them (96 %) being dip-like (see Sect. 1). Our results are also consistent with Liu et al. (2006), who reported that the plasma in ICME sheaths is generally only marginally mirror unstable and the average beta anisotropy in these sheaths is enhanced and –1.3. We, however, found that the regions where MMs occur are different from those where they are absent; the relative frequency distributions of Cm and beta anisotropy were distinctly different for non-MM regions and in regions with MMs. Moreover, both perpendicular and parallel plasma beta were on average higher in regions with MMs.
The relative MM amplitude distribution in ICME sheaths is roughly consistent with the previous studies of MMs in the Earth's magnetosheath (e.g., Génot et al., 2009b). Absolute amplitudes, however, are clearly higher for MMs found in the Earth's magnetosheath. Dimmock et al. (2015) and Osmane et al. (2015) reported MMs in the magnetosheath of the Earth with absolute amplitudes approximately between 10 and 20 nT. Although some MMs in our study had amplitudes up to 10 nT, the average absolute amplitude was only about 3 nT.
Smaller amplitudes (A) of MMs in ICME-driven sheaths are presumably due to the limited amount of free energy. In planetary magnetosheaths the largest MM amplitudes are found in the inner magnetosheath (e.g., Erkaev et al., 2001) suggesting that both shock compression and field line draping may play an important role (Tsurutani et al., 2011b). As discussed previously, in ICME sheaths, the MMs are most abundant and have largest amplitudes close to the shock suggesting that the shock compression is the dominant source of free energy. MMs closer to the ICME leading edge could hence be remnants of MMs generated near the shock during earlier phases of the sheath evolution. Because ICMEs expand laterally, the plasma is unable to flow around the ICME and it accretes in front of the ejecta maintaining the record of previous interaction (Siscoe and Odstrcil, 2008).
This scenario could be compared to the case of MMs observed in the Earth's magnetosheath and can be used to explain the observed absence of mirror peaks in ICME sheaths. In the magnetosheath of the Earth, the initial growth of mirror structures occurs in the middle magnetosheath where spacecraft consistently observe strongly unstable plasma and MMs have the form of magnetic peaks (e.g., Soucek et al., 2015). This region is not observed in the ICME sheaths and due to the low anisotropy, the plasma is typically mirror stable or marginally unstable and MMs are observed as dip-like structures.
Since the plasma we observe in the ICME sheath has accumulated over time, it may contain remnants of mirror structures created at smaller heliocentric distances, where the plasma was hotter, denser and more mirror unstable. As the ICME propagates away from the Sun and the sheath plasma expands, the plasma becomes more stable and only mirror dips remain. In this respect, the ICME sheath expansion is analogous to plasma expansion at the flanks of the Earth's magnetosheath or in the plasma depletion layer, where MMs also appear predominantly as dips (Soucek et al., 2008). Furthermore, Génot et al. (2011) report that in mirror stable plasma regions, such as the magnetosheath flanks, previously generated dip-like MMs are eventually slowly damped. This could explain the smaller amplitude of MMs close to the ICME leading edge.
The absence of mirror peaks could also be explained by the reduced amount of free energy and weaker mirror instability. The excitation of MMs and their rapid transition from a quasi-sinusoidal wave to a nonlinear structure is not fully understood and numerical studies (Califano et al., 2008), as well as observations (Génot et al., 2009b), suggest that in weakly unstable plasmas, the instability saturates directly into a dip-like structure and peaks are only formed when the plasma is sufficiently far from the threshold.
Our suggestion that the shock compression is the dominant free energy source for MMs in ICME sheaths is supported by our finding that the largest number of MMs were associated with much stronger shocks than those events that lacked MMs. We also found that both β⟂ and the mirror instability threshold value increased with increasing shock strength.
In turn, we found that the shock angle θBn did not have an obvious effect on the probability of observing MMs. However, for low Alfvén Mach number shocks, we found MMs more frequently behind quasi-perpendicular shocks than behind quasi-parallel shocks, and the beta anisotropy in the near-shock sub-region was larger in sheaths behind quasi-perpendicular shocks, consistent with the observations in the Earth's magnetosheath (e.g., Soucek et al., 2015, see also Hoilijoki et al., 2016).
We can hence conclude that in ICME-driven sheaths, the shock properties have a significant impact on the MM generation and the shock compression has an essential role as a source of free energy. MMs are most likely to form when the shock is strong and quasi-perpendicular and they are most abundant close to the shock. MMs closer to the ICME leading edge are likely remnants of MMs formed at earlier times in the vicinity of shocks.
New opportunities to study MMs will be provided by the European Space Agency's Solar Orbiter (Müller et al., 2013) and with NASA's Parker Solar Probe (Fox et al., 2016) missions. Solar Orbiter will have an orbit whose distance from the Sun varies between 0.28 and 0.9 AU, while Parker Solar Probe will make plunges as close as 10 solar radii from the Sun. These missions will, in particular, allow for resolving how MMs are generated during the earlier phases of the sheath evolution.
Finally, we discuss shortly whether our results indicate if Alfvén ion cyclotron (AIC) waves could occur in ICME-driven sheaths. AIC waves are other ultra-low-frequency waves that are driven by a temperature anisotropy. In the Earth's magnetosheath, AIC waves typically occur after a weak quasi-perpendicular shock or in the magnetosheath flanks (e.g., Soucek et al., 2015). In addition, they are observed in a plasma that is mirror stable and that has low parallel plasma beta (β∥≲3) and (e.g., Gary, 1992; Gary et al., 1993).
In our data set, the ICME sheaths were often preceded by a quasi-perpendicular shock and the shocks were mostly weak (MA<4). In addition, the beta anisotropy distribution in non-MM sheath has, interestingly, clearly a longer tail towards the higher anisotropy values than the distribution of MMs. The average parallel plasma beta was, in addition, in the non-MM parts of the ICME sheaths. Furthermore, the ICME sheaths were only marginally mirror unstable. Thus, our results imply that the plasma conditions in ICME sheaths could be favorable for AIC waves to occur.
The data examined in this study were obtained from NASA Goddard Space Flight Center Coordinated Data Analysis Web (CDAWeb, http://cdaweb.gsfc.nasa.gov/, last access: November 2017) and from the Heliospheric Shock Database (http://ipshocks.fi/, last access: November 2017), generated and maintained at the University of Helsinki.
The supplement related to this article is available online at: https://doi.org/10.5194/angeo-36-793-2018-supplement.
MMAL designed the methods with contributions from APD and EKJK, and AO and was the one who carried out the examination of the data set. The results were analyzed by MMAL, EKJK and APD. In addition, MMAL and EKJK prepared the manuscript with contributions from APD, AO, TP and JS.
The authors declare that they have no conflict of interest.
We thank Adam Szabo for the Wind MFI data and Keith W. Ogilvie for the Wind SWE
data. We also thank the NASA Goddard Space Flight Center for providing data on
CDAWeb and the Heliospheric Shock Database, generated and maintained at the
University of Helsinki. Matti M. Ala-Lahti and Emilia K. J. Kilpua acknowledge The Finnish
Centre of Excellence in Research of Sustainable Space, funded through the
Academy of Finland grant number 312351 and Academy of Finland project 1310445.
This project has received funding from the European Research Council
(ERC) under the European Union's Horizon 2020 research and innovation
program (grant agreement no. 4100103, SolMAG). Jan Souček
acknowledges the support of the Czech Science Foundation grant 17-08772S.
The topical editor, Manuela Temmer, thanks two anonymous referees for help in evaluating this paper.
Bale, S. D., Kasper, J. C., Howes, G. G., Quataert, E., Salem, C., and Sundkvist, D.: Magnetic Fluctuation Power Near Proton Temperature Anisotropy Instability Thresholds in the Solar Wind, Phys. Rev. Lett., 103, 211101, https://doi.org/10.1103/PhysRevLett.103.211101, 2009. a
Balikhin, M. A., Sagdeev, R. Z., Walker, S. N., Pokhotelov, O. A., Sibeck, D. G., Beloff, N., and Dudnikova, G.: THEMIS observations of mirror structures: Magnetic holes and instability threshold, Geophys. Res. Lett., 36, L03105, https://doi.org/10.1029/2008GL036923, 2009. a
Balikhin, M. A., Pokhotelov, O. A., Walker, S. N., Boynton, R. J., and Beloff, N.: Mirror mode peaks: THEMIS observations versus theories, Geophys. Res. Lett., 37, L05104, https://doi.org/10.1029/2009GL042090, 2010. a
Burlaga, L., Sittler, E., Mariani, F., and Schwenn, R.: Magnetic loop behind an interplanetary shock – Voyager, Helios, and IMP 8 observations, J. Geophys. Res., 86, 6673–6684, https://doi.org/10.1029/JA086iA08p06673, 1981. a
Califano, F., Hellinger, P., Kuznetsov, E., Passot, T., Sulem, P. L., and Trávníček, P. M.: Nonlinear mirror mode dynamics: Simulations and modeling, J. Geophys. Res.-Space Phys., 113, A08219, https://doi.org/10.1029/2007JA012898, 2008. a, b, c, d
Démoulin, P. and Dasso, S.: Causes and consequences of magnetic cloud expansion, Astron. Astrophys., 498, 551–566, https://doi.org/10.1051/0004-6361/200810971, 2009. a
Dimmock, A. P., Osmane, A., Pulkkinen, T. I., and Nykyri, K.: A statistical study of the dawn-dusk asymmetry of ion temperature anisotropy and mirror mode occurrence in the terrestrial dayside magnetosheath using THEMIS data, J. Geophys. Res.-Space Phys., 120, 5489–5503, https://doi.org/10.1002/2015JA021192, 2015. a, b, c, d
Echer, E., Tsurutani, B. T., Guarnieri, F. L., and Kozyra, J. U.: Interplanetary fast forward shocks and their geomagnetic effects: CAWSES events, J. Atmos. Sol.-Terr. Phy., 73, 1330–1338, https://doi.org/10.1016/j.jastp.2010.09.020, 2011. a, b
Erkaev, N. V., Schaffenberger, W., Biernat, H. K., Farrugia, C. J., and Vogl, D. F.: Analysis of mirror modes convected from the bow shock to the magnetopause, Planet. Space Sci., 49, 1359–1364, https://doi.org/10.1016/S0032-0633(01)00057-5, 2001. a
Fox, N. J., Velli, M. C., Bale, S. D., Decker, R., Driesman, A., Howard, R. A., Kasper, J. C., Kinnison, J., Kusterer, M., Lario, D., Lockwood, M. K., McComas, D. J., Raouafi, N. E., and Szabo, A.: The Solar Probe Plus Mission: Humanity's First Visit to Our Star, Space Sci. Rev., 204, 7–48, https://doi.org/10.1007/s11214-015-0211-6, 2016. a
Gary, S. P.: The mirror and ion cyclotron anisotropy instabilities, J. Geophys. Res., 97, 8519–8529, https://doi.org/10.1029/92JA00299, 1992. a
Gary, S. P., Fuselier, S. A., and Anderson, B. J.: Ion anisotropy instabilities in the magnetosheath, J. Geophys. Res., 98, 1481–1488, https://doi.org/10.1029/92JA01844, 1993. a
Génot, V.: Mirror and Firehose Instabilities in the Heliosheath, Astrophys. J. Lett., 687, L119, https://doi.org/10.1086/593325, 2008. a
Génot, V., Budnik, E., Hellinger, P., Passot, T., Belmont, G., Trávnícek, P. M., Sulem, P.-L., Lucek, E., and Dandouras, I.: Mirror structures above and below the linear instability threshold: Cluster observations, fluid model and hybrid simulations, Ann. Geophys., 27, 601–615, https://doi.org/10.5194/angeo-27-601-2009, 2009a. a
Génot, V., Budnik, E., Jacquey, C., Dandouras, I., and Lucek, E.: Mirror Modes Observed with Cluster in the Earth's Magnetosheath: Statistical Study and IMF/Solar Wind Dependence, Adv. Geosci., 14, 263–283, https://doi.org/10.1142/9789812836205_0019, 2009b. a, b, c, d, e, f
Génot, V., Broussillou, L., Budnik, E., Hellinger, P., Trávnícek, P. M., Lucek, E., and Dandouras, I.: Timing mirror structures observed by Cluster with a magnetosheath flow model, Ann. Geophys., 29, 1849–1860, https://doi.org/10.5194/angeo-29-1849-2011, 2011. a
Glassmeier, K.-H., Motschmann, U., Mazelle, C., Neubauer, F. M., Sauer, K., Fuselier, S. A., and Acuna, M. H.: Mirror modes and fast magnetoacoustic waves near the magnetic pileup boundary of comet P/Halley, J. Geophys. Res.-Space Phys., 98, 20, https://doi.org/10.1029/93JA02582, 1993. a
Hasegawa, A.: Drift mirror instability of the magnetosphere., Phys. Fluids, 12, 2642–2650, https://doi.org/10.1063/1.1692407, 1969. a
Hellinger, P., Trávníček, P., Mangeney, A., and Grappin, R.: Hybrid simulations of the magnetosheath compression: Marginal stability path, Geophys. Res. Lett., 30, 1959, https://doi.org/10.1029/2003GL017855, 2003. a
Hellinger, P., Trávníček, P., Kasper, J. C., and Lazarus, A. J.: Solar wind proton temperature anisotropy: Linear theory and WIND/SWE observations, Geophys. Res. Lett., 33, L09101, https://doi.org/10.1029/2006GL025925, 2006. a
Hellinger, P., Landi, S., Matteini, L., Verdini, A., and Franci, L.: Mirror Instability in the Turbulent Solar Wind, Astrophys. J., 838, 158, https://doi.org/10.3847/1538-4357/aa67e0, 2017. a
Herčík, D., Trávníček, P. M., Johnson, J. R., Kim, E.-H., and Hellinger, P.: Mirror mode structures in the asymmetric Hermean magnetosheath: Hybrid simulations, J. Geophys. Res.-Space Phys., 118, 405–417, https://doi.org/10.1029/2012JA018083, 2013. a
Hoilijoki, S., Palmroth, M., Walsh, B. M., Pfau-Kempf, Y., von  Alfthan, S., Ganse, U., Hannuksela, O., and Vainio, R.: Mirror modes in the Earth's magnetosheath: Results from a global hybrid-Vlasov simulation, J. Geophys. Res.-Space Phys., 121, 4191–4204, https://doi.org/10.1002/2015JA022026, 2016. a, b, c
Huttunen, K. E. J. and Koskinen, H. E. J.: Importance of post-shock streams and sheath region as drivers of intense magnetospheric storms and high-latitude activity, Ann. Geophys., 22, 1729–1738, https://doi.org/10.5194/angeo-22-1729-2004, 2004. a
Huttunen, K. E. J., Koskinen, H. E. J., and Schwenn, R.: Variability of magnetospheric storms driven by different solar wind perturbations, J. Geophys. Res.-Space Phys., 107, 1121, https://doi.org/10.1029/2001JA900171, 2002. a
Kilpua, E. K. J., Lumme, E., Andreeova, K., Isavnin, A., and Koskinen, H. E. J.: Properties and drivers of fast interplanetary shocks near the orbit of the Earth (1995–2013), J. Geophys. Res.-Space Phys., 120, 4112–4125, https://doi.org/10.1002/2015JA021138, 2015. a
Kilpua, E. K. J., Balogh, A., von Steiger, R., and Liu, Y. D.: Geoeffective Properties of Solar Transients and Stream Interaction Regions, Space Sci. Rev., https://doi.org/10.1007/s11214-017-0411-3, 2017. a, b, c
Klein, L. W. and Burlaga, L. F.: Interplanetary magnetic clouds at 1 AU, J. Geophys. Res., 87, 613–624, https://doi.org/10.1029/JA087iA02p00613, 1982. a
Kuznetsov, E. A., Passot, T., and Sulem, P. L.: Dynamical Model for Nonlinear Mirror Modes near Threshold, Phys. Rev. Lett., 98, 235003, https://doi.org/10.1103/PhysRevLett.98.235003, 2007. a
Lepping, R. P., Acũna, M. H., Burlaga, L. F., Farrell, W. M., Slavin, J. A., Schatten, K. H., Mariani, F., Ness, N. F., Neubauer, F. M., Whang, Y. C., Byrnes, J. B., Kennon, R. S., Panetta, P. V., Scheifele, J., and Worley, E. M.: The Wind Magnetic Field Investigation, Space Sci. Rev., 71, 207–229, https://doi.org/10.1007/BF00751330, 1995. a
Liu, Y., Richardson, J. D., Belcher, J. W., Kasper, J. C., and Skoug, R. M.: Plasma depletion and mirror waves ahead of interplanetary coronal mass ejections, J. Geophys. Res.-Space Phys., 111, A09108, https://doi.org/10.1029/2006JA011723, 2006. a, b, c
Liu, Y., Richardson, J. D., Belcher, J. W., and Kasper, J. C.: Temperature Anisotropy in a Shocked Plasma: Mirror-Mode Instabilities in the Heliosheath, Astrophys. J. Lett., 659, L65–L68, https://doi.org/10.1086/516568, 2007. a
Lucek, E. A., Dunlop, M. W., Balogh, A., Cargill, P., Baumjohann, W., Georgescu, E., Haerendel, G., and Fornacon, K.-H.: Mirror mode structures observed in the dawn-side magnetosheath by Equator-S, Geophys. Res. Lett., 26, 2159–2162, https://doi.org/10.1029/1999GL900490, 1999. a
Lugaz, N., Farrugia, C. J., Winslow, R. M., Al-Haddad, N., Kilpua, E. K. J., and Riley, P.: Factors affecting the geoeffectiveness of shocks and sheaths at 1 AU, J. Geophys. Res.-Space Phys., 121, 10, https://doi.org/10.1002/2016JA023100, 2016. a, b
Manchester, IV, W. B., Gombosi, T. I., De Zeeuw, D. L., Sokolov, I. V., Roussev, I. I., Powell, K. G., Kóta, J., Tóth, G., and Zurbuchen, T. H.: Coronal Mass Ejection Shock and Sheath Structures Relevant to Particle Acceleration, Astrophys. J., 622, 1225–1239, https://doi.org/10.1086/427768, 2005. a
Müller, D., Marsden, R. G., St. Cyr, O. C., and Gilbert, H. R.: Solar Orbiter . Exploring the Sun-Heliosphere Connection, Solar Phys., 285, 25–70, https://doi.org/10.1007/s11207-012-0085-7, 2013. a
Ogilvie, K. W., Chornay, D. J., Fritzenreiter, R. J., Hunsaker, F., Keller, J., Lobell, J., Miller, G., Scudder, J. D., Sittler, Jr., E. C., Torbert, R. B., Bodet, D., Needell, G., Lazarus, A. J., Steinberg, J. T., Tappan, J. H., Mavretic, A., and Gergin, E.: SWE, A Comprehensive Plasma Instrument for the Wind Spacecraft, Space Sci. Rev., 71, 55–77, https://doi.org/10.1007/BF00751326, 1995. a
Oliveira, D. M. and Raeder, J.: Impact angle control of interplanetary shock geoeffectiveness, J. Geophys. Res.-Space Phys., 119, 8188–8201, https://doi.org/10.1002/2014JA020275, 2014. a, b
Osmane, A., Dimmock, A. P., and Pulkkinen, T. I.: Universal properties of mirror mode turbulence in the Earth's magnetosheath, Geophys. Res. Lett., 42, 3085–3092, https://doi.org/10.1002/2015GL063771, 2015. a, b, c, d, e
Palmerio, E., Kilpua, E. K. J., and Savani, N. P.: Planar magnetic structures in coronal mass ejection-driven sheath regions, Ann. Geophys., 34, 313–322, https://doi.org/10.5194/angeo-34-313-2016, 2016. a, b
Reames, D. V.: Particle acceleration at the Sun and in the heliosphere, Space Sci. Rev., 90, 413–491, https://doi.org/10.1023/A:1005105831781, 1999. a
Russell, C. T., Le, G., Schwingenschuh, K., Riedler, W., and Eroshenko, E.: Mirror mode waves at Comet Halley, Washington D.C. American Geophysical Union Geophysical Monograph Series, 61, 161–169, https://doi.org/10.1029/GM061p0161, 1991. a
Russell, C. T., Blanco-Cano, X., Jian, L. K., and Luhmann, J. G.: Mirror-mode storms: STEREO observations of protracted generation of small amplitude waves, Geophys. Res. Lett., 36, L05106, https://doi.org/10.1029/2008GL037113, 2009. a, b
Ruxton, G. D.: The unequal variance t-test is an underused alternative to Student's t test and the Mann-Whitney U test, Behav. Ecol., 17, 688–690, https://doi.org/10.1093/beheco/ark016, 2006. a
Schmid, D., Volwerk, M., Plaschke, F., Vörös, Z., Zhang, T. L., Baumjohann, W., and Narita, Y.: Mirror mode structures near Venus and Comet P/Halley, Ann. Geophys., 32, 651–657, https://doi.org/10.5194/angeo-32-651-2014, 2014. a, b, c
Shoji, M., Omura, Y., and Lee, L.-C.: Multidimensional nonlinear mirror-mode structures in the Earth's magnetosheath, J. Geophys. Res.-Space Phys., 117, A08208, https://doi.org/10.1029/2011JA017420, 2012. a
Siscoe, G. and Odstrcil, D.: Ways in which ICME sheaths differ from magnetosheaths, J. Geophys. Res.-Space Phys., 113, A00B07, https://doi.org/10.1029/2008JA013142, 2008. a, b
Siscoe, G., MacNeice, P. J., and Odstrcil, D.: East-west asymmetry in coronal mass ejection geoeffectiveness, Space Weather, 5, S04002, https://doi.org/10.1029/2006SW000286, 2007. a
Siu-Tapia, A., Blanco-Cano, X., Kajdic, P., Aguilar-Rodriguez, E., Russell, C. T., Jian, L. K., and Luhmann, J. G.: Low-frequency waves within isolated magnetic clouds and complex structures: STEREO observations, J. Geophys. Res.-Space Phys., 120, 2363–2381, https://doi.org/10.1002/2014JA020568, 2015. a
Sonnerup, B. U. O. and Cahill Jr., L. J.: Magnetopause Structure and Attitude from Explorer 12 Observations, J. Geophys. Res., 72, 171, https://doi.org/10.1029/JZ072i001p00171, 1967. a
Soucek, J., Lucek, E., and Dandouras, I.: Properties of magnetosheath mirror modes observed by Cluster and their response to changes in plasma parameters, J. Geophys. Res.-Space Phys., 113, A04203, https://doi.org/10.1029/2007JA012649, 2008. a, b, c, d, e, f, g
Soucek, J., Escoubet, C. P., and Grison, B.: Magnetosheath plasma stability and ULF wave occurrence as a function of location in the magnetosheath and upstream bow shock parameters, J. Geophys. Res.-Space Phys., 120, 2838–2850, https://doi.org/10.1002/2015JA021087, 2015. a, b, c, d, e, f, g
Tátrallyay, M. and Erdős, G.: The evolution of mirror mode fluctuations in the terrestrial magnetosheath, Planet. Space Sci., 50, 593–599, https://doi.org/10.1016/S0032-0633(02)00038-7, 2002. a
Tátrallyay, M. and Erdős, G.: Statistical investigation of mirror type magnetic field depressions observed by ISEE-1, Planet. Space Sci., 53, 33–40, https://doi.org/10.1016/j.pss.2004.09.026, 2005. a, b, c
Tsurutani, B. T., Smith, E. J., Anderson, R. R., Ogilvie, K. W., Scudder, J. D., Baker, D. N., and Bame, S. J.: Lion roars and nonoscillatory drift mirror waves in the magnetosheath, J. Geophys. Res.-Space Phys., 87, 6060–6072, https://doi.org/10.1029/JA087iA08p06060, 1982. a
Tsurutani, B. T., Smith, E. J., Gonzalez, W. D., Tang, F., and Akasofu, S. I.: Origin of interplanetary southward magnetic fields responsible for major magnetic storms near solar maximum (1978–1979), J. Geophys. Res., 93, 8519–8531, https://doi.org/10.1029/JA093iA08p08519, 1988. a
Tsurutani, B. T., Lakhina, G. S., Smith, E. J., Buti, B., Moses, S. L., Coroniti, F. V., Brinca, A. L., Slavin, J. A., and Zwickl, R. D.: Mirror mode structures and ELF plasma waves in the Giacobini-Zinner magnetosheath, Nonlin. Processes Geophys., 6, 229–234, https://doi.org/10.5194/npg-6-229-1999, 1999. a, b
Tsurutani, B. T., Echer, E., Verkhoglyadova, O. P., Lakhina, G. S., and Guarnieri, F. L.: Mirror instability upstream of the termination shock (TS) and in the heliosheath, J. Atmos. Sol.-Terr. Phy., 73, 1398–1404, https://doi.org/10.1016/j.jastp.2010.06.007, 2011a. a, b
Tsurutani, B. T., Lakhina, G. S., Verkhoglyadova, O. P., Echer, E., Guarnieri, F. L., Narita, Y., and Constantinescu, D. O.: Magnetosheath and heliosheath mirror mode structures, interplanetary magnetic decreases, and linear magnetic decreases: Differences and distinguishing features, J. Geophys. Res.-Space Phys., 116, A02103, https://doi.org/10.1029/2010JA015913, 2011b. a, b, c, d, e, f
Volwerk, M., Zhang, T. L., Delva, M., Vörös, Z., Baumjohann, W., and Glassmeier, K.-H.: Mirror-mode-like structures in Venus' induced magnetosphere, J. Geophys. Res.-Planets, 113, E00B16, https://doi.org/10.1029/2008JE003154, 2008. a
Volwerk, M., Schmid, D., Tsurutani, B. T., Delva, M., Plaschke, F., Narita, Y., Zhang, T., and Glassmeier, K.-H.: Mirror mode waves in Venus's magnetosheath: solar minimum vs. solar maximum, Ann. Geophys., 34, 1099–1108, https://doi.org/10.5194/angeo-34-1099-2016, 2016. a
von Steiger, R. and Richardson, J. D.: ICMEs in the Outer Heliosphere and at High Latitudes: An Introduction, Space Sci. Rev., 123, 111–126, https://doi.org/10.1007/s11214-006-9015-z, 2006. a
Wang, G. Q., Zhang, T. L., Volwerk, M., Schmid, D., Baumjohann, W., Nakamura, R., and Pan, Z. H.: Mirror mode structures ahead of dipolarization front near the neutral sheet observed by Cluster, Geophys. Res. Lett., 43, 8853–8858, https://doi.org/10.1002/2016GL070382, 2016GL070382, 2016. a
Welch, B. L.: The Significance of the Difference Between Two Means when the Population Variances are Unequal, Biometrika, 29, 350–362, https://doi.org/10.2307/2332010, 1938. a
Winterhalter, D., Neugebauer, M., Goldstein, B. E., Smith, E. J., Bame, S. J., and Balogh, A.: ULYSSES field and plasma observations of magnetic holes in the solar wind and their relation to mirror-mode structures, J. Geophys. Res., 99, 23, https://doi.org/10.1029/94JA01977, 1994. a, b
Zhang, T. L., Russell, C. T., Baumjohann, W., Jian, L. K., Balikhin, M. A., Cao, J. B., Wang, C., Blanco-Cano, X., Glassmeier, K.-H., Zambelli, W., Volwerk, M., Delva, M., and Vörös, Z.: Characteristic size and shape of the mirror mode structures in the solar wind at 0.72 AU, Geophys. Res. Lett., 35, L10106, https://doi.org/10.1029/2008GL033793, 2008. a, b, c
Zhang, T. L., Baumjohann, W., Russell, C. T., Jian, L. K., Wang, C., Cao, J. B., Balikhin, M., Blanco-Cano, X., Delva, M., and Volwerk, M.: Mirror mode structures in the solar wind at 0.72 AU, J. Geophys. Res.-Space Phys., 114, A10107, https://doi.org/10.1029/2009JA014103, 2009. a, b, c, d