the Creative Commons Attribution 4.0 License.
the Creative Commons Attribution 4.0 License.
Evaluation of the NeQuick model performance under different geomagnetic conditions over South Africa during the ascending phase of the solar cycle (2009–2012)
Sylvain M. Ahoua
John Bosco Habarulema
Olivier K. Obrou
Pierre J. Cilliers
Zacharie K. Zaka
In order to provide a scientific base to the NeQuick characterisation under disturbed conditions, the comparison of its performance for quiet and storm days is investigated in the southern mid-latitude. This investigation was realised using the two versions of the NeQuick model which were adapted to local and storm-specific response by using the critical frequency of the F2 layer (foF2) and the propagation factor (M(3000)F2) derived from three South African ionosonde measurements, Hermanus (34.40∘ S, 19.20∘ E), Grahamstown (33.30∘ S, 26.50∘ E) and Louisvale (28.50∘ S, 21.20∘ E). The number of free electrons contained within a 1 m squared column section known as total electron content (TEC) is a widely used ionospheric parameter to estimate its impact on the radio signal passing through. In this study, the TEC derived from the adapted NeQuick version is compared with observed TEC derived from Global Navigation Satellite System (GNSS) data from co-located or nearby GNSS dual-frequency receivers. The Hermanus K-index is used to select all the disturbed days (K-index ≥ 5) upon moving from low to high solar activity (from 2009 to 2012). For each disturbed day, a quiet reference day of the same month was chosen for the investigation. The study reveals that the NeQuick model shows similar reliability for both magnetic quiet and disturbed conditions, but its accuracy is affected by the solar activity. The model is much better for moderate solar activity epochs (2009 and 2010), while it exhibits a discrepancy with observations during high solar activity epochs. For instance in Hermanus, the difference between GPS TEC and NeQuick TEC (ΔTEC) is generally lower than 10 TECu in 2009, and it sometimes reaches 20 TECu in 2011 and 2012. It is also noticed that NeQuick 2 is more accurate than NeQuick 1, with an improvement in TEC estimation more significant for the high solar activity epochs. The improvement realised in the latest version of NeQuick is more than 15 % and sometimes reaches 50 %.
Keywords. Ionosphere (mid-latitude ionosphere; modelling and forecasting)
- Article
(4604 KB) - Full-text XML
- BibTeX
- EndNote
The accuracy of the Global Positioning System (GPS) in particular and the GNSS in general is affected by several factors such as the troposphere, multipath and the ionosphere. The ionosphere is the cause of the largest errors in an open-sky scenario and can cause an error in the positioning of about 100 m (Bidaine and Warnant, 2007). Indeed, the ionosphere induces a group time delay and phase advance of GNSS signals (Aragón-Ángel et al., 2005). It is shown (Bidaine and Warnant, 2007; Hofmann-Whellenhof et al., 1997) that the delay is proportional to the total electron content (TEC) and the inverse of the square of the carrier frequency defined as follows:
where dt is the time delay expressed in seconds, c the speed of light in the vacuum ( m s−1), f the signal frequency in Hz, and TEC in TECu (1 TECu = 1016 electrons m−2).
Knowing the TEC permits one to estimate the impact of the ionospheric error on GNSS position estimation. Taking advantage of the dispersive property of the ionosphere, the use of dual-frequency signals (L1 at 1575.42 MHz and L2 at 1227.60 MHz) allows estimation to first order of the ionospheric delay. The ionospheric error in GNSS position estimation can be mitigated by the use of augmentation systems like the Ground Based Augmentation System (GBAS) and the Space Based Augmentation System (SBAS). These systems broadcast ionospheric correction messages to the GNSS receiver according to its localisation. This technique, which can be used by both single- and dual-frequency receivers, requires more complex and expensive receivers (Angrisano et al., 2013). The easiest way for single-frequency (SF) receivers to compensate for the ionospheric error is to rely on an ionospheric correction algorithm based on existing models such as the Klobuchar and NeQuick models (Aragón-Ángel and Zürn, 2006; European GNSS, 2015). These models are used to provide the TEC corrections for SF GNSS receivers. Like any ionospheric model, NeQuick is regularly evaluated regarding its dependence on different parameters which affect the ionosphere such as the geographic (or geomagnetic) coordinates, the solar activity, the season and the time of day. In the preliminary study of NeQuick as a model for ionospheric effect mitigation, Aragón-Ángel et al. (2005) adapted the model to a daily feature by using the effective ionisation level Az computed from GNSS data from selected IGS monitor stations. They revealed that the model was affected by the geographical distribution of the monitor stations. Later, Bidaine and Warnant (2007), constraining the model to a daily behaviour by means of ionosonde-derived foF2 and M(3000), at the northern mid-latitude, reported that both versions of NeQuick were providing the TEC with a root mean square (rms) error higher than 5 TECu during the year of high solar activity and lower than 4 TECu for the year of solar minimum. They also revealed that the use of NeQuick provided a significant improvement on the accuracy of the TEC estimates during the solar maximum. However, in their study, these authors have selected only data from days that were considered to be geomagnetically quiet since they did not expect the model to perform well during disturbed days. Using 10 international geomagnetic quiet days, Kumar et al. (2015) evaluated three topside options of the IRI-2012 model topside at five stations situated around the same longitude from low to mid latitudes. During this study, which covered different solar activity (from minimum to maximum), it was revealed that the IRI with the NeQuick topside option shown good agreement with GPS TEC in 2009, in all seasons. For years of maximum solar activity (2012–2013), the IRI using NeQuick as the topside option has a performance depending on the season. In the African equatorial sector, Nigussie et al. (2013) noticed that NeQuick 2 was more accurate during epochs with moderate solar activity than during epochs characterised by low solar activity. Ahoua et al. (2014) investigated the performance of NeQuick 1 (NeQuick ITU-R) in modelling the daily TEC over the South African region, taking into account both solar and magnetic conditions. It was reported that NeQuick 1 did not perform well during the epochs of maximum solar activity. However, the study was limited to only one location (Hermanus; 34.40∘ S, 19.20∘ E), and only 3 disturbed days were evaluated. The present work investigates the accuracy of NeQuick over a wider geographic latitude range than Ahoua et al. (2014) and over a larger number of disturbed days. To extend the verification of NeQuick over a larger geographic range the data from two other ionosonde stations in South Africa are considered. To select the disturbed days, the Hermanus K-index was used instead of the Dst index as done by Ahoua et al. (2014). The improvements in TEC estimation over the region of interest which is afforded by the NeQuick 2 model are evaluated by comparison with the corresponding predictions of the NeQuick 1 model.
The NeQuick and Klobuchar models are the bases of algorithms used for mitigating the ionospheric effects on GNSS signals (Aragón-Ángel and Zürn, 2006; European GNSS, 2015; Prieto-Cerdeira et al., 2014). These models are incorporated into SF receivers in order to estimate the TEC along the ray path of the signal from the satellite to the receiver. It has been revealed that the Klobuchar model, the one currently used by GPS SF receivers, is able to reduce the ionospheric-induced error to about 50 % (Radicella et al., 2008). The NeQuick model, which is presented as being more efficient than the Klobuchar model (Radicella et al., 2008), is used by the Galileo SF receivers for mitigating ionospheric-induced error. In contrast to the Klobuchar model, which simplifies the ionosphere as being a thin single layer localised at the ionospheric pierce point (IPP) at 350 km in altitude (Radicella et al., 2008), NeQuick is a three-dimensional model. It provides the electron density profile along the ray path and calculates the TEC by numerical integration.
Developed at the Telecommunication and Information & Communication Technology for Development (T/ICT4D) laboratory of the Abdus Salam International Centre for Theoretical Physics (ICTP) in cooperation with the Institute for Geophysics, Astrophysics and Meteorology (IGAM) of the University of Graz, Austria, NeQuick is fully described in many articles (Hochegger et al., 2000; Leitinger et al., 2005; Radicella et al., 2008; Bidaine and Warnant, 2007). This quick-run model, presented as suitable for trans-ionospheric applications (Nava et al., 2008; Radicella, 2009), is widely used internationally for scientific purposes as well as for the determination of ionospheric effects on satellite navigation and positioning systems. In the framework of navigation system assessment by the European Space Agency, NeQuick was used to model a realistic ionosphere. The model relies on anchor points and thickness parameters to establish the ionospheric vertical density profile. Table 1 gives the list of the anchor points and thickness parameters used by the NeQuick model. These parameters are defined by providing to the model the following ionospheric parameters recorded by an ionosonde: the critical frequency of the E, F1 and F2 layers (foE, foF1 and foF2 respectively) and M(3000)F2. The original or default NeQuick model is a climatological model. It uses empirical ionospheric parameters and provides monthly median output (Bidaine and Warnant, 2010). As emphasised by Angrisano et al. (2013), an ionospheric correction model has to have a daily output. For Galileo SF, NeQuick G (Galileo), the adaptation of the NeQuick model to real time, is governed by the effective ionisation level parameter called Az (Eq. 2) (Aragón-Ángel et al., 2005; Radicella et al., 2008).
μ is the modip and a0, a1, and a2 are coefficients broadcast to Galileo single-frequency receivers through the navigation message.
The Az coefficients contain information on the daily solar activity and the local condition (European GNSS, 2015; Prieto-Cerdeira et al., 2014). In this present assessment, by means of the data ingestion technique (Nava et al., 2011), the daily and local modifications of the model are acquired by the use of locally recorded ionosonde and geomagnetic data.
NeQuick being an empirical model, the growing inventory of topside and in situ ionospheric data (ISIS2, IK19 and Cosmos 1809 satellites) was applied to facilitate some significant changes (Coïsson et al., 2006; Leitinger et al., 2005) which led to the release of NeQuick 2. The model is written in the Fortran 77 language. The source code of NeQuick 2 is available at https://www.itu.int/dms_pubrec/itu-r/rec/p/R-REC-P.531-12-201309-S!!ZIP-E.zip (last access: 18 August 2018). An online option of NeQuick 2 is also accessible at http://t-ict4d.ictp.it/nequick2/nequick-2-web-model (last access: 18 August 2018).
The ionosonde data used in this present study have been collected from three South African digisonde stations. There are GPS dual-frequency reference stations which are close by or co-located with each of the ionosonde stations (see Table 2).
Only foF2 and M(3000)F2 ionosonde values have been used to run the NeQuick model, thus ingesting these experimental parameters into the model. The other model parameters (foE and foF1) are calculated by the NeQuick program using its empirical relations since they do not appear most of the time in the ionograms (Bidaine and Warnant, 2010). The ionosonde parameters obtained after a manual scaling are used as input parameters for the NeQuick model to provide TEC, called NeQ1 TEC and NeQ2 TEC respectively for NeQuick 1 and NeQuick 2. In order to take into account the solar activity, the daily solar flux F10.7 is used to feed the NeQuick model. The modelled TEC was compared to the TEC derived from the data of co-located or nearby GPS receivers. The GPS data are stored in Receiver Independent Exchange format (RINEX) and the TEC (GPS TEC) values are determined using the program developed at Boston College (Adebiyi et al., 2014). The retrieval of TEC from GPS measurements is subject to biases due to the transmitter (satellite) and receiver hardware. These biases are estimated and eliminated during the processing by the software. This software has been used in many studies to compute the observed TEC from dual-frequency GPS receiver observations (Sharma et al., 2017; Abba et al., 2015; Ndeda and Odera, 2014; Ngwira et al., 2013; D'ujanga et al., 2012; Adebiyi et al., 2014). The output allows the user to obtain detailed data such as elevation angles and the vertical TEC of each satellite as seen from the GPS receiver. The vertical TEC (VTEC) computed exclusively from satellites with elevation angles above 50∘ is selected. This selection excludes ionospheric pierce points (IPPs) too far from the vertical at the ionosonde location. This reduces the impact of the mapping function from the measured slant TEC to the estimated vertical TEC (Fig. 1).
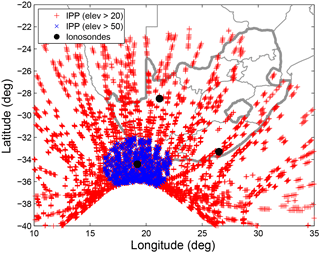
Figure 1Distribution of GPS IPPs over Hermanus ionosonde station for all the selected days in 2012. The IPPs presented are those of each hour.
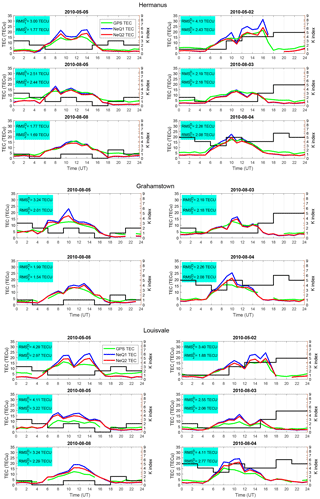
Figure 2Comparison between GPS TEC, NeQuick 1 TEC (NeQ1 TEC) and NeQuick 2 TEC (NeQ2 TEC) for 2010. The geomagnetic condition is represented by the K-index indicated by the black line (left: K<4, right: K≥5). The rms calculated as defined in Eq. (4) is also indicated.
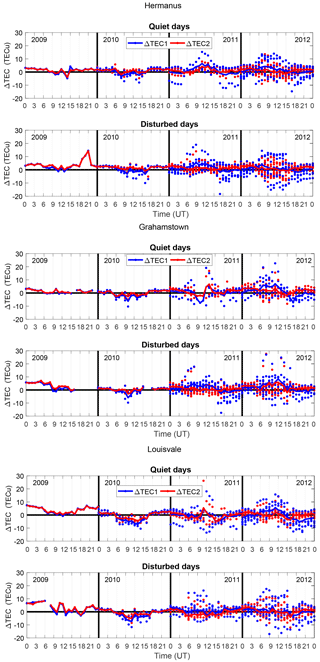
Figure 3The difference between GPS TEC and NeQuick 1 TEC (ΔTEC1) and between GPS TEC and NeQuick 2 TEC (ΔTEC2). The dotted marks represent the ΔTEC of each selected day, while the solid line represents the average of all those ΔTEC.
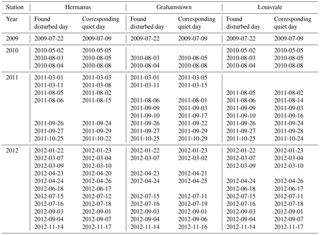
In order to examine the model under different ionospheric conditions and according to the availability of ionosonde data, the analysis was limited to the period from 2009 to 2012. Within this period the solar activity recorded includes a minimum, moderate and maximum level. These solar activity levels were classified according to the solar flux F10.7 which varies from 68 to 153 sfu. The Hermanus K-index was used to select the geomagnetic condition. The days with a K-index ≥5 were considered disturbed (Uwamahoro and Habarulema, 2014). For each disturbed day found, a quiet day based on data availability in the same month was selected for the comparative study according to the geomagnetic state (Table 3). For the statistical analysis the following formulas were used.
The TEC difference (ΔTEC) is calculated as follows:
The daily root mean square (RMS) is inferred using the following equation:
where n is the number of available hours and the subscript i indicates the NeQuick model used.
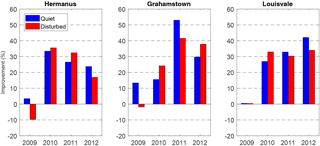
Figure 5The improvement of NeQuick 2 as compared to NeQuick 1 averaged over all selected days for each year considered.
To infer the yearly root mean square (RMS), representing the overall rms of the selected days of the concerned year, the following equation is used:
where N is the number of selected days.
The improvement P obtained by using NeQuick 2 relative to NeQuick 1 is
Figure 2 presents the results of the assessment above Hermanus, Grahamstown and Louisvale stations for 2010. In these figures, the plots related to days within the same column share the same geomagnetic condition, while the plots in every row represent the hourly TEC of 2 days of the same month. In most of the cases regardless of the magnetic condition, the adapted NeQuick and the GPS TEC show peaks at the same time. The daily rms values indicated in each plot show that the models have a similar performance during quiet (left) and disturbed (right) days. For example, for Louisvale in 2010 NeQuick 1 is more accurate on disturbed days 2 May and 3 August 2010 (rms = 3.40 and 2.55 TECu respectively) than on quiet days 5 May and 5 August 2010 (rms = 4.29 and 4.11 TECu respectively). The opposite is observed in other cases; for instance, the model is less accurate on disturbed day 4 August 2010 (rms = 4.11 TECu) than on quiet day 8 August 2010 (rms = 3.24 TECu). Equally with NeQuick 2 the same trend as for the geomagnetic state is observed. Similar observations are noticed for the other locations considered. The daily rms values also reveal that the TEC delivered using NeQuick 2 is closer to GPS TEC than NeQuick 1 TEC since for each day in 2010, RMS2 is smaller than RMS1. Figure 3 shows the difference between the NeQuick TEC and the GPS TEC for each of the selected days of the analysed years (2009, 2010, 2011 and 2012). These plots revealed that the discrepancy between the GPS TEC and the NeQuick TEC is higher during the period from 08:00 to 14:00 UT (10:00 to 16:00 LT). We stress that it is within this time period situated around the local noon that the TEC has its highest values. It can be noted that there is a better match between the model and observations in 2009 and 2010 (years of solar minimum) than in 2011 and 2012 (years of solar maximum). It is important to point out that only 1 disturbed day was recorded in 2009; therefore, the results of this year have a very low statistical significance. The extent of the models in overestimating/underestimating is better appreciated by focusing on the averaged TEC difference depicted in Fig. 3. Considering the time of day, it can be observed that the models show overestimations and underestimations of the TEC without any consistent trend, except from 08:00 to 14:00 UT in 2010, where the TEC is generally overestimated (ΔTEC<0). From one year to another, we observe this same trend, except in 2009, for which the models generally underestimate the TEC (ΔTEC>0).
Focusing on the dependence of ΔTEC on solar activity, the performance of NeQuick 1 is generally better for days of solar minimum (2009) and solar moderate activity (2010) years than for days of solar maximum (2011 and 2012) during which a prominent discrepancy stands out clearly. Indeed, while for 2009 and 2010 |ΔTEC| is lower than 10 TECu except from 18:00 to 22:00 UT in 2009 in Hermanus (Fig. 3), higher values of |ΔTEC| (sometimes reaching 20 TECu) are present for 2011 and 2012. For NeQuick 2, though the same tendency is generally observed, a reduction of the gap between the performance of the model during the solar maximum and the two lower solar activity epochs is noticed.
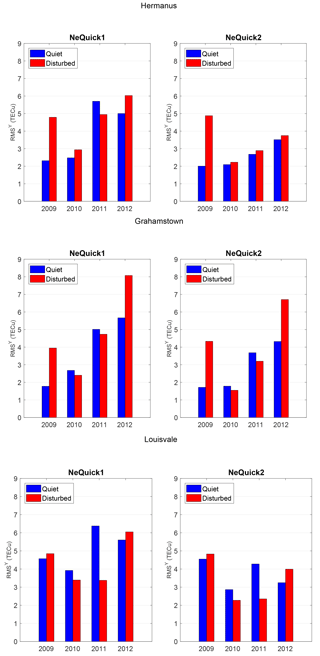
For a more thorough analysis, the rms errors inferred from each hour of the selected days of the concerned year are presented in Fig. 4. This latter figure confirms the previous raw observations. Thus, it reveals that the accuracy of both NeQuick models in following the TEC trend is similar for quiet (blue) and disturbed (red) geomagnetic states. Except in Hermanus, it is noticed that there are 2 years in which the model is better during quiet days (2010 and 2011) and 2 years where the opposite is observed (2009 and 2012). It is clearly observed that NeQuick 1 offers high rms values during solar maximum years (2011 and 2012), while the rms inferred during these solar maximum years using NeQuick 2 undergoes a decrease. The last figure (Fig. 5) allows us to estimate the improvement realised while updating NeQuick 1 to NeQuick 2. It is noticed that NeQuick 2 is more accurate than NeQuick 1. In almost all years a positive improvement is recorded. This improvement realised can be more than 30 % (Hermanus, 2011: 55 %; Grahamstown, 2010: 33 % and Louisvale, 2012: 42 %).
The accuracy of the NeQuick model in estimating TEC over the southern African region was assessed in this study. In order to carry out this investigation, the TEC modelled was compared by means of the two versions of NeQuick with the TEC derived from the GPS observations from the same location under different geomagnetic and solar conditions. Focusing on the first version of the NeQuick model (NeQuick 1), it has been noticed that the model has encountered some deficiency during the years of solar maximum. This report confirms the results of the earlier study performed by Bidaine and Warnant (2007) in the European sector. With more selected quiet days, Bidaine and Warnant (2007) found rms errors of NeQuick 1 higher in a high solar activity year (7.7 TECu) than in low solar activity (3.8 TECu). In our case the same tendency was observed. While rms values are higher than 5 TECu during the high solar activity years (2011 and 2012), they are lower than 4.6 TECu during low solar activity years (2009 and 2010) for all the selected locations. Including the latest version (NeQuick 2), Bidaine and Warnant (2007) also found that both versions have better performance during the low solar activity period (RMS<3.5 TECu) than during the high solar activity period (RMS>5.1 TECu). This present study confirms this result (except for the year 2009). While for 2010 (solar moderate year) the rms is always smaller than 4 TECu, it can reach 6 TECu in 2011 and 2012 (solar maximum years). Knowing that the highest TEC values are recorded during high solar activity, it can be stated that the accuracy of NeQuick decreases with the increase in TEC value. Also, it is observed that the discrepancy between the NeQuick TEC (both versions) and GPS TEC was higher around the local noon, which is the period when the TEC reaches its highest values. Those two observations led us to conclude that the accuracy of the NeQuick model was proportional to the TEC value. In a comparative study of both versions, it is observed that NeQuick 2 is generally more accurate than NeQuick 1. The improvement realised in the latest version of NeQuick can reach 50 %. This improvement is more pronounced during years with a high solar activity (above 15 % in 2011 and 2012 for all stations). Those results are in agreement with the investigation carried out by Bidaine and Warnant (2007) for the northern mid-latitude during quiet days. They showed that NeQuick 2 is more accurate than NeQuick 1, with a more significant improvement in solar maximum (67.3 %) than in solar minimum (56.2 %). For the obtained results it can be observed that on disturbed days NeQuick 2 is better than NeQuick 1, except in 2009 (probably for the reason mentioned above). For this assessment realised within the southern African region, it is noticed that the models have similar performances for the three selected locations. We found that the model, after being adjusted by foF2 and M(3000)F2 inferred from ionosonde electron density profiles, gives a similar correlation with GPS TEC during quiet and disturbed conditions. The NeQuick model, which has been chosen for the correction of ionospheric errors in position estimation by means of Galileo SF receivers, appears to be sufficiently accurate for operations which do not involve human safety. For the improvement of the model the algorithm for the calculation of TEC values, particularly around local noon, should be improved.
We acknowledge the National Geo-spatial Information, South Africa, for operating and maintaining the TrigNet receiver network and making GPS observational data freely available via ftp access at ftp://ftp.trignet.co.za (last access: 18 August 2018). Data from the South African Ionosonde network are made available through the South African National Space Agency (SANSA), who are acknowledged for facilitating and coordinating the continued availability of data. South African Ionosonde data can also be freely accessible to the public from the Digital Ionogram DataBase through http://ulcar.uml.edu/DIDBase (last access: 18 August 2018).
SMA modified the NeQuick model code (data ingestion technique) and performed the simulations. JBH provided the software to extract the GPS TEC and explained its use. He proposed the study. OKO proposed the model of the study (NeQuick model) and the method of investigation (ionospheric data ingestion). PJC proposed the purpose of the investigation (investigate the NeQuick model under different geomagnetic conditions). ZKZ proposed the figure comments. SMA prepared the manuscript with contributions from all co-authors.
The authors declare that they have no conflict of interest.
Sylvain M. Ahoua is very grateful to the South African National Space Agency
(SANSA) Space Science Directorate for their financial support and hospitality
through the visiting graduate research programme. The authors also express
their acknowledgements to the T/ICT4D Laboratory of the ICTP, Trieste, Italy,
for providing the source codes of NeQuick 1 and NeQuick 2. Finally, the
authors would like to extend their gratitude to the South African TrigNet
network and to Boston College for providing respectively GPS data and GPS TEC
software.
The topical editor, Dalia
Buresova, thanks Pierdavide Coïsson and one anonymous referee for help in
evaluating this paper.
Abba, I., Abidin, W. A. W. Z., Masri, T., Ping, K. H., Muhammad, M. S., and Pai, B. V.: Ionospheric effects on GPS signal in Low-Latitude region: a case study review of south East Asia and Africa, Niger, J. Technol., 34, 523–529, 2015. a
Adebiyi, S. J., Adimula, I. A., Oladipo, O. A., Ikubanni, S. O., Adebesin, B. O., and Joshua, B. W.: GPS derived TEC and foF2 variability at an equatorial station and the performance of IRI-model, Adv. Space Res., 54, 565–575, https://doi.org/10.1016/j.asr.2014.03.026, 2014. a, b
Ahoua, S. M., Cilliers, P. J., Obrou, O. K., and Habarulema, J. B.: Evaluation of the NeQuick model in Southern mid-latitudes using South African co-located GPS and Ionosonde stations data, in: Proceedings of SAIP 2013, the 58th Annual Conference of the South African Institute of Physics, University of Zululand, South Africa, 8–12 July 2013, 398–403, 2014. a, b, c
Angrisano, A., Gaglione, S., Gioia, C., Massaro, M., and Robustelli, U.: Assessment of NeQuick ionospheric model for single-frequency users, Acta Geophys., 61, 1457–1476, 2013. a, b
Aragón-Ángel, A. and Zürn, M.: Software prototype for the Galileo Ionospheric Correction Model, Progress Report, EUR 28117EN, https://doi.org/10.2788/835895, 2006. a, b
Aragón-Ángel, A., Orús, R. M., Hernández-Pajares, M., Juan, J. M., and Sanz, J.: Preliminary NeQuick assessment for future single frequency users of GALILEO, in: Proceedings of the 6th Geomatic Week, Barcelona, 2005. a, b, c
Bidaine, B. and Warnant, R.: Assessment of the NeQuick Model at mid-latitudes using GPS TEC and Ionosonde Data, in: Proc. 1st Colloquium Scientific and Fundamental Aspects of the Galileo Programme [CD-Rom], Noordwijk, the Netherlands, 2007. a, b, c, d, e, f, g, h
Bidaine, B. and Warnant, R.: Assessment of the NeQuick model at mid-latitudes using GNSS TEC and ionosonde data, Adv. Space Res., 45, 1122–1128, 2010. a, b
Coïsson, P., Radicella, S. M., Leitinger, R., and Nava, B.: Topside electron density in IRI and NeQuick: features and limitations, Adv. Space Res., 37, 937–942, 2006. a
D'ujanga, F. M., Baki, P., Olwendo, J. O., and Twinamasiko, B. F.: Total electron content of the ionosphere at two stations in East Africa during the 24–25 October 2011 geomagnetic storm, Adv. Space Res., 51, 712–721, 2012. a
European GNSS (Galileo) open service: Ionospheric correction algorithm for Galileo single frequency users single frequency users, Tech. Rep. 1.1, European Union, available at: https://doi.org/10.2873/685913, 2015. a, b, c
Hochegger, G., Nava, B., Radicella, S. M., and Leitinger, R.: A family of ionospheric models for different uses, Phys. Chem. Earth Pt. C, 25, 307–310, 2000. a
Hofmann-Wellenhof, B., Lichtenegger, H., and Collins, J.: Global Positioning System, Theory and Practice, 4th Edn., Springer-Verlag, Wien, New York, 1997. a
Kumar, S., Tan, E. L., and Murti, D. S.: Impacts of solar activity on performance of the IRI-2012 model predictions from low to mid latitudes Earth, Planets and Space, 67–42, https://doi.org/10.1186/s40623-015-0205-3, 2015. a
Leitinger, R., Zhang, M. L., and Radicella, S. M.: An improved bottomside for the ionospheric electron density model NeQuick, Ann. Geophys.-Italy, 48, 525–534, 2005. a, b
Nava, B., Coïsson, P., and Radicella, S. M.: A new version of the NeQuick ionosphere electron density mode, J. Atmos. Sol.-Terr. Phy., 70, 1856–1862, 2008a. a
Nava, B., Radicella, S. M., and Azpilicueta, F.: Data ingestion into NeQuick 2, Radio Sci., 46, RSOD17, https://doi.org/10.1029/2010RS004635, 2011. a
Ndeda, J. O. H. and Odera, P. O.: Analysis of longitudinal advancement of the peak total electron content in the African equatorial anomaly region using data from GPS receivers and GIS stations in Kenya, Appl. Phys. Res., 6, 19–25, 2014. a
Ngwira, C. M., Seemala, G. K., and Habarulema, J. B.: Simultaneous observations of ionospheric irregularities in the African low-latitude region, J. Atmos. Sol.-Terr. Phy., 97, 50–57, 2013. a
Nigussie, M., Radicella, S. M., Damtie, B., Nava, B., Yizengaw, E., and Groves, K.: Validation of the NeQuick 2 and IRI-2007 models in East-African equatorial region, J. Atmos. Sol.-Terr. Phy., 102, 26–33, https://doi.org/10.1016/j.jastp.2013.04.016, 2013. a
Prieto-Cerdeira, R., Orús-Pérez, R., Breeuwer, E., Lucas-Rodriguez, R., and Falcone, M.: Performance of the Galileo single-frequency ionospheric correction during in-orbit validation, GPS World Innovation, 2014. a, b
Radicella, S. M.: The NeQuick model genesis, uses and evolution, Ann. Geophys.-Italy, 52, 417–422, 2009. a
Radicella, S. M., Nava, B., and Coïsson, P.: Ionospheric Models for GNSS Single Frequency Range Delay Corrections, Física de la Tierra, 20, 27–39, 2008. a, b, c, d, e
Sharma, G., Champati, P. K., Mohanty, S., and Kannaujiya, S.: Ionospheric TEC modelling for earthquakes precursors from GNSS data, Quaternary Int., 462, 65–74, 2017. a
Uwamahoro, J. and Habarulema, J. B.: Empirical modeling of the storm time geomagnetic indices: a comparison between the local K and global Kp indices, Earth Planets Space, 66, 95, https://doi.org/10.1186/1880-5981-66-95, 2014. a


