the Creative Commons Attribution 4.0 License.
the Creative Commons Attribution 4.0 License.
Long-term changes in the dependence of NmF2 on solar flux at Juliusruh
Maria Gloria Tan Jun Rios
Claudia Borries
Huixin Liu
Jens Mielich
Understanding ionospheric dependence on solar activity is crucial for comprehension of the upper atmosphere. The response of the ionosphere to solar extreme ultraviolet (EUV) flux has previously been considered stable. Subsequent studies have revealed long-term changes that are not yet fully understood. This work evaluates the stability of the ionospheric F2 layer (NmF2) dependence on solar EUV indices throughout different solar cycles (SCs).
Hourly values of the peak electron density of NmF2 from Juliusruh station (54.6° N, 13.4° E) are analyzed between 1957 and 2023. Geomagnetic perturbations are removed. Third-degree polynomial-fit models dependent on different solar EUV proxies (MgII, F30, and F10.7) are generated separately for each solar cycle, each season, and each local time (LT) hour.
The saturation effect is visible in our data and starts at lower F30 values in the ascending phase than in the descending phase. A highly pronounced local time dependence in January with the R2 (goodness of the description for each fit) value being maximum around the noon hours has been observed. The correlation is highest for F30 and MgII, especially under winter noon conditions, supporting the findings of recent studies that they are the best solar flux proxies for describing the NmF2 dependence at all LT hours. Most importantly, the response of NmF2 to solar flux shows a clear long-term change as the slopes of the model curves decrease with time for each solar cycle. Between SC20 and SC24, the observed decrease is consistently higher than 2.9 % per decade, reaching 4.4 % per decade at 90 sfu between 1964 and 2019.
- Article
(2375 KB) - Full-text XML
- BibTeX
- EndNote
The ionospheric variations over time are an important part of the space climate because they can change ionospheric conditions for high-frequency (HF) radio communication and ionospheric propagation.
Investigations of long-term changes in the upper atmosphere and ionosphere began with the pioneering study of Roble and Dickinson (1989). They suggested that “greenhouse cooling” (Cicerone, 1990) could occur in the upper atmosphere due to the long-term increase in greenhouse gas concentrations (CO2), with the subsequent atmospheric contraction leading to a lowering of the ionospheric layers. Modeling studies by Rishbeth (1990) and Rishbeth and Roble (1992) extended these results to the thermosphere–ionosphere system. With the increasing number of observational and model results and findings, a global pattern of trend behavior was constructed (Laštovička et al., 2006, 2008). After that, other parameters appeared in this scenario, playing an important role in long-term trends in the upper atmosphere and ionosphere together with the dominant increase in the atmospheric concentration of greenhouse gases, e.g., secular changes in Earth's magnetic field and changes in stratospheric ozone.
The ionosphere is mainly formed by the ionizing effect of solar extreme ultraviolet (EUV) radiation. Changes in solar activity impact the chemical reactions and physical processes within the system. The main driver of year-to-year changes in ionospheric characteristics is the quasi 11-year solar cycle, and for that reason understanding the solar activity dependence of the ionosphere is crucial for empirical models.
Solar EUV radiation is mostly absorbed before reaching the lower atmosphere, which makes accurate ground-based monitoring challenging. Space-based measurements have been intermittent. As a result, solar EUV proxies have been used to model solar EUV emissions due to the lack of long-term records (e.g., Richards et al., 1994; Mikhailov and Schlegel, 2000). The question of which solar activity proxy is the best representation of EUV radiation is still open, but numerous recent studies indicate that F30 and MgII are the most reliable proxies for long-term analysis (Laštovička, 2021; Danilov and Berbeneva, 2023; Laštovička and Burešová, 2023; Zossi et al., 2023).
The global network of ionosondes provides the critical frequency of the F2 layer, foF2, with very long data series at some stations. As changes in the peak electron density of the F2 layer, NmF2, directly quantify changes in the F2 layer's ionosphere, this is an ideal parameter for use in analyzing long-term trends in the ionosphere. NmF2 can easily be derived from foF2 data.
The NmF2 response to solar EUV proxies (F10.7 or R) was found to be linear in early studies (Bremer, 1992; Laštovička, 2024), and it is often used for ionosphere analyses and modeling. However, later studies (e.g., Balan et al., 1994, 1996; Liu et al., 2003; Chen et al., 2008; Liu and Chen, 2009) discovered that the linear increase in NmF2 with solar EUV proxies at low and moderate solar activity levels breaks down at higher activity levels, indicating a “saturation effect” and, consequently, a nonlinear dependence (Balan et al., 1994). Recent publications (e.g., Liu et al., 2006; Danilov and Berbeneva, 2023) show that the dependence of foF2 on solar flux is better represented by a third-degree polynomial regression and its dependence on diurnal and seasonal variations. Kouris et al. (1998) found that using a higher-order polynomial did not effectively improve the fitting.
It is still an open question whether the ionospheric saturation effect is a genuine manifestation of solar activity and the root cause of this effect. Balan et al. (1994) suggested that the ionospheric saturation effect is due to the nonlinearity of EUV radiation with solar EUV proxies. However, Liu et al. (2003) found that the ionospheric saturation effect still appears for EUV radiation measurements, depending on the geographical location, revealing that the nonlinearity cannot fully explain the saturation effect. Rather, the roles of ionospheric photochemistry, the neutral upper atmosphere, and dynamics also contribute to the solar activity changes in NmF2 (Liu et al., 2006). In addition, ionospheric characteristics may have different values for the same solar level during different phases of a solar cycle, which is known as the “hysteresis” effect (e.g., Mikhailov and Mikhailov, 1995; Rao and Rao, 1969; Triskova and Chum, 1996).
The paper's working hypothesis is that long-term changes in ionospheric characteristics reported previously should be evident in their response to solar activity. This work studies and quantifies the long-term change in the ionosphere at the midlatitude Juliusruh station (Germany) by parameterization of the ionospheric response to solar activity for each separate solar cycle. We use the existing knowledge of the most relevant solar activity proxies in long-term analyses (F30, MgII, and F10.7) and their nonlinear relation to ionospheric characteristics by utilizing third-degree polynomial fitting. The relevance of the hysteresis effect will be studied by analyzing separately the ascending and descending phases of each solar cycle. NmF2 is the ionospheric parameter considered in this paper, and for the sake of comparison with other works, the results concerning foF2 are provided in Appendix A.
2.1 Solar activity index
To study the ionosphere and thermosphere, the correlation with solar EUV radiation plays an important role. Ground-based equipment is not able to monitor EUV radiation as this gets absorbed before entering the lower atmosphere. To measure solar EUV fluxes, rockets, satellites, and indirect methodologies have been used. However, direct (spaceborne) measurements of the solar EUV spectrum and its variability are not available most of the time. Consequently, scientists rely on solar EUV proxies to indicate the intensity of solar activity.
Each solar proxy corresponds to different parts of the solar radiation spectrum; therefore, it is possible to obtain different results using different solar activity proxies. Three solar activity proxies are used here: F10.7, F30, and MgII index. F10.7 and F30 are measures of the solar radio emission at a wavelength of 10.7 cm (2.8 GHz frequency) and at a wavelength of 30 cm (1 GHz frequency), respectively. The MgII core-to-wing index originates from the chromosphere and is computed by comparing the h and k lines of the solar MgII emission at 280 nm with the background solar continuum near 280 nm.
All the mentioned solar activity proxies have a daily resolution. To do an hourly analysis, we apply the daily value corresponding to a particular day to all the hours of this day.
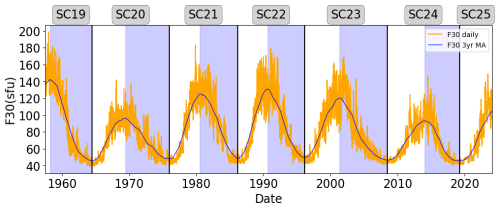
For further analysis, the periods corresponding to the last seven solar cycles were defined using a 3-year moving window average of F30 values. With this window average we could reduce the fluctuation of the daily data and determine maximum and minimum occurrences (see Table 1). In addition, Fig. 1 illustrates the variation of F30 over the years, the 3-year moving window average, and the solar cycle (SC) classification. The ascending and descending parts of each cycle are displayed with colored spans, and the blue background indicates the descending part.
Table 1Definitions of the solar cycle periods used in this work, the dates of maximum solar cycle occurrence, and the 3-year moving window average maximum F30 value and minimum F30 value.

2.2 Juliusruh ionosonde data
The critical frequency of the F2 layer, foF2, data of Juliusruh station (54.61° N, 13.41° E) is considered with an hourly resolution for the period of five complete solar cycles, including the descending phase of SC19 and the ascending phase of SC24 (1957–2024). Juliusruh is a recommendable ionosonde station for long-term studies because of the length of the data, the minimal number of data gaps, and the homogeneous and high-quality data (Laštovička et al., 2006).
The peak electron density in the F2 layer values, NmF2, is derived from the foF2 data using the following relation (Piggott and Rawer, 1972):
where NmF2 is given in cubic meters and foF2 is given in megahertz.
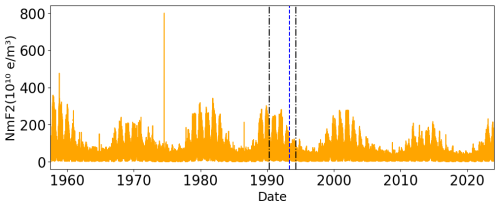
Figure 2 shows the complete Juliusruh ionosonde dataset observations of NmF2 (hourly resolution for all months) and some technical changes in this ionosonde which can affect the measurements. According to Sivakandan et al. (2023), since 1957 a high-power ionosonde has been working at Juliusruh. From 1990 to 1994 this ionosonde was replaced by a Polish ionosonde of type KOS, and in 1994 it was replaced by a digisonde (Reinisch et al., 2008). Additionally, from 1957 to 1993, the human scaling of the data was performed by different individuals, while since 1993 only one person has been responsible for this task.
2.3 Ionospheric data cleaning
For our analysis, we use an hourly data resolution from the ionosonde. To ensure that the data we are using are reliable and free of non-natural values or outliers caused by instrumental bias, we need to clean the data. We also want to exclude data from geomagnetically influenced days, as we are studying the behavior of the ionosphere during geomagnetically quiet days with a Kp index equal to or less than 3. Our cleaning method involves two steps, which are outlined below.
The first step entails the removal of all values that fall far outside the natural range of NmF2. These outliers are readily identifiable in Fig. 2. Consequently, we deemed NmF2 values exceeding 4×10¹² e m−3 to be outliers and removed them from our dataset.
To enhance our comprehension of the relationship between solar activity proxies and ionospheric characteristics, the second step consists of filtering our dataset to exclude geomagnetically disturbed days. Geomagnetic storms elicit an impact on ionospheric characteristics for on average 2 d for a moderate geomagnetic storm following their onset (Yokoyama and Kamide, 1997), and this can be even more, e.g., during the St. Patrick's Day storm in 2015 (Astafyeva et al., 2015). Consequently, to eliminate such disturbed periods, we have identified and removed days where the Kp index is equal to or exceeds 3, together with the 48 h succeeding them.
Table 2 displays the amount of NmF2 data that resulted after implementing the cleaning method explained above. The first column indicates the total number of data points selected for the period, and the second column shows the number of initially missing values (not a number, nan) from the ionosonde data. The third column indicates the values that are far outside the natural range of the values (first step). The fourth column shows the removed data corresponding to the geomagnetically disturbed days (second step). Finally, the last column shows the amount of data remaining after the cleaning method was used. All the columns show the actual number of points and the percentage they represent regarding the total number of values shown in the first column.
2.4 Method: regression analysis
The ionospheric response to the solar flux is represented using polynomial fitting, which is preferred over other methods. A cubic fitting for each month for each local time is used in the regression analysis to study the nonlinear correlation between NmF2 (variable Y) and the solar EUV proxy (variable X).
Equation (2) shows the regression used:
The data are grouped according to the solar cycle, and the goodness of the description for each fit is indicated with the R2 value. R, shown in Eq. (3), is the correlation coefficient between the time series:
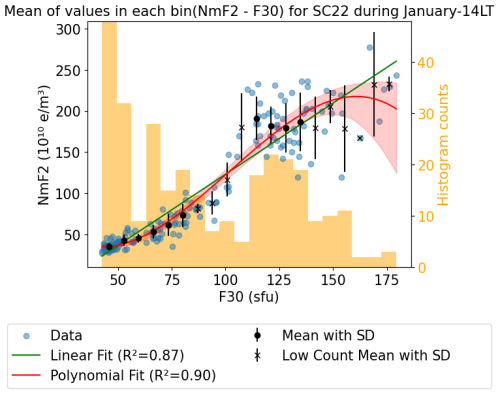
Figure 3 displays an example of the linear and polynomial fit using NmF2 data and solar EUV proxy F30 for January at 14:00 LT during solar cycle 22. The data are represented by blue scattered points, the red solid line represents the standard third-degree polynomial fit, and the green solid line indicates the standard linear fit resulting from the data. Robust regression methods, which use iteratively reweighted least squares to assign a weight to each data point and are less sensitive to outliers than standard regressions, were tested and gave the same results, indicating that there are no significant outliers in the data and consolidating the data cleaning method explained in Sect. 2.3.
Additionally, the confidence interval of the polynomial fit between the ionospheric parameter and the solar EUV proxy for a particular LT in all Januaries of each solar cycle was calculated using the bootstrap method. In Fig. 3, the confidence interval is shown as a translucent stripe around the polynomial-fitting line. The bootstrap method computes confidence intervals without relying on the assumptions of standard theory, making it useful for both parametric and nonparametric applications. The process involves resampling with replacement from the original dataset to create a new dataset. More information about this method can be found in the bibliography (e.g., Hall, 1992; Efron and Tibshirani, 1994; Mansyur and Simamora, 2022).
To support our findings and assess the quality of the fits, we employ an alternative method. This involves clustering the data based on a specific LT hour, month, and solar cycle, similar to the previous method. We then create a histogram with 20 bins for each cluster. For every bin in the histogram, we calculate the mean value and consider the standard deviation to be an error of this value. Additionally, we identify the bins with fewer than 10 values to show that these bins carry less weight in our results. In Fig. 3, the black scatter points represent the mean values, while the crosses correspond to the mean values in the bin with fewer than 10 counts.
This bin approach is unbiased when it comes to statistical fittings, and it supports the findings obtained through the polynomial-fitting method.
3.1 Seasonal analysis with different solar EUV proxies
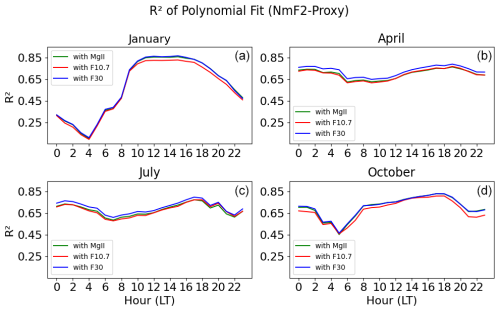
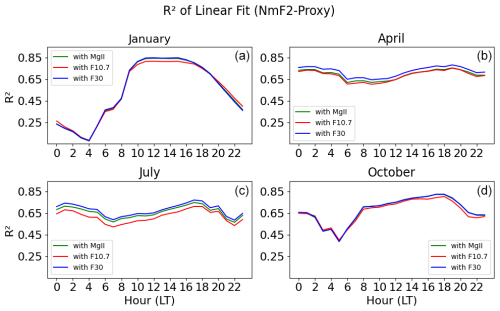
This study investigates the seasonal influence on the variation of NmF2 solar activity by analyzing the R2 value obtained in the third-degree polynomial fit between NmF2 and the solar EUV proxies. The analysis is done on an hourly fitting for each month from 1957 to 2023. Figure 4 shows four months, one for each season: January for winter, April for spring, July for summer, and October for fall.
From Fig. 4, it is apparent that, during January (winter), there is a clear diurnal variation in the R2 values. This means that the correlation increases abruptly during the morning hours, reaching a maximum R2 value of 0.85 at 12:00–17:00 LT, and then decays in the evening. Furthermore, this season exhibits the highest variability between night and noontime compared to the rest, with R2 values ranging from 0.1 at 04:00 LT to 0.85 at 12:00–17:00 LT. On the other hand, during April (spring) and July (summer), the diurnal variation is not visible, as R2 remains constant between 0.6 and 0.8. In October (fall), the diurnal variation is visible but with less variability of R2 values between night and noontime than in winter.
Finally, we observe that the highest correlations between NmF2 and solar EUV proxies for each hour in different months (1957–2023) are always reached using F30. Using MgII, the R2 values are almost equal to those of F30 in January and October. In April and July, the correlations using MgII and F10.7 mostly overlap each other and are lower than those with F30. The red line, corresponding to F10.7, shows the lowest values of R2 in all the cases. R2 values do not differ significantly when using a linear regression or a polynomial regression (see Fig. B1 in the Appendix). The highest correlations over time during the winter noon hours allow us to continue the long-term analyses under this condition.
3.2 Long-term changes
This work aims to investigate the continuity of the relationship between NmF2 and solar flux across different solar cycles. To achieve this, we divide the period from 1957 to 2023 into different solar cycles based on Table 1 and only consider the period between SC20 and SC24 when the observations are available for complete solar cycles. We analyze the ionospheric response to solar activity proxies, represented by the third-degree polynomial fit. We utilize data from January during the noon hours and the solar EUV proxy F30 because the results in Sect. 3.1 reveal the highest correlation under these conditions.
In Fig. 5, the curves representing the polynomial fit for each solar cycle appear to have a systematic shift based on the solar cycle number. In other words, for a specific solar flux level, the NmF2 values decrease with an increasing solar cycle number. This is most noticeable for lower F30 values where the curves have similar slopes. For higher F30 values, the saturation effect makes the ordered shift of the curves less apparent. The saturation effect is observable in the first three solar cycles (SC20 to SC22) but is not evident in SC24. In SC23, the saturation effect is absent, and the ionospheric response increases more significantly than before at higher solar flux levels.
To assess the significance of the differences between SC20 and SC24, Fig. 6a displays the polynomial fit between NmF2 and F30 in January at 14:00 LT of the first solar cycle (SC20) and the last one analyzed (SC24), along with their corresponding 95 % confidence intervals calculated using the bootstrap method (explained in Sect. 2.4). The figure includes the analysis using the mean values of the histogram bins and their standard deviation error for each solar cycle. There are a few overlaps between the data points of SC20 and SC24 of up to 60 sfu and higher NmF2 values in SC20. Above 70 sfu, the difference between the two solar cycles becomes more obvious, indicating a decrease in the ionospheric response to solar flux between the first (SC20) and last (SC24) parts of the analyzed period.
Figure 6b shows the differences between the two polynomial fits of SC20 and SC24. The higher the solar flux, the greater the decrease in the response over time. For 60 sfu, the difference between SC20 and SC24 is around 2.2×10⁹ e m−3 yr−1, while for 120 sfu the absolute variation is approximately 5.8×10⁹ e m−3 yr−1. Additionally, it is worth noting that the observed decrease between SC20 and SC24 is consistently higher than 0.29 % per year, reaching 0.44 % per year at 90 sfu, which is a decadal reduction of 2.9 %–4.4 %.
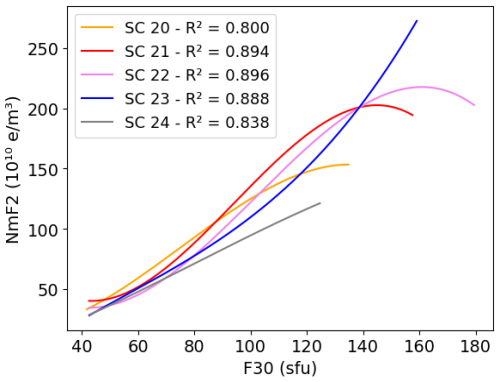
Figure 5Third-degree polynomial dependence between NmF2 and F30 during January at 14:00 LT for different solar cycles.
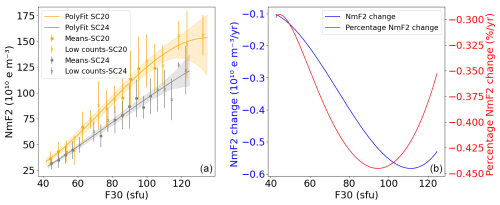
Figure 6(a) Third-degree polynomial dependence between NmF2 and F30 during January at 14:00 LT for SC20 and SC24 with their confidence intervals (CIs) indicated as shades of the same regression line color. Mean values of the bins (scatter points) and mean values with fewer than 10 counts in a bin (crosses) are shown with their standard deviation (error bar for each point). (b) Absolute and percentage-per-year differences between the third-degree polynomial fittings corresponding to SC20 and SC24.
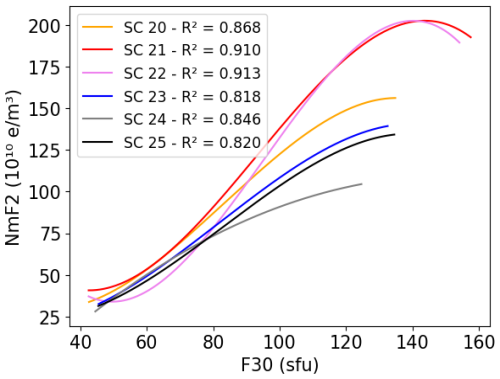
Figure 7Third-degree polynomial dependence between NmF2 and F30 during January at 14:00 LT for the different ascending parts of each solar cycle.
3.2.1 Ascending and descending phases of the solar cycle
A similar process to the one described in Sect. 3.2 is carried out here but now only analyzing data separately from the ascending and descending parts of all the solar cycles. Figure 1 describes the solar cycles and their phases used here. Table 1 indicates the beginning and end of each solar cycle and also their maximum, which indicates the end of the ascending phase and the start of the descending phase.
The variability in the response of the ionosphere to the solar EUV proxy (F30) over time in the ascending phases of solar cycles is shown in Fig. 7. Moreover, Fig. 8 presents the differences in the fitted responses of the first and last solar cycles analyzed, including the significance of these (95 % confidence interval). The first solar cycle analyzed here is SC20, and the last solar cycle analyzed is SC25 because we saw that the data until December 2023 more or less include a big portion of the ascending phase of the present solar cycle. Likewise, the order shift mentioned in Fig. 5 is not as clear here and the difference between the curve in SC20 and SC25 is not significant at the lowest values of NmF2. The confidence intervals for the polynomial fitting of the ascending phases in SC20 and SC25 partially overlap for all the NmF2 values, indicating the possibility of a small difference in the response over time. For 60 sfu, the difference between SC20 and SC25 is around 2.1×10⁹ e m−3 per ascending year, while for 120 sfu the absolute variation is approximately 7.7×10⁹ e m−3 per ascending year. The observed decrease between SC20 and SC25 is consistently higher than 0.42 % per ascending year, reaching 0.53 % per ascending year at 100 sfu.
Figures 9 and 10 illustrate the descending phase of the solar cycles. The analysis includes data from SC19 through SC24. The shift in order is more noticeable than in Fig. 5 for the first solar cycles. The difference between the curves representing SC19 and SC24 in Fig. 10 clearly shows that SC19 is stronger than SC24. Around 130 sfu, the polynomial fitting does not accurately represent the mean of that particular bin. However, this mean is calculated with fewer than 10 data points, making it less reliable. For 60 sfu, the difference between SC19 and SC24 is around 4.1×10⁹ e m−3 per descending year, while for 120 sfu the absolute variation is approximately 1.5×10¹⁰ e m−3 per descending year. The observed decrease between SC19 and SC24 is consistently higher than 0.65 % per descending year, reaching 0.89 % per descending year around 100 sfu.
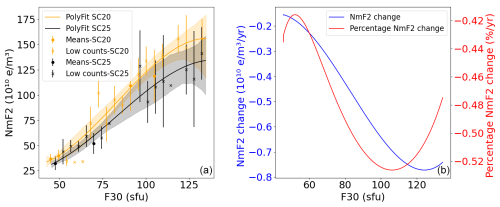
Figure 8(a) Third-degree polynomial dependence between NmF2 and F30 during January at 14:00 LT for the ascending phases of SC20 and SC25, with their CIs indicated as shades of the same regression line color. Mean values of the bins (scatter points) and mean values with fewer than 10 counts in a bin (crosses) are shown with their standard deviations (error bar for each point). (b) Absolute and percentage differences per ascending year between the third-degree polynomial fittings corresponding to the ascending phases of SC20 and SC25.
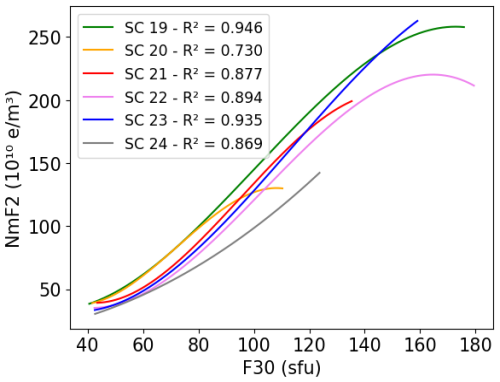
Figure 9Third-degree polynomial dependence between NmF2 and F30 during January at 14:00 LT for the different descending parts of each solar cycle.
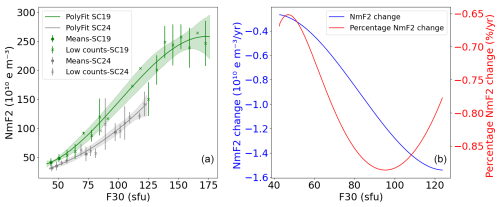
Figure 10(a) Third-degree polynomial dependence between NmF2 and F30 during January at 14:00 LT for the descending phases of SC19 and SC24, with their CIs indicated as shades of the same regression line color. Mean values of the bins (scatter points) and mean values with fewer than 10 counts in a bin (crosses) are shown with their standard deviation (error bar for each point). (b) Absolute and percentage differences per descending year between the third-degree polynomial fitting corresponding to the descending phases of SC19 and SC24.
The varying intensities of the solar cycle are a challenging point for our analysis. The difference in the strengths of solar cycles results in different ionospheric responses, making some comparisons less straightforward. For instance, SC19 has a significantly larger amplitude than SC24, as shown in Fig. 1. It could be argued that the difference between them is not due to long-term changes but rather a solar phenomenon. However, it is also evident that the ionospheric response decreases over time during periods of low solar activity, indicating a long-term change.
The study of Buresova et al. (2014) indicates that using a Kp value of 3 during periods of deep solar cycle minima does not guarantee the elimination of geomagnetic storm effects. Consequently, our fitting curves could be affected by geomagnetic activity. However, our testing revealed that, even after filtering a significant portion of the deep solar minimum period (days with Kp values equal to or greater than 2), no significant differences were found compared to the results shown here. Thus, we consider the cleaning method applied here to be sufficient for the analysis of long-term changes.
In order to study the long-term changes in the ionosphere, we choose periods when the EUV variability dominates the ionospheric variability. Jakowski et al. (2024) studied the long-term behavior of production and loss coefficients. They discussed how photoionization depends on the incidence angle of solar radiation. In summer, plasma transport dominates recombination processes, and the peak electron density can occur after sunset, creating the midlatitude summer nighttime anomaly (MSNA). In winter, the peak electron density decreases around sunset, suggesting that recombination processes dominate at that time. In addition, there is a return flux of plasma from the plasmasphere in winter contributing to an increase in ionization and the nighttime winter anomaly (NWA) in the Northern Hemisphere (Jakowski and Paasch, 1984; Jakowski and Förster, 1995). Finally, winter conditions show the highest ratio of production and loss of ionization, and the noon condition is the period with the strongest impact of solar ionizing flux. Accordingly, Fig. 4 shows the highest correlations in January at the noon hours. Thus, the results discussed in the following use January 14:00 local time conditions only.
In this work, we showed that the solar activity effect on the ionosphere can be modeled accurately using a third-degree polynomial fit which considers the saturation effect (e.g., Danilov and Berbeneva, 2023; Depuev et al., 2024). So far, many studies of long-term changes have preferred linear regression to polynomial fitting (e.g., Bremer, 1992; Laštovička, 2024). One reason might be that the monthly median values used in these studies reduce the saturation effect and make the relationship with the ionizing flux more linear. However, there are also often arguments that linear regression coefficients are easier to interpret and that polynomial fitting inherits the risk of overfitting. Thus, different measures have been taken in this work to argue for the use of the third-degree polynomial fit (e.g., considering the mean values of the data bins). First, we address the argument of overfitting by adding the average NmF2 per binned F30. These points are shown in Figs. 6, 8, and 10 to prove the correctness of the fits when it comes to the estimation of the long-term change. In Fig. 5, SC22 shows unusual behavior in the range of F30 between 40 and 70 sfu, with a much lower NmF2 than the other solar cycles. Overfitting would be a first guess for explaining this unusually low NmF2. However, the bin analysis in Fig. 3, which shows the NmF2 data for SC22 and their polynomial fit, indicates that the shape aligns accurately with the mean bin values of the data. Thus, it must be a natural effect causing the low NmF2 values and not an artifact of the fitting function. Second, we also test an Akaike information criterion (AIC) analysis (Akaike, 1974) in order to mathematically evaluate how well our polynomial model fits the data and to compare it with the linear and cubic regression model. The smaller the AIC value, the better the model fits. This test revealed that lower AIC values for almost all solar cycles were consistently obtained with cubic fitting instead of linear or quadratic fitting, supporting our choice of fitting method. Finally, we complement the results using linear fitting in the Appendix (Sect. B; Figs. B2 and B3). They confirm the results discussed here using this alternative method.
The results of the polynomial fit for each solar cycle indicate separately that the relation between solar activity and NmF2 is not steady. The regression lines have similar slopes but shifted from one SC to the next. The shift is slow and, comparing SC20 and SC24, a significant difference developed that indicated a variation in the ionospheric response over time. SC23 does not seem to follow the common curvature shape of the previous SCs. Figure 6 shows a percentage yearly decrease in the ionospheric response to F30 between SC20 and SC24 of 0.29 %–0.44 % (or 1.0×10⁹–5.8×10⁹ e m−3 yr−1) and a decadal reduction of 2.9 %–4.4 %. This decrease is comparable to a yearly decline of 0.15 %–0.24 % (or 8.0–24.0 10−3 MHz yr−1) for foF2 between SC20 and SC24 in Fig. A3, indicating a decadal reduction of 1.5–2.4 %. This last result is consistent with the decadal trend of −1.8 % reported in Table 2 of Laštovička (2024) for Juliusruh (1976–2014), even though our analysis covers a longer period. Our findings also align with the results obtained using both standard and modified linear regression methods in the work of Cnossen and Franzke (2014), which showed a trend of −7.7 kHz yr−1 for Juliusruh (1959–2005) as reported in Table 3 and Fig. 5 of the mentioned paper. In both cases, the approach differs from ours but the results obtained are similar.
Under the January 14:00 LT condition, NmF2 is best correlated with the EUV solar proxies. Still, NmF2 under the 14:00 LT condition in the other seasons shows a high correlation with the EUV solar proxies and is suitable for the analysis of the long-term changes presented and applied here. Table 3 describes the changes in the responses of foF2 and NmF2 for different months at 14:00 LT between SC20 and SC24 in terms of absolute percentage and percentage per year. The January column essentially describes the results obtained in Figs. 6b and A3b. The results show that the ionospheric response decreases during all the seasons, and the magnitude of the decrease varies with the magnitude of the solar activity index. The last column in Table 3 is calculated using the minimum and maximum decreases observed for each season (month). The mean values for each season are consistent with the results of other authors, as discussed in the previous paragraph.
The ionospheric response to solar activity decrease is not yet fully understood. Recent research results suggest the following effects as the main mechanisms causing the long-term changes in the ionosphere: first, the dynamic effects of neutral winds and electric fields on NmF2 modify the plasma transport on long timescales (Liu et al., 2006). Second, slow changes in Earth's magnetic field and geomagnetic activity trends are able to produce some trends in the F2 region and also explain some seasonal and daily variation patterns in trend values (Elias and de Adler, 2006; Cnossen and Richmond, 2013). In addition, changes in the composition of the thermosphere caused by contraction of the atmosphere, such as the ratio , can have a significant impact on the ionosphere. The density and temperature of the neutral particles in the thermosphere increase with higher solar activity due to the greater heating from solar UV radiation and ion drag (Guo et al., 2007).
The next discussion point addresses the analysis of the ascending and descending solar cycle phases. The variations in NmF2 during different solar cycle phases are known as the hysteresis effect. This phenomenon is usually observed in foF2 data. It means that the same solar level can have different NmF2 values during different phases of a solar cycle. Mikhailov and Mikhailov (1995) suggested that the effect is related to differences in geomagnetic activity during the ascending and descending phases (which are usually stronger during the descending phase). Nevertheless, we show here that the hysteresis effect is still visible in NmF2 and foF2 data using only the Kp index under three conditions. In Fig. 7, when only the ascending phases are considered, the order shift mentioned for Fig. 5 is not clear. SC21 and SC22 have higher values compared to the rest of the SCs. Moreover, the difference between SC20 and SC25 (Fig. 8) varies between 0.42 % and 0.53 % per ascending year. However, the visible overlap between some parts of their confidence intervals could imply that this difference is not significant.
For the descending phases of the solar cycles, our results show a clearer order in the shift of the curves, especially for lower F30 values, i.e., 40–80 sfu (Fig. 7). It is worth noting that, in the descending phase, SC23 does not follow the common curvature shape of the previous SCs as in the complete solar cycle analysis. Furthermore, the difference between SC19 and SC24 (Fig. 10) varies between 0.65 % and 0.89 % per descending year, showing a significant decrease in the ionospheric response after five solar cycles. Figure 11 compares the descending phase of SC19 and SC22; it could be more appropriate here due to the similar amplitudes of these solar cycles. The difference between SC19 and SC22 indicates a decrease that varies between 0.50 % and 1.04 % per descending year, which seems to agree approximately well with the 0.65 %–0.89 % per descending year in Fig. 10.
Evidently, the results presented here indicate that a long-term change in the solar activity dependence is stronger and clearer to identify in the descending phases of the SCs. However, the differences between the two phases could have their origin in the diverse phenomena that occur during each phase.
A key result of this study is that the magnitude of the long-term decrease in NmF2 depends on the magnitude of the solar activity index. For a small F30, the long-term change is approximately 2.9 % per decade. For F30 =120 sfu, it is 4.4 % per decade.
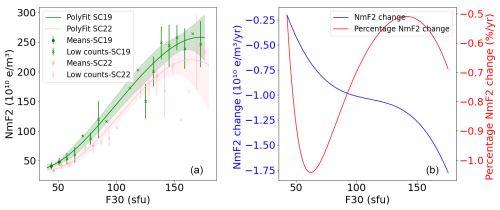
Figure 11(a) Third-degree polynomial dependence between NmF2 and F30 during January at 14:00 LT for the descending phases of SC19 and SC22, with their CIs indicated as shades of the same regression line color. Mean values of the bins (scatter points) and mean values with fewer than 10 counts in a bin (crosses) are shown with their standard deviation (error bar for each point). (b) Absolute and percentage differences per descending year between the third-degree polynomial fitting corresponding to the descending phases of SC19 and SC22.
An analysis of hourly data of NmF2 derived from Juliusruh data, covering the period from 1957 to 2023, was conducted. The study examined the response of NmF2 to solar flux by using three different solar EUV proxies (F10.7, F30, and MgII). The analysis covered five complete solar cycles, distinguishing between ascending and descending phases, including the descending phase of SC19 and the ascending phase of SC24. The main results of the analysis are as follows:
-
The ionospheric saturation feature is visible in our NmF2 data. For this reason, the ionospheric response is better represented by a quadratic regression compared to other methods. This effect begins at lower F30 values in the ascending phase than in the descending phase.
-
F30 shows the highest squared correlation value for describing the hourly NmF2 dependence on solar flux over time in Juliusruh in comparison with F10.7 and MgII.
-
In January (a winter month), there is the highest correlation between the solar flux and NmF2 under noon conditions, which is explained by the winter anomaly.
-
The modeling of the NmF2 response to solar activity for each SC separately revealed a steady decrease in NmF2. A significant discovery is that the long-term variation is influenced by the intensity of the solar activity index. On average, NmF2 decreases by 0.29 % to 0.44 % per year for low and high solar activity index levels, respectively (equivalent to 1.0×10⁹–5.8×10⁹ e m−3 yr−1). The long-term decrease becomes more significant with higher solar activity.
This study shows that the previously reported long-term decrease in NmF2 under winter noon conditions at the midlatitude Juliusruh station is reflected in the parameterization of the NmF2 response to the solar activity index F30. This parameterization method is a valuable tool for quantifying long-term change in a meaningful way.
It is important to note that the concept of trends in this paper deviates from the traditional linear approach. While the concept of linearity in time remains, the analysis presented here of the variation in the ionospheric response using solar cycle periods enables the distinction of responses to high and low solar activity while simultaneously examining the temporal variation.
So far, the data for one ionosonde station for five complete solar cycles have been analyzed. In order to complete the knowledge about long-term changes in the ionosphere, the analysis needs to be extended. Further studies are suggested to perform the same analysis with a greater number of ionosonde stations from different parts of the world. This would provide a more comprehensive understanding of the responses across different latitudes and longitudes and help to determine whether the results found are consistent.
In this section of the Appendix are shown the same results as in the paper but using foF2 instead of NmF2. The different subsections are in accordance with the names of the subsections in the main body of the paper.
A1 Results: seasonal analysis with different solar EUV proxies
A similar analysis to Fig. 4 is done in Fig. A1 for the case of foF2.
A2 Results: long-term changes
Similar analyses to those done in Fig. 5 and Fig. 6 are done in Fig. A2 and Fig. A3 for the case of foF2.
A3 Ascending and descending phases of the solar cycle
A similar analysis to that done in Sect. 3.2.1 is done here for the third-degree polynomial dependence between foF2 and F30 of the ascending and descending phases of solar cycles.
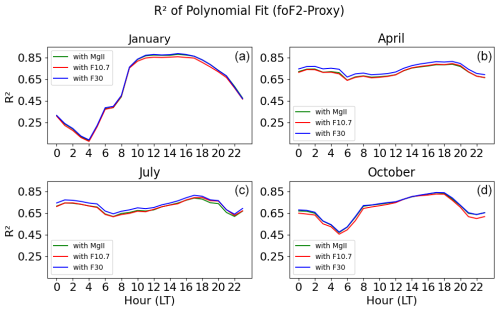
Figure A1Hourly R2 value of the third-degree polynomial dependence between foF2 and solar activity proxies F30 (blue line), F10.7 (red line), and MgII (green line) (a) in January, (b) in April, (c) in July, and (d) in October from 1957 to 2023.
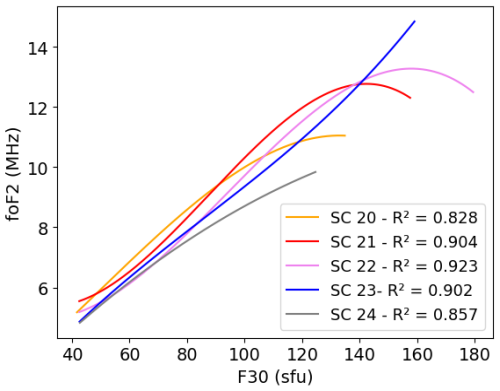
Figure A2Third-degree polynomial dependence between foF2 and F30 during January at 14:00 LT for different solar cycles.
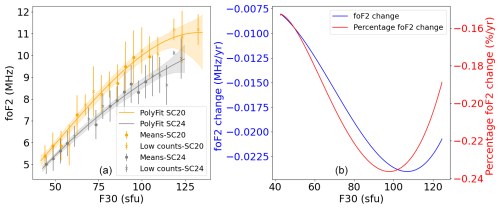
Figure A3(a) Third-degree polynomial dependence between foF2 and F30 during January at 14:00 LT for SC20 and SC24 with their CIs indicated as shades of the same regression line color. Mean values of the bins (scatter points) and mean values with fewer than 10 counts in a bin (crosses) are shown with their standard deviation (error bar for each point). (b) The absolute and percentage-per-year differences between the third-degree polynomial fittings correspond to SC20 and SC24.
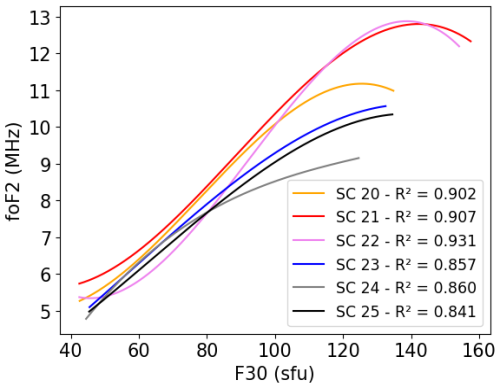
Figure A4Third-degree polynomial dependence between foF2 and F30 during January at 14:00 LT for the different ascending parts of each solar cycle.
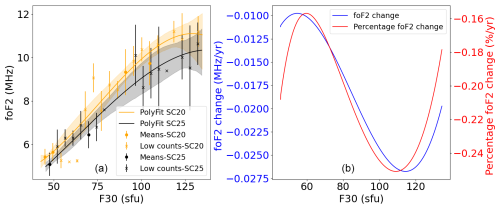
Figure A5(a) Third-degree polynomial dependence between foF2 and F30 during January at 14:00 LT for the ascending parts of SC20 and SC25 with their CIs indicated as shades of the same regression line color. Mean values of the bins (scatter points) and mean values with fewer than 10 counts in a bin (crosses) are shown with their standard deviation (error bar for each point). (b) Absolute and percentage differences per ascending year between the third-degree polynomial fittings correspond to the ascending phases of SC20 and SC25.
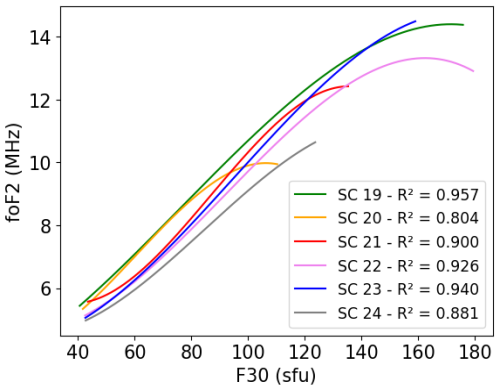
Figure A6Third-degree polynomial dependence between foF2 and F30 during January at 14:00 LT for the different descending parts of each solar cycle.
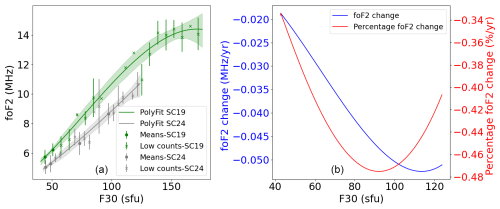
Figure A7(a) Third-degree polynomial dependence between foF2 and F30 during January at 14:00 LT for the descending phases of SC19 and SC24 with their CIs indicated as shades of the same regression line color. Mean values of the bins (scatter points) and mean values with fewer than 10 counts in a bin (crosses) are shown with their standard deviations (error bar for each point). (b) Absolute and percentage differences per descending year between the third-degree polynomial fittings corresponding to the descending phases of SC19 and SC24.
In this section of the Appendix are shown the same results as in the paper but using linear regression for the representation of the ionospheric response to solar flux instead of the cubic fitting. The different subsections accord with the names of the corresponding subsections in the main body of the paper.
B1 Results: seasonal analysis with different solar EUV proxies
B2 Results: long-term changes
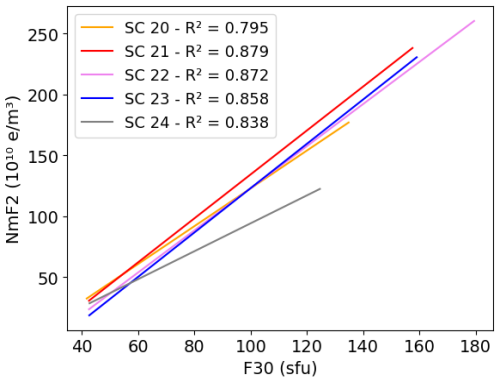
Figure B2Linear dependence between NmF2 and F30 during January at 14:00 LT for different solar cycles.
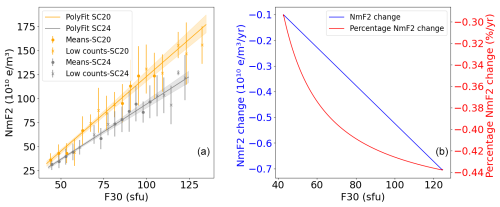
Figure B3(a) Linear dependence between NmF2 and F30 during January at 14:00 LT for SC20 and SC24 with their CIs indicated as shades of the same regression line color. Mean values of the bins (scatter points) and mean values with fewer than 10 counts in a bin (crosses) are shown with their standard deviation (error bar for each point). (b) Absolute and percentage-per-year differences between the linear fittings corresponding to SC20 and SC24.
The F10.7 and F30 data were taken from https://www.iup.uni-bremen.de/gome/solar/rflux_jpn.txt (Weber, 2025). Measurement with a daily resolution has been available since February 1947 for F10.7 and since November 1951 for F30. The MgII data were taken from https://www.iup.uni-bremen.de/gome/solar/MgII_extended.dat (UVSAT group, 2025) with a daily resolution starting in 1978 (composite MgII index) that has been extended back to 1947 using the F30 and F10.7 time series. The Kp index data used in this work were obtained from the GeoForschungsZentrum (GFZ) in Potsdam, Germany (https://datapub.gfz-potsdam.de/download/10.5880.Kp.0001/Kp_definitive/, GFZ German Research Centre for Geosciences, 2025). The Juliusruh foF2 data can be obtained from the World Data Centre web pages at the Australian Space Weather Forecasting Centre (https://downloads.sws.bom.gov.au/wdc/iondata/wdc_display/juliusruh/0318.00/, IAP, 2025).
MGTJR, CB, and HL conducted the conceptualization and developed the method. MGTJR analyzed the data, created the visualizations, and drafted the manuscript. CB and HL provided scientific support and reviewed and edited the manuscript. JM reviewed and edited the manuscript.
At least one of the (co-)authors is a member of the editorial board of Annales Geophysicae. The peer-review process was guided by an independent editor, and the authors also have no other competing interests to declare.
Publisher’s note: Copernicus Publications remains neutral with regard to jurisdictional claims made in the text, published maps, institutional affiliations, or any other geographical representation in this paper. While Copernicus Publications makes every effort to include appropriate place names, the final responsibility lies with the authors.
This article is part of the special issue “Long-term trends in the stratosphere–mesosphere–thermosphere–ionosphere system”. It is a result of the 12th International Workshop on Long-Term Changes and Trends in the Atmosphere (TRENDS 2024), Ourense, Spain, 6–10 May 2024.
We are grateful to Norbert Jakowski for his valuable recommendations on the ionospheric parameters used in this study and for generously sharing his expertise with us. We also wish to thank Jens Mielich for providing access to the Juliusruh ionosonde measurements and for sharing information about them.
This research has been supported by the DLR/DAAD Research Fellowships, Doctoral Studies in Germany (grant no. 57622551) and the JSPS (grant nos. 20H00197 and JP22K21345).
The article processing charges for this open-access publication were covered by the German Aerospace Center (DLR).
This paper was edited by Jan Laštovička and reviewed by two anonymous referees.
Akaike, H.: A new look at the statistical model identification, IEEE T. Automat. Contr., 19, 716–723, 1974. a
Astafyeva, E., Zakharenkova, I., and Förster, M.: Ionospheric response to the 2015 St. Patrick's Day storm: A global multi-instrumental overview, J. Geophys. Res.-Space, 120, 9023–9037, 2015. a
Balan, N., Bailey, G., Jenkins, B., Rao, P., and Moffett, R.: Variations of ionospheric ionization and related solar fluxes during an intense solar cycle, J. Geophys. Res.-Space, 99, 2243–2253, 1994. a, b, c
Balan, N., Bailey, G., and Su, Y.: Variations of the ionosphere and related solar fluxes during solar cycles 21 and 22, Adv. Space Res., 18, 11–14, 1996. a
Bremer, J.: Ionospheric trends in mid-latitudes as a possible indicator of the atmospheric greenhouse effect, J. Atmos. Terr. Phys., 54, 1505–1511, 1992. a, b
Buresova, D., Lastovicka, J., Hejda, P., and Bochnicek, J.: Ionospheric disturbances under low solar activity conditions, Adv. Space Res., 54, 185–196, 2014. a
Chen, Y., Liu, L., and Le, H.: Solar activity variations of nighttime ionospheric peak electron density, J. Geophys. Res.-Space, 113, 2008. a
Cicerone, R. J.: Greenhouse cooling up high, Nature, 344, 104–105, 1990. a
Cnossen, I. and Franzke, C.: The role of the Sun in long-term change in the F2 peak ionosphere: New insights from EEMD and numerical modeling, J. Geophys. Res.-Space, 119, 8610–8623, 2014. a
Cnossen, I. and Richmond, A. D.: Changes in the Earth's magnetic field over the past century: Effects on the ionosphere-thermosphere system and solar quiet (Sq) magnetic variation, J. Geophys. Res.-Space, 118, 849–858, 2013. a
Danilov, A. and Berbeneva, N.: Statistical analysis of the critical frequency foF2 dependence on various solar activity indices, Adv. Space Res., 72, 2351–2361, https://doi.org/10.1016/j.asr.2023.05.012, 2023. a, b, c
Depuev, V. K., Deminov, M., Deminova, G., and Depueva, A. K.: NmF 2 Variability at Different Longitudes in Mid-Latitudes: The Role of Geomagnetic Activity, Geomagn. Aeronomy, 64, 360–368, 2024. a
Efron, B. and Tibshirani, R. J.: An introduction to the bootstrap, CRC press, ISBN 0-412-04231-2, 1994. a
Elias, A. G. and de Adler, N. O.: Earth magnetic field and geomagnetic activity effects on long-term trends in the F2 layer at mid-high latitudes, J. Atmos. Sol.-Terr. Phy., 68, 1871–1878, 2006. a
GFZ German Research Centre for Geosciences: Index of /download/10.5880.Kp.0001/Kp_definitive, https://datapub.gfz-potsdam.de/download/10.5880.Kp.0001/Kp_definitive/, last access: 16 January 2025. a
Guo, J., Wan, W., Forbes, J. M., Sutton, E., Nerem, R. S., Woods, T., Bruinsma, S., and Liu, L.: Effects of solar variability on thermosphere density from CHAMP accelerometer data, J. Geophys. Res.-Space, 112, A10308, https://doi.org/10.1029/2007JA012409, 2007. a
Hall, P.: On bootstrap confidence intervals in nonparametric regression, Ann. Stat., 20, 695–711, 1992. a
Leibniz Institute of Atmospheric Physics (IAP): Index of /wdc/iondata/wdc_display/juliusruh/0318.00, https://downloads.sws.bom.gov.au/wdc/iondata/wdc_display/juliusruh/0318.00/, last access: 16 January 2025. a
Jakowski, N. and Förster, M.: About the nature of the night-time winter anomaly effect (NWA) in the F-region of the ionosphere, Planet. Space Sci., 43, 603–612, 1995. a
Jakowski, N. and Paasch, E.: Report on the observations of the total electron content of the ionosphere in Neustrelitz/GDR from 1976 to 1980, in: Annales Geophysicae, vol. 2, 501–504, 1984. a
Jakowski, N., Hoque, M. M., and Mielich, J.: Long-term relationships of ionospheric electron density with solar activity, J. Space Weather Spac., 14, 24, 2024. a
Kouris, S. S., Bradley, P. A., and Dominici, P.: Solar-cycle variation of the daily foF2 and M(3000)F2, Annales Geophysicae, 16, 1039–1042, https://doi.org/10.1007/s00585-998-1039-0, 1998. a
Laštovička, J.: The best solar activity proxy for long-term ionospheric investigations, Adv. Space Res., 68, 2354–2360, 2021. a
Laštovička, J.: Dependence of long-term trends in foF2 at middle latitudes on different solar activity proxies, Adv. Space Res., 73, 685–689, 2024. a, b, c
Laštovička, J. and Burešová, D.: Relationships between foF2 and various solar activity proxies, Space Weather, 21, e2022SW003359, https://doi.org/10.1029/2022SW003359, 2023. a
Laštovička, J., Mikhailov, A. V., Ulich, T., Bremer, J., Elias, A. G., de Adler, N. O., Jara, V., del Rio, R. A., Foppiano, A. J., Ovalle, E., and Danilov, A. D.: Long-term trends in foF2: A comparison of various methods, J. Atmos. Sol.-Terr. Phy., 68, 1854–1870, 2006. a, b
Laštovička, J., Yue, X., and Wan, W.: Long-term trends in foF2: their estimating and origin, Ann. Geophys., 26, 593–598, https://doi.org/10.5194/angeo-26-593-2008, 2008. a
Liu, J., Chen, Y., and Lin, J.: Statistical investigation of the saturation effect in the ionospheric foF2 versus sunspot, solar radio noise, and solar EUV radiation, J. Geophys. Res.-Space, 108, 1067, https://doi.org/10.1029/2001JA007543, 2003. a, b
Liu, L. and Chen, Y.: Statistical analysis of solar activity variations of total electron content derived at Jet Propulsion Laboratory from GPS observations, J. Geophys. Res.-Space, 114, A10311, https://doi.org/10.1029/2009JA014533, 2009. a
Liu, L., Wan, W., Ning, B., Pirog, O., and Kurkin, V.: Solar activity variations of the ionospheric peak electron density, J. Geophys. Res.-Space, 111, A08304, https://doi.org/10.1029/2006JA011598, 2006. a, b, c
Mansyur, A. and Simamora, E.: Bootstrap-t Confidence Interval on Local Polynomial Regression Prediction, Jurnal Mathematics and Statistics, 10, 1178–1193, 2022. a
Mikhailov, A. and Mikhailov, V.: Solar cycle variations of annual mean noon foF2, Adv. Space Res., 15, 79–82, 1995. a, b
Mikhailov, A. V. and Schlegel, K.: A self-consistent estimate of O+ + N2 − rate coefficient and total EUV solar flux with λ<1050 Å using EISCAT observations, Ann. Geophys., 18, 1164–1171, https://doi.org/10.1007/s00585-000-1164-x, 2000. a
Piggott, W. R. and Rawer, K.: URSI handbook of ionogram interpretation and reduction, United States, Environmental Data Service, Report UAG, 23, 1972. a
Rao, M. G. and Rao, R. S.: The hysteresis variation in F2-layer parameters, J. Atmos. Terr. Phys., 31, 1119–1125, 1969. a
Reinisch, B. W., Paznukhov, V. V., Galkin, I. A., Altadill, D., and McElroy, J.: Precise radar range measurements with digisondes, in: AIP Conference Proceedings, 4 February 2008, vol. 974, American Institute of Physics, 144–149, https://doi.org/10.1063/1.2885023, 2008. a
Richards, P., Fennelly, J. A., and Torr, D.: EUVAC: A solar EUV flux model for aeronomic calculations, J. Geophys. Res.-Space, 99, 8981–8992, 1994. a
Rishbeth, H.: A greenhouse effect in the ionosphere?, Planet. Space Sci., 38, 945–948, 1990. a
Rishbeth, H. and Roble, R.: Cooling of the upper atmosphere by enhanced greenhouse gases–Modelling of thermospheric and ionospheric effects, Planet. Space Sci., 40, 1011–1026, 1992. a
Roble, R. G. and Dickinson, R. E.: How will changes in carbon dioxide and methane modify the mean structure of the mesosphere and thermosphere?, Geophys. Res. Lett., 16, 1441–1444, 1989. a
Sivakandan, M., Mielich, J., Renkwitz, T., Chau, J., Jaen, J., and Laštovička, J.: Long-Term Variations and Residual Trends in the E, F, and Sporadic E (Es) Layer Over Juliusruh, Europe, J. Geophys. Res.-Space, 128, e2022JA031097, https://doi.org/10.1029/2022JA031097, 2023. a
Triskova, L. and Chum, J.: Hysteresis in dependence of foF2 on solar indices, Adv. Space Res., 18, 145–148, 1996. a
UVSAT group: Extended Composite MgII Index V1, Institute of Environmental Physics (IUP), University of Bremen, https://www.iup.uni-bremen.de/gome/solar/MgII_extended.dat, last access: 16 January 2025. a
Weber, M.: Japanese solar radio flux, Institute of Environmental Physics (IUP), University of Bremen, https://www.iup.uni-bremen.de/gome/solar/rflux_jpn.txt, last access: 16 January 2025. a
Yokoyama, N. and Kamide, Y.: Statistical nature of geomagnetic storms, J. Geophys. Res.-Space, 102, 14215–14222, 1997. a
Zossi, B. S., Medina, F. D., Tan Jun, G., Lastovicka, J., Duran, T., Fagre, M., de Haro Barbas, B. F., and Elias, A. G.: Extending the analysis on the best solar activity proxy for long-term ionospheric investigations, P. Roy. Soc. A, 479, 20230225, https://doi.org/10.1098/rspa.2023.0225, 2023. a
- Abstract
- Introduction
- Data and methods
- Results
- Discussion
- Summary and conclusions
- Appendix A: Long-term changes in the dependence of foF2 on solar flux at Juliusruh
- Appendix B: Linear dependence of NmF2 on solar flux
- Data availability
- Author contributions
- Competing interests
- Disclaimer
- Special issue statement
- Acknowledgements
- Financial support
- Review statement
- References


