the Creative Commons Attribution 4.0 License.
the Creative Commons Attribution 4.0 License.
 | 22 Oct 2025
Cloudiness retrieved from All-Sky camera and MSG satellite over Reunion Island and Antananarivo Madagascar
Jean-Marcel Rivonirina
Thierry Portafaix
Solofoarisoa Rakotoniaina
Béatrice Morel
Chao Tang
Kévin Lamy
Marie Lothon
Tom Toulouse
Olivier Liandrat
Solofo Rakotondraompiana
Hassan Bencherif
To gain a deeper understanding of cloud variability over the Southwest Indian Ocean (SWIO) region, various measurement techniques can be used. Cloud data focused on two main sites (Antananarivo, Madagascar, and Reunion Island) were collected over nearly three years (September 2019 to June 2022) using ground-based all-sky camera and Meteosat Second Generation (MSG) satellite imagery. This study primarily examined cloud fraction, although additional analysis based on cloud types is also needed. Two image processing algorithms were used to estimate cloud fraction by analyzing the camera images: one provided by the manufacturer Reuniwatt, and the other, Elifan, initially developed by CNRS. Their performance was compared to assess their relative strengths. Additionally, comparisons with MSG satellite data were carried out to ensure consistency and evaluate the complementarity of ground-based and satellite observations. Despite differences in methodology, the various data sources showed strong agreement. The results indicate that in Antananarivo, during the dry season, a high morning cloud fraction (∼50 %) is typically observed, which gradually decreases throughout the day. In the wet season (December to April), cloud fraction varies between approximately 30 % and 60 %, with reduced cloudiness observed around midday in October and November. In contrast, in Saint-Denis, Reunion, skies are generally clear in the morning but become increasingly cloudy as the day progresses, reaching up to 80 % cloud fraction during the wet season and around 60 % during the dry season.
- Article
(8879 KB) - Full-text XML
- BibTeX
- EndNote


Clouds are primarily composed of water droplets and suspended ice crystals in the atmosphere, formed through the evaporation of seawater, rivers, and lakes, as well as through plant evapotranspiration, with forests playing a crucial role in increasing cloud cover, particularly in low altitudes (Duveiller et al., 2021). Moreover, aerosols are essential for cloud formation as they act as cloud condensation nuclei (Ekström et al., 2010). Generally, clouds cover more than half of the Earth's surface (Liu et al., 2023). They contribute significantly to the energy balance at the surface, playing crucial roles in the hydrological cycle and climate change. Cloud data is required in various applications, such as estimating solar energy production (Boudreault et al., 2019), or modeling climate change (Roebeling et al., 2013). They pose challenges to climatic modeling due to their rapid temporal and spatial variability, and their properties which change with altitude, making them a complex parameter to study in the atmosphere. Cloud variability in the south-western Indian Ocean (SWIO), influenced by the expansive oceanic coverage, contributes to tropical cyclone development. Apart from that, clouds are a major source of variability in UV radiation reaching the earth's surface. Clear skies increase health risks, while fragmented clouds can amplify UV exposure. Studying clouds variability in the SWIO region is crucial to understand the interactions between cloud cover and extreme climatic phenomena which have significant societal impacts. Recently, observation stations have been installed in the Indian Ocean by the UV-Indien network (Lamy et al., 2021a) to monitor long-term variations in UV radiation and cloud fraction. Although various climate measurement instruments exist, information on cloud cover in the SWIO remains limited due to the lack of dedicated instruments. The installation of cloud fraction measurement stations from the UV-Indien network at these sites will help enrich current databases. The SWIO region is particularly vulnerable to the effects of climate change or natural disaster, which impact the population annually (Leroux et al., 2024). This study opens new perspectives for monitoring the evolution of climate variability in this region. Our study focuses on Antananarivo (Madagascar) and Reunion, two key areas in the SWIO, to better understand the region's climatic dynamics. These sites located near the equatorial region, receive abundant solar radiation, which serves as the primary source of cloud formation. The interaction between the ocean and atmosphere, but also the topography in this area are crucial for cloud formation. All-sky camera and satellite were used in this study to estimate cloud fraction. Satellites are widely used for monitoring cloud evolution with excellent spatial coverage, and provide information on a large range of temporal scales. Over recent decades advancements in satellite technology have led to improvements in spatial and temporal resolution, enhancing their capability to provide information across various regions globally. Satellite data are generally freely accessible, allowing for validation by researchers and significantly contributing to the understanding of climate change in different regions. Various satellite sensors can be used to identify cloud parameters such as cloud type or cloud fraction. DARDAR (raDAR/liDAR) mask, a combination of products from the Cloud-Aerosol Lidar and Infrared Pathfinder Satellite Observation (CALIPSO) and CloudSat measurements has been used to analyzed vertical distributions of clouds in SWIO (Vérèmes et al., 2019). One of the most well-known sensors is MODIS (Moderate Resolution Imaging Spectroradiometer), which belongs to NASA (National Aeronautics and Space Administration) and is deployed on two satellites: Aqua and Terra (Ning and Kaicun, 2015). MODIS provides cloud fraction MOD06 (Terra) and MYD06 (Aqua) products with a spatial resolution of 5 km (Nikumbh et al., 2019), offering two diurnal images over the Indian Ocean. However, geostationary satellites can offer data with high temporal resolution to monitor cloud variability. In this study, we have utilized satellites MSG (Meteosat Second Generation) operated by Eumetsat (European Organisation for the Exploitation of Meteorological Satellites). MSG provide images every 15 min with 3 km resolution. Although satellite measurements are freely available, all-sky cameras provide data at a finer spatial and temporal scale. Moreover, their storage cost is significantly lower compared to satellite images. They are also essential for filling data gaps in case of technical issues with satellites. Ground-based techniques employing cameras can continuously monitor cloud evolution with good accuracy, and can directly compared with human observations. They can be used to calibrate future satellite missions. Letu et al. (2014) conducted a study using an all-sky camera to validate the MODIS cloud mask. For all-sky cameras, image processing algorithm is needed to classify images and estimate cloud fraction. Various image processing algorithms can be used, such as those based on pixel values and classified images using thresholding criteria (Long et al., 2006), or object-oriented algorithms utilizing texture features (Liu et al., 2015). Akdemir et al. (2022) use different classification methods like K-means and Otsu to track day and night cloudiness. Compared to satellites, the field of view of camera is limited. To overcome this limitation, a new technique was adopted by Rodríguez-Benítez et al. (2021). They use multiple cameras to simultaneously cover large study areas, thereby facilitating the acquisition of images in a complementary and synchronized manner. Furthermore, they apply a normalized blue-red difference to the image to improve pixels classification. In our study, a proprietary industrial algorithm developed by the Reuniwatt company was employed to estimate cloud fraction acquired by all-sky cameras (Liandrat et al., 2017). Additionally, a second algorithm, Elifan originally developed by CNRS (Centre National de la Recherche Scientifique) was used (Lothon et al., 2019). This algorithm was specifically adapted for application over Reunion Island. Further details regarding these two algorithms will be described later. Moreover, an intercomparison was carried out to assess the performance of both algorithms, as detailed in Sect. 3.1.1. Despite the differences observed between camera and satellite data due to various factors, both observation techniques are complementary. In this study, a comparison is necessary to analyze how they complement each other. Since we are comparing two different observation methods, the differences between the measurements are apparent. These differences are generally attributed to the distinct observation positions of the two systems. The camera can be significantly influenced by low clouds, whereas satellites primarily observe clouds at higher levels, especially when all three cloud layers (low, medium, and high) are present. These discrepancies may also partly result from variations in the field of view of the two observation methods.
The main objective of this study was to examine cloudiness properties especially cloud fraction variability in the Indian Ocean. Cloud information produced in this study is essential for enhancing climate models and forecasts. The use of ground-based camera and satellite data has significantly evolved in recent years, allowing for improved observation of atmospheric and spatial phenomena. However, despite these advancements, several unresolved issues remain, particularly regarding the accuracy of measurements and the enhancement of global coverage. This study aims to address these gaps by exploring new application approaches for these technologies, thereby contributing to the further development of knowledge in this field.
This paper is structured as follows: the data and methodology section, which includes the study area, camera presentation, and algorithm description for obtaining nebulosity data; the results section; and finally, the discussion and conclusion.
2.1 Study area
As mentioned previously, we are working on two different sites in SWIO; the first station is located in the city of Saint-Denis in Reunion Island a French department, where an all-sky camera is positioned on the roof of the Faculty of Sciences at Reunion University (Fig. 1). This university is located on the northern coast of the island, at an altitude of 70 m above mean sea level, with latitude and longitude coordinates of (20.90° S, 55.49° E). To the north of the station lies the ocean, while to the south, there are towering mountains. The microclimate resulting from the topography of Reunion Island presents a particularly complex subject for study. The presence of two highest summits in the island, Piton des Neiges at 3071 m above sea level (), and the active Piton de La Fournaise volcano at 2560 , influences atmospheric circulations in the SWIO (Mialhe et al., 2020). The location of Saint-Denis provides a significant advantage for studying land and sea breezes. One notable advantage of this site is its multi-instrumentalization dedicated to atmospheric measurements (Baray et al., 2013; Durand et al., 2021). Our study contributes to advancing the understanding of this site by facilitating the comparative analysis of ground-based instruments and spatial observations. The second site is located in Antananarivo in the highlands of Madagascar, where the camera is situated at a top of a pillar on the hill of Ambohidempona, within the premises of the Institute and Observatory of Geophysics of Antananarivo (IOGA) at the University of Antananarivo. The coordinates of this site are (18.92° S, 47.57° E) at an elevation of 1370 m. These both stations were the first of the UV-Indien network, established in 2019 (Table 1). Limited documentation is available for Antananarivo, while numerous studies have been conducted on Reunion Island.
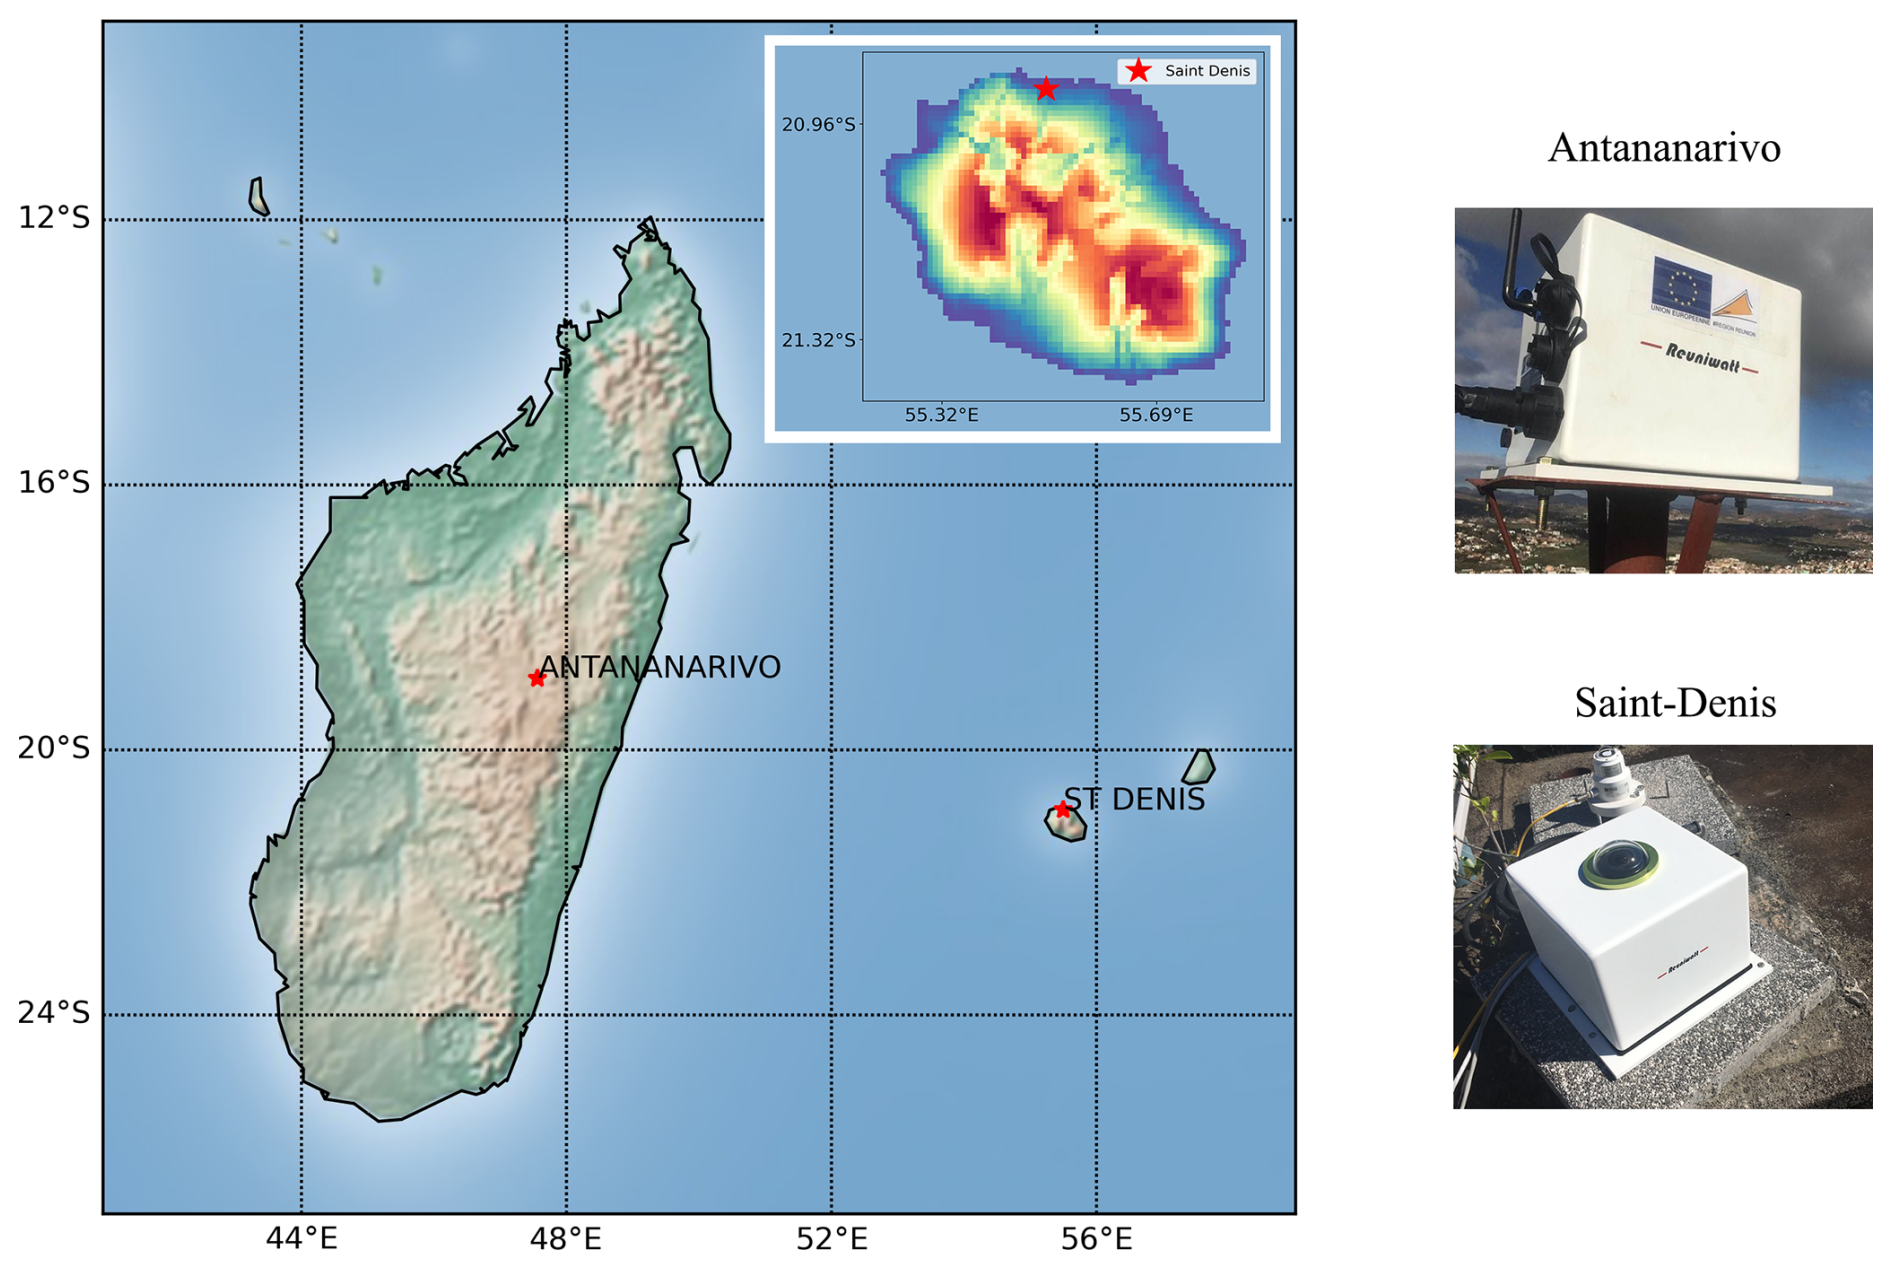
Figure 1Cameras location, Saint-Denis – Reunion and Antananarivo – Madagascar.
The data used in this study are presented in Table 1 below. For uniformity of data, we have focused our comparison (Sect. 3.1) between September 2019 and December 2021, and between September 2019 and June 2022 for cloud variability (Sect. 3.2). An extended period can be applied to establish a climatology of cloud variability when we have enough data.
2.2 Camera
To detect Cloud Fraction (CF), we utilized the all-sky imager “Sky Cam Vision”, a commercial camera manufactured by Reuniwatt company (https://reuniwatt.com/en/2019/11/11/observe-the-sky-with-our-sky-imagers/, last access: 26 October 2023). The camera is directed towards the zenith of the designated site to capture images of cloud variability from the ground within the visible range. It is outfitted with a “fish-eye” lens housed in a small glass dome to shield it from rain and weather fluctuations. The camera produces hemispherical images in high definition range (HDR) with a spherical view angle of 360°×180° around the site where the camera is positioned. The resolution of the images is 2048×2048 pixels, acquired at intervals of 30 s that can be adjusted through the user interface. The algorithms applied on the camera images, namely Reuniwatt and Elifan, are based on the red over blue ratio (RB) obtained from images, hereafter referred to as RBR. They are detailed in Sects. 2.3 and 2.4.
2.3 Reuniwatt algorithm
Reuniwatt performs image segmentation using a Random Forest algorithm (Breiman, 2001) to classify pixels into different categories. The Random Forest learning is conducted on several color spaces using thousands of pixels from sky cam vision images that have been manually labeled. The pixels were labeled into 4 categories: clear sky, thin cloud, thick cloud, and sun. This process results in an image containing these 4 labels, which allows for two types of segmentation. One segmentation identifies only thick clouds, while the other identifies all clouds. In all cases, the sun pixels are considered as clear sky pixels in the segmented image. In this study, the cloud fraction used has been computed on the segmentation of all clouds. The cloud fraction is then calculated using a weighted average based on the angles of pixels in a geometrically calibrated image. This method is described in Long et al. (2006). The Random Forest algorithm performs pixel classification utilizing texture and shape information from the images, providing an improved segmentation compared to thresholding alone. This allows Reuniwatt to obtain cloud fraction outputs with high accuracy. Reuniwatt algorithm application has already been demonstrated in several previous publications (Cadet et al., 2020; Lamy et al., 2021b).
2.4 Elifan algorithm
Elifan is an image-processing algorithm initially developed by CNRS in 2013 and is currently used by the ACTRIS-France community (Lothon et al., 2019). It allows us to get daily nebulosity or cloud fraction from all-sky cameras and is operational at various measurement sites of ACTRIS-France. The data is processed and centralized at the AERIS data center to ensure homogeneity. We have adapted the Elifan algorithm on two new sites of ACTRIS-France located in Reunion Island on which we have a Reuniwatt camera, at the University of Moufia Saint-Denis and Maido Observatory (Baray et al., 2013). Two different classification methods can be employed: one based on pixel values (pixel-oriented) and the other based on the texture or shape of the image (object-oriented). In our case, the algorithm utilizes classification by the pixel value. Two thresholding methods, namely absolute and differential, detailed in Sects. 2.4.3 and 2.4.5, respectively, are applied to the RBR to distinguish clouds from the blue sky (Lothon et al., 2019). However, various pre-processing steps, as outlined below, are first applied to the images. Each thresholding method has its strengths: absolute thresholding yields better estimation when the sun is obscured by clouds, whereas differential thresholding is generally good in other scenarios (Lothon et al., 2019). All the processing steps of Elifan are detailed further in Lothon et al. (2019). Here, we will only present the steps that have been adapted for the case of Reunion as follows:
-
Cropping image and creating object masks
-
Generating solar masks
-
Creating a library of blue sky images
-
Defining absolute and differential threshold values
In summary, the application of various mask types (sun and object) to enhance measurement accuracy is one of the key strengths of this algorithm. Furthermore, the use of two distinct thresholding methods (absolute and differential) improves the algorithm's precision compared to other image processing algorithms.
2.4.1 Cropping image and object mask creation
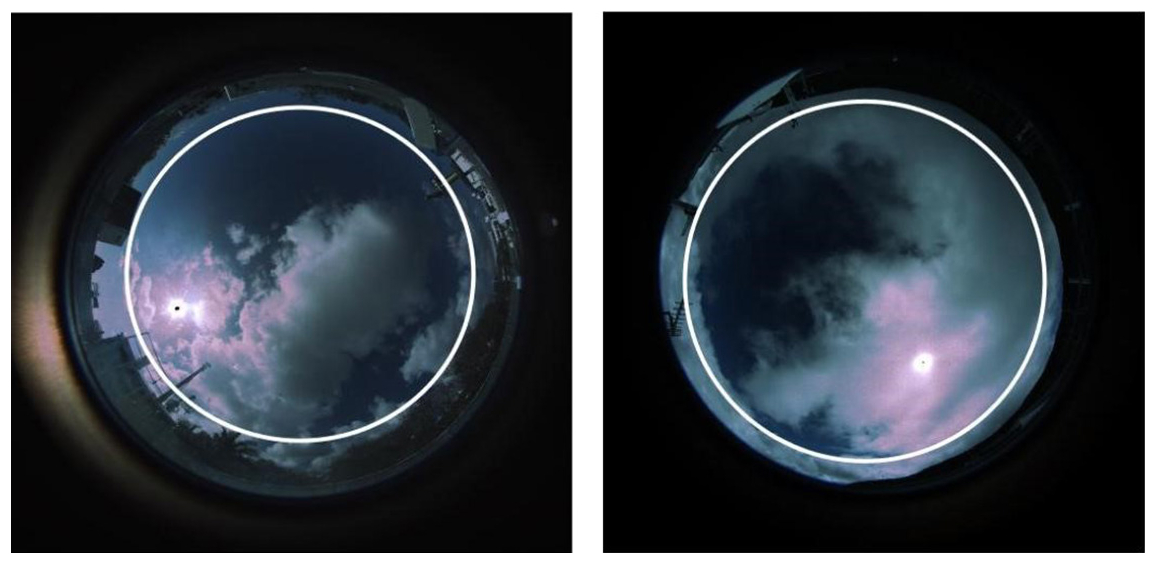
To crop the observed image, we have selected a 70° radius angle around the zenith, which is equivalent to the angle chosen in the Reuniwatt algorithm. This is done to exclude areas near the horizon where pixels show significant distortion or deformation, thus making interpretation challenging. Another rationale for this choice is to avoid including objects such as buildings that may appear in various observation sites. The white circle in Fig. 2 delineates the boundary, indicating that only the image inside the circle will be considered for the subsequent processing steps.
Depending on the site, certain elements with moving parts may not be completely eliminated during the cropping step, as observed at the Moufia Saint-Denis site (Fig. 3). To address this issue, we have defined an additional object mask, depicted in black (Fig. 4a). The raw images have a resolution of 2048×2048 pixels, while the preprocessed images, after cropping and excluding areas affected by pixel distortions near the horizon and object interferences around the site, have a resolution of 1271×1271 pixels.
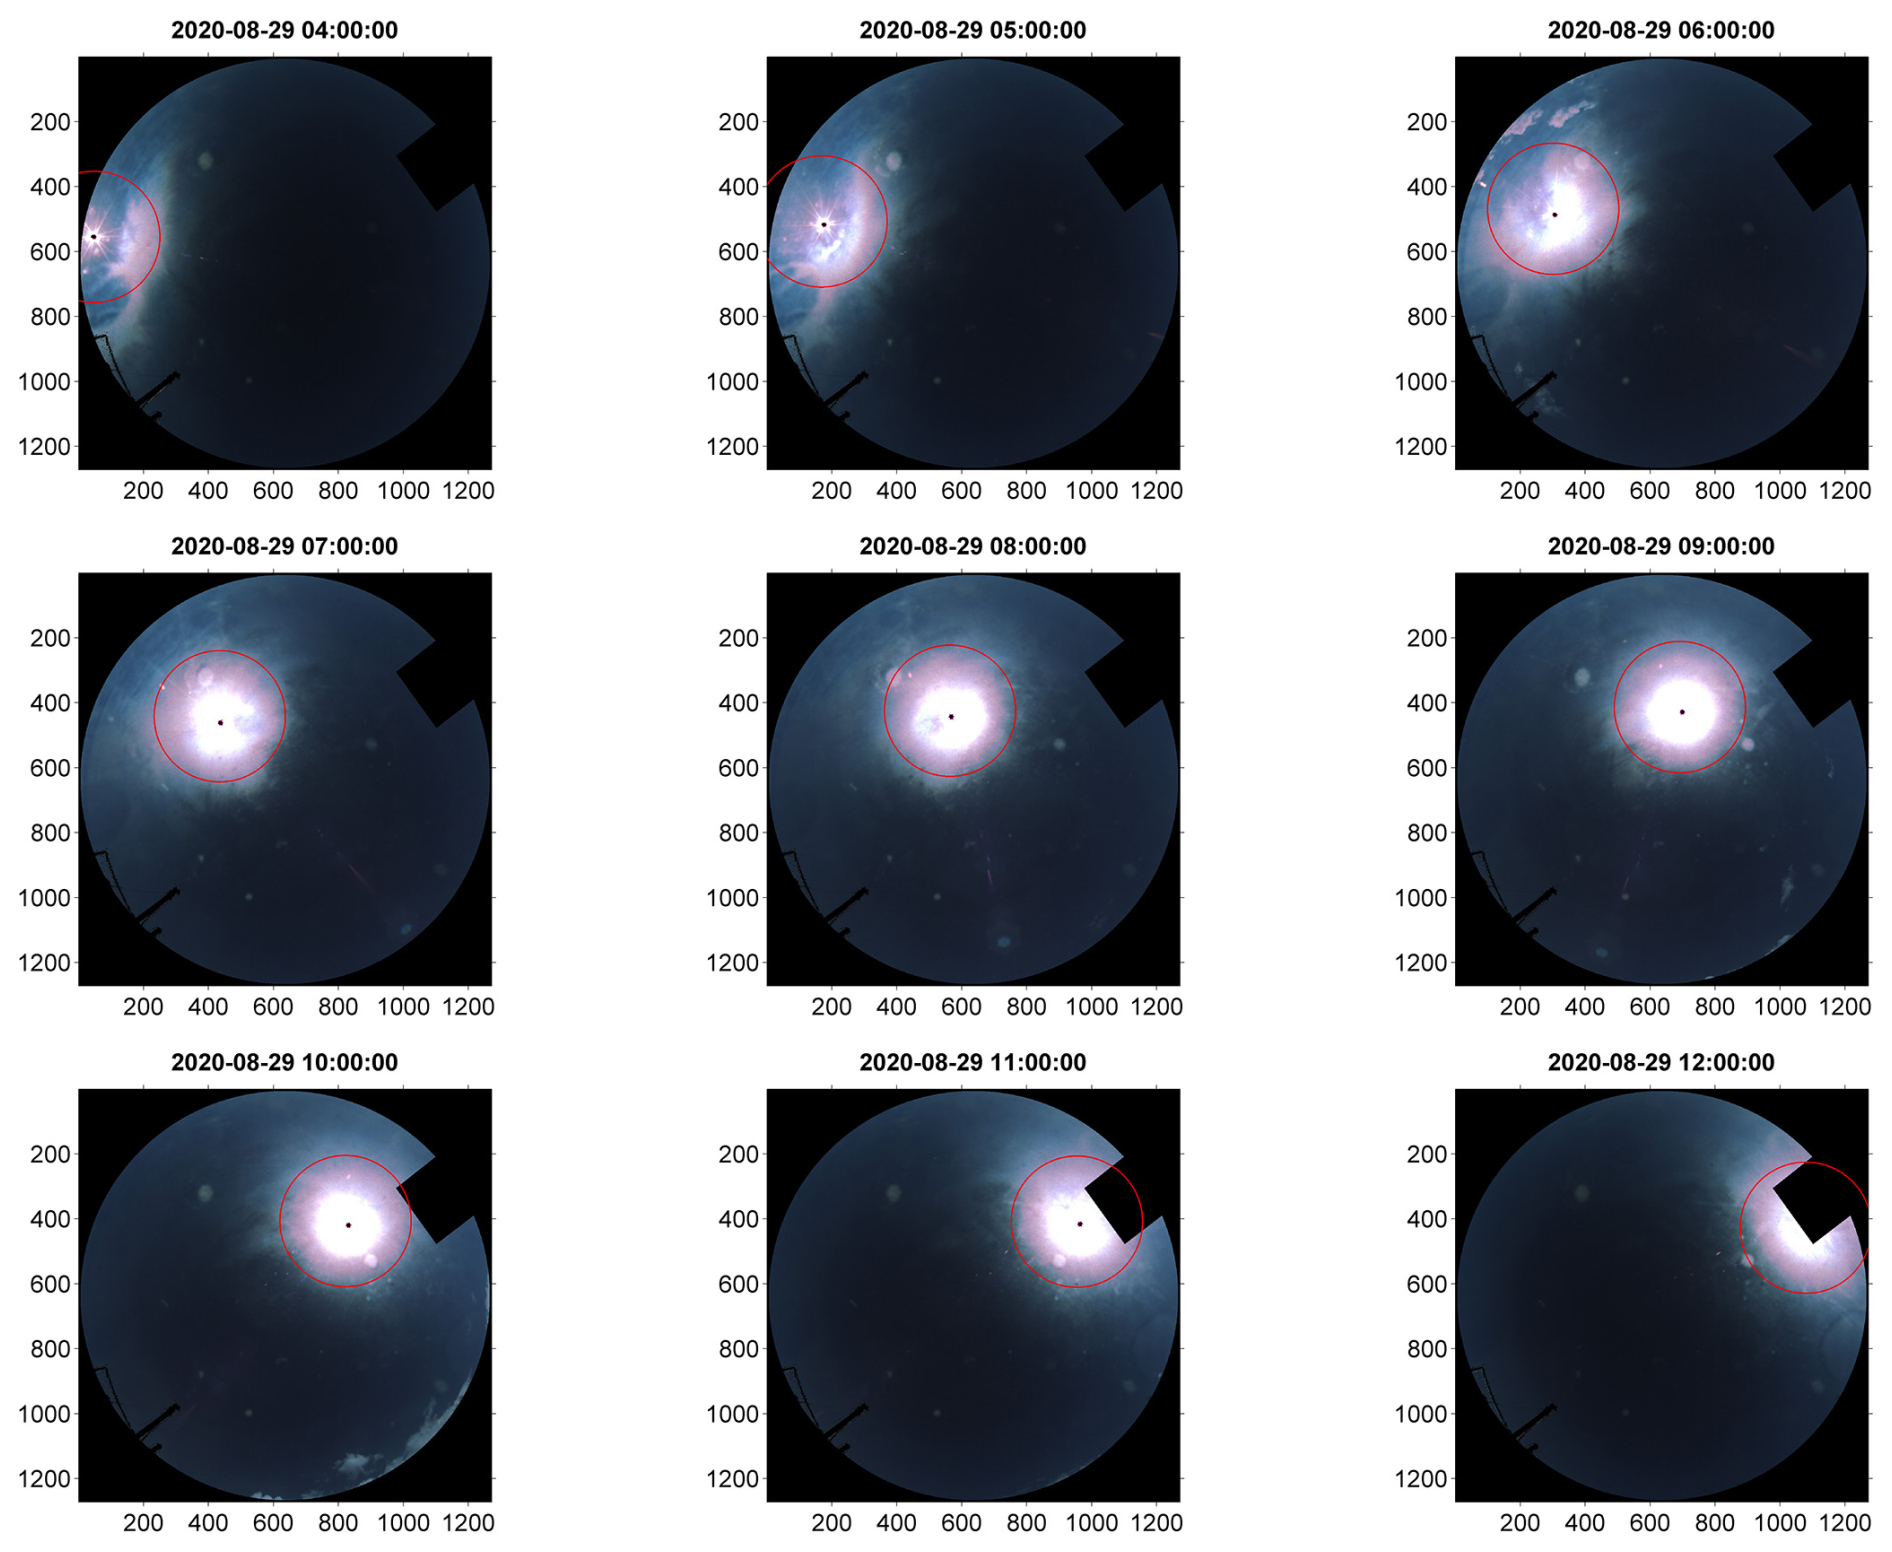
Figure 3Simulated trajectory of the sun (red circle) on 29 August 2020, every hour from 04:00 to 12:00 UTC.
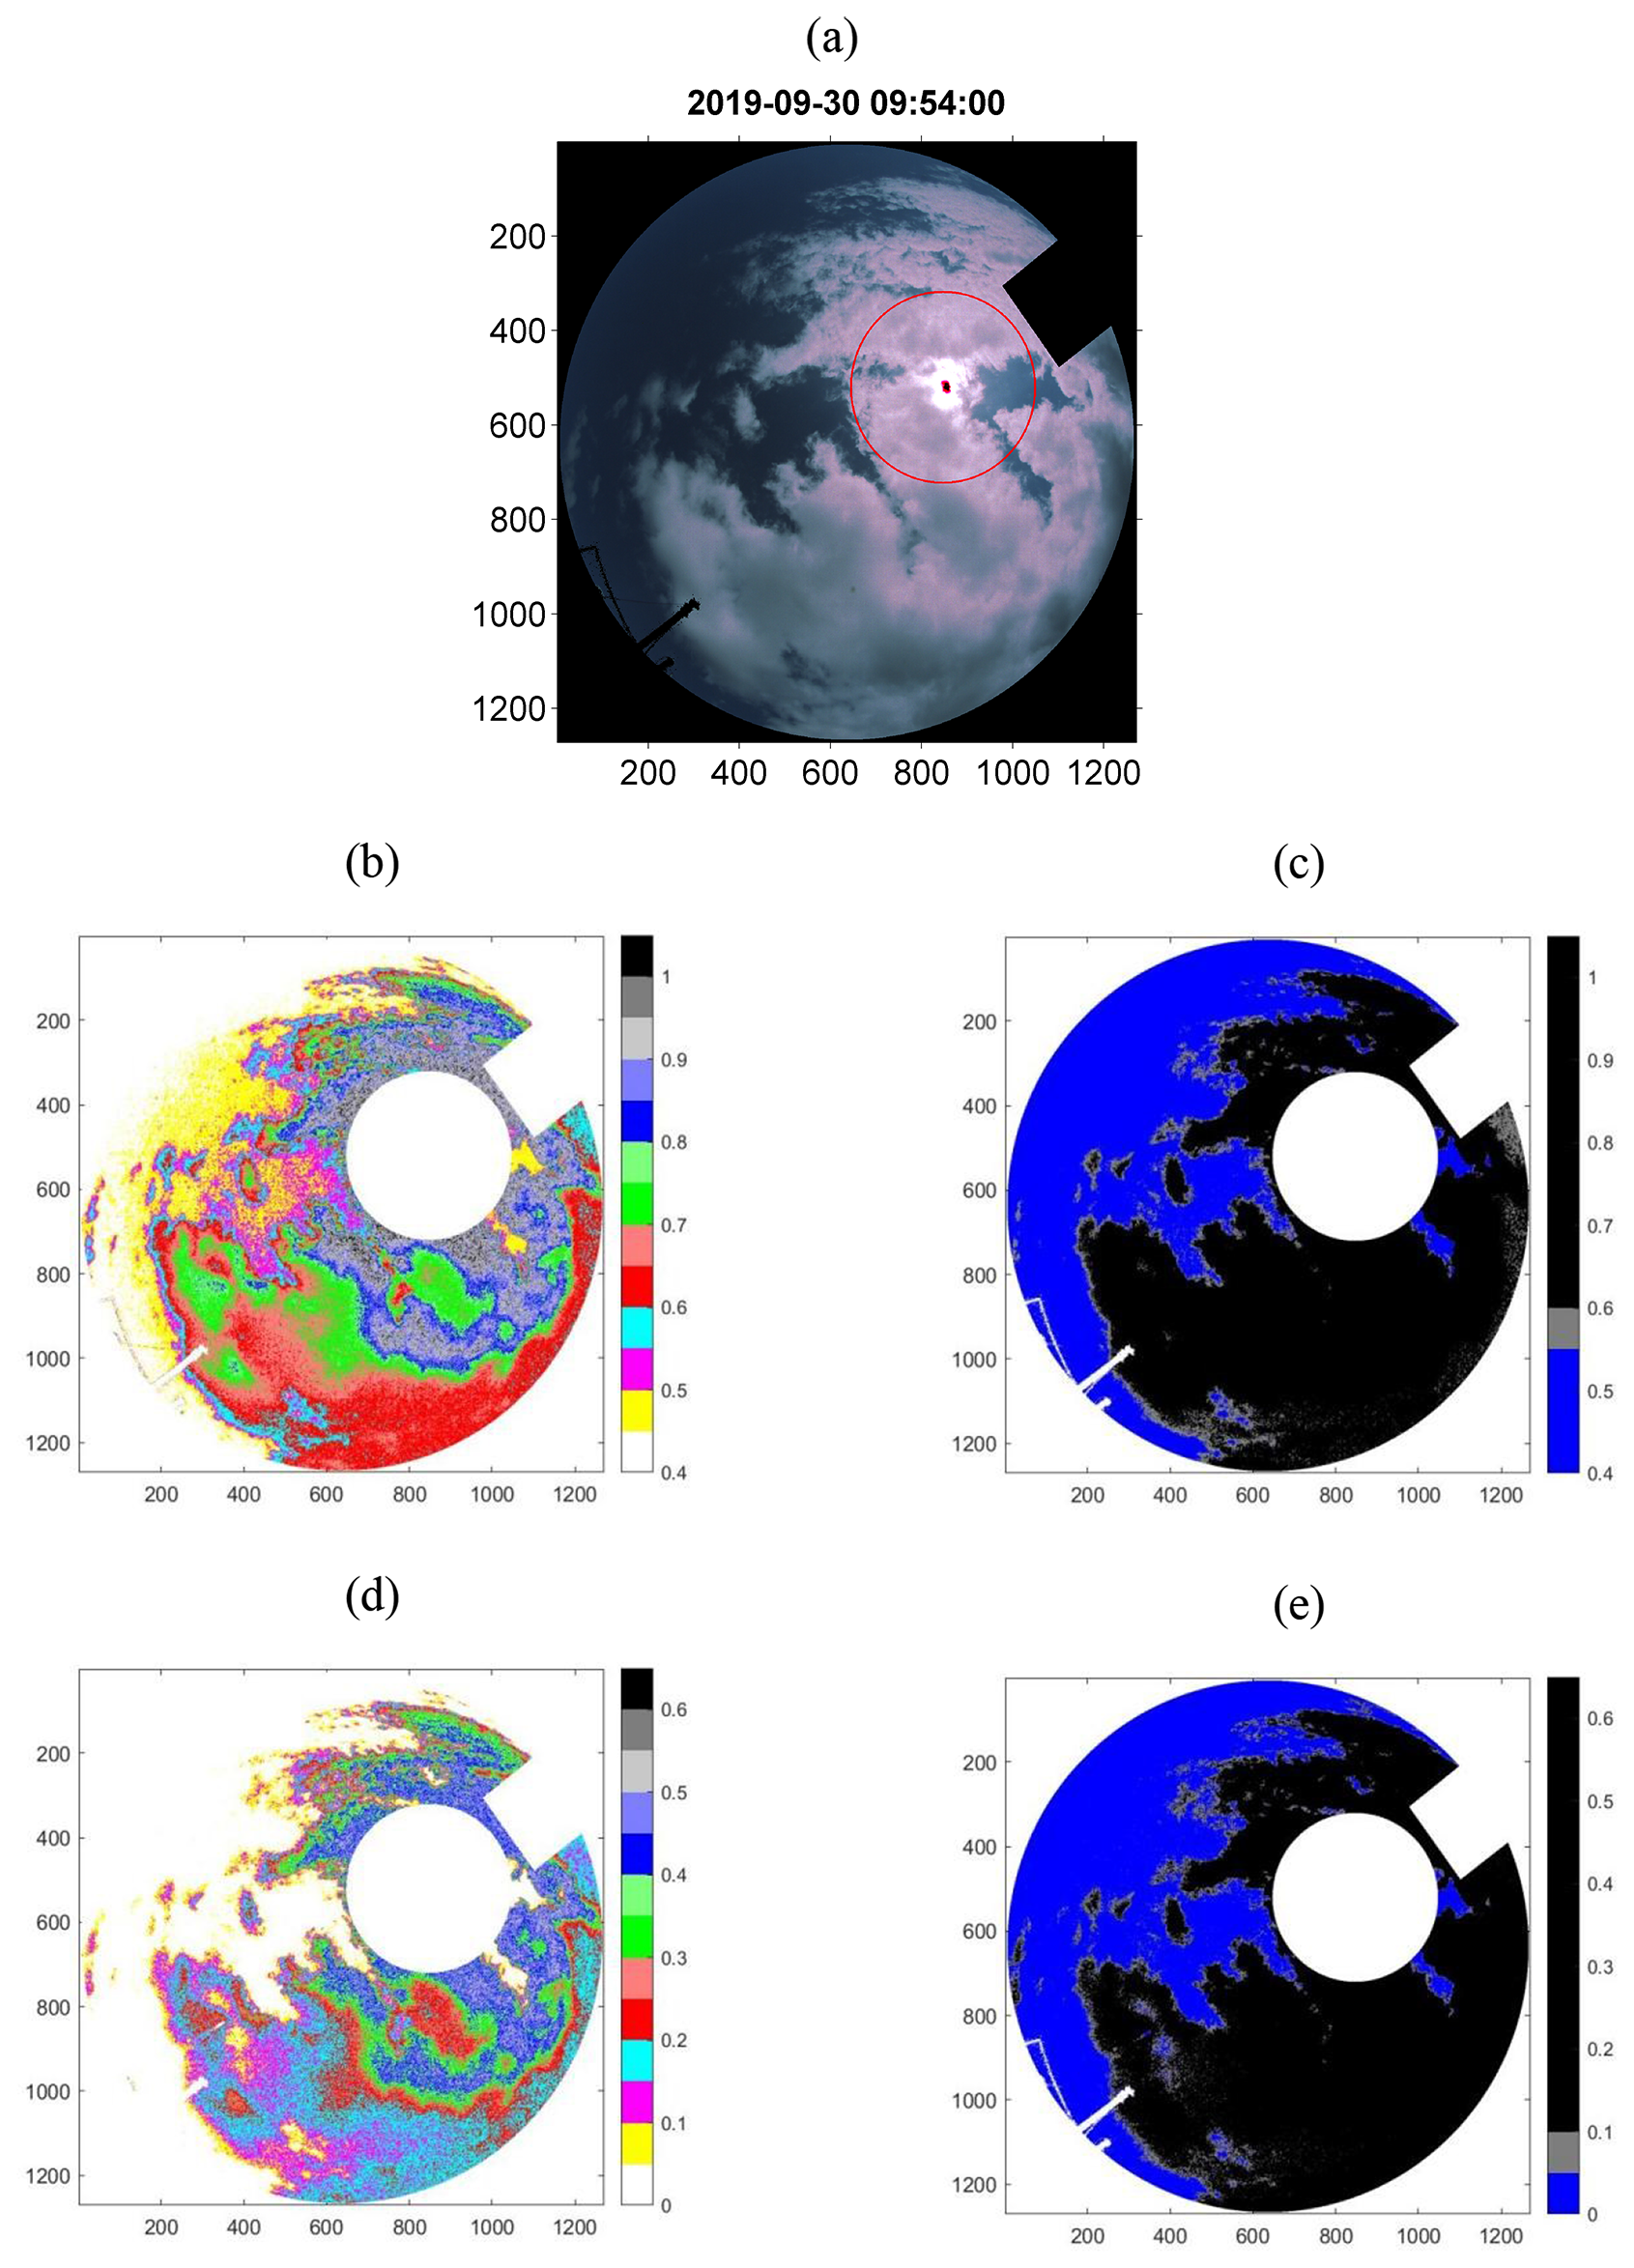
Figure 4Intermediate image processing results at Moufia Saint-Denis – 30 September 2019 at 09:54:00 UTC. (a) Cropped image containing the solar mask represented by the red circle, and the object mask in black. (b) Multi-color image processed using the absolute thresholding method. (c) Tricolor image processed with the absolute thresholding method. (d) Multi-color image processed using the differential thresholding method. (e) Tricolor image processed using the differential thresholding method. The color scale (dimensionless) represents the ratio of radiometric values of the red and blue bands.
2.4.2 Solar mask
The creation of the mask is necessary to exclude the area surrounding the sun, which tends to be oversaturated in the image and can lead to overestimation of results. To address this issue, a dynamic mask that varies according to solar angles (zenith and azimuth) is required. Initially, we have conducted the process without utilizing a sun mask by selecting images from a day when the sun is unobscured by clouds. The goal was to obtain samples of solar positions to establish Eq. (1) below. We have employed cubic regression, which provides the most accurate representation of the sun's trajectory in the image. This method draws inspiration from the approach used by Lothon et al. (2019), where the position of the solar mask adjusts according to both input variables: the zenith angle (α) and the solar azimuth angle (θ).
IS represents the abscissa and JS represents the ordinates of pixels in the image. A1, B1, C1, D1, A2, B2, C2, and D2 are the coefficients obtained from samples extracted from the image processing of a day without a mask, where the area around the sun in the image is not obscured by clouds. Once we have obtained the equation, the coefficients D1 and D2 can be manually adjusted to correct deviations. We have taken an example of 29 August 2020 (Fig. 3), a date on which the sky is almost completely clear throughout the day.
2.4.3 Absolute thresholding
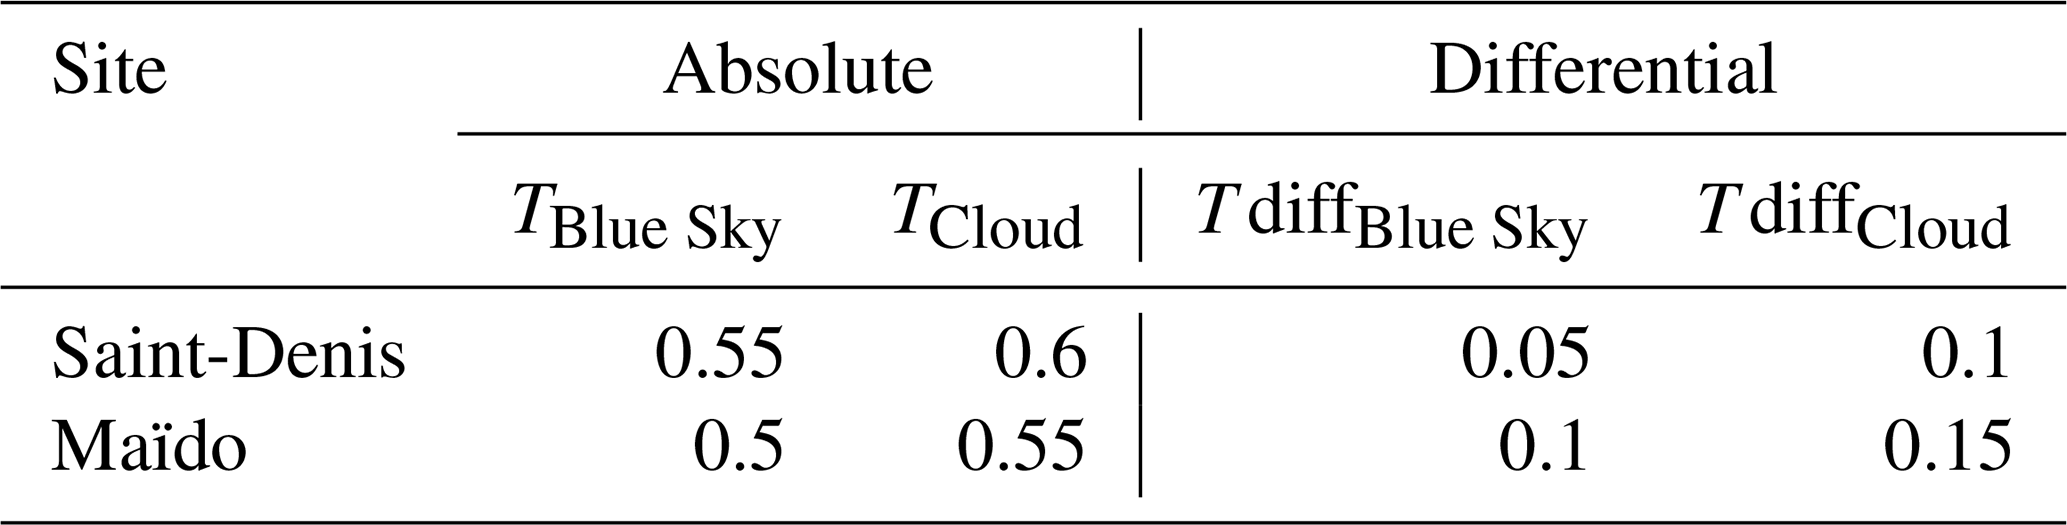
The classification is determined by applying different thresholding definitions to the RBR. Two sets of values have been defined: one set consists of values greater than the threshold denoted by TCloud, and the other set consists of values less than the threshold TBlue Sky. These values can be found in Table 2. From these threshold definitions applied to the RBR, three distinct pixel classes are derived: Cloud, Blue Sky, and Uncertain. The thresholds are defined as follows: pixels with RBR values less than TBlue Sky are classified as “Blue Sky”, pixels with RBR values greater than TCloud are classified as “Cloud”, and pixels with RBR values between TBlue Sky and TCloud are categorized as “Uncertain”.
-
Blue Sky (RBR≤TBlue Sky)
-
Uncertain ()
-
Cloud (RBR>TCloud)
Table 2Threshold value chosen for Saint-Denis and Maïdo sites.
2.4.4 Blue Sky Library Creation
The establishment of the blue sky image library is essential for conducting the process of differential thresholding. To determine whether an image is clear or cloudless, we are using the condition outlined by the following relation (Eq. 2).
If an image satisfies this condition, it will bypass the algorithmic classification process and be directly added to the clear sky library. The constant parameters may differ depending on the type of camera used and the specific site being studied, as aerosol levels at each site can affect the quality of image classification (Lothon et al., 2019). However, in our case, aerosol is not taken into account in the algorithm. Threshold values can be visually determined from the multi-color image (Fig. 4). The values specified here in Eq. (2) correspond to those of the Moufia-Saint-Denis station.
2.4.5 Differential thresholding
In the image, multiple solar reflections on the plexiglass protecting the fisheye lens are sometimes present. Additionally, saturations that could not be eliminated by the sun mask occur. To minimize these effects, we have utilized a clear sky image library. The principle is the same as that of the absolute thresholding method using the RBR, but it is only applicable when a clear sky image with the same solar angle (azimuth and zenith) as the processed image is available in the library. This method is inspired from Ghonima et al. (2012). The concept is straightforward: subtract the RBR of the processed image from that of the reference clear sky image with the same solar angle in the library.
-
Blue Sky ()
-
Uncertain ()
-
Cloud ()
The threshold values defined in differential methods are presented in Table 2 below. Depending on the camera model and its configuration, as well as the characteristics of aerosols or haze variability at each station, these threshold values may vary from one site to another (Lothon et al., 2019). These threshold values are visually identified through photo-interpretation of the pseudo-colored images (Fig. 4b), by comparing them with the real images (Fig. 4a). One of the main reasons for generating the pseudo-colored images is to facilitate this comparison. The differences between absolute and differential methods are not significant, as demonstrated in Fig. 4. This is why we just utilize absolute thresholding for comparison in Sect. 3.1.
2.5 MSG / SEVIRI
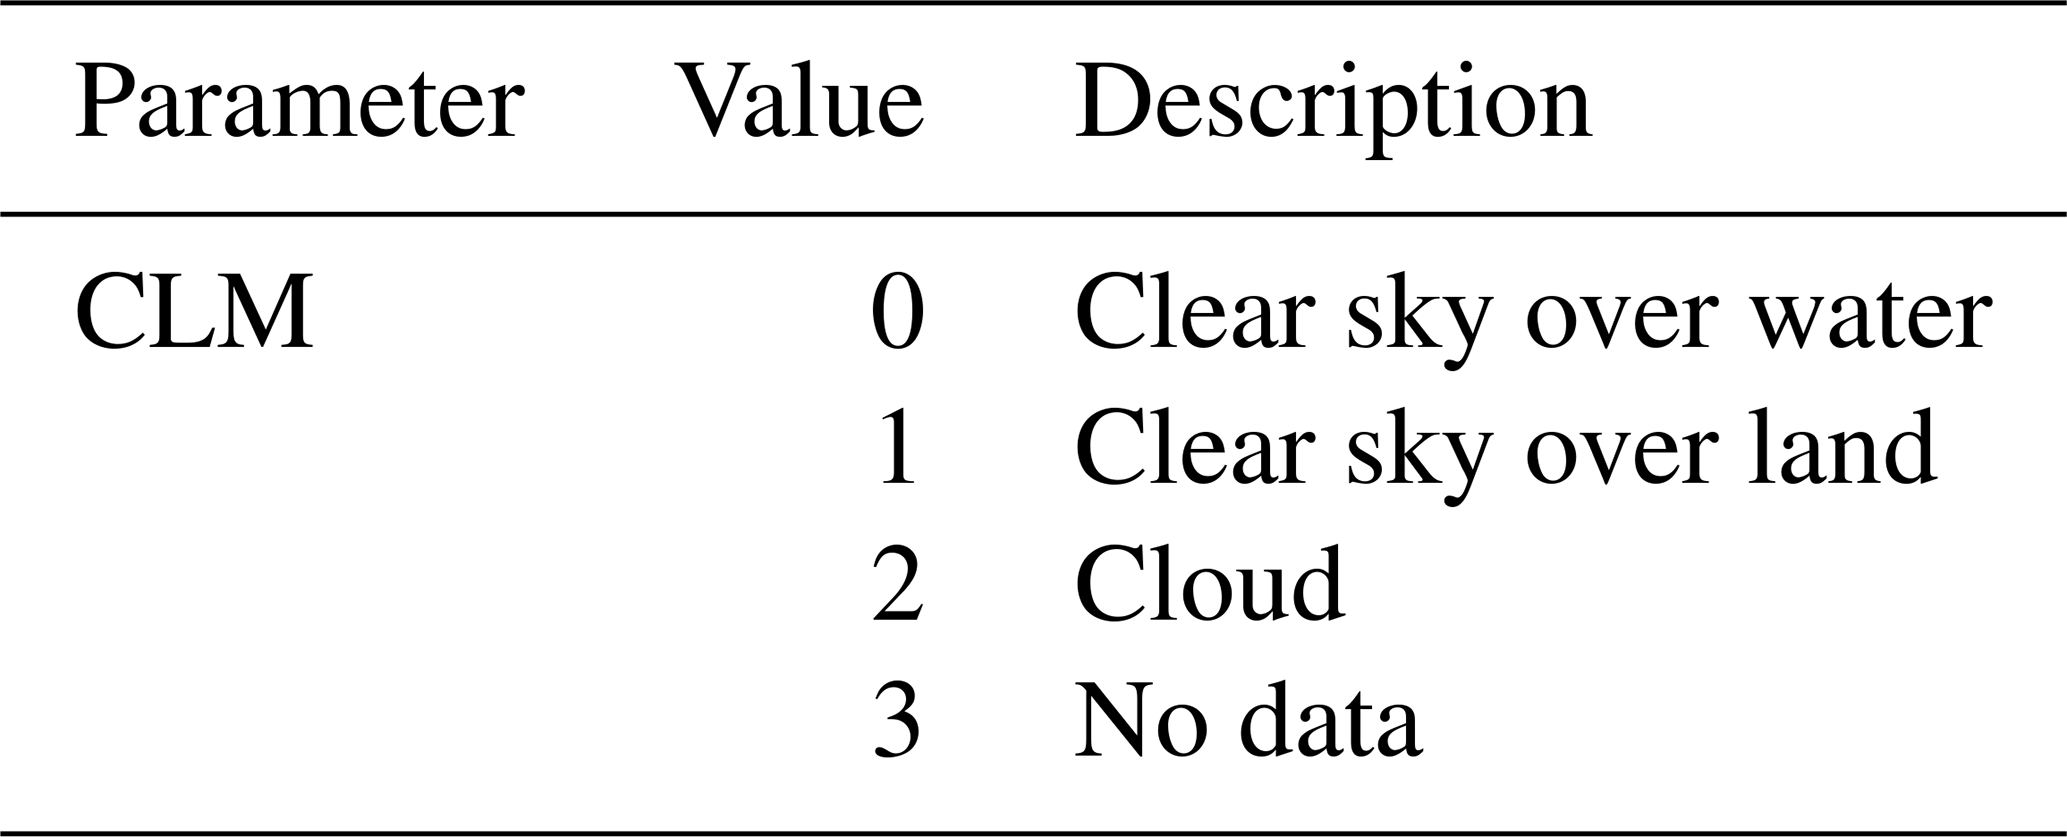
Meteosat Second Generation (MSG) is a meteorological satellite mission operated by Eumetsat. Four satellites positioned at an altitude of 36 000 km have been synchronized to provide meteorological data. They provide images of the full disk with dimensions of 3712×3712 pixels, covering Europe, Africa, and parts of the Indian Ocean since 2002 (Werkmeister et al., 2015). Operating in a geostationary orbit, the MSG mission focuses on observing various parameters including clouds, land, and ocean surfaces. The MSG mission concluded in 2022 and was recently replaced by the Meteosat Third Generation (MTG-I1) satellite. The latter offers significant improvements in spatial and temporal resolution by providing images every 10 mn with three resolutions: 0.5, 1, and 2 km, corresponding to different wavelength bands. MSG employs the Spinning Enhanced Visible and Infrared Imager (SEVIRI) sensor, which captures images in 12 spectral bands ranging from visible to infrared. These include three visible channels (0.6, 0.8, and 1.6 µm), eight thermal infrared channels (3.9, 6.2, 7.3, 8.7, 9.7, 10.8, 12, and 13.4 µm), and one high-resolution broadband visible channel (Taravat et al., 2015). The spatial resolution varies from 1 to 3 km depending on the bands or wavelength range. In 2016, the MSG satellites were repositioned at a longitude of 41.5° E to center images over the Indian Ocean, continuing the service previously provided by Meteosat 7. MSG took images every 15 min, offering significant advantages by providing day and night observations with infrared bands, resulting in a total of 96 images per day. This study utilizes the Cloud Mask (CLM), a product obtained through multispectral threshold tests that classify pixels into different categories (Bley and Deneke, 2013). Further details of the algorithm to derive CLM are provided in Derrien and Le Gléau (2005). The pixel values in CLM images are defined in Table 3 below. CLM has a spatial resolution of 3 km×3 km and is available upon request and free of charge from the Eumetsat website https://www.eumetsat.int/ (last access: 26 October 2023).
It is important to note that CLM and cloud fraction are two distinct variables. CLM, in binary format, only indicates whether a pixel represents a cloud or not. In contrast, the cloud fraction is derived through an additional calculation applied to the CLM, yielding a value that represents a range of measurements from 0 % to 100 %. The cloud fraction (CF) at each site was obtained from CLM images using the following calculation.
We have considered the pixels within a square window of 3×3 pixels centered on the nearest point to the station. Further details regarding the selection of the window size will be discussed later in Sect. 3.1.2.
Cloud fraction offers a broader view of cloud variability, but it may sometimes miss specific details that can be clarified through cloud type. Cloud type provides essential additional context for interpreting certain cloud characteristics, offering a deeper understanding of variability that cannot be fully captured by cloud fraction alone.
Cloud Type (CT) data can be retrieved from the ICARE (Cloud-Aerosol-Water-Radiation Interactions) data center platform at https://www.icare.univ-lille.fr/asd-content/extract/subset/ordergeo (last access: 26 October 2023). Due to redundancy and the absence of certain classes in this region, reclassification is necessary. To facilitate data interpretation, we have redefined the pixel values in CT, initially defined by SAFNWC (Satellite Application Facility for supporting NoWCasting and very short-range forecasting), into six different classes: cloud-free, low clouds, medium clouds, high opaque clouds, fractional clouds, and high semi-transparent clouds (refer to Fig. 5). A similar study involving the reclassification of cloud-type products has been previously conducted by Philippon et al. (2016).
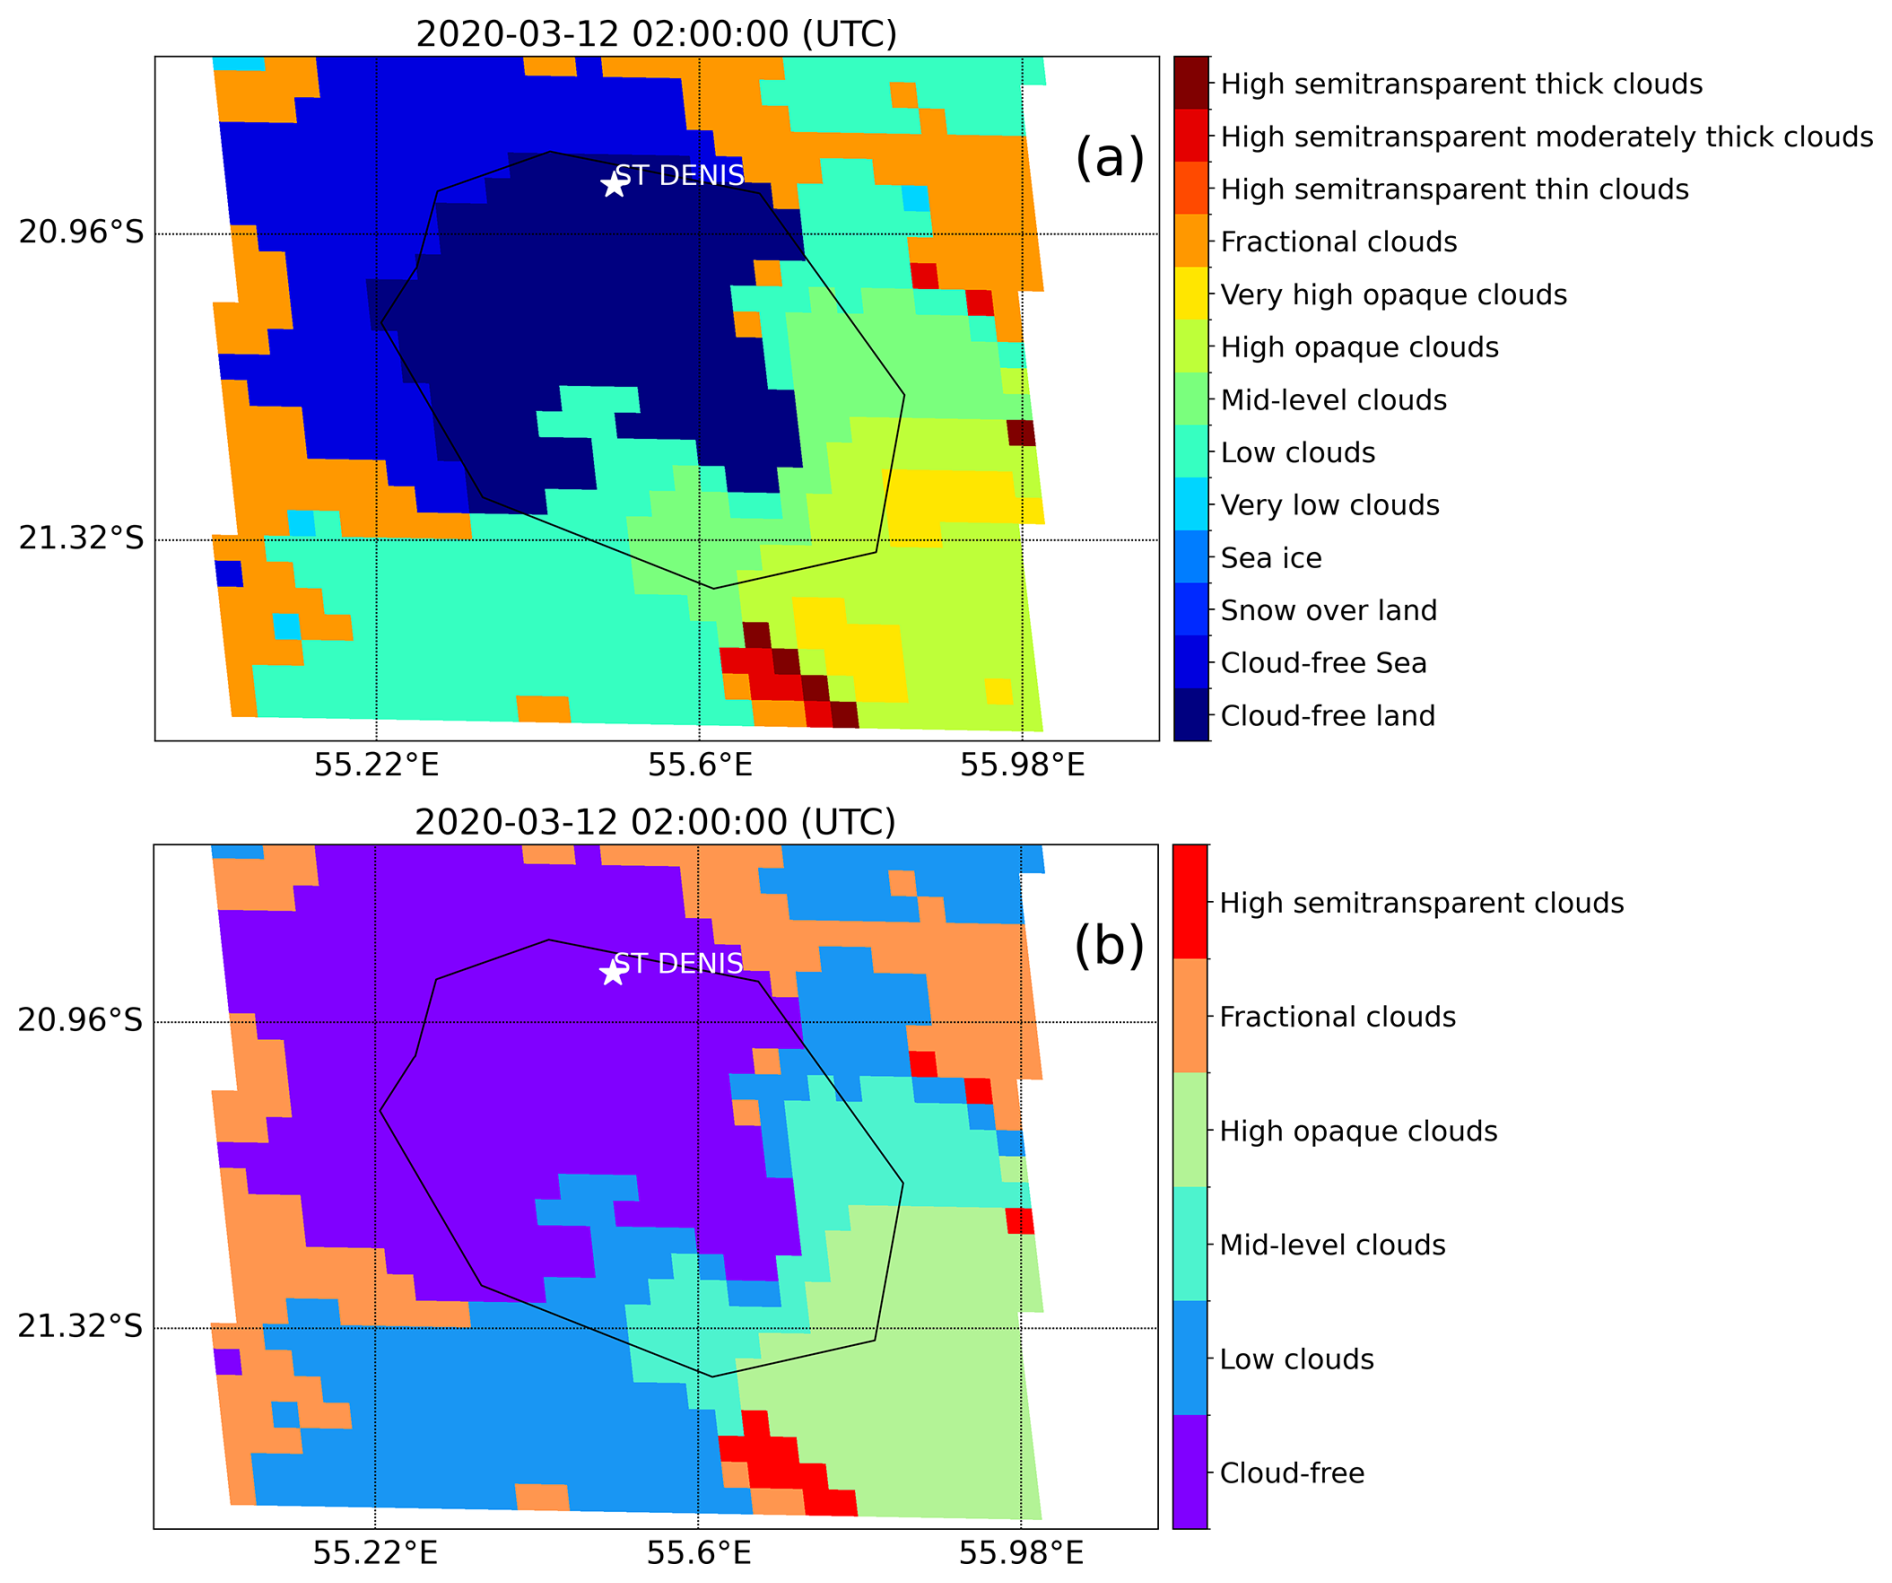
Figure 5Initial classification of cloud type of MSG/SEVIRI (a). Reclassification of pixels values (b).
2.6 Statistical parameters
To compare each measurement, the following statistical parameters were utilized. Equation (4) computes the bias, enabling us to estimate differences between both measurements. The variability of the measurement can be determined using the Root Mean Square Error (RMSE), as shown in Eq. (5). The performance of each comparison can be evaluated by the correlation coefficient (r), as expressed in Eq. (6).
xi and yi represent the algorithms that were compared (e.g., xi for Elifan and yi for Reuniwatt; or xi for Elifan or Reuniwatt and yi for MSG)
3.1 Comparison
3.1.1 Elifan against Reuniwatt
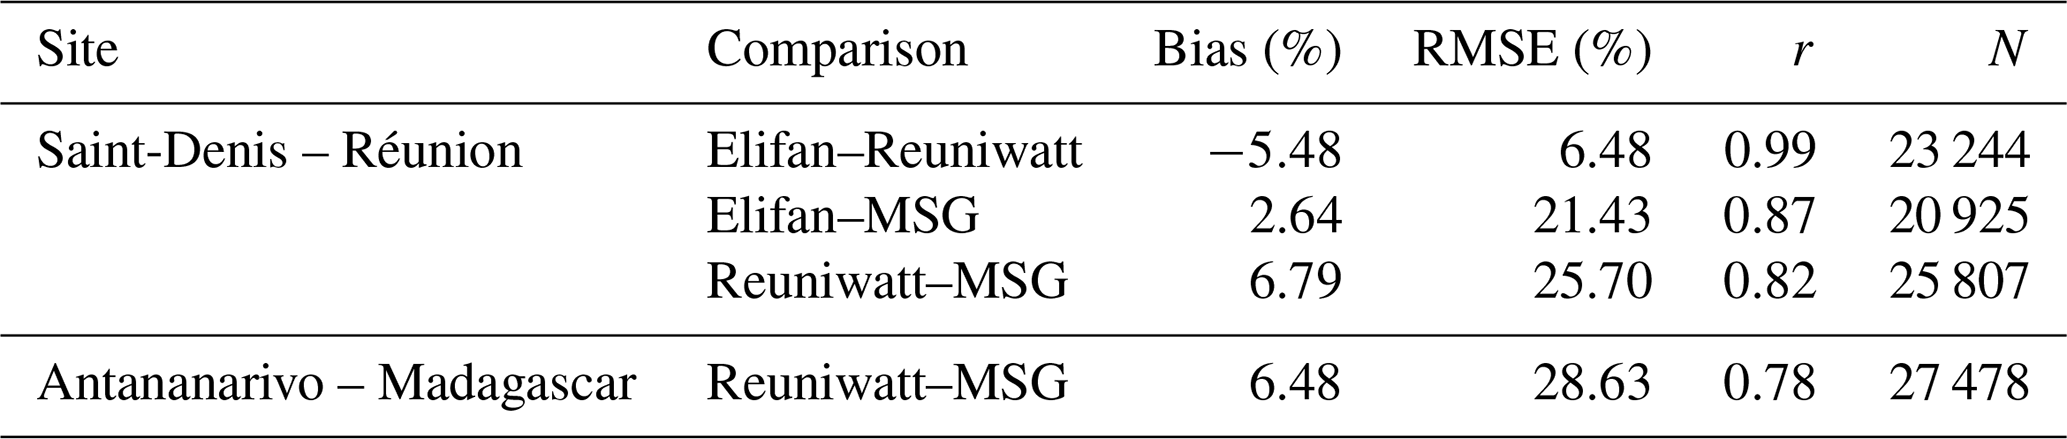
Table 4 compares the Elifan and Reuniwatt algorithms for cloud fraction retrieval. It is important to note that direct comparison is challenging because they analyze different sky regions. Reuniwatt considers the entire sky image, while Elifan masks out the area surrounding the sun to avoid saturation. This masking explains the observed difference, where Reuniwatt generally yields slightly higher cloud fractions than Elifan. Despite this difference, both algorithms demonstrate good agreement with a low Root Mean Square Error (RMSE) of 6.48 % and a high correlation coefficient (r=0.99). The small offset is likely due to Elifan's exclusion of the solar zone, which is often saturated and can lead to overestimation. This difference is more pronounced around noon when solar irradiance is most impactful. Therefore, both algorithms offer comparable performance for cloud fraction calculations. Since Elifan couldn't be applied at the Antananarivo site due to data management reasons, Reuniwatt can be confidently used without compromising accuracy.
Table 4Statistical parameters (root mean square error “RMSE”, correlation coefficient “r”, and number of observation “N”) to compare each measurement.
3.1.2 Camera against Satellite
Each measurement from ground or space-based sources has its advantages and weaknesses. Camera images operate within a visible wavelength range, which constitutes their limitations. Cameras often struggle to accurately estimate cloudiness, particularly around sunrise and sunset (Lothon et al., 2019). The uncertainty of cloud masks from MSG satellites is primarily related to the spatial and temporal variability of surface reflectance, caused by changes in atmospheric aerosols or vegetation. Thin cirrus clouds are sometimes undetected by satellites because their spectral signatures are similar to clear skies (Taravat et al., 2015). The cloud fraction (CF) at each site was obtained from CLM images using a square window of 3×3 pixels centered on the nearest point to the station. The number of cloud pixels included in the window was calculated and divided by the total number of pixels within the same window Eq. (3). Pixel values are represented by points, as depicted over Reunion Island in Fig. 6 below, where dark blue dots represent cloud pixels.
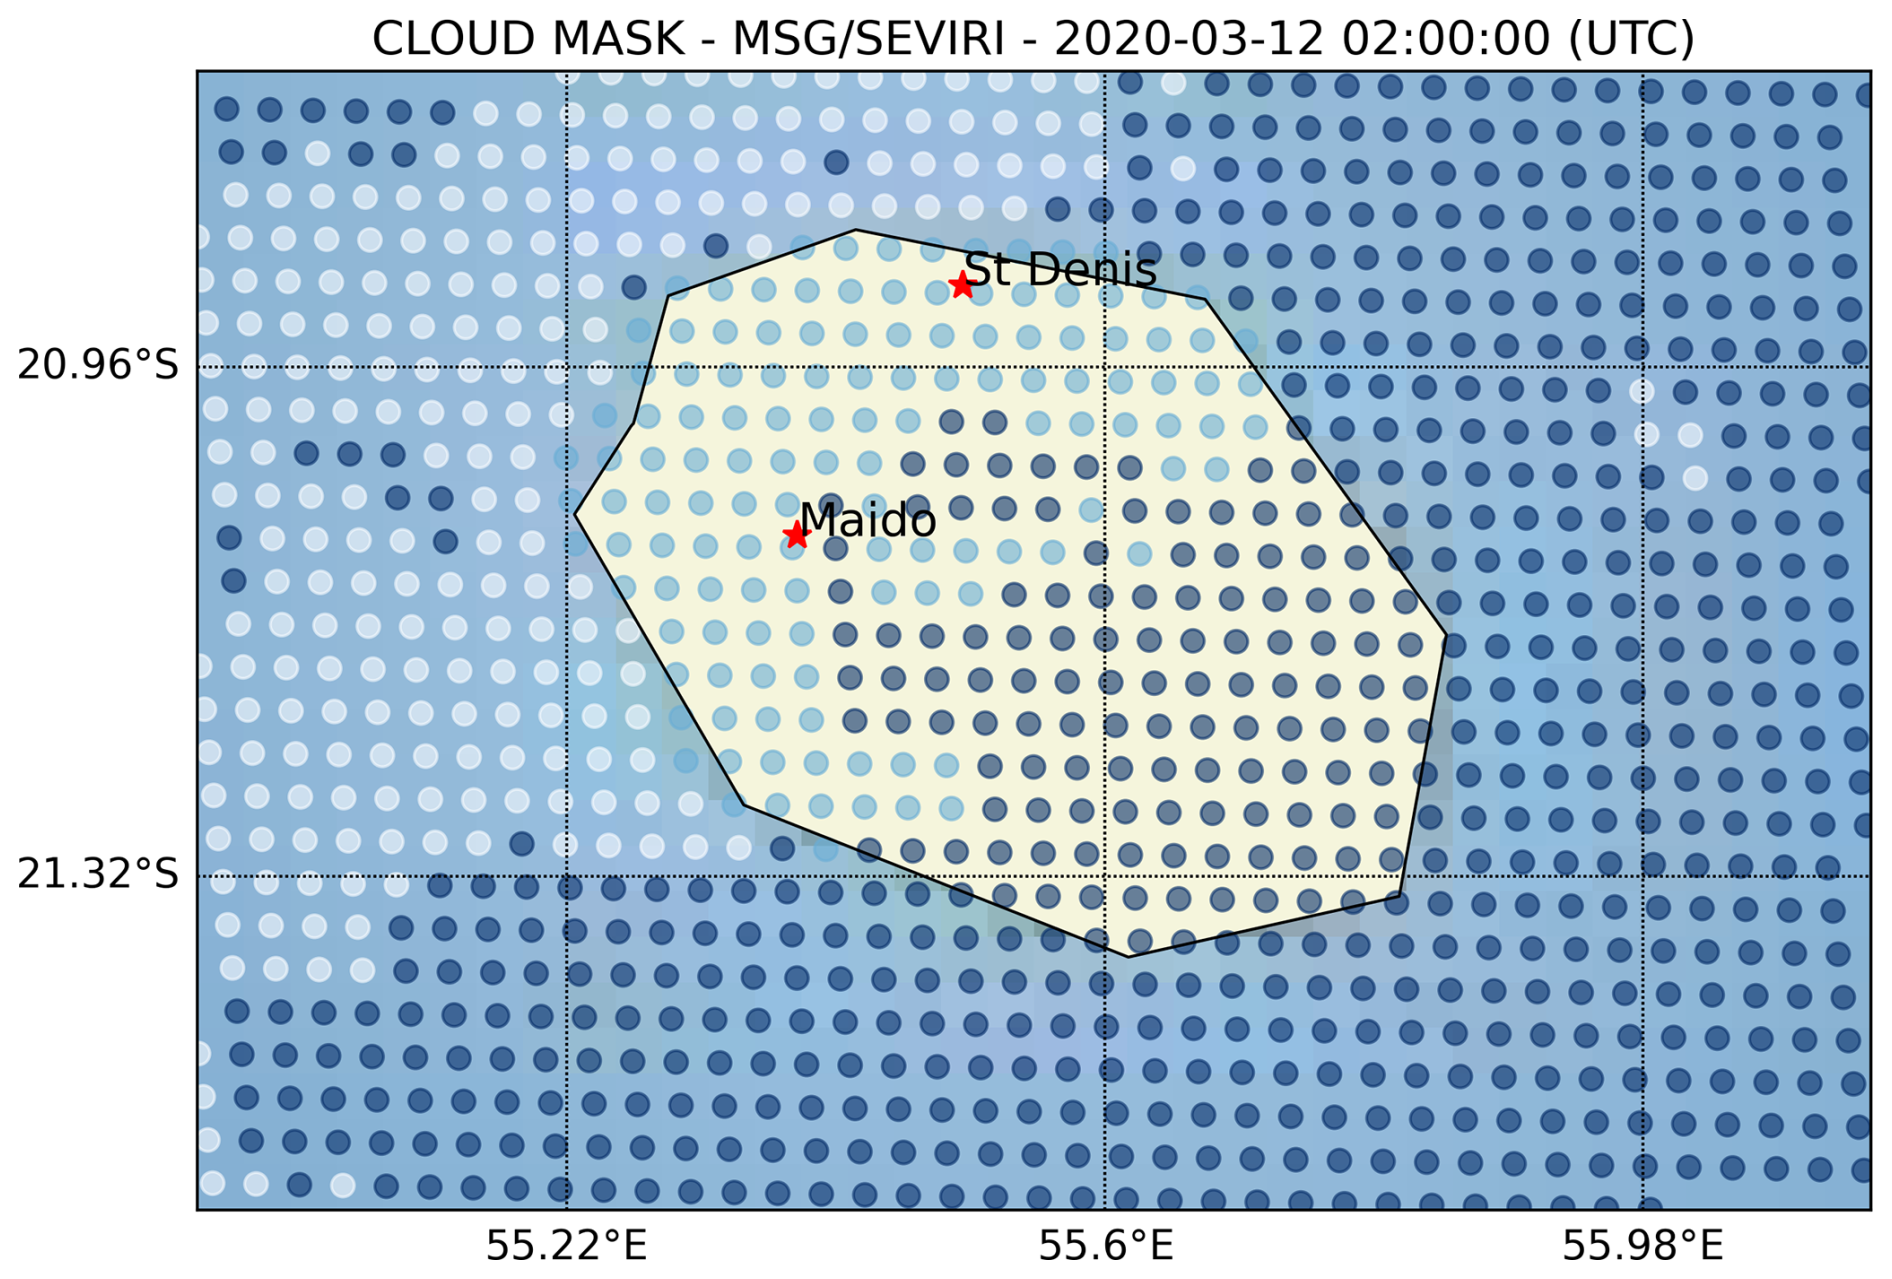
Figure 6Pixels extracted from Cloud Mask of MSG/SEVIRI over Reunion Island where cloud pixels are represented by dark blue dots.
The choice of pixel window size to calculate cloud fraction from the Cloud Mask of MSG/SEVIRI can significantly impact the quality of comparison. Different window sizes, such as 3×3, 5×5, 7×7, or more, can be considered. We have opted for a dimension of 3×3, which closely aligns with camera observations and is less influenced by topographical variability. Increasing the window size tends to amplify the differences between camera and satellite observations. However, the observation radius of the camera depends on two parameters: the cloud height and the camera's field of view. In our case, it is primarily determined by the zenith angle of 70°, as represented by the formula below Eq. (7).
Due to the lack of data on cloud base height in Antananarivo, we used data from Reunion Island as a reference for the analysis of both sites. The cloud height over Réunion island is frequently observed at 2 km above surface level (Durand et al., 2021), and the 3×3 pixel window used by the MSG satellite covers a radius of approximately 4.5 km, this value is quite similar to the one obtained from ground-based observations.
We have compared the outputs of the Elifan and Reuniwatt algorithms with MSG data (refer to Table 4). The data used to calculate bias corresponded to satellite overpasses with a 15 min interval between September 2019 and December 2021. We have selected a time range between 08:30 and 16:30 (LT) to avoid the camera's limitations during sunset and sunrise. Despite differences in the dimensions of the camera and satellite images, we found good consistency between the data. Elifan exhibited the lowest bias (Bias =2.64 %), RMSE =21.43 %, and high correlation (r=0.87), Reuniwatt showed slight differences (Bias =6.79 %, RMSE =25.70 %, and r=0.82) for the Saint-Denis site and (Bias =6.48 %, RMSE =28.63 %, and r=0.78) for Antananarivo. Statistical values for Saint-Denis generally outperform those for Antananarivo in terms of consistency between MSG and Reuniwatt. This disparity is attributed to differences in environmental and atmospheric properties at each site. Satellites may struggle to identify low cloud cover, occasionally due to the presence of haze at the study site. Cloud fraction bias is primarily influenced by image resolution and cloud distribution (Jones et al., 2012), varying between sites and being linked to atmospheric characteristics. Pollution levels differ at each station, particularly in aerosol concentration, which can attenuate solar radiation intensity (Radivojevi et al., 2015). Aerosol levels are higher over Antananarivo compared to Saint-Denis (Lamy et al., 2021a), potentially inducing slight biases between the two sites.
3.2 Seasonal cloud variability
Figures 7 and 8 have been divided into two seasons: the top represents the wet period, and the bottom represents the dry season. Figure 7 illustrates the seasonal variability of cloudiness at the Antananarivo site as obtained from the camera using the Reuniwatt algorithm and from the MSG/SEVIRI satellite.
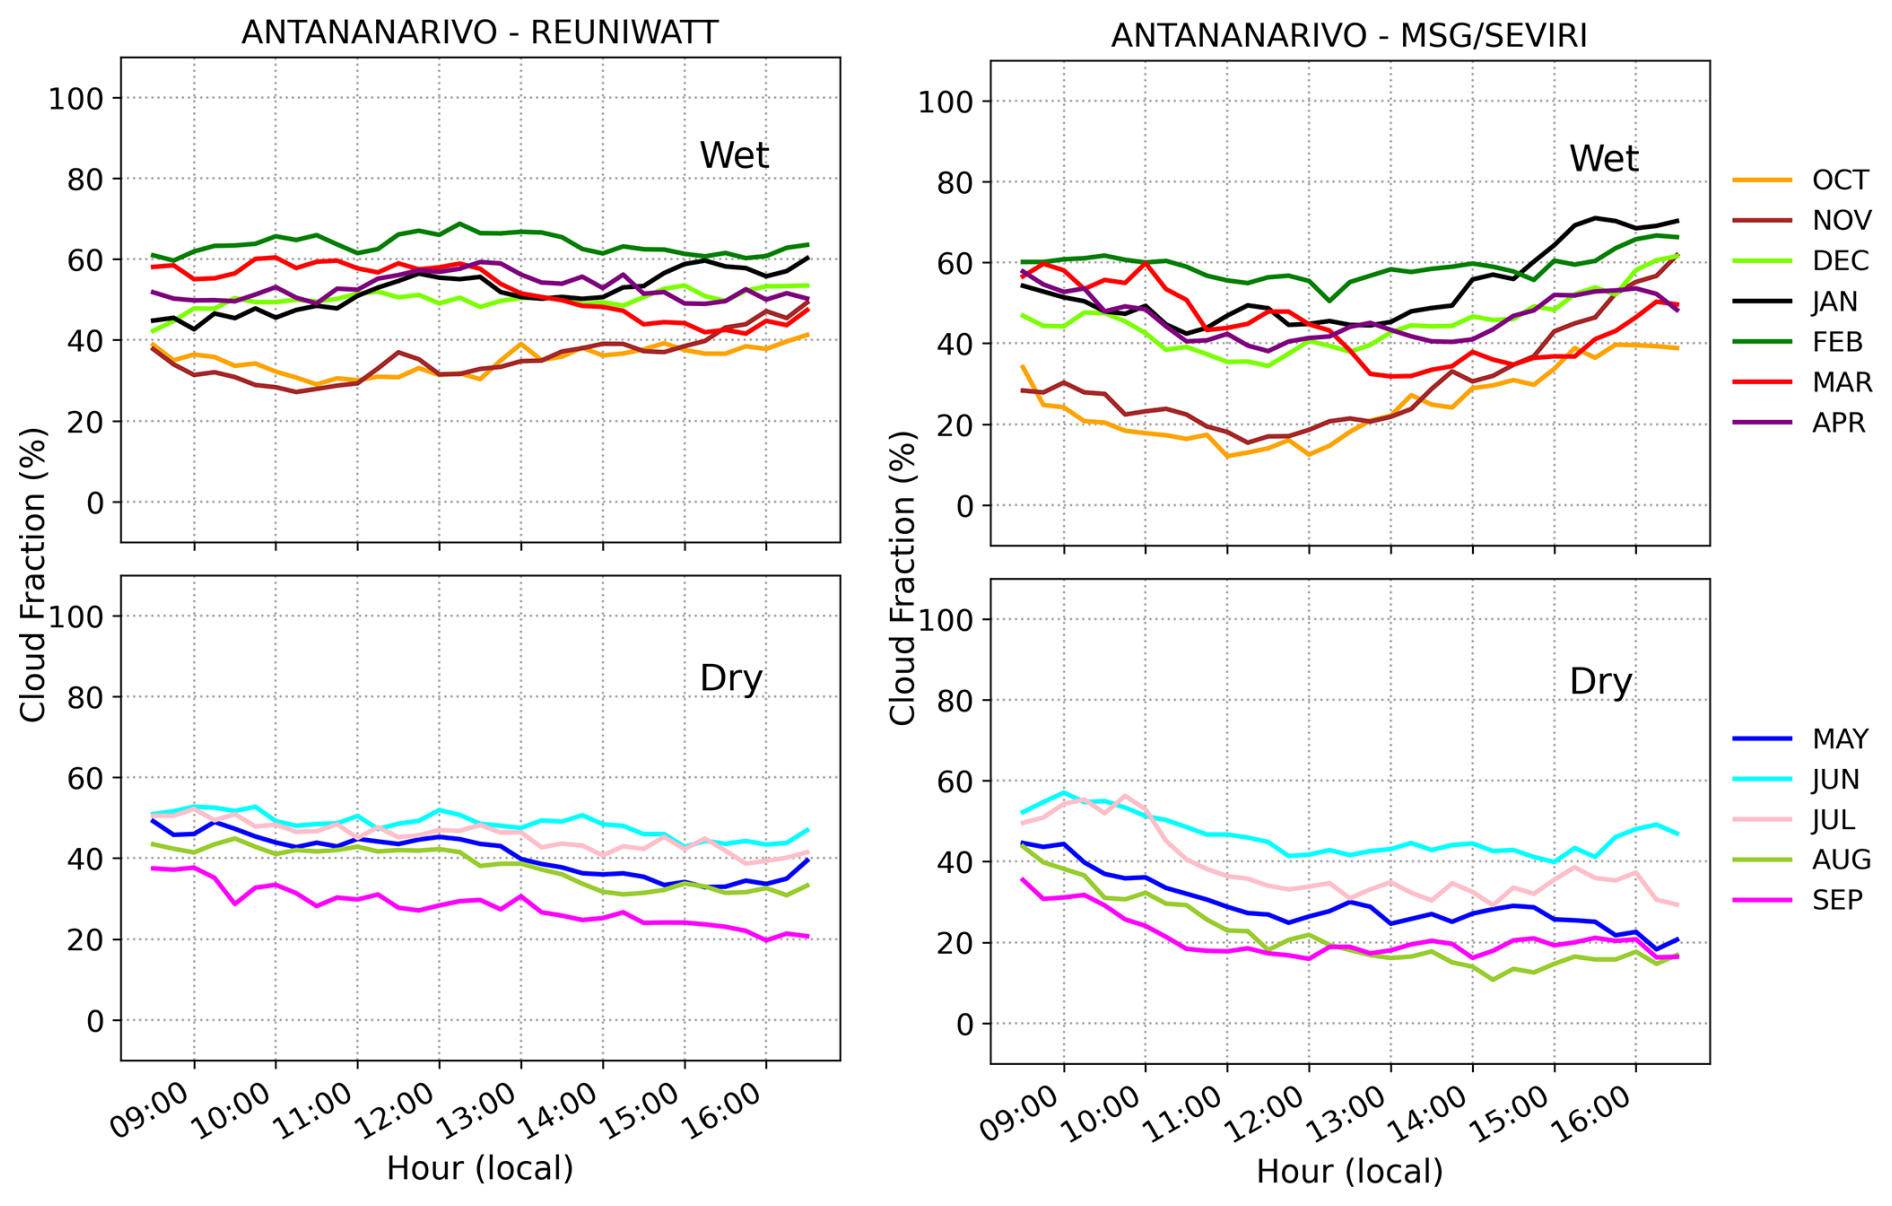
Figure 7Seasonal variability of nebulosity over Antananarivo, Madagascar, obtained from Reuniwatt on the left and MSG/SEVIRI on the right side (September 2019–June 2022). Hour in abscissa represents local time (UTC+3).
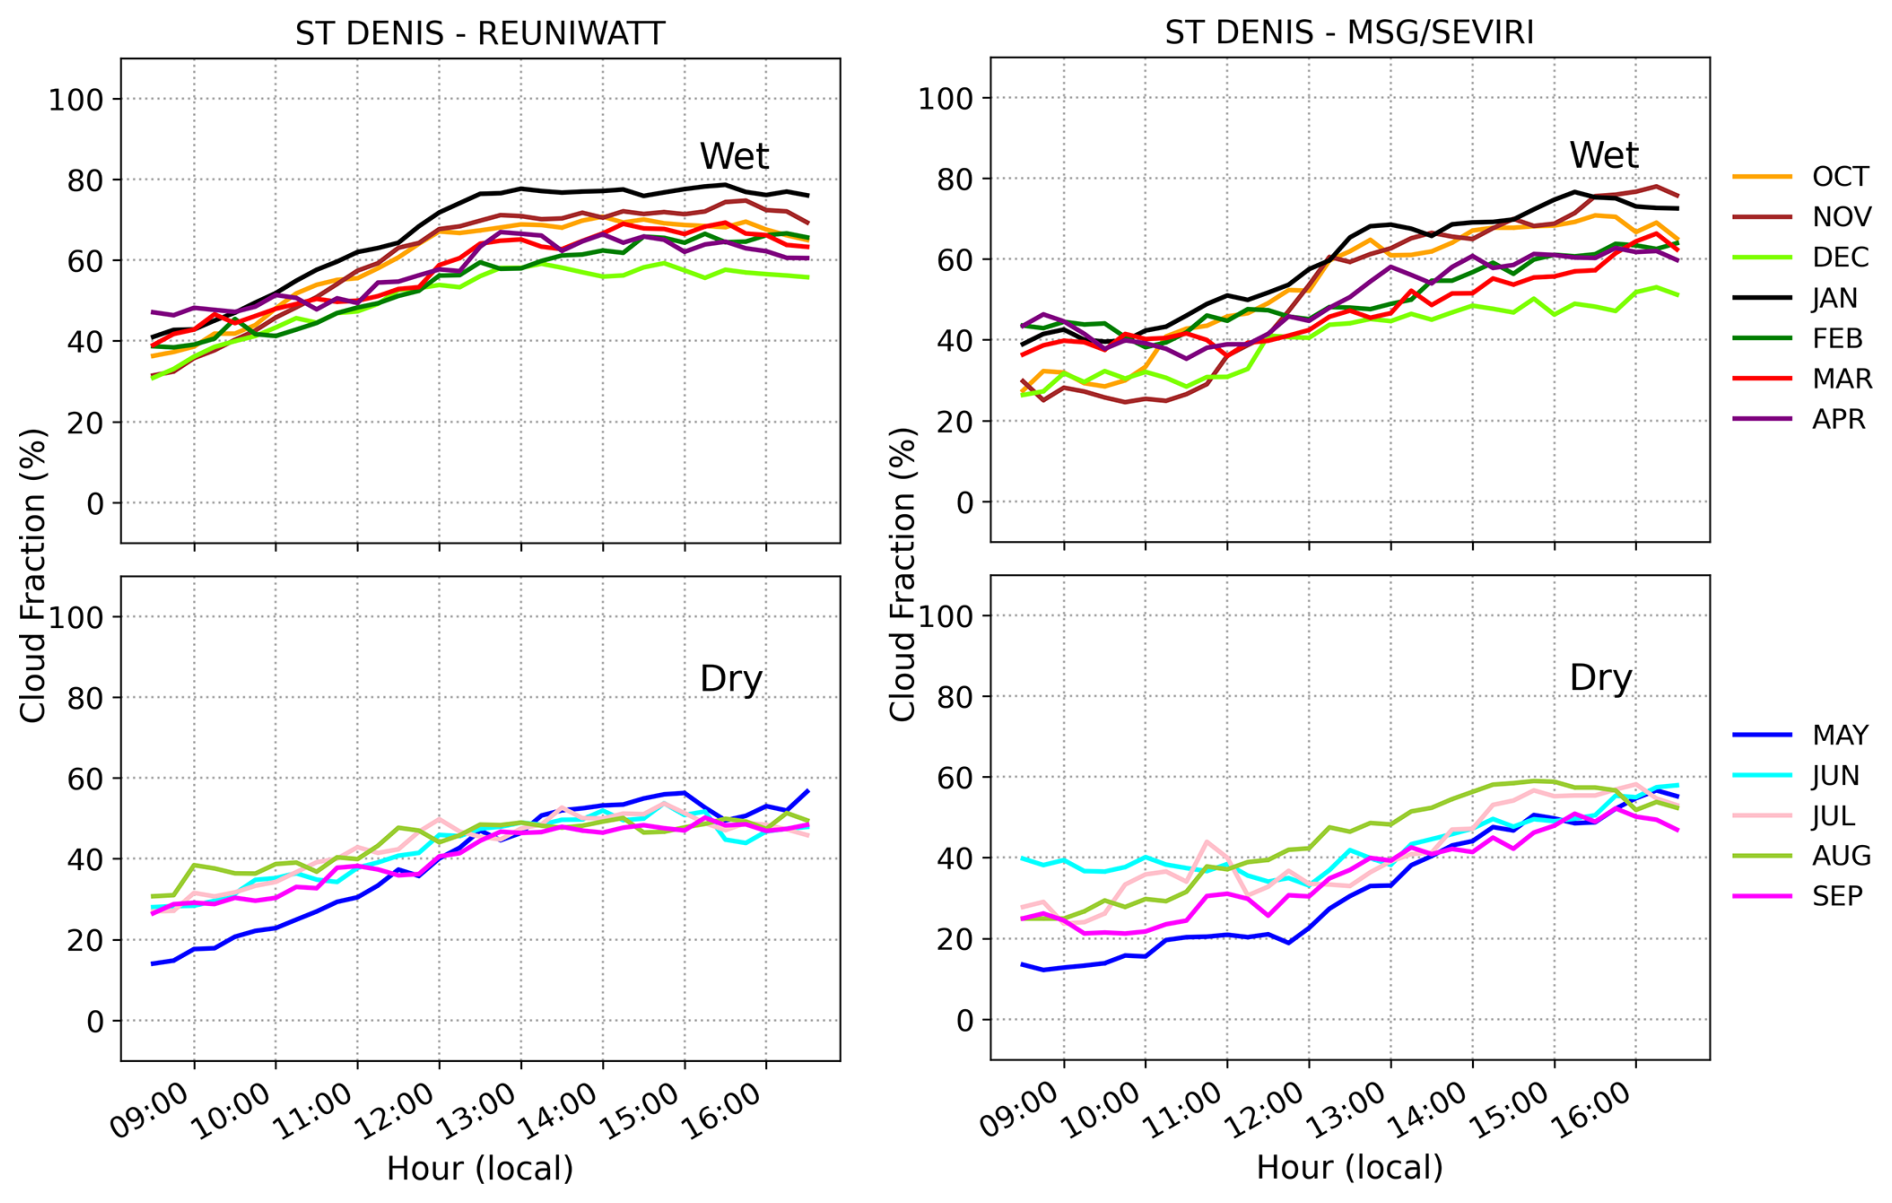
At the Antananarivo station, during the dry season, we generally observe heavy cloud fraction in the morning, around 50 %, which gradually decreases throughout the day. Conversely, during the wet season, cloud fraction ranges from around 30 % to 60 % in the morning, increasing as the day progresses. These trends are consistent across both camera and satellite observations. In the wet season, the lowest coverage is typically observed in October and November, reaching a minimum close to 20 %, while the maximum value exceeds 60 % in February. There is a slight deviation from December to April. For the Saint-Denis site (Fig. 8), we observe similar variability between camera and satellite data: the sky exhibits low coverage or is almost clear in the morning, with cloudiness gradually increasing during the day. In the wet season, maximum cloud fraction can reach 80 %, compared to only 60 % during the dry season. The lowest coverage is typically observed in May, below 20 %, while the maximum occurs in January. Cloud fraction generally tends to be weaker in the dry season compared to the wet season at both sites. Despite differences in resolution, spatial dimension, and field of view between camera and satellite measurements, we find good consistency between both datasets. The selected sites exhibit significant differences in geographical and environmental properties. The Antananarivo station, situated at an average elevation of 1370 m, experiences wind patterns along the mountains that influence orographic cloud formation, as further detailed by Rana and Sathiyamoorthy (2018). In contrast, the Saint-Denis site, located at an elevation of 70 , experiences various sources of cloud formation, including orography influenced by the local topography of Reunion (Mialhe et al., 2020), evaporation of seawater, and evapotranspiration due to the island's high vegetation coverage.
The diverse roles that clouds play on Earth's surface underscore the importance of cloud data from the UV-Indien network. Due to the extensive sea surface coverage in some Indian Ocean sites, the spatial resolution of satellites is sometimes inadequate for data analysis, highlighting the importance of ground-based stations.
3.2.1 Cloud frequency over Antananarivo
The occurrence of clouds each month, obtained from the Cloud Type data of MSG/SEVIRI over Antananarivo, is illustrated in Fig. 9. The histograms represent the percentage of all observations, for a total of 47 960 observations between September 2019 and June 2022. Notably, more than 46 % of the observations depict a clear sky, with maximum monthly values exceeding 50 % observed from May to October. Clear skies are associated with significant solar irradiance. Low clouds, typically thick and dark, significantly reduce ground-level solar radiation, accounting for approximately 21 % of observations. High semi-transparent clouds, constituting around 16 % of observations, and fractional clouds, representing more than 10 %, can intensify solar irradiance. High opaque clouds and middle-level clouds are less frequent, each representing only 3 % of observations.
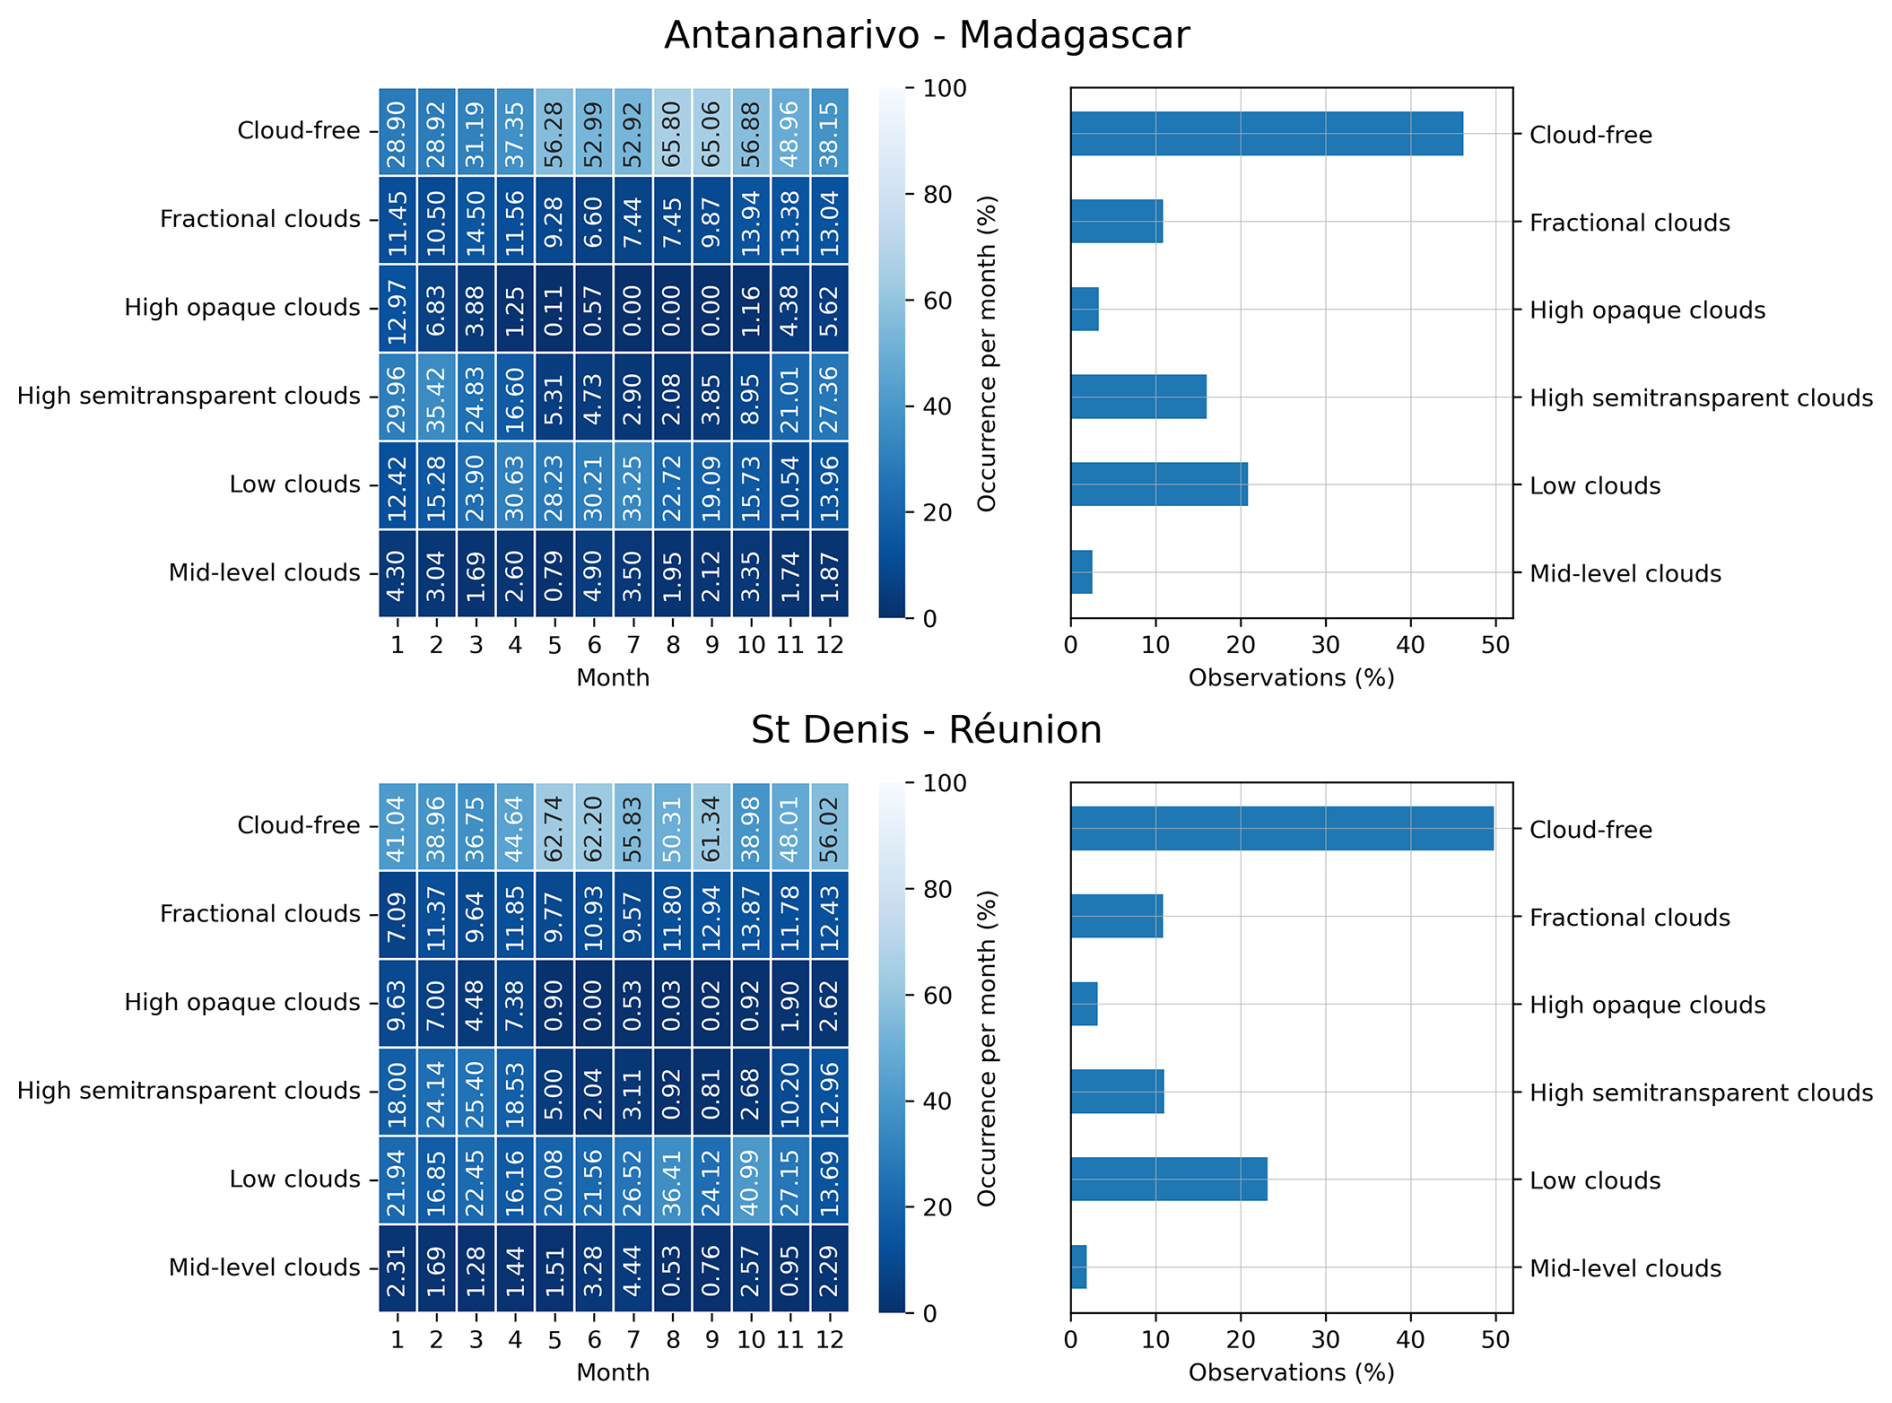
Figure 9Monthly observation of sky from September 2019 to June 2022 over Antananarivo and Saint-Denis obtained from Cloud Type of MSG/SEVIRI.
The diurnal distribution of sky covers from September 2019 to June 2022 is depicted in Fig. 10, where all types of clouds are observed. Clear skies, one of the most dominant classes, are prevalent throughout the day. High semi-transparent clouds are more frequent, while low clouds, typically thick, are predominant in the morning and less frequent in the afternoon. High semi-transparent clouds are consistently observed throughout the day, with a frequency of approximately 25 %. High opaque clouds are primarily observed towards the beginning of the afternoon. The variation in cloud type during the seasons is strongly influenced by geometric parameters such as Earth-sun distance and solar zenith angle. Clear skies are more frequent during the austral winter compared to summer, and high opaque clouds are absent during austral winter. Middle-level clouds are less frequent throughout the year. Additionally, the presence of Mandroseza lake near the station can contribute to the cloud type in this site.
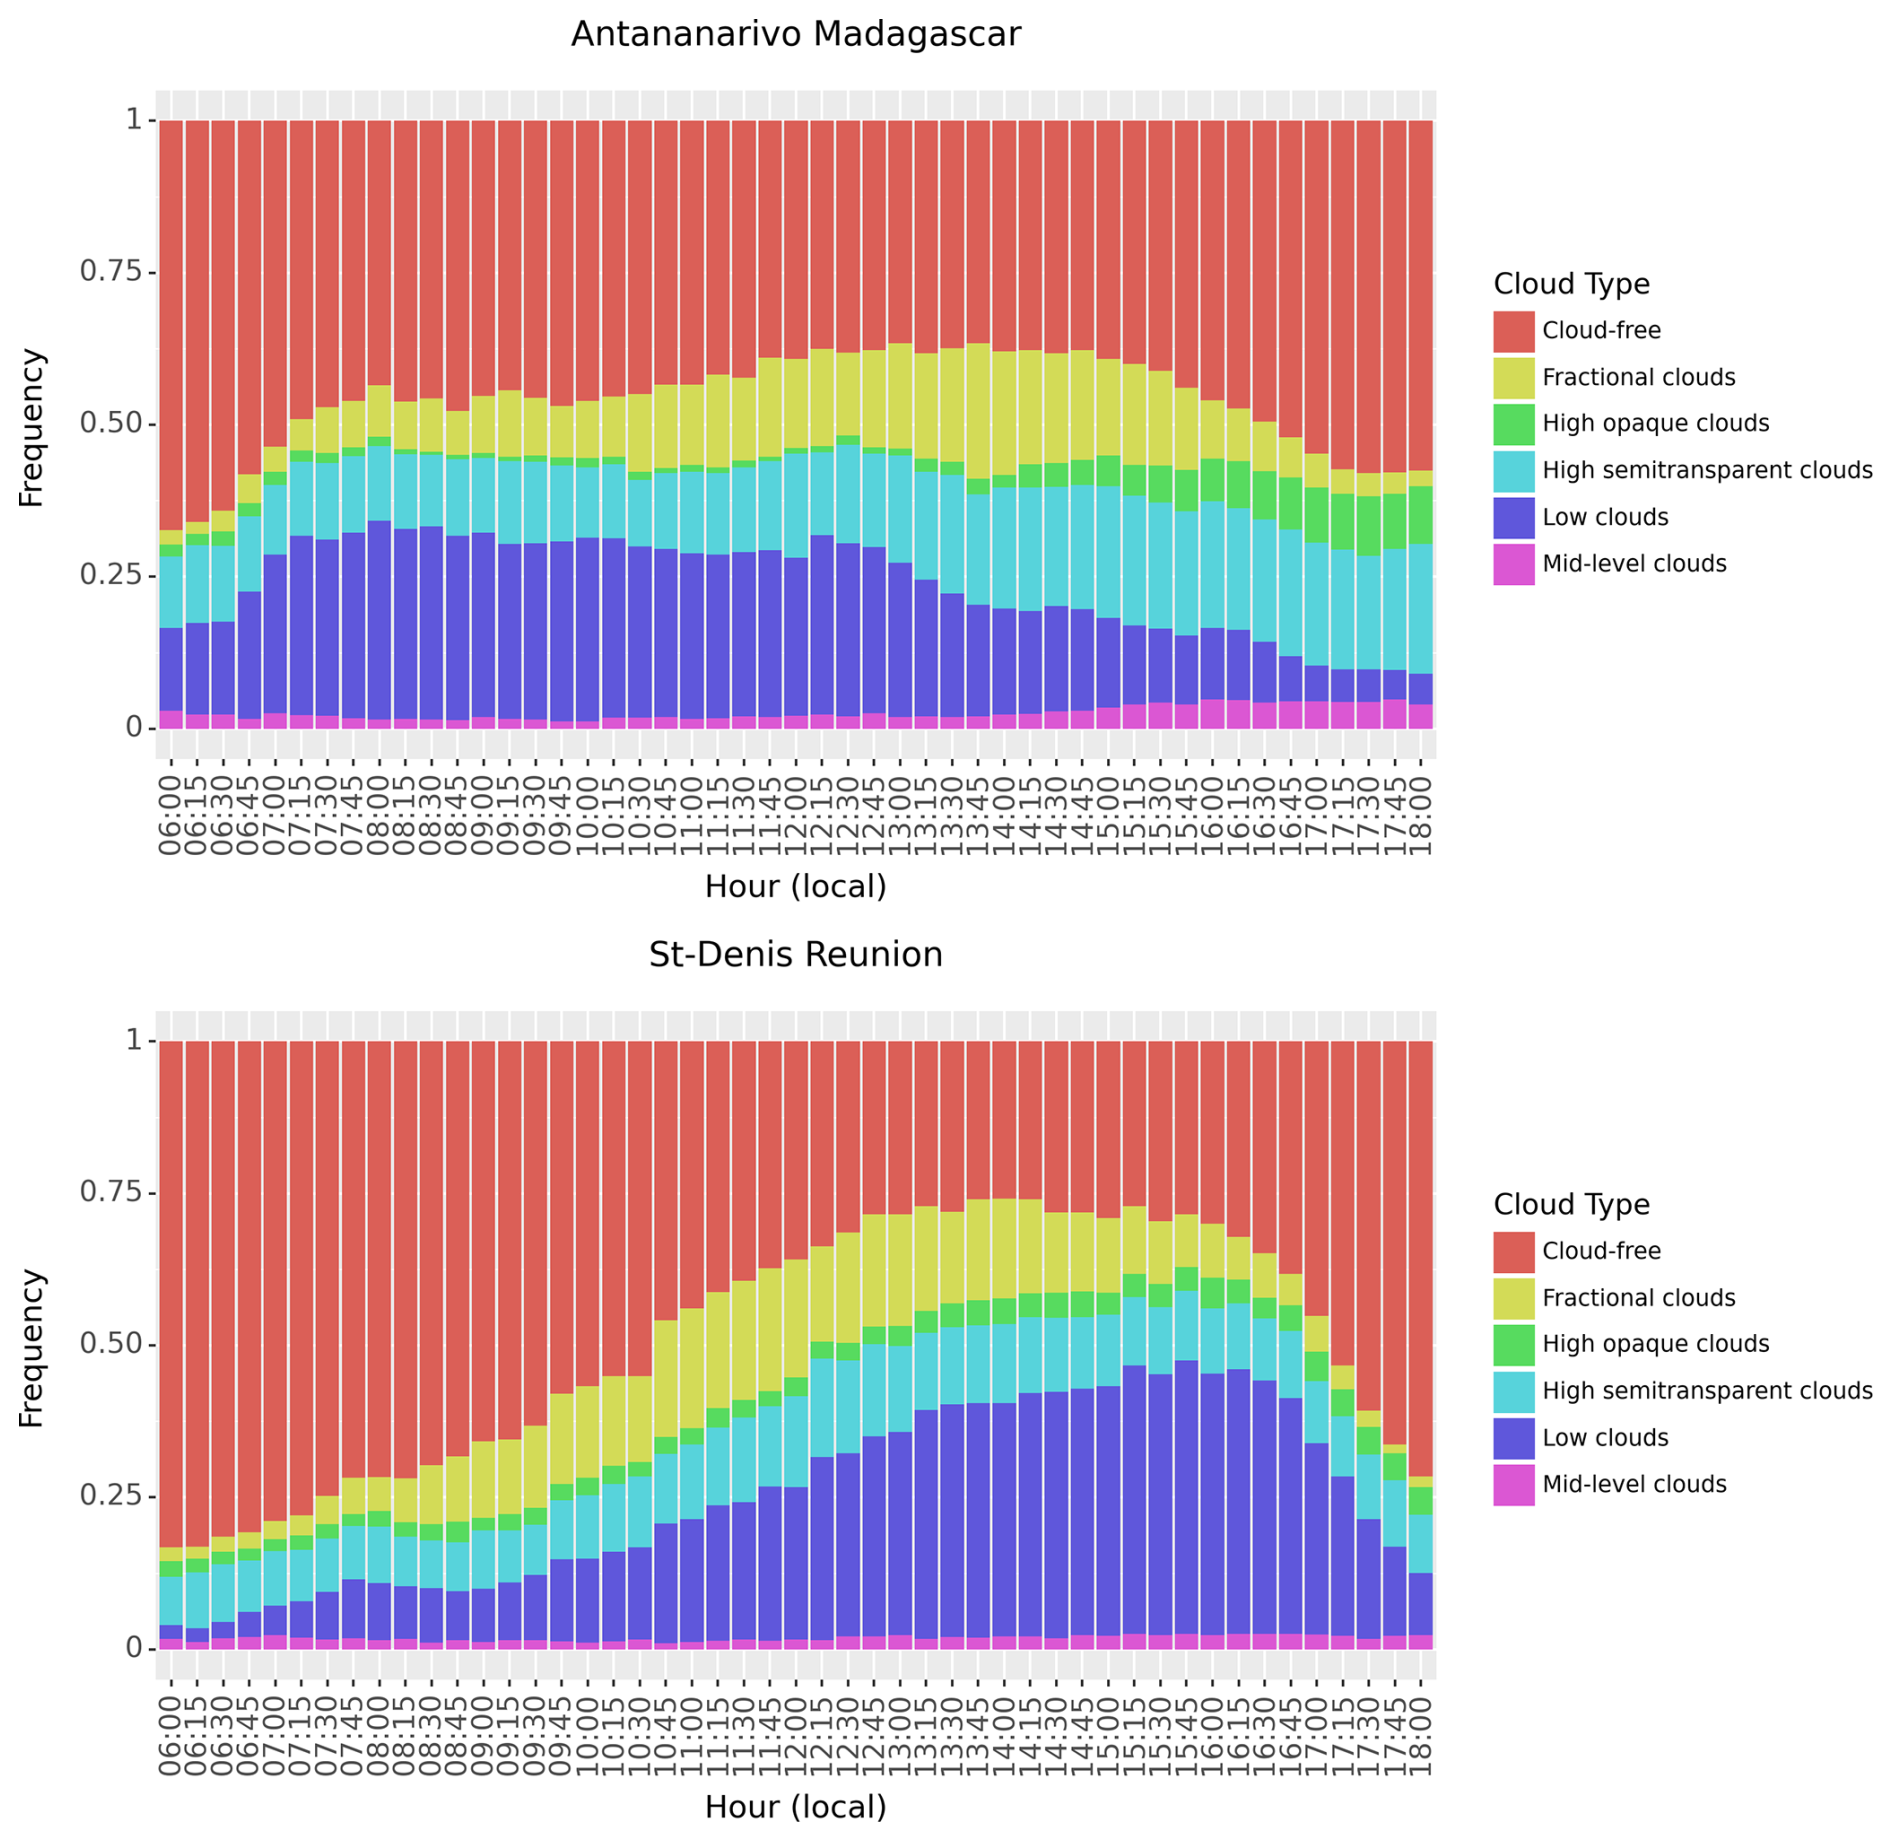
Figure 10Diurnal distribution of cloudiness over Antananarivo, Madagascar, and Saint-Denis Reunion (September 2019–June 2022).
3.2.2 Cloud frequency over Saint-Denis
We have conducted an analysis of the monthly occurrence of different cloud classes over Saint-Denis (Fig. 9). Similar to Antananarivo, we observe a strong occurrence of clear skies, representing 50 % of observations. The peaks in clear sky occurrence are evident from May to December, except in October and November, characterized by the strong presence of low clouds. Low clouds are dominant in Saint-Denis, with a frequency of approximately 23 % throughout most of the year. High semi-transparent clouds are generally significant (>10 %) during the wet season from November to April, while fractional clouds are consistently observed each month at around 11 %. High opaque clouds are less visible except during January, February, March, and April, with occurrence frequencies exceeding 4 %. Mid-level clouds are less present, with an average frequency of around 2 % each month. The diurnal distribution of cloud types is consistent with cloud fraction observations, particularly low clouds and fractional clouds, which show low occurrence in the morning and increase during the day.
Research on cloud variability in the SWIO is currently insufficient. The high spatial and temporal resolution of the data used in this study enhances our understanding of cloud characteristics and variability across the region. Deviations in each measurement were estimated using statistical analysis. Although the methodologies employed by the Elifan and Reuniwatt algorithms differ, they both reliably estimate cloud fraction (Bias %, RMSE =6.48 %, and r=0.99). Between satellite and camera measurements, significant biases sometimes arise due to the differing spatial dimensions of the measurements. Discrepancies often occur when clouds outside the camera's field of view are captured by the satellite. Satellite estimates tend to overestimate when very high clouds like cirrus are present. Conversely, cameras may overestimate cloudiness when fog is present around the site, making the area more cloud-covered compared with satellite images. Additionally, satellites sometimes fail to identify low-level cloud cover that appears dominant in ground observations (Verma et al., 2018). This study shows us the consistency and inter-complementarity of camera and satellite data. Camera and satellite statistics comparison on Saint-Denis (Bias =6.79 %, RMSE =25.70 %, and r=0.82) is generally good compared with Antananarivo (Bias =6.48 %, RMSE =28.63 %, and r=0.78). The accuracy of comparisons can be further improved by using data from the MTG-I1 satellite, which offers better spatial and temporal resolution compared to MSG. Cameras provide more consistent data with visual observations due to their good spatial resolution and high temporal frequency, although ground measurements have limitations; they are local and representative only within a spatial scale of about 5 km. Beyond this, correlations between two ground stations are inconsistent (Kalecinski, 2015). Both ground-based and satellite measurements are complementary; however, the choice depends on the specific area and focus of the study. In specific cases using satellites offers a good perspective, especially for areas that do not have camera installation as in the case of some sites of UV-Indien network. The data collected by both cameras and satellites can be applied in various fields, such as estimating solar power plant production (Rodríguez-Benítez et al., 2021). This study's datasets will also enhance our understanding of clouds effects on UV radiation, particularly for the UV-Indien network. Different cloud types impact solar irradiance differently, underscoring the necessity of cloud classification (Akdemir et al., 2022). Additional global horizontal irradiance (GHI) and diffuse horizontal irradiance (DHI) data provide by IOS-net network composed by 20 stations around SWIO can be used to understand these cloud effects (Morel et al., 2021).
Incorporating other satellite data like MODIS, which offers similar spatial resolution to MSG, is a promising approach. Additional observational tools, such as ground-based cloud radar providing vertical cloud distribution or a combination of radar and lidar as used by Vérèmes et al. (2019), can offer more detailed insights into cloud variability over specific sites. Cloud classification errors can occur due to overlapping clouds at different altitudes, with some cloud types being obscured by others. Additional biases were identified when comparing Cloud Type and Cloud Mask products, revealing that fractional clouds sometimes mix with clear skies. The occurrence frequency of clouds reported here aligns with findings by Durand et al. (2021), who noted a maximum occurrence frequency of about 45 % for low clouds from 12:00 to 19:00 LT during the wet season, and a peak of 15 % for high clouds from 13:00 to 18:00 LT. The cloudiness variability presented in this study is not fully representative due to the limited depth of our archives, but it provides a useful overview of cloud variability at poorly known sites. This study spans nearly three years, and continuous analysis over a longer period could reveal more about cloud formation and variability. But even with this limited data, we can observe the distinctiveness of cloudiness at each site, Saint-Denis and Antananarivo. This is influenced not only by atmospheric circulation but also by various factors such as environmental and geographic conditions.
Most of the codes used in this study do not belong to the authors; thus, we do not have permission from the associated authors to share them (for confidentiality or commercial reasons). For further information on the code used in this work, readers should contact the corresponding author.
The datasets used in this study are available from the corresponding author upon request.
JMR prepared the manuscript. TP supervised the study. TT wrote Reuniwatt algorithm description. All authors reviewed the manuscript.
The contact author has declared that none of the authors has any competing interests.
Publisher's note: Copernicus Publications remains neutral with regard to jurisdictional claims made in the text, published maps, institutional affiliations, or any other geographical representation in this paper. While Copernicus Publications makes every effort to include appropriate place names, the final responsibility lies with the authors. Views expressed in the text are those of the authors and do not necessarily reflect the views of the publisher.
We would like to thank the UV-Indien project for installation of the network of all-sky camera in Indian Ocean. We thank Reuniwatt society for their help on technical support during camera installations. Thanks to OSU-Reunion (Observatoire des Sciences de l'Univers – La Réunion) for camera data management. We would like to thank Eumetsat team for sharing MSG cloud mask data, and colleagues at ENERGY-Lab for their help for MSG cloud type data retrieval from ICARE data center.
This study was financially supported by the MOUV.RE project, co-financed by the European Union and the Reunion region. This study was also supported by IEA CNRS project MAGNET (Study of cloud cover in Madagascar, impact on UV radiation). Finally, we thank the French Government for supporting parts of a PhD study via an Eiffel scholarship (grant no. 124131Y).
This paper was edited by Theodore Giannaros and reviewed by Ravindra Pratap Singh and one anonymous referee.
Akdemir, K. Ü., Dindar, M., Şenel, F. A., and Helhel, S.: Development of a new hybrid cloud cover detection method for all sky mapping, Astronomy and Computing, 38, 100551, https://doi.org/10.1016/j.ascom.2022.100551, 2022.
Baray, J.-L., Courcoux, Y., Keckhut, P., Portafaix, T., Tulet, P., Cammas, J.-P., Hauchecorne, A., Godin Beekmann, S., De Mazière, M., Hermans, C., Desmet, F., Sellegri, K., Colomb, A., Ramonet, M., Sciare, J., Vuillemin, C., Hoareau, C., Dionisi, D., Duflot, V., Vérèmes, H., Porteneuve, J., Gabarrot, F., Gaudo, T., Metzger, J.-M., Payen, G., Leclair de Bellevue, J., Barthe, C., Posny, F., Ricaud, P., Abchiche, A., and Delmas, R.: Maïdo observatory: a new high-altitude station facility at Reunion Island (21° S, 55° E) for long-term atmospheric remote sensing and in situ measurements, Atmos. Meas. Tech., 6, 2865–2877, https://doi.org/10.5194/amt-6-2865-2013, 2013.
Bley, S. and Deneke, H.: A threshold-based cloud mask for the high-resolution visible channel of Meteosat Second Generation SEVIRI, Atmos. Meas. Tech., 6, 2713–2723, https://doi.org/10.5194/amt-6-2713-2013, 2013.
Boudreault, L.-E., Liandrat, O., Pottier, J., Buessler, E., Cros, S., and Schmutz, N.: Fuel saving assessment from a simulated hybrid photovoltaic-diesel system using forecasts-integrated control from a sky imager, in: 4th international Hybrid Power Systems Workshop, Crete Greece, 22–23 May 2019, 1–7, 2019.
Breiman, L.: Random Forests, Machine Learning, 45, 5–32, https://doi.org/10.1023/A:1010933404324, 2001.
Cadet, J.-M., Portafaix, T., Bencherif, H., Lamy, K., Brogniez, C., Auriol, F., Metzger, J.-M., Boudreault, L.-E., and Wright, C. Y.: Inter-Comparison Campaign of Solar UVR Instruments under Clear Sky Conditions at Reunion Island (21° S, 55° E), International Journal of Environmental Research and Public Health, 17, 2867, https://doi.org/10.3390/ijerph17082867, 2020.
Derrien, M. and Le Gléau, H.: MSG/SEVIRI cloud mask and type from SAFNWC, Int. J. Remote Sens., 26, 4707–4732, https://doi.org/10.1080/01431160500166128, 2005.
Durand, J., Lees, E., Bousquet, O., Delanoë, J., and Bonnardot, F.: Cloud Radar Observations of Diurnal and Seasonal Cloudiness over Reunion Island, Atmosphere, 12, 868, https://doi.org/10.3390/atmos12070868, 2021.
Duveiller, G., Filipponi, F., Ceglar, A., Bojanowski, J., Alkama, R., and Cescatti, A.: Revealing the widespread potential of forests to increase low level cloud cover, Nat. Commun., 12, 1–15, https://doi.org/10.1038/s41467-021-24551-5, 2021.
Ekström, S., Nozière, B., Hultberg, M., Alsberg, T., Magnér, J., Nilsson, E. D., and Artaxo, P.: A possible role of ground-based microorganisms on cloud formation in the atmosphere, Biogeosciences, 7, 387–394, https://doi.org/10.5194/bg-7-387-2010, 2010.
Ghonima, M. S., Urquhart, B., Chow, C. W., Shields, J. E., Cazorla, A., and Kleissl, J.: A method for cloud detection and opacity classification based on ground based sky imagery, Atmos. Meas. Tech., 5, 2881–2892, https://doi.org/10.5194/amt-5-2881-2012, 2012.
Jones, A. L., Di Girolamo, L., and Zhao, G.: Reducing the resolution bias in cloud fraction from satellite derived clear-conservative cloud masks, J. Geophys. Res. 117, 2011JD017195, https://doi.org/10.1029/2011JD017195, 2012.
Kalecinski, N.: Processus de formation et d'étalement des nuages sur l'île de la Réunion: caractérisation à partir de données issues d'observations satellite, sol et du modèle numérique de prévision AROME; application à la prévision des énergies solaires, PhD thesis, Ecole Polytechnique, https://pastel.hal.science/tel-01215009/ (last access: 18 October 2025), 2015.
Lamy, K., Portafaix, T., Brogniez, C., Lakkala, K., Pitkänen, M. R. A., Arola, A., Forestier, J.-B., Amelie, V., Toihir, M. A., and Rakotoniaina, S.: UV-Indien network: ground-based measurements dedicated to the monitoring of UV radiation over the western Indian Ocean, Earth Syst. Sci. Data, 13, 4275–4301, https://doi.org/10.5194/essd-13-4275-2021, 2021a.
Lamy, K., Ranaivombola, M., Bencherif, H., Portafaix, T., Toihir, M. A., Lakkala, K., Arola, A., Kujanpää, J., Pitkänen, M. R. A., and Cadet, J.-M.: Monitoring Solar Radiation UV Exposure in the Comoros, Int. J. Environ. Res. Public Health, 18, 10475, https://doi.org/10.3390/ijerph181910475, 2021b.
Leroux, M. D., Bonnardot, F., Somot, S., Alias, A., Kotomangazafy, S., Ridhoine, A.-O. S., Veerabadren, P., and Amélie, V.: Developing Climate Services for Vulnerable Islands in the Southwest Indian Ocean: A Combined Statistical and Dynamical CMIP6 Downscaling Approach for Climate Change Assessment, Climate Services, 34, 100491, https://doi.org/10.1016/j.cliser.2024.100491, 2024.
Letu, H., Nagao, T. M., Nakajima, T. Y., and Matsumae, Y.: Method for validating cloud mask obtained from satellite measurements using ground-based sky camera, Appl. Opt., 53, 7523–7533, https://doi.org/10.1364/AO.53.007523, 2014.
Liandrat, O., Cros, S., Braun, A., Saint-Antonin, L., Decroix, J., and Schmutz, N.: Cloud cover forecast from a ground-based all sky infrared thermal camera, in: Remote Sensing of Clouds and the Atmosphere XXII, SPIE, 19–31, https://doi.org/10.1117/12.2278636, 2017.
Liu, H., Koren, I., Altaratz, O., and Chekroun, M. D.: Opposing trends of cloud coverage over land and ocean under global warming, Atmos. Chem. Phys., 23, 6559–6569, https://doi.org/10.5194/acp-23-6559-2023, 2023.
Liu, S., Zhang, L. B., Zhang, Z., Wang, C. H., and Xiao, B. H.: Automatic Cloud Detection for All-Sky Images Using Superpixel Segmentation, IEEE Geosci. Remote Sensing Letters, 12, 354–358, https://doi.org/10.1109/lgrs.2014.2341291, 2015.
Long, C. N., Sabburg, J. M., Calbó, J., and Pagès, D.: Retrieving Cloud Characteristics from Ground-Based Daytime Color All-Sky Images, Journal of Atmospheric and Oceanic Technology, 23, 633–652, https://doi.org/10.1175/JTECH1875.1, 2006.
Lothon, M., Barnéoud, P., Gabella, O., Lohou, F., Derrien, S., Rondi, S., Chiriaco, M., Bastin, S., Dupont, J.-C., Haeffelin, M., Badosa, J., Pascal, N., and Montoux, N.: ELIFAN, an algorithm for the estimation of cloud cover from sky imagers, Atmos. Meas. Tech., 12, 5519–5534, https://doi.org/10.5194/amt-12-5519-2019, 2019.
Mialhe, P., Pohl, B., Morel, B., Trentmann, J., Jumaux, G., Bonnardot, F., Bessafi, M., and Chabriat, J.-P.: On the determination of coherent solar climates over a tropical island with a complex topography, Solar Energy, 206, 508–521, https://doi.org/10.1016/j.solener.2020.04.049, 2020.
Morel, B., Jeanty, P., Delsaut, M., Hassambay, N., Graillet, A., and Chabriat, J.-P.: Surface measurement of total solar and ultraviolet irradiance and ancillary meteorological data at the South-West Indian Ocean Solar network (IOS-net) stations, Data in Brief, 37, https://doi.org/10.1016/j.dib.2021.107136, 2021.
Nikumbh, A., Padmakumari, B., and Sunil, S.: Cloud fraction retrieval and its variability during daytime from ground-based sky imagery over a tropical station in India, Journal of Atmospheric and Solar-Terrestrial Physics, 190, 74–83, https://doi.org/10.1016/j.jastp.2019.05.002, 2019.
Ning, A. and Kaicun, W.: A Comparison of MODIS-Derived Cloud Fraction with Surface Observations at Five SURFRAD Sites, American Meteorological Society, 1009–1019, https://doi.org/10.1175/JAMC-D-14-0206.1, 2015.
Philippon, N., De Lapparent, B., Gond, V., Sèze, G., Martiny, N., Camberlin, P., Cornu, G., Morel, B., Moron, V., and Bigot, S.: Analysis of the diurnal cycles for a better understanding of the mean annual cycle of forests greenness in Central Africa, Agricultural and Forest Meteorology, 223, 81–94, https://doi.org/10.1016/j.agrformet.2016.04.005, 2016.
Radivojevi, A. R., Pavlovi, T. M., Milosavljević, D. D., Djordjević, A. V., Pavlović, M. A., Filipović, I. M., Pantić, L. S., and Punišić, M. R.: Influence of climate and air pollution on solar energy development in Serbia, Therm. Sci., 19, 311–322, https://doi.org/10.2298/TSCI150108032R, 2015.
Rana, P. and Sathiyamoorthy, V.: Investigation of clouds and cloud radiative forcing on the windward side of the Madagascar mountain chains, The International Archives of Photogrammetry, Remote Sensing and Spatial Information Sciences, 42, 901–906, https://doi.org/10.5194/isprs-archives-XLII-5-901-2018, 2018.
Rodríguez-Benítez, F. J., López-Cuesta, M., Arbizu-Barrena, C., Fernández-León, M. M., Pamos-Ureña, M. Á., Tovar-Pescador, J., Santos-Alamillos, F. J., and Pozo-Vázquez, D.: Assessment of new solar radiation nowcasting methods based on sky-camera and satellite imagery, Applied Energy, 292, 116838, https://doi.org/10.1016/j.apenergy.2021.116838, 2021.
Roebeling, R., Baum, B., Bennartz, R., Hamann, U., Heidinger, A., Thoss, A., and Walther, A.: Evaluating and improving cloud parameter retrievals, Bulletin of the American Meteorological Society, 94, ES41–ES44, https://doi.org/10.1175/BAMS-D-12-00041.1, 2013.
Taravat, A., Proud, S., Peronaci, S., Del Frate, F., and Oppelt, N.: Multilayer perceptron neural networks model for meteosat second generation SEVIRI daytime cloud masking, Remote Sens., 7, 1529–1539, https://doi.org/10.3390/rs70201529, 2015.
Vérèmes, H., Listowski, C., Delanoë, J., Barthe, C., Tulet, P., Bonnardot, F., and Roy, D.: Spatial and seasonal variability of clouds over the southwest Indian Ocean based on the DARDAR mask product, Quarterly Journal of the Royal Meteorological Society, 145, 3561–3576, https://doi.org/10.1002/qj.3640, 2019.
Verma, S., Rao, P. V. N., Shaeb, H. B. K., Seshasai, M. V. R., and PadmaKumari, B.: Cloud fraction retrieval using data from Indian geostationary satellites and validation, International Journal of Remote Sensing, 39, 7965–7977, https://doi.org/10.1080/01431161.2018.1479792, 2018.
Werkmeister, A., Lockhoff, M., Schrempf, M., Tohsing, K., Liley, B., and Seckmeyer, G.: Comparing satellite- to ground-based automated and manual cloud coverage observations – a case study, Atmos. Meas. Tech., 8, 2001–2015, https://doi.org/10.5194/amt-8-2001-2015, 2015.