the Creative Commons Attribution 4.0 License.
the Creative Commons Attribution 4.0 License.
 | 16 Jul 2025
TIMED Doppler Interferometer measurements of neutral winds at the mesosphere and lower thermosphere and comparison to meteor radar winds
Arthur Gauthier
Claudia Borries
Alexander Kozlovsky
Diego Janches
Peter Brown
Denis Vida
Christoph Jacobi
Damian Murphy
Masaki Tsutsumi
Njål Gulbrandsen
Satonori Nozawa
Mark Lester
Johan Kero
Nicholas Mitchell
Tracy Moffat-Griffin
The mesosphere and lower thermosphere (MLT) comprise a highly variable region that forms the transition region between the middle and upper atmosphere. The variability of this region is driven by atmospheric waves transporting energy and momentum from the lower and middle atmosphere to MLT altitudes. These waves cover a wide range of temporal (minutes to days) and spatial (kilometers to planetary) scales. The upward propagation of atmospheric gravity waves and tides is one of the key processes at all latitudes that alters the state of the ionosphere–thermosphere system, and their vertical propagation depends crucially on the background mean winds. The TIMED Doppler Interferometer (TIDI) on board the Thermosphere-Ionosphere-Mesosphere-Energetics and Dynamics (TIMED) satellite observes neutral winds at the MLT using airglow emissions. We establish a TIDI mean wind climatology, compare our results with existing climatologies derived from local meteor radar observations, and discuss similarities and differences depending on local time and geographical latitude.
- Article
(4695 KB) - Full-text XML
- BibTeX
- EndNote


Wind measurements with global coverage at the mesosphere and lower thermosphere (MLT) are still sparse. These winds are characterized by atmospheric waves of various spatial and temporal scales and provide a substantial source of variability at the lower boundary of the upper atmosphere. Hence, they play a crucial role in the vertical coupling between the middle and upper atmosphere affecting space weather (Liu, 2016). Atmospheric solar tides contribute substantially to this variability and have wave periods corresponding to an integer fraction of a day. Forced by the absorption of solar radiation due to water vapor in the troposphere or ozone in the stratosphere or by molecular or atomic absorption at thermospheric heights (Lindzen and Chapman, 1969; Lindzen, 1979), atmospheric tides gain large amplitudes in the MLT, depositing some energy and momentum into the mean flow (Becker, 2017). Zonal-mean MLT winds reflect a characteristic climatology for both horizontal components.
Zonal winds show a hemispheric summer wind reversal from westward to eastward wind around 90 km altitude and moderate/weak eastward winds during the hemispheric winter season. The meridional wind exhibits a southward prevailing wind during the northern hemispheric summer and a corresponding opposite behavior in the Southern Hemisphere. These wind systems are closely related to the residual circulation and associated gravity wave drag (Lindzen, 1981; Smith, 2012; Becker, 2012).
Wind measurements providing global coverage including both polar regions independent of the yaw-cycle maneuvers are performed by the Thermosphere-Ionosphere-Mesosphere-Energetics and Dynamics (TIMED) spacecraft. Due to the spacecraft orbit, the TIMED Doppler Interferometer (TIDI) observes all local times for each location between the yaw cycles every 60 d. Thus, TIDI vector winds are affected by migrating and non-migrating tides (Wu et al., 2006; Oberheide et al., 2005; Dhadly et al., 2024; Paulino et al., 2025), as well as planetary wave oscillations. Migrating tides are atmospheric oscillations that move westward with the Sun's apparent daily motion, driven by solar heating. Non-migrating tides are atmospheric oscillations that do not follow the Sun's motion, moving in other directions or remaining stationary, influenced by various factors beyond solar heating. This poses additional challenges in determining mean winds, which are already considered less reliable due to larger uncertainties in the zero calibration of the instrument (Niciejewski et al., 2006).
The goal of this study is to establish a TIDI mean wind climatology with processed TIDI wind data and compare it with climatologies derived from local meteor radar observations. This study compares TIDI winds to ground-based meteor radar observations covering northern and southern polar and mid-latitudes between 2003 and 2020. Based on these comparisons, we develop additional statistical quality control filters, which are generalized, to obtain globally harmonized TIDI winds for composite days. These composite days are compiled from 60 d averages for all longitude and latitude bins to mitigate potential offsets due to varying measurement statistics between night and day and issues related to the zero-line calibration due to night–day transition orbits. Further validation of TIDI winds and comparison with other systems is necessary. Meteor radar winds have proven to provide a reliable benchmark for cross-comparisons with general circulation models (GCMs) (Pokhotelov et al., 2018; Stober et al., 2021b). Furthermore, meteor radar (MR) winds were used for the validation of meteorological analysis such as the Navy Global Environment Model – High Altitude (NAVGEM-HA) (McCormack et al., 2017; Stober et al., 2020; Liu et al., 2022; van Caspel et al., 2023) or for data assimilation. MR winds are processed using the same averaging as applied to TIDI zonal and meridional winds to ensure the best possible spatial and temporal overlap and to mitigate the intrinsic differences in the sampling.
The paper is structured as follows: in Sect. 1, the analysis of TIDI winds and its comparison to meteor radar winds for different stations are presented. A seasonal comparison of zonal and meridional winds for meteor radar stations at different latitudes is introduced in Sect. 2. Figures 5 and 6 in this section highlight the correlation between TIDI and MR winds for both zonal and meridional components. In Sect. 3, the study of TIDI wind-latitude cross-sections highlights the latitude–altitude relation for zonal winds: an indication of the summer hemispheric wind reversal is shown in this section. Finally, in Fig. 8 of this section, TIDI global coverage demonstrates, on a global map, the presence of diurnal and semi-diurnal tides due to the solar heating of the atmosphere.
2.1 TIDI observations
TIDI is a Fabry–Perot interferometer developed and built by the University of Michigan and designed to investigate the dynamics of the Earth’s mesosphere, lower thermosphere and ionosphere (MLTI). Its observational mode ranges from 70 to 120 km during the daytime and from 80 to 103 km at night. TIDI observes neutral winds at different altitudes using several airglow emission lines of O2(0-0) at 765.07, 763.78 and 764.00 nm and daytime O 557.7 nm at higher altitudes (Killeen et al., 2006).
TIDI comprises four telescopes that are orthogonally oriented (two at 45° forward on either side of the satellite's velocity vector and two at 45° rearward of the satellite) so that wind vectors on both sides of the satellite track can be observed. These four views enable the construction of the vector winds as a function of altitude along two parallel tracks (cold side and warm side of the satellite). Due to the orthogonality of the two telescopes on the same side of the spacecraft, the same locations are observed with a delay of a few minutes when the satellite moves along its track (Wu and Ridley, 2023).
TIMED orbits Earth about 15 times every day. Its precession rate of 12 min per day and the combination of ascending and descending orbits determine that the TIDI sampling track covers 24 h in local time every 60 d. In addition, the orbital parameters were chosen so that TIDI reaches the initial latitude and LST coordinates after exactly one calendar year again (Niciejewski et al., 2006).
TIDI has continuously taken data since 2002 except for a data gap in early 2003. A decrease in the throughput of the instrument and an increase in cross-talk between the telescopes was observed after launch, which was determined to be caused by ice on the detector housing. Also, it was observed that TIDI had a light leak that led to uncertainties in the inverted wind data. A satellite maneuver was performed in January 2003 that enabled TIDI to reach nominal performance (Killeen et al., 2006).
There exist two different ways of retrieving the neutral winds. The National Center for Atmospheric Research pairs sampling locations from one telescope with the nearest neighbors from the other (Killeen et al., 2006), while the University of Michigan linearly interpolates the samplings of each telescope to an evenly spaced track angle grid and calculates the wind vectors at these grid points (Killeen et al., 2006). The results of both these schemes do not present a lot of differences. In this study, we use data from the University of Michigan (http://tidi.engin.umich.edu, last access: April 2024). The vertical altitude resolution of the instrument is 2.5 km. Each acquisition cycle takes between 100 and 200 s to complete, which gives an along-track resolution of around 750 km. Zonal and meridional winds are derived on both sides of the spacecraft (cold and warm side) through calculation from the line-of-sight (LOS) winds. The vector winds are available on both sides of the satellite velocity vector.
2.2 Meteor radar (MR) winds
MRs are standard instruments to measure MLT winds. Thus, our comparison includes only MRs that have a long observation record at mid- and polar latitudes. MR winds are often analyzed by fitting a least square function projecting all measured line-of-sight velocities onto mean horizontal winds (Hocking et al., 2001; Holdsworth et al., 2004). In this study, zonal and meridional winds are obtained by applying modified retrievals including non-linear error propagation (Gudadze et al., 2019; Hindley et al., 2022), a Tikhonov regularization for the vertical wind (Stober et al., 2022), and World Geodetic Coordinate System 84 (WGS84) projections to correct the line-of-sight velocities for the Earth's ellipsoidal geometry (Stober et al., 2021a).
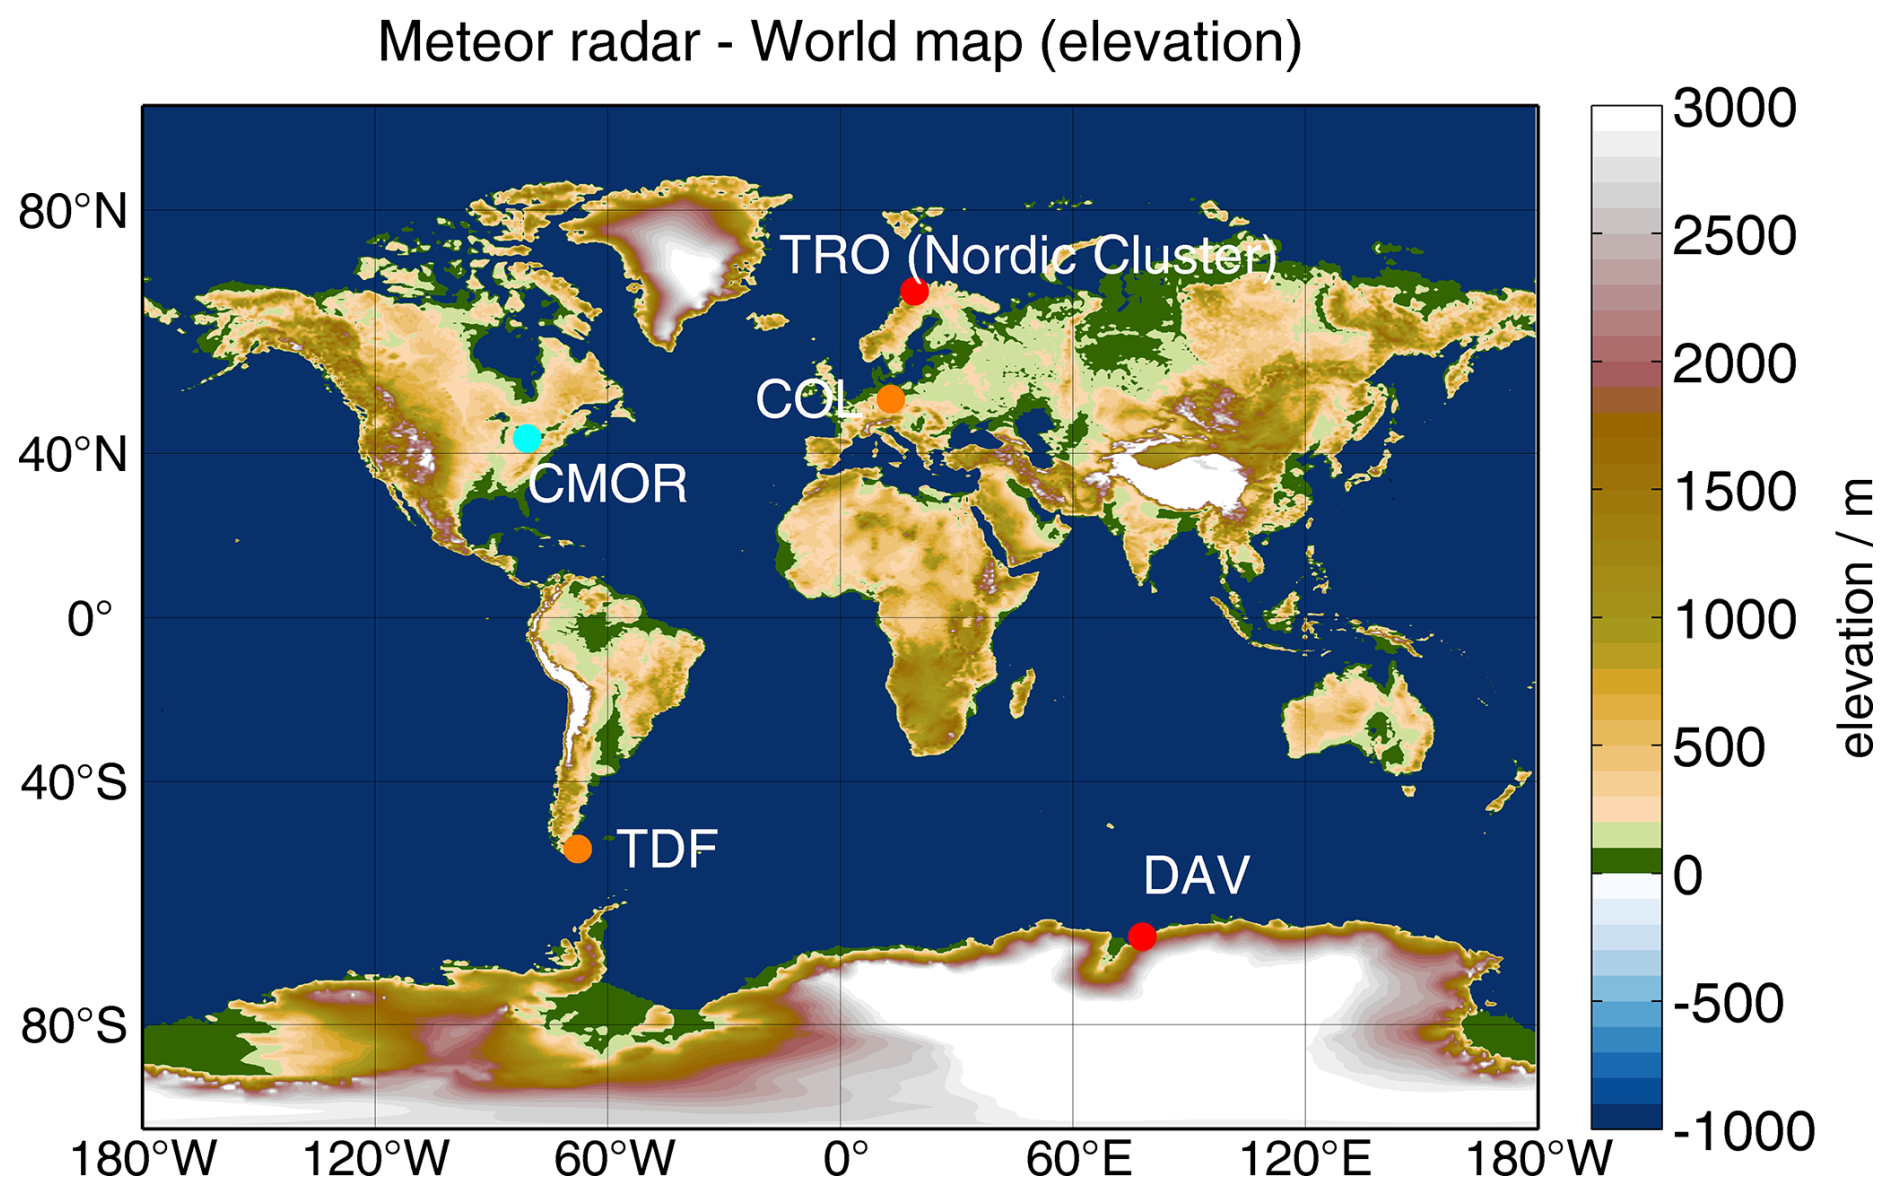
Figure 1Geographic map of the MRs included in the validation of the TIDI winds. The plot was generated from etopo2 using the m_map package (Amante and Eakins, 2009).
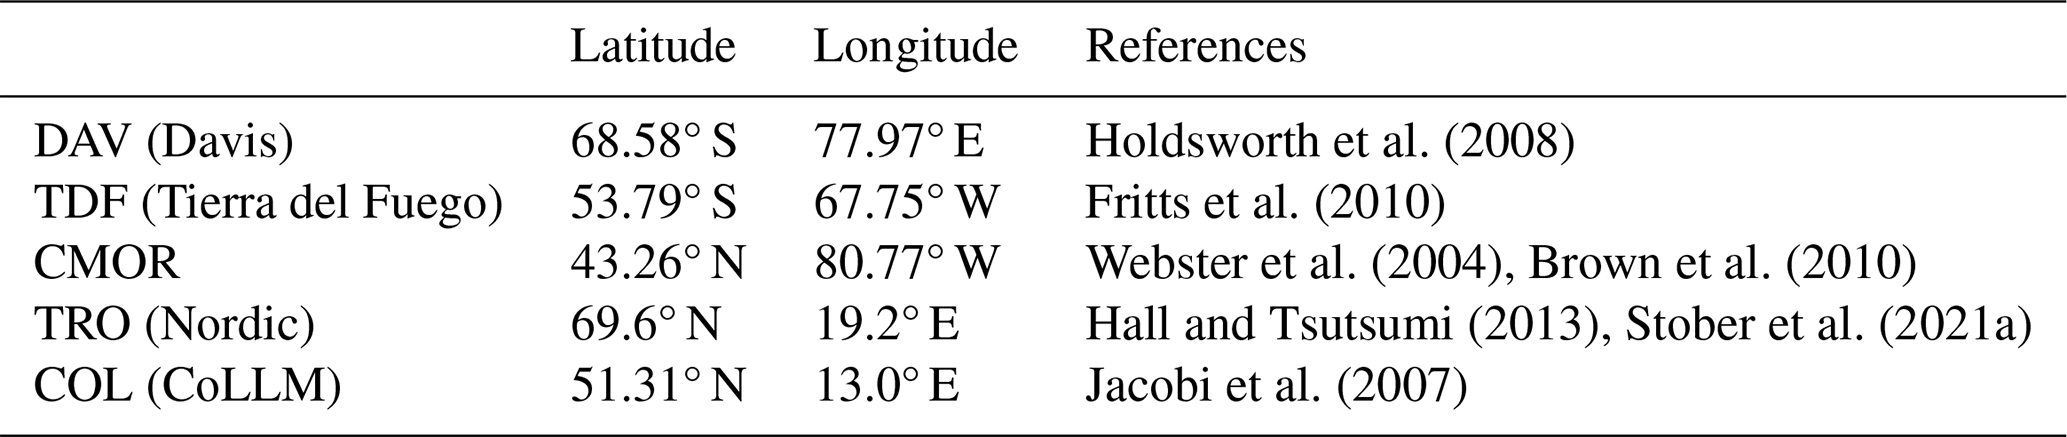
Figure 1 presents a geographic projection of all MRs that are used for the comparison to the TIDI zonal and meridional winds. For all of these stations, the MRs have been in operation for more than a decade. The Nordic Meteor Radar Cluster consists of five MRs located in Fennoscandia at Tromsø (TRO) since 2003, Alta (ALT) since 2014, Kiruna (KIR) since 1999, Sodankylä (SOD) since the end of 2008 and Svalbard (SVA). However, the mainland radars in Norway, Sweden and Finland are located in such a narrow geographic region that we treat them as one system in our analysis and refer always to TRO. We compiled a merged dataset from all four mainland systems from 2003 to 2023. At mid-latitudes, we leveraged observations from CoLLM (COL) and the Canadian Meteor Orbit Radar (CMOR). In the Southern Hemisphere, the MRs located at Tierra del Fuego (TDF) at Rio Grande Argentina and Davis (DAV) are included in the comparison. References for each system can be found in Table 1.
Holdsworth et al. (2008)Fritts et al. (2010)Webster et al. (2004)Brown et al. (2010)Hall and Tsutsumi (2013)Stober et al. (2021a)Jacobi et al. (2007)Table 1Geographic locations of MRs used for the comparison to TIDI winds.
MR winds are computed using a vertical resolution of 2 km between 70 and 120 km. The temporal resolution is 1 h. However, to match the temporal averaging of the satellite, the hourly MR winds are averaged ±30 d for every hour of the day around a center day to obtain composites with a temporal resolution of 1 h. These composites are compared to the TIDI zonal and meridional winds and used to optimize the filtering and averaging of the TIDI vector winds.
3.1 TIDI–MR wind comparison and quality control criteria
TIDI vector winds are provided over a certain geographic location and time with a vertical resolution of 2.5 km between 70 and 120 km. Firstly, we remove all zonal and meridional wind measurements that exceed 120 m s−1. In the next step, we bin the data by longitude, latitude and time. We prepare a spatial grid with 30° longitude and 10° latitude bins. Furthermore, we average all measurements that fall within each longitude and latitude bin for each hour using all orbits within ±30 d to ensure the sampling of all local times for each spatial and temporal bin. Additionally, we calculate the geophysical variance and number of accepted observations with each bin. Both quantities turn out to be useful for further quality measures in our comparison.
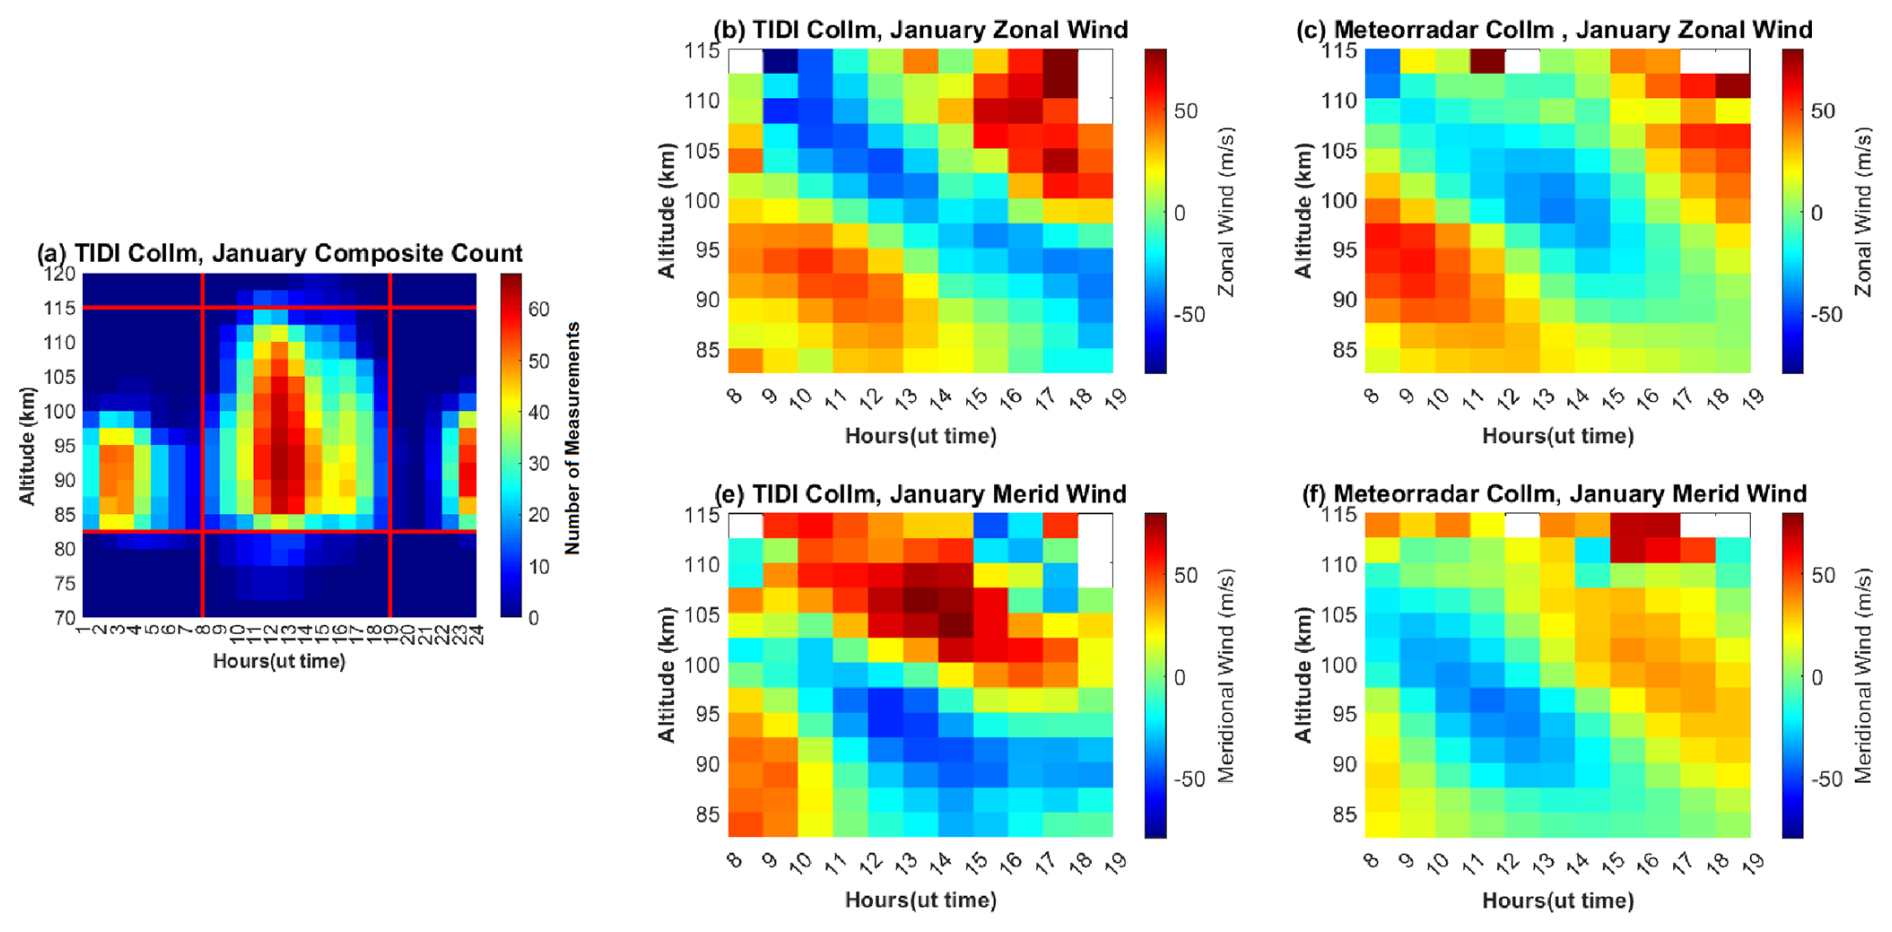
Figure 2Comparison of TIDI and MR winds. (a) Number of successful TIDI measurements of the time of the day and altitude with the longitude and latitude bin where the MR is located. (b, e) TIDI zonal and meridional daily composite winds, respectively. (c, f) Zonal and meridional daily composite MR winds for CoLLM.
For the TIDI and MR wind comparison, we use the longitude/latitude bin of the TIDI winds where the MR is located. If several MRs are within one bin, we performed only one comparison: in the case of the Nordic Meteor Radar Cluster, we chose the one at Tromsø for our comparison. We computed hourly composites for both instruments. Figure 2 shows the comparison of zonal and meridional winds for the CoLLM MR and TIDI for January. The left panel (Fig. 2a) represents the number of TIDI measurements for each altitude and time based on the 60 d composites. The horizontal and vertical red lines label the area with the highest number of measurements. The central- and right-upper panels show the resultant altitude–time zonal winds for TIDI and the MR at CoLLM. Zonal winds exhibit a prominent semidiurnal tide and show similarities between both datasets, which is typical for the winter months at the mid-latitudes (Stober et al., 2021b).
Table 2Correlations between TIDI and all meteor radars for both zonal and meridional winds in winter (January) and summer (July).
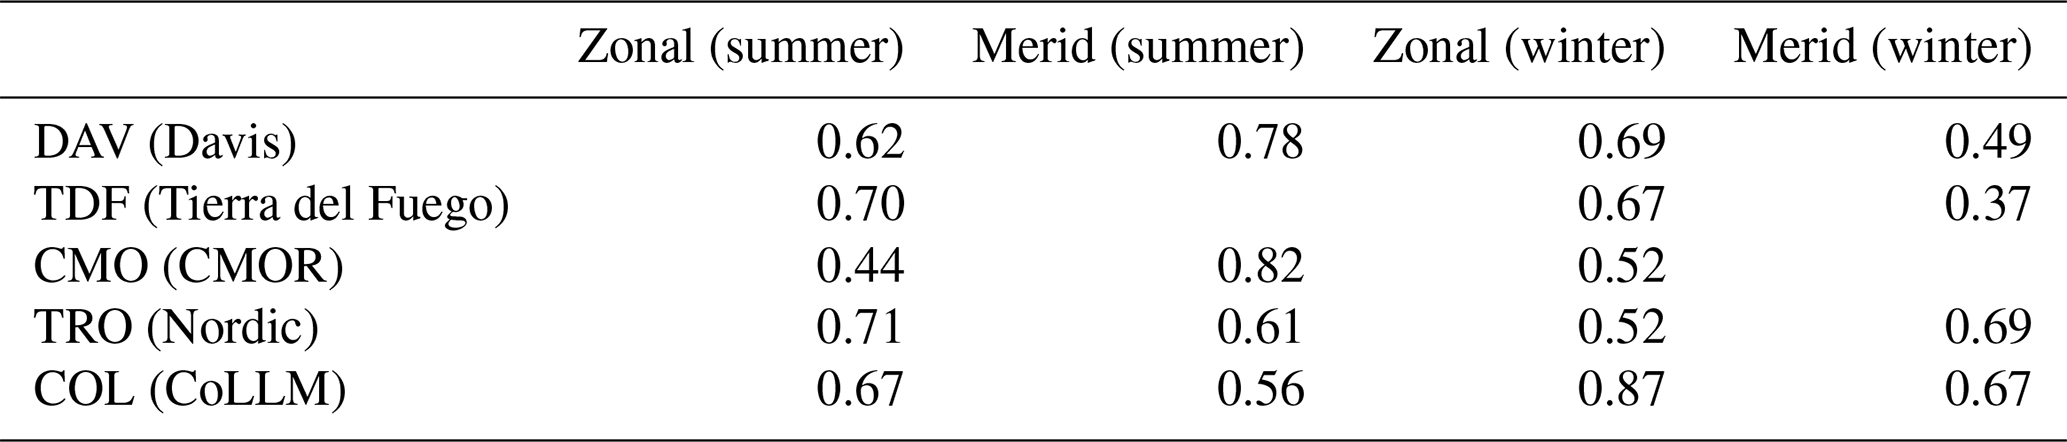
Furthermore, we set a threshold requiring the number of TIDI observations per hour and altitude to be more than 30. That is the chosen number of available wind measurements released in the database for a specific time–altitude–longitude bin. Stricter filtering, demanding even higher measurement statistics of TIDI, increases the correlation but at the cost of a decreased number of available zonal and meridional winds. Therefore, we accepted only TIDI zonal and meridional winds with measurement statistics of 30 or more TIDI observations for each time, altitude, and latitude–longitude bin. During the hemispheric winter, we found a strong correlation between TIDI and meteor radar measurements of the zonal wind (R=0.87) and a moderate correlation for the meridional wind measurements (R=0.67). Furthermore, TIDI winds appeared to be more reliable during local daytime and exhibited a decreased agreement during the night hours.
Figure 3 visualizes the same comparison for the CoLLM MR during summer for both wind components. Although the measurement statistics (number of available wind measurements) provided in the database for a specific time–altitude–longitude–latitude bin appear to be increased during some times of the day between 82 and 110 km compared to the winter months, the overall correlation for both wind components is lower. During the summer months, we find correlations of R=0.67 and R=0.56 for the zonal and meridional winds, respectively. A summary of all comparisons for all radar locations for the summer and winter months is given in Table 2. The gaps in the table indicate locations for which less than 30 observations were made.
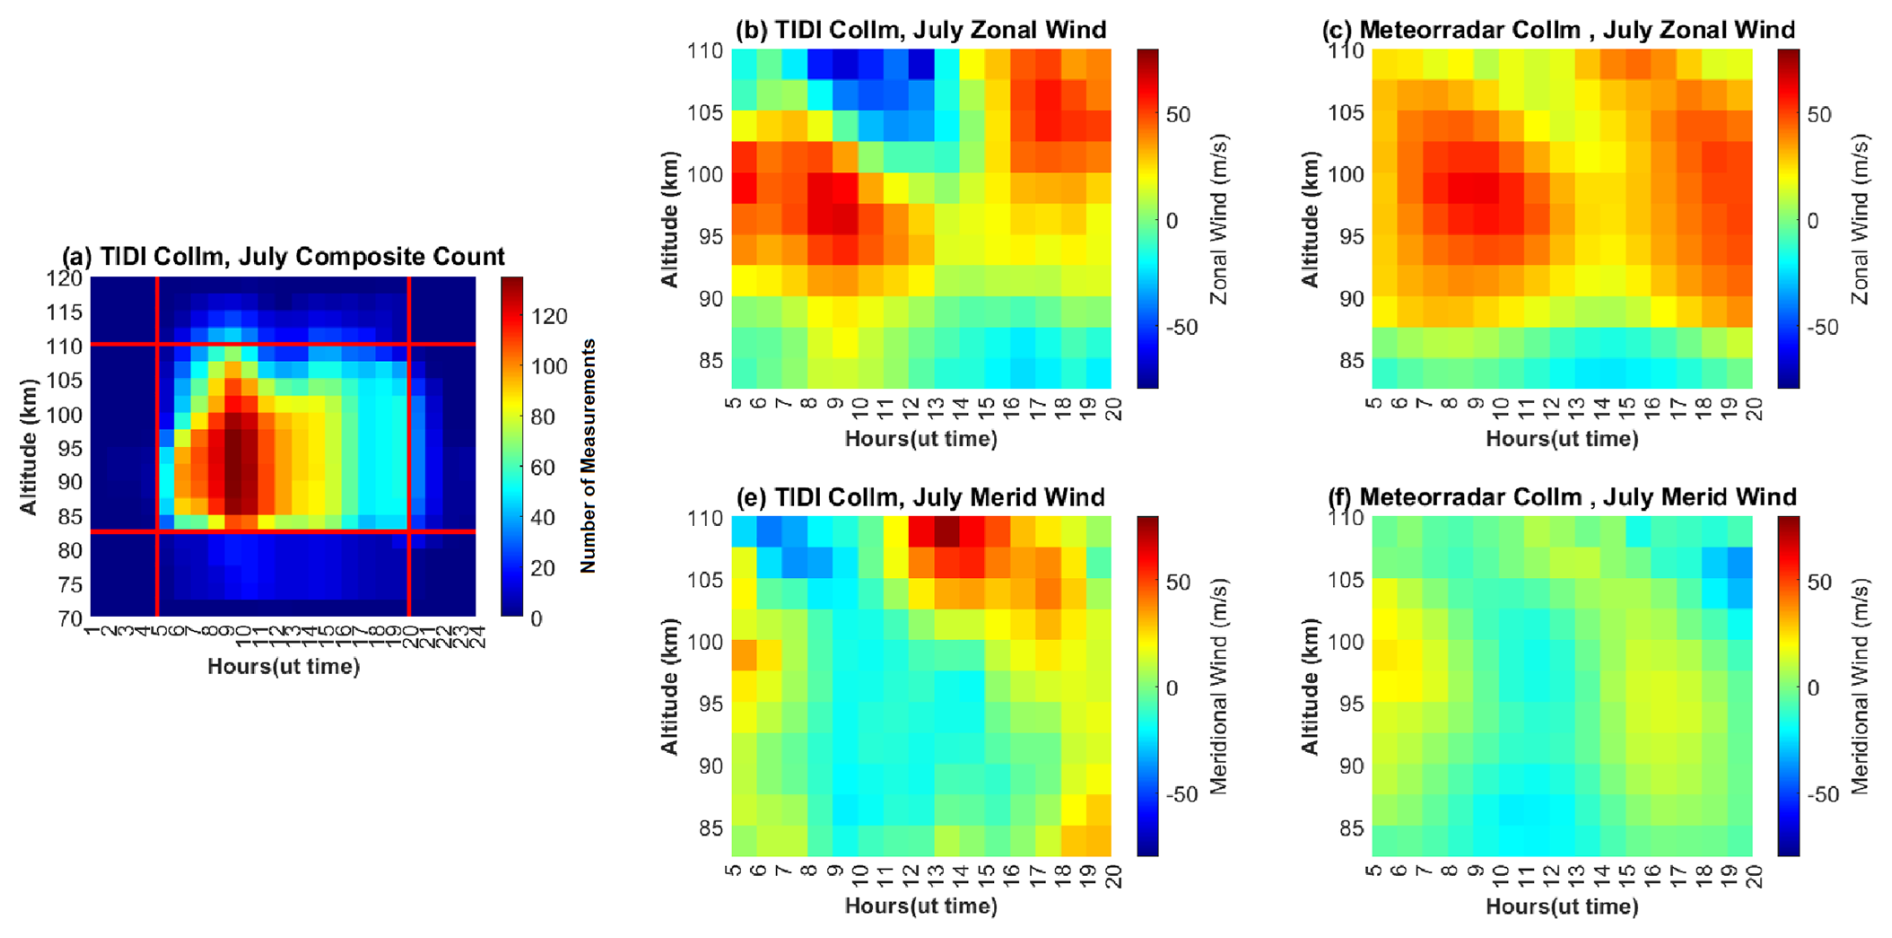
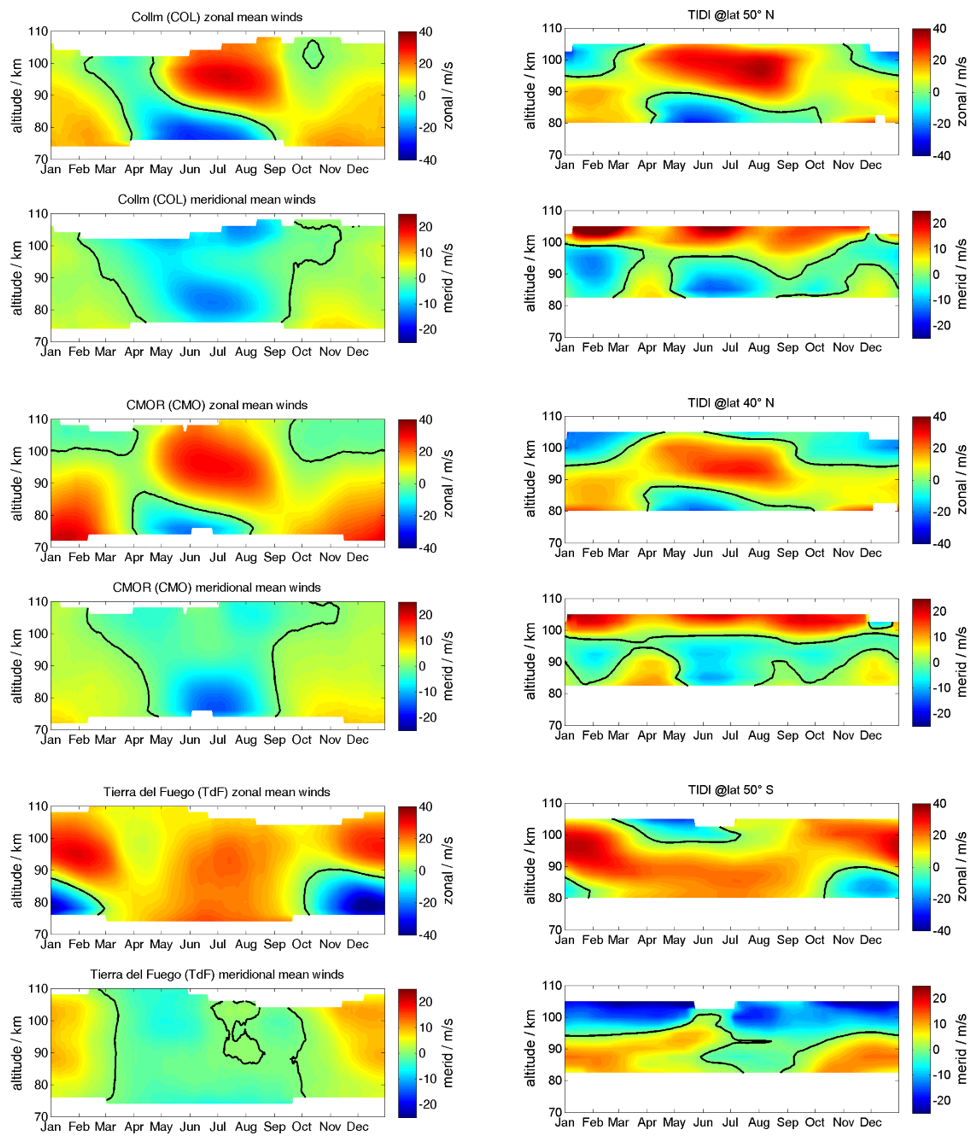
Figure 4Seasonal comparison of zonal and meridional winds for the mid-latitude stations CoLLM, CMOR and TDF and the zonal-mean zonal and meridional TIDI winds for the corresponding latitude.
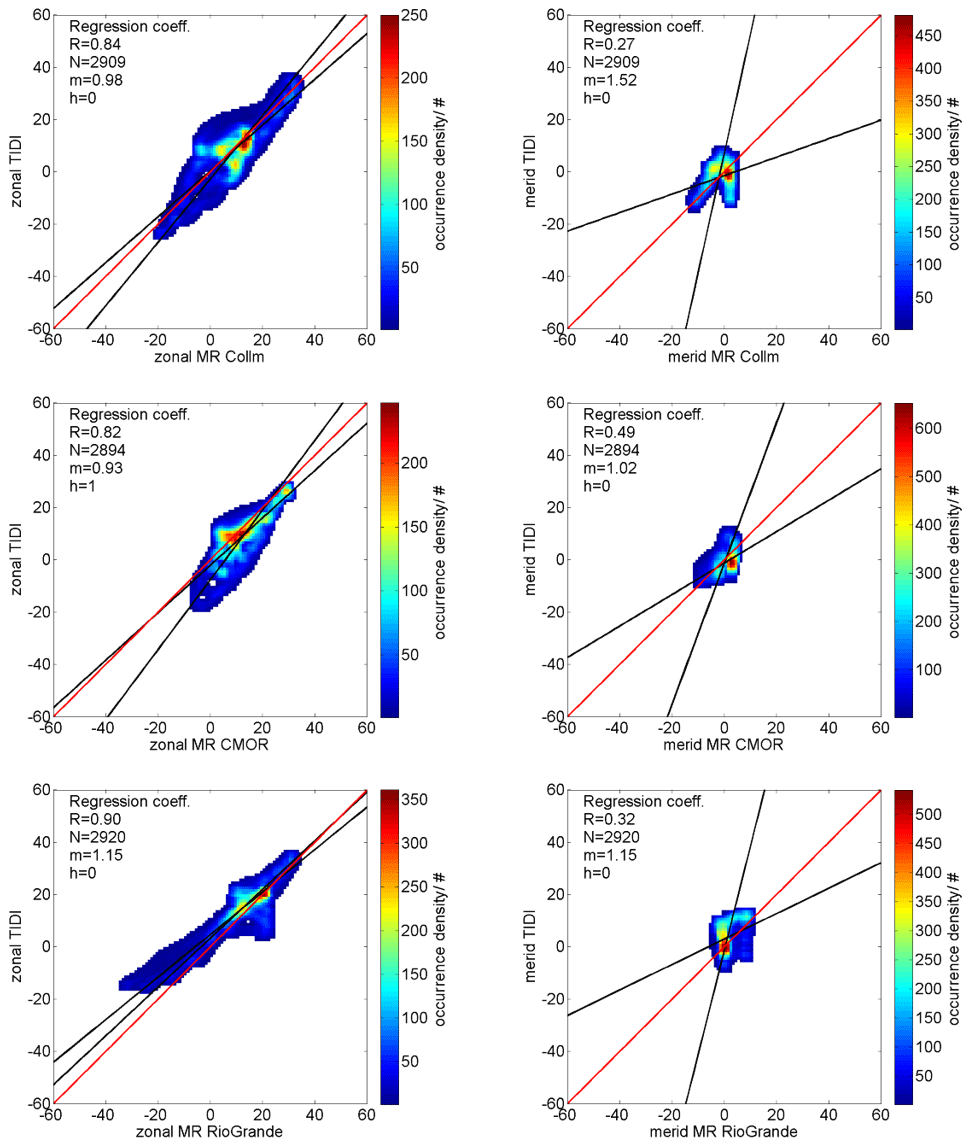
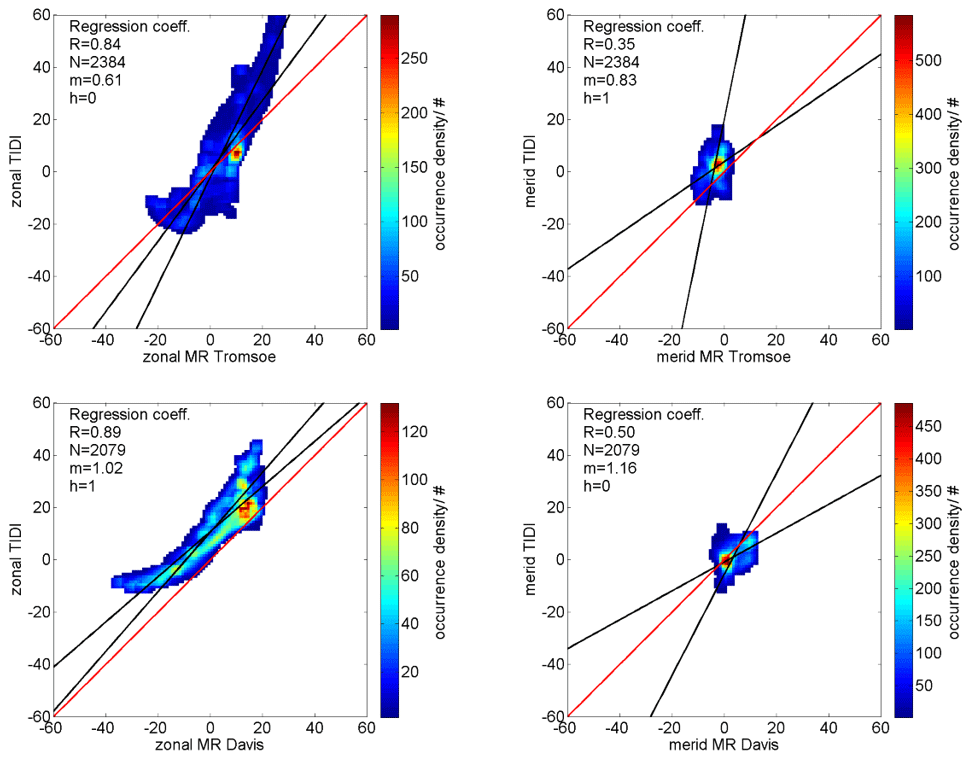
Figure 5Correlation and density plots comparing the zonal-mean zonal and meridional TIDI winds to the MR climatologies within the latitude bin for all mid-latitude stations, i.e., COL, CMOR and TDF (Rio Grande). The red line denotes the ideal correlation. There are two fitting curves included in black. The red line is just to guide the reader to the 1-to-1 correlation. The black lines are the slopes to the data for both linear fits, considering always the other variable as independent. h describes the t test result. h=1 indicates that the null hypothesis was rejected, while h=0 reflects the acceptance of the null hypothesis.
3.2 Seasonal TIDI–MR winds comparison
A seasonal comparison of the zonal-mean zonal and meridional wind can be found in Fig. 4 for all three mid-latitude sites. These zonal-mean zonal and meridional winds are constructed from composite days of accepted quality wind compilations for each longitude and latitude bin. We mitigated the different data coverage between daytime and nighttime by building a composite day averaging all observations for all longitudes, latitudes and time–altitude bins within 60 d. These composite days are then decomposed by applying a tidal fit including mean zonal and meridional winds and the diurnal, semidiurnal and terdiurnal migrating and non-migrating tidal components. However, due to the long averaging that is required, we model non-migrating tides as noise. This means that the non-migrating tides are being fitted but ignored in the rest of the study. The aim is to minimize their impact to focus on stable phenomena like background winds or migrating tides. We noticed artificial jumps in the wind time series associated with certain local times. These jumps overlaid a potential tidal signal and prevented us from analyzing and comparing specific tidal modes. However, this procedure mitigated the biases introduced by the instrument and resulted in more reliable zonal mean winds. The meridional winds have much smaller magnitudes; thus, the correlation is decreased.
In particular, at mid- and polar latitudes, the geophysical variability due to various tidal components and planetary waves within 60 d seemed to be problematic for inferring reliable non-migrating tidal components. We applied the same global tidal fit as in Baumgarten and Stober (2019).
For the construction of a composite year from the multiple years for the seasonal comparison, every composite year is associated with the year it belongs to. For each day, the mean value between different years is taken:
where Tn corresponds to periods of 24, 12 and 8 h, s denotes the zonal wave number, and λ is the geographic longitude. Asn and Bsn are the Fourier coefficients for each wavenumber and period, while u0 and v0 describe the zonal-mean zonal and meridional wind. This fit significantly improves the robustness of the derived zonal and meridional mean winds, as day–night differences in the TIDI data quality can be modeled as tidal modes and, thus, reduce the biases for both mean wind components. However, the estimated migrating and non-migrating tidal modes appear to be less reliable due to the intermittency of the tidal amplitudes and phases as well as the planetary wave activity within 60 d and longitude-dependent offsets in the TIDI data quality and measurement statistics. As pointed out in Dhadly et al. (2021), there is also a systematic bias in TIDI cold-side vector winds during forward flight, which is telescope-dependent and varies with the yaw cycle.
The derived zonal-mean zonal and meridional winds are then compared to the MR climatologies by applying the same averaging window of 60 d. The seasonal comparison shows that TIDI zonal winds capture most of the seasonal characteristics at mid- and polar latitudes compared to the MR climatology (Fig. 4) below 95 km. The summer zonal wind reversal from westward to eastward winds is well-reproduced concerning the reversal altitude and magnitudes as well as the weak eastward winds during the winter season up to about 90–94 km altitude. TIDI winds also reflect the gradual height change of the summer wind reversal altitude during the summer months for the northern mid-latitudes. Also, the asymmetry between the spring and fall transitions is visible at lower latitudes, with eastward winds being present at 85 km in September for TIDI. At this height, almost zero winds are observed in April. The spring transition from the winter to the summer seems to exhibit some difference. MR zonal winds for COL and CMOR show a westward wind over the entire MLT, whereas TIDI shows a weakening of the eastward winds. Winter zonal winds differ; while MR winds show a slight decrease in westerlies with height, TIDI winds are westward above 90 km. In the Southern Hemisphere at TDF, the spring and fall transitions seem to show less deviation compared to the TDF winds. These remaining differences seem to be a result of the 60 d averaging required for TIDI, which results in a reduced sensitivity to much more rapid changes in the mean winds that last for only a few weeks. Meridional winds show in general a less good agreement compared to the MR observations for all stations. However, even TIDI meridional winds catch the general seasonal wind morphology below 95 km altitude. TIDI winds show a significant southward wind during the summer months and weak northward wind during the hemispheric winter season, which resembles the MR wind pattern qualitatively. However, it remains unclear why TIDI meridional winds indicate southward winds during the winter months in the Northern Hemisphere. Such a circulation is absent for COL and CMOR.
We quantified the agreement between the MR observations and TIDI winds by computing the correlation and performing a paired t test to identify potential biases, assuming that, ideally, both distributions should have the same mean. Figures 5 and 6 show the correlations for the climatological TIDI and MR zonal-mean zonal and meridional winds at mid- and polar- latitudes, respectively. TIDI zonal winds show correlation coefficients between R=0.67 and 0.8. The highest correlation is found for TIDI winds at the polar latitude at TRO, whereas the lowest correlation was obtained for DAV. The other MRs at COL, CMOR and TDF show correlations between R=0.7 and R=0.76. TIDI meridional winds exhibit only a very low correlation compared to the MR winds. At polar latitudes, beyond 55° on both hemispheres, these seasonal correlations are limited to hemispheric summer months when we apply our quality criteria. The t test accepts the null hypothesis (h=0) for mid- and low-latitude stations for the zonal wind and occasionally for the meridional component. However, a rejection of the null hypothesis indicates a substantial bias of the mean wind larger than 2 m s−1.
3.3 Latitude cross-section for TIDI winds
Given the reasonable agreement of the TIDI zonal winds and the MR measurements, we calculated latitude cross-sections of the zonal-mean zonal and meridional winds for a typical northern hemispheric winter/summer condition in January and July, which are shown in Fig. 7. The latitude–height cross-section visualizes the hemispheric asymmetry of the zonal and meridional winds. TIDI captures differences in the strength of the eastward zonal jets between the Northern and Southern hemispheres. Furthermore, TIDI winds indicate a weak eastward wind up to about 90 km altitude during hemispheric winter. These winds are in good agreement with the MRs and the meteorological analysis NAVGEM-HA (McCormack et al., 2017; Stober et al., 2020; Liu et al., 2022). Our analysis also supports the presence of a hemispheric asymmetry found in the meteor radar data, with stronger eastward winds during northern summer conditions compared to southern polar latitudes (Stober et al., 2021b). The wind systems during hemispheric winter exhibit eastward wind from polar latitudes down to about 20° latitude, and a similar wind pattern is observable for the Northern Hemisphere winter.
During the hemispheric summer months, TIDI meridional winds at mid- and polar latitudes also show a characteristic vertical wind structure indicating equatorward winds during the hemispheric summer below 90 km, as expected from the residual circulation, and poleward inflow of air at higher altitudes. Equatorial latitudes and the corresponding winter hemisphere reflect only weak meridional winds.
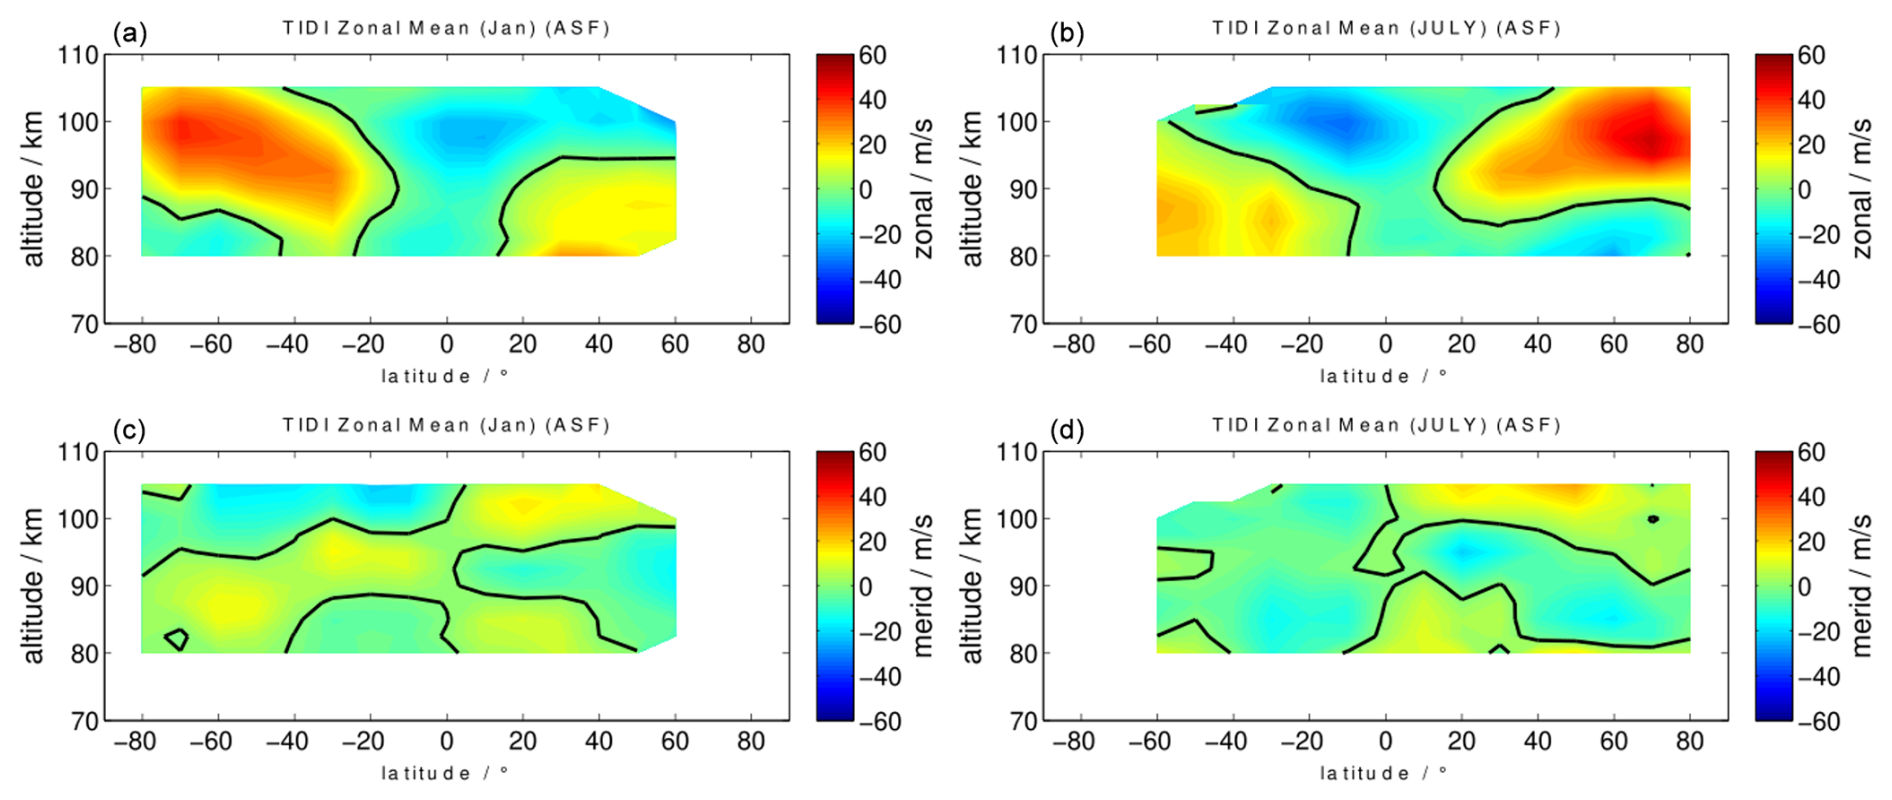
Figure 7Latitudinal cross-section of zonal-mean zonal winds and meridional winds from TIDI for January (a, c) and July (b, d).
Furthermore, we repeated the entire analysis and filtered the TIDI wind data only by the solar beta angle. Dhadly et al. (2021) proposed to filter all TIDI data collected when the solar beta angle is greater than 55°. Therefore, we removed all previously mentioned quality control filters and removed only orbits with such large solar beta angles. Figure 8 shows similar latitude cross-sections to those we obtained using the presented statistical method and the adaptive spectral filtering (ASF) technique. The improved latitudinal coverage is the result of the removed statistical limit for the number of observations required on one time–altitude–latitude–longitude bin. Both methods result in nearly identical climatological latitudinal cross-sections and, thus, confirm that the combination of a statistical filter and the ASF essentially removes the bias caused by zero-line calibration due to the hot–cold-side temperature difference.
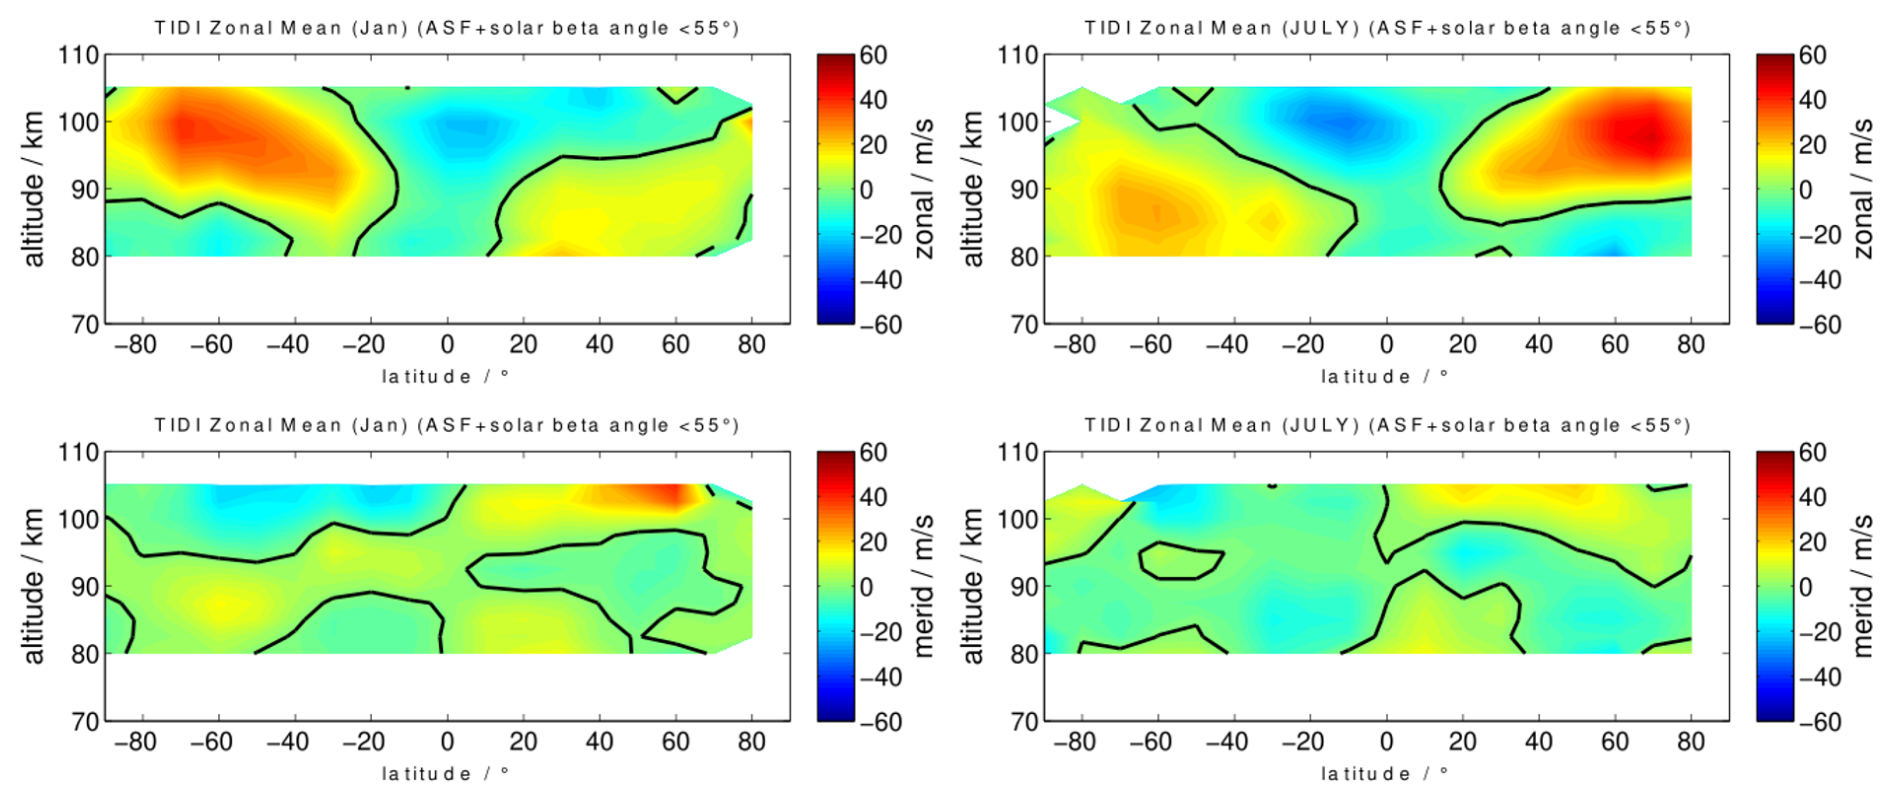
Figure 8The same as Fig. 7 but filtering the TIDI winds only for the solar beta angle (<55°).
Finally, Fig. 9 shows global projections of TIDI winds using 60 d averages to construct a composite day. The six panels represent snapshots of the zonal wind component based on means of 4 h time–altitude–longitude bins during January. The presence of negative zonal wind (westward wind) at low latitude regions and positive zonal wind (eastward wind) at middle and high latitudes is expected. It is possible to see in 4 h steps how the structure of the winds moves over time and to distinguish the diurnal westward propagating tide due to the solar heating of the atmosphere in the Southern Hemisphere and the SW2 migrating tide at mid- and polar latitudes in the Northern Hemisphere. The figure shows that TIDI winds can capture tidal features on both hemispheres when all quality controls are considered. Unfortunately, there are very often large gaps that pose challenges to obtaining mean winds and tides directly.
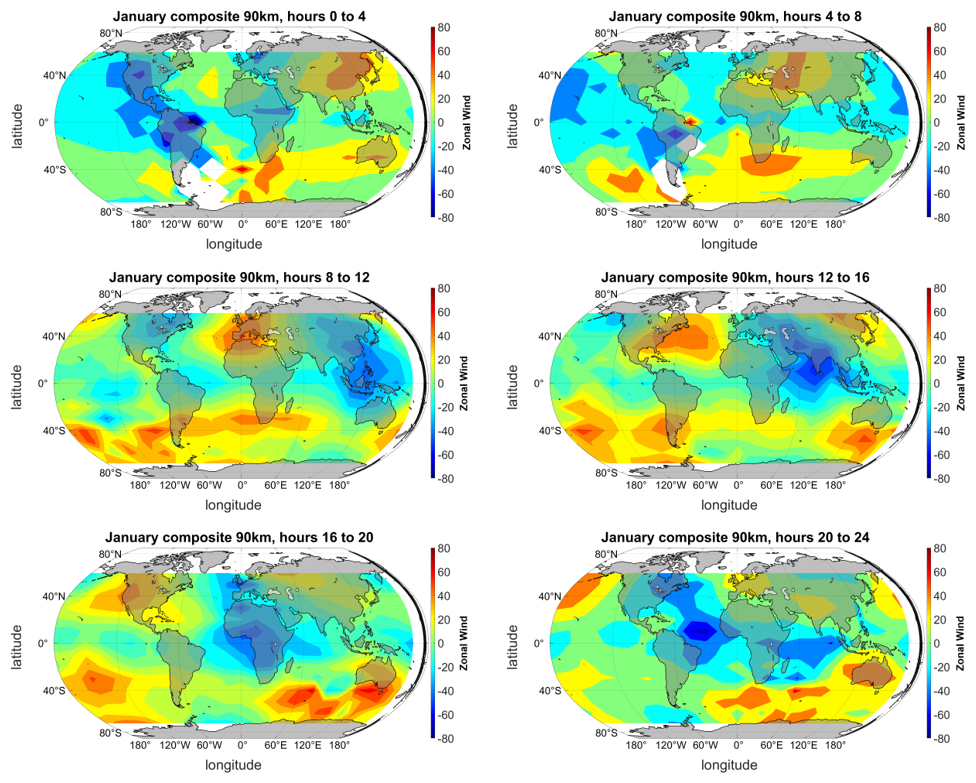
Figure 9These pictures represent zonal winds for the composite month of January. These pictures are compiled based on 60 d averages using the quality criteria derived in this paper.
Neutral winds are important, as they strongly influence the vertical propagation of atmospheric waves in the MLT region. The comparison between ground-based meteor radar measurements and satellite observations at these heights can prove particularly useful for improving data analysis and processing for both measurement systems. Our study shows very good correlations between TIDI and meteor radar zonal winds depending on local time and geographical latitude. TIDI seasonal zonal winds are well reproduced compared to the MR winds at mid-latitudes and during hemispheric summer conditions at polar latitudes. However, TIDI winds sometimes indicate a bias compared to the MR, which is likely associated with TIDI calibration as well as geophysical effects due to non-stationary atmospheric waves. Apart from the bias in TIDI cold-side vector winds during forward flight, another possible bias might originate from wind measurements near terminators where there is a gradient in emissions. One possible solution is to exclude data where the solar beta angle is high, but these data are not available to us. This issue exists but is mitigated by our statistical approach. As shown in Fig. 2, the terminator times are well picked up by our statistical criterion. During these times, a minimum of measurements is available; thus, our threshold filtering suppresses, at least partly, contamination. Furthermore, our comparison to the method presented in Dhadly et al. (2021) indicates that the ASF is suitable to model the bias caused by the hot–cold-side zero-line calibration offset as a tidal wave and to mitigate the impact of the zonal-mean zonal and meridional winds.
Our comparison of TIDI zonal and meridional winds and MRs at mid- and polar latitudes shows overall reasonable agreement of the general wind morphology for all altitudes below 95–98 km. TIDI captures the hemispheric summer zonal wind reversals and shows eastward winds during hemispheric winter up to 95 km. Only during the spring and fall transitions are larger discrepancies evident relative to the MR. The latitude–height cross-sections of the derived climatologies also confirm the results of previous studies based on multiple MR or meteorological analyses, such as NAVGEM-HA (McCormack et al., 2017; Stober et al., 2020; Hindley et al., 2022).
We tested the null hypothesis with a paired t test for the seasonal zonal and meridional winds to investigate the influence of the zero-line calibration. This test compares whether the MR winds and TIDI observations have the same mean within a 2 m s−1 threshold. This constitutes our null hypothesis. This threshold is used to take into account the fact that the observation volumes are still quite different. The null hypothesis was occasionally rejected at polar and mid-latitudes in both hemispheres for zonal and meridional winds, although the correlation coefficients reached 0.7–0.8 during the hemispheric summer months at TRO or DAV. The offset was on the order of up to 5–15 m s−1. Overall, TIDI zonal winds seem to be more reliable at low and mid-latitudes, whereas the polar latitude sites at TRO and DAV exhibit larger deviations from the one correlation line. Meridional winds reflect a substantial deviation compared to the MRs at all latitudes, which is reflected in much lower correlations between R=0.27 and R=0.5.
Furthermore, the inferred latitude–altitude cross-sections for typical hemispheric summer/winter conditions underline that the zonal-mean zonal TIDI winds are eastward up to 95–100 km during the hemispheric winter and also captures the latitudinal dependence of the summer wind reversal height, which increases with latitude. TIDI winds also reveal the hemispheric asymmetry of the magnitude of the summer eastward jets (Stober et al., 2021b).
TIDI meridional winds also reflect the general morphology of the seasonal wind characteristics compared to MRs up to an altitude of 95 km. Above this height, the winds seem to indicate substantial differences and appear to be biased when considering the MR winds as a reference. Based on the latitude–height cross-section, meridional winds exhibit an equatorward flow during the hemispheric summer months below 90 km, which is consistent with the expected behavior due to the residual circulation and mesospheric cooling due to the upwelling within the polar cap.
In this study, we focused on a detailed zonal-mean zonal and meridional TIDI wind analysis mitigating potential technical issues due to the zero-line calibration. The global tidal fit based on 60 d composite days showed clear signs of additional factors that caused substantial biases. Atmospheric tides as well as planetary waves have a significant variability within the required 60 d window. This variability is relevant for the amplitudes but also for the phase stability of these waves, which causes information mixing between migrating and non-migrating tides and other atmospheric waves. In particular, the Quasi-2-Day Wave (Q2DW) can reach large amplitudes of 40–60 m s−1 for a few days and often has a zonal wavenumber of 3, thus affecting all longitudes and several latitudes in one hemisphere (Stober et al., 2024). Additionally, other transient and rapidly evolving events such as sudden stratospheric warmings or the spring and fall transitions (Stober et al., 2020; Matthias et al., 2021) are problematic in constructing composite days and cause larger uncertainties. Gravity waves also contribute to the overall noise but are less critical due to their more local nature.
Meridional winds exhibit, in general, a much lower correlation compared to the meteor radar. This reduced correlation is related to the much lower magnitudes of the meridional mean winds, which are often around ±1–5 m s−1 on seasonal time scales in the MLT, whereas the zonal mean wind is dominated by stronger winds and characteristic seasonal patterns with magnitudes reaching up to ±10–40 m s−1. Considering a typical wind variability of 5–15 m s−1 and the instrumental uncertainty, which is comparable for both wind components, the meridional wind is more affected by local atmospheric wave variability and sampling effects relative to the zonal component. This is also often the case for other sensors (Wilhelm et al., 2017; Hagen et al., 2018; Stober et al., 2018).
Analyzing data from TIDI and MRs at different latitudes, this study focuses on the wind comparison of zonal-mean zonal and meridional winds and the dependence on local time and latitude. For that purpose, TIDI data are binned in a spatial grid by latitude, longitude and time. The TIDI winds are compared to the MR winds for co-located grid cells. This comparison is performed for five MRs for both zonal and meridional components in the summer and winter months. We derived a quality control filter based on the number of measurements per longitude–latitude and time–altitude to ensure sufficient statistics for TIDI, taking into account the unequal daytime and nighttime measurement distribution. The correlation calculation between TIDI measurements and different MR stations shows a reasonable agreement for zonal winds and reveals larger deviations for the meridional component.
The TIDI–MR seasonal comparison for mid-latitude stations at COL, CMOR and TDF between 50° N and S indicates that TIDI captures most seasonal characteristics for zonal winds. This is also true for zonal winds at polar latitudes during hemispheric summer. In particular, the summer zonal wind reversal from westward to eastward winds is observable. For meridional winds, the seasonal comparison is still reasonable, at least for TIDI winds up to 95 km. However, meridional winds generally indicate a less good agreement with the MR wind climatologies than the zonal component. TIDI winds appear to be most reliable between the equatorial and mid-latitudes and exhibit biases up to 5–16 m s−1 at polar latitudes for the meridional wind component in hemispheric summer conditions.
This work also highlights the altitude–latitude dependence for TIDI winds. For the zonal-mean zonal and meridional components, TIDI winds show the expected summer hemispheric wind reversal and the latitudinal dependence on the reversal altitude. This is visible even at higher latitudes. Our study supports the presence of a hemispheric asymmetry between the summer and winter hemispheres, with stronger eastward winds at higher latitudes for the summer hemisphere compared to eastward winds at latitudes for the winter hemisphere. For the meridional component and below 90 km, the presence of equatorward winds during hemispheric summer is revealed through the vertical wind structure at higher latitudes. Finally, this study demonstrates that zonal-mean TIDI climatologies at mid-latitudes and during hemispheric summer conditions well reproduce the mean circulation compared with the MRs. Thus, TIDI winds might be useful as a lower boundary for general circulation models such as TIE-GCM. TIE-GCM already includes an option to use TIDI wind climatology for lower atmospheric boundary conditions.
Our analysis also outlines a potential to estimate the zero-line calibration for lower-level TIDI data products by introducing statistical bias corrections that are altitude-, latitude-, longitude- and time-dependent. This can be optimized either by a generalized Tikhonov matrix or through machine learning approaches assuming MR winds or other climatologies as the ground truth.
All data used in this study are publicly available. The TIDI (TIMED Doppler Interferometer) data can be accessed via http://tidi.engin.umich.edu (Michigan Engineering, 2025). The MR radar data can be obtained upon request from the instrument PIs.
AG developed all source codes to optimize the global data binning of the TIDI winds and performed the data analysis. The global tidal fitting routine was developed by GS and adopted for this study. All authors contributed to the editing of the paper.
At least one of the (co-)authors is a member of the editorial board of Annales Geophysicae. The peer-review process was guided by an independent editor, and the authors also have no other competing interests to declare.
Publisher's note: Copernicus Publications remains neutral with regard to jurisdictional claims made in the text, published maps, institutional affiliations, or any other geographical representation in this paper. While Copernicus Publications makes every effort to include appropriate place names, the final responsibility lies with the authors.
Gunter Stober and Arthur Gauthier are members of the Oeschger Center for Climate Change Research (OCCR). The Esrange meteor radar operation, maintenance and data collection were provided by the Esrange Space Center of the Swedish Space Corporation.
This research has been supported by the STFC (grant no. ST/W00089X/1 to Mark Lester).
Christoph Jacobi acknowledges the support of the IAP Kühlungsborn, Germany, in the maintenance of the COL radar. Njål Gulbrandsen acknowledges the support of the Leibniz Institute of Atmospheric Physics (IAP), Kühlungsborn, Germany, for their contributions to the upgrade of the TRO meteor radar. We also thank Kathrin Baumgarten for her support of this work.
Operation of the Davis meteor radar was supported by Australian Antarctic Science projects 4445 and 4637. Support for Diego Janches as well as SAAMER-OS' operation are provided by NASA's Planetary Science Division Research Program through ISFM work packet Exospheres, Ionospheres, Magnetospheres Modeling at the Goddard Space Flight Center and NASA Engineering Safety Center (NESC) assessment TI-17-01204. This work was supported in part by the NASA Meteoroid Environment Office under cooperative agreement no. 80NSSC21M0073.
This research has been supported by the Schweizerischer Nationalfonds zur Förderung der Wissenschaftlichen Forschung (grant no. 200021-200517/1), the Science and Technology Facilities Council (grant no. ST/W00089X/1), the Japan Society for the Promotion of Science (grant nos. 21H04516, 21H04518, 21H01144, and 20K20940), the Australian Antarctic Division (AAS grant nos. 2668, 4025, 4445 and 4637), the NASA Engineering and Safety Center (grant no. TI-17-01204), the NASA Engineering and Safety Center (grant no. 80NSSC21M0073), the US NSF (grant no. AGS-1651464), the Deutsche Forschungsgemeinschaft (grant no. JA 836/47-1) and the International Space Science Institute (ISSI) in Bern (through ISSI International Team project 23-580 – Meteors and Phenomena at the Boundary between Earth's Atmosphere and Outer Space).
This research has been supported by the STFC (grant no. ST/W00089X/1 to Mark Lester). Operation of the Davis meteor radar was supported by Australian Antarctic Science projects 4445 and 4637. Support for Diego Janches as well as SAAMER-OS' operation are provided by NASA's Planetary Science Division Research Program through ISFM work packet Exospheres, Ionospheres, Magnetospheres Modeling at the Goddard Space Flight Center and NASA Engineering Safety Center (NESC) assessment TI-17-01204. This work was supported in part by the NASA Meteoroid Environment Office (cooperative agreement no. 80NSSC21M0073). This research has been supported by the Schweizerischer Nationalfonds zur Förderung der Wissenschaftlichen Forschung (grant no. 200021-200517/1), the Science and Technology Facilities Council (grant no. ST/W00089X/1), the Japan Society for the Promotion of Science (grant nos. 21H04516, 21H04518, 21H01144, and 20K20940), the Australian Antarctic Division (AAS grant nos. 2668, 4025, 4445 and 4637), the NASA Engineering and Safety Center (grant no. TI-17-01204), the NASA Engineering and Safety Center (grant no. 80NSSC21M0073), the US NSF (grant no. AGS-1651464), the Deutsche Forschungsgemeinschaft (grant no. JA 836/47-1) and the International Space Science Institute (ISSI) in Bern (through ISSI International Team project 23-580 – Meteors and Phenomena at the Boundary between Earth's Atmosphere and Outer Space).
The article processing charges for this open-access publication were covered by the German Aerospace Center (DLR).
This paper was edited by Dalia Buresova and reviewed by Kenneth Marr and two anonymous referees.
Amante, C. and Eakins, B.: ETOPO1 1 Arc-Minute Global Relief Model: Procedures, Data Sources and Analysis, NOAA Technical Memorandum NESDIS NGDC-24, National Geophysical Data Center, NOAA, https://doi.org/10.7289/V5C8276M, 2009. a
Baumgarten, K. and Stober, G.: On the evaluation of the phase relation between temperature and wind tides based on ground-based measurements and reanalysis data in the middle atmosphere, Ann. Geophys., 37, 581–602, https://doi.org/10.5194/angeo-37-581-2019, 2019. a
Becker, E.: Dynamical Control of the Middle Atmosphere, Space Sci. Rev., 168, 283–314, https://doi.org/10.1007/s11214-011-9841-5, 2012. a
Becker, E.: Mean-Flow Effects of Thermal Tides in the Mesosphere and Lower Thermosphere, J. Atmos. Sci., 74, 2043–2063, https://doi.org/10.1175/JAS-D-16-0194.1, 2017. a
Brown, P., Wong, D., Weryk, R., and Wiegert, P.: A meteoroid stream survey using the Canadian Meteor Orbit Radar: II: Identification of minor showers using a 3D wavelet transform, Icarus, 207, 66–81, https://doi.org/10.1016/j.icarus.2009.11.015, 2010. a
Dhadly, M., Jones Jr., M., Emmert, J., Drob, D., Budzien, S., Zawdie, K., and McCormack, J.: Short-Term to Inter-Annual Variability of the Non-Migrating Tide DE3 From MIGHTI, SABER, and TIDI: Potential Tropospheric Sources and Ionospheric Impacts, J. Geophys. Res.-Space Phys., 129, e2024JA032849, https://doi.org/10.1029/2024JA032849, 2024. a
Dhadly, M. S., Englert, C. R., Drob, D. P., Emmert, J. T., Niciejewski, R., and Zawdie, K. A.: Comparison of ICON/MIGHTI and TIMED/TIDI neutral wind measurements in the lower thermosphere, J. Geophys. Res.-Space Phys., 126, e2021JA029904, https://doi.org/10.1029/2021JA029904, 2021. a, b, c
Fritts, D. C., Janches, D., Iimura, H., Hocking, W. K., Mitchell, N. J., Stockwell, R. G., Fuller, B., Vandepeer, B., Hormaechea, J., Brunini, C., and Levato, H.: Southern Argentina Agile Meteor Radar: System design and initial measurements of large-scale winds and tides, J. Geophys. Res.-Atmos., 115, D18112, https://doi.org/10.1029/2010JD013850, 2010. a
Gudadze, N., Stober, G., and Chau, J. L.: Can VHF radars at polar latitudes measure mean vertical winds in the presence of PMSE?, Atmos. Chem. Phys., 19, 4485–4497, https://doi.org/10.5194/acp-19-4485-2019, 2019. a
Hagen, J., Murk, A., Rüfenacht, R., Khaykin, S., Hauchecorne, A., and Kämpfer, N.: WIRA-C: a compact 142-GHz-radiometer for continuous middle-atmospheric wind measurements, Atmos. Meas. Tech., 11, 5007–5024, https://doi.org/10.5194/amt-11-5007-2018, 2018. a
Hall, C. M. and Tsutsumi, M.: Changes in mesospheric dynamics at 78°N, 16°E and 70° N, 19° E: 2001–2012, J. Geophys. Res.-Atmos., 118, 2689–2701, 2013. a
Hindley, N. P., Mitchell, N. J., Cobbett, N., Smith, A. K., Fritts, D. C., Janches, D., Wright, C. J., and Moffat-Griffin, T.: Radar observations of winds, waves and tides in the mesosphere and lower thermosphere over South Georgia island (54° S, 36° W) and comparison with WACCM simulations, Atmos. Chem. Phys., 22, 9435–9459, https://doi.org/10.5194/acp-22-9435-2022, 2022. a, b
Hocking, W., Fuller, B., and Vandepeer, B.: Real-time determination of meteor-related parameters utilizing modern digital technology, J. Atmos. Sol.-Terr. Phy., 63, 155–169, https://doi.org/10.1016/S1364-6826(00)00138-3, 2001. a
Holdsworth, D. A., Reid, I. M., and Cervera, M. A.: Buckland Park all-sky interferometric meteor radar, Radio Sci., 39, rS5009, https://doi.org/10.1029/2003RS003014, 2004. a
Holdsworth, D. A., Murphy, D. J., Reid, I. M., and Morris, R. J.: Antarctic meteor observations using the Davis MST and meteor radars, Adv. Space Res., 42, 143–154, 2008. a
Jacobi, C., Fröhlich, K., Viehweg, C., Stober, G., and Kürschner, D.: Midlatitude mesosphere/lower thermosphere meridional winds and temperatures measured with meteor radar, Adv. Space Res., 39, 1278–1283, https://doi.org/10.1016/j.asr.2007.01.003, 2007. a
Killeen, T., Wu, Q., Solomon, S., Ortland, D., Skinner, W., Niciejewski, R., and Gell, D.: TIMED Doppler Interferometer: Overview and recent results, J. Geophys. Res.-Space Phys., 111, A10S01, 2006. a, b, c, d
Lindzen, R. S.: Atmospheric Tides, Annu. Rev. Earth Planet. Sc., 7, 199–225, https://doi.org/10.1146/annurev.ea.07.050179.001215, 1979. a
Lindzen, R. S.: Turbulence and stress owing to gravity wave and tidal breakdown, J. Geophys. Res.-Oceans, 86, 9707–9714, https://doi.org/10.1029/JC086iC10p09707, 1981. a
Lindzen, R. S. and Chapman, S.: Atmospheric Tides, Space Sci. Rev., 10, 3–188, 1969. a
Liu, G., Janches, D., Ma, J., Lieberman, R. S., Stober, G., Moffat-Griffin, T., Mitchell, N. J., Kim, J.-H., Lee, C., and Murphy, D. J.: Mesosphere and Lower Thermosphere Winds and Tidal Variations During the 2019 Antarctic Sudden Stratospheric Warming, J. Geophys. Res.-Space Phys., 127, e2021JA030177, https://doi.org/10.1029/2021JA030177, 2022. a, b
Liu, H.-L.: Variability and predictability of the space environment as related to lower atmosphere forcing, Space Weather, 14, 634–658, https://doi.org/10.1002/2016SW001450, 2016. a
Matthias, V., Stober, G., Kozlovsky, A., Lester, M., Belova, E., and Kero, J.: Vertical Structure of the Arctic Spring Transition in the Middle Atmosphere, J. Geophys. Res.-Atmos., 126, e2020JD034353, https://doi.org/10.1029/2020JD034353, 2021. a
McCormack, J., Hoppel, K., Kuhl, D., de Wit, R., Stober, G., Espy, P., Baker, N., Brown, P., Fritts, D., Jacobi, C., Janches, D., Mitchell, N., Ruston, B., Swadley, S., Viner, K., Whitcomb, T., and Hibbins, R.: Comparison of mesospheric winds from a high-altitude meteorological analysis system and meteor radar observations during the boreal winters of 2009-2010 and 2012-2013, J. Atmos. Sol.-Terr. Phy., 154, 132–166, https://doi.org/10.1016/j.jastp.2016.12.007, 2017. a, b, c
Michigan Engineering: TIDI: Timed Doppler Interferometer, http://tidi.engin.umich.edu (last access: April 2024), 2025. a
Niciejewski, R., Wu, Q., Skinner, W., Gell, D., Cooper, M., Marshall, A., Killeen, T., Solomon, S., and Ortland, D.: TIMED doppler interferometer on the thermosphere ionosphere mesosphere energetics and dynamics satellite: Data product overview, J. Geophys. Res.-Space Phys., 111, A11S90, 2006. a, b
Oberheide, J., Wu, Q., Ortland, D., Killeen, T., Hagan, M., Roble, R., Niciejewski, R., and Skinner, W.: Non-migrating diurnal tides as measured by the TIMED Doppler interferometer: Preliminary results, Adv. Space Res., 35, 1911–1917, https://doi.org/10.1016/j.asr.2005.01.063, 2005. a
Paulino, A. R., Rodrigues, D. O., Paulino, I., Lima, L. M., Buriti, R. A., Batista, P. P., Ridley, A., and Wu, C.: Comparison of meteor radar and satellite winds in the Brazilian equatorial region, Ann. Geophys., 43, 183–191, https://doi.org/10.5194/angeo-43-183-2025, 2025. a
Pokhotelov, D., Becker, E., Stober, G., and Chau, J. L.: Seasonal variability of atmospheric tides in the mesosphere and lower thermosphere: meteor radar data and simulations, Ann. Geophys., 36, 825–830, https://doi.org/10.5194/angeo-36-825-2018, 2018. a
Smith, A. K.: Global Dynamics of the MLT, Surv. Geophys., 33, 1177–1230, https://doi.org/10.1007/s10712-012-9196-9, 2012. a
Stober, G., Chau, J. L., Vierinen, J., Jacobi, C., and Wilhelm, S.: Retrieving horizontally resolved wind fields using multi-static meteor radar observations, Atmos. Meas. Tech., 11, 4891–4907, https://doi.org/10.5194/amt-11-4891-2018, 2018. a
Stober, G., Baumgarten, K., McCormack, J. P., Brown, P., and Czarnecki, J.: Comparative study between ground-based observations and NAVGEM-HA analysis data in the mesosphere and lower thermosphere region, Atmos. Chem. Phys., 20, 11979–12010, https://doi.org/10.5194/acp-20-11979-2020, 2020. a, b, c, d
Stober, G., Kozlovsky, A., Liu, A., Qiao, Z., Tsutsumi, M., Hall, C., Nozawa, S., Lester, M., Belova, E., Kero, J., Espy, P. J., Hibbins, R. E., and Mitchell, N.: Atmospheric tomography using the Nordic Meteor Radar Cluster and Chilean Observation Network De Meteor Radars: network details and 3D-Var retrieval, Atmos. Meas. Tech., 14, 6509–6532, https://doi.org/10.5194/amt-14-6509-2021, 2021a. a, b
Stober, G., Kuchar, A., Pokhotelov, D., Liu, H., Liu, H.-L., Schmidt, H., Jacobi, C., Baumgarten, K., Brown, P., Janches, D., Murphy, D., Kozlovsky, A., Lester, M., Belova, E., Kero, J., and Mitchell, N.: Interhemispheric differences of mesosphere–lower thermosphere winds and tides investigated from three whole-atmosphere models and meteor radar observations, Atmos. Chem. Phys., 21, 13855–13902, https://doi.org/10.5194/acp-21-13855-2021, 2021b. a, b, c, d
Stober, G., Liu, A., Kozlovsky, A., Qiao, Z., Kuchar, A., Jacobi, C., Meek, C., Janches, D., Liu, G., Tsutsumi, M., Gulbrandsen, N., Nozawa, S., Lester, M., Belova, E., Kero, J., and Mitchell, N.: Meteor radar vertical wind observation biases and mathematical debiasing strategies including the 3DVAR+DIV algorithm, Atmos. Meas. Tech., 15, 5769–5792, https://doi.org/10.5194/amt-15-5769-2022, 2022. a
Stober, G., Vadas, S. L., Becker, E., Liu, A., Kozlovsky, A., Janches, D., Qiao, Z., Krochin, W., Shi, G., Yi, W., Zeng, J., Brown, P., Vida, D., Hindley, N., Jacobi, C., Murphy, D., Buriti, R., Andrioli, V., Batista, P., Marino, J., Palo, S., Thorsen, D., Tsutsumi, M., Gulbrandsen, N., Nozawa, S., Lester, M., Baumgarten, K., Kero, J., Belova, E., Mitchell, N., Moffat-Griffin, T., and Li, N.: Gravity waves generated by the Hunga Tonga–Hunga Ha′apai volcanic eruption and their global propagation in the mesosphere/lower thermosphere observed by meteor radars and modeled with the High-Altitude general Mechanistic Circulation Model, Atmos. Chem. Phys., 24, 4851–4873, https://doi.org/10.5194/acp-24-4851-2024, 2024. a
van Caspel, W. E., Espy, P., Hibbins, R., Stober, G., Brown, P., Jacobi, C., and Kero, J.: A Case Study of the Solar and Lunar Semidiurnal Tide Response to the 2013 Sudden Stratospheric Warming, J. Geophys. Res.-Space Phys., 128, e2023JA031680, https://doi.org/10.1029/2023JA031680, 2023. a
Webster, A. R., Brown, P. G., Jones, J., Ellis, K. J., and Campbell-Brown, M.: Canadian Meteor Orbit Radar (CMOR), Atmos. Chem. Phys., 4, 679–684, https://doi.org/10.5194/acp-4-679-2004, 2004. a
Wilhelm, S., Stober, G., and Chau, J. L.: A comparison of 11-year mesospheric and lower thermospheric winds determined by meteor and MF radar at 69° N, Ann. Geophys., 35, 893–906, https://doi.org/10.5194/angeo-35-893-2017, 2017. a
Wu, C. and Ridley, A. J.: Comparison of TIDI Line of Sight Winds With ICON-MIGHTI Measurements, J. Geophys. Res.-Space Phys., 128, e2022JA030910, https://doi.org/10.1029/2022JA030910, 2023. a
Wu, Q., Killeen, T., Ortland, D., Solomon, S., Gablehouse, R., Johnson, R., Skinner, W., Niciejewski, R., and Franke, S.: TIMED Doppler interferometer (TIDI) observations of migrating diurnal and semidiurnal tides, J. Atmos. Sol.-Terr. Phy., 68, 408–417, https://doi.org/10.1016/j.jastp.2005.02.031, 2006. a