the Creative Commons Attribution 4.0 License.
the Creative Commons Attribution 4.0 License.
A two-step geospace storm as a new tool of opportunity for experimentally estimating the threshold condition for the formation of a substorm current wedge
Leonid F. Chernogor
In the study of coupling processes acting within the upper atmosphere, a major challenge remains in quantifying the transformation of energy. One of the energy pathways between the ionospheric heights and the magnetosphere is the diversion of the cross-tail electric current into the ionosphere through the current wedge. One of the most interesting observations made in this study shows that during one of the two steps of the two-step storm, part of the near-Earth cross-tail current closed itself via the ionosphere, to which it was linked by the substorm current wedge, and manifested itself in the magnetograms acquired at equatorial and high-latitude stations on the night side of the Earth. As result, the two-step character of this storm has allowed us to suggest that the Bz interplanetary magnetic field component threshold for the formation of the substorm current wedge lies within the −(22–30) nT interval. Consequently, this study suggests, for the first time, that the emergence of a current wedge during a two-step geospace storm may be quantified by a threshold value of the interplanetary magnetic field (IMF) Bz component utilizing observations made during a two-step geospace storm with ground-based magnetometers. The study, for the first time, convincingly attests to the two-step geospace storm to be the best possible solar–terrestrial event of opportunity for realizing a technique for estimating the IMF Bz component threshold for the formation of the substorm current wedge. These conclusions have been drawn from the examination of the latitudinal dependence of variations in the geomagnetic field on the surface of the Earth on the global scale during the severe two-step geomagnetic storm of 23–24 April 2023, a major two-step storm in solar cycle 25. The data available via the INTERMAGNET magnetometer network (https://imag-data.bgs.ac.uk/GIN_V1/GINForms2, last access: 19 December 2024) were chosen for two near-meridional chains of stations, one in the Western (eight stations) and the other in the Eastern (10 stations) Hemisphere, which were situated, for the first time, in such a way that one of them was in the night hemisphere during both of the two steps of the geomagnetic storm. Other features of this two-step storm include the following. In the Western Hemisphere, the fluctuations in the geomagnetic field strength on the days used as a quiet-time reference period usually did not exceed a few tens of nanoteslas (nT), whereas in the course of the disturbed days, the variations in the geomagnetic field strength increased by a factor of 2 to 10 and reached a few hundred nanoteslas. In the Eastern Hemisphere during quiet times, the middle- and low-latitude magnetometer stations generally recorded strength fluctuations smaller than 10–20 nT, while during the disturbed period, the fluctuations increased by a factor of 2–5 and greater, attaining ± (50–70) nT. The strength fluctuations showed a considerable increase of up to 300–700 nT at high latitudes. The northward component of the geomagnetic field, X, exhibited the greatest perturbations at all latitudes in both hemispheres as the level of strength fluctuations decreased with decreasing latitude. The geomagnetic field strength fluctuations recorded at the magnetometer stations nearly equidistant from the Equator were observed to be close in magnitude. The strength fluctuations observed with the stations at close latitudes but in different hemispheres were also close in value.
- Article
(10634 KB) - Full-text XML
- BibTeX
- EndNote
Solar storms accompanied by solar flares, coronal mass ejections, generation of shocks associated with coronal mass ejections, or fast solar wind streams act to generate a complex set of processes in the solar–terrestrial system comprised of the Sun, interplanetary medium, magnetosphere, ionosphere, atmosphere, and solid Earth to produce geospace storms or to cause significant variations in space weather. A geospace storm includes synergistically interacting storms in the magnetic field (geomagnetic storms); in the ionosphere (ionospheric storms); in thermospheric neutral density variations, earlier termed the thermospheric storms (see, e.g., Prölss and Roemer, 1987); and in the electric field in the magnetosphere, ionosphere, and atmosphere (electrical storms) (see, e.g., Kleimenova et al., 2008, 2017; Chernogor and Domnin, 2014; Chernogor, 2021a). Geospace storms actually constitute the state of space weather. Space weather can have adverse effects on ground systems, such as radars or power lines (effects involving magnetic-storm-induced geoelectrical currents) or space-, air-, and ground-based communication links. The latter include errors in the Global Positioning System and very low frequency (VLF) navigation systems, loss of high-frequency (HF) communications (Wang et al., 2022, 2023), disruption of ultra high frequency (UHF) satellite links due to scintillations, etc. Disturbances appear in all ranges of radio waves, from VLF to UHF. Thus, many of humankind's technological systems are susceptible to failure or unreliable performance because of geospace storms, and therefore the study of the manifestations of geospace storms in all geospheres and geophysical fields remains an important task.
The manifestations of geomagnetic storms have been studied better than those of the other kinds of storms. They are dealt with in a large number of studies concerned with a major challenge to quantify the energetics of magnetic storms (see, e.g., Gonzalez et al., 1994), the geomagnetic storm effects within the altitude range from the Earth's surface to 100 km at mid-latitudes (see, e.g., Laštovička, 1996), the thermospheric response to geomagnetic activity on a global scale (see, e.g., Fuller-Rowell et al., 1997; Buonsanto, 1999), the ionospheric response to magnetic storms (see, e.g., Danilov and Laštovička, 2001), the dynamic processes in the ionosphere during magnetic storms from the Kharkiv incoherent scatter radar observations (Chernogor et al., 2007), the statistical characteristics of geomagnetic storms in the 24th cycle (Chernogor, 2021b), the origin of dawn-side subauroral polarization streams during major geomagnetic storms (Lin et al., 2022), the simulation of a total of 122 storms ground magnetic variations, from the period of 2010–2019, which has shown that high-latitude regional disturbances are still difficult to predict (Al Shidi et al., 2022), and nonlinearities in the ionosphere and thermosphere response to forcing uncertainties (Hsu and Pedatella, 2023). Since a myriad of geomagnetic storm manifestations may be observed, these issues have been summarized from time to time in books. They include a comprehensive discussion of ionospheric F-region storms (Prölss, 1995), most recent developments in space weather (Daglis, 2001), comprehensive overview of space weather (Song et al., 2001), scientific background of space storms for explaining magnetic storms on Earth (Bothmer and Daglis, 2006), importance of the tail current (Kamide and Maltsev, 2007), key concepts of space weather (Moldwin, 2022), and current state of the art in the field of space storms (Koskinen, 2011). The main concern was to study the most severe storms since they have the strongest impact on human well-being and the correct functioning of space- and ground-based systems and can affect human health. The latter include space weather, which can endanger human life or health directly (e.g., Daglis, 2001; Song et al., 2001); biological impacts of space storms (Bothmer and Daglis, 2006); and the perils of living in space generally (Moldwin, 2022).
Only one of many magnetic storms, a major storm in solar cycle 24 in September 2017, was discussed in dozens of studies, which were devoted to geomagnetic storm effects on the thermosphere and ionosphere (see, e.g., Qian et al., 2019; latitudinal dependence of quasi-periodic variations in the geomagnetic field; Chernogor and Shevelev, 2020), negative ionospheric response over the European sector (Oikonomou et al., 2022), ionospheric storm over the Brazilian and African longitudes (Fagundes et al., 2023), and longitudinal dependence of total electron content (TEC) retrieved from four stations installed at low-to-mid-latitude Asian regions of Pakistan and China (Tariq et al., 2022); the global ionospheric maps released by Chinese Academy of Sciences were used to study variations in TEC over China and its adjacent regions by Wen and Mei (2020). Examples of other magnetic storms that occurred over 2016–2022 include the physics of geospace storms (Chernogor, 2021a), the statistical characteristics of geomagnetic storms in the 24th cycle of solar activity (Chernogor, 2021b), the effects of the strong ionospheric storm on 26 August 2018 as captured with multipath radio-wave monitoring (Chernogor et al., 2021), the incoherent scatter radar and ionosonde observations of the ionospheric storm of 21–24 December 2016 (Katsko et al., 2021), the influence on high-frequency radio-wave characteristics of dynamic processes in the magnetic field and in the ionosphere during the 30 August–2 September 2019 geospace storm (Luo et al., 2021a), the geospace storm effects on 5–6 August 2019 (Luo et al., 2021b), the magneto-ionospheric effects of the geospace storm of 21–23 March 2017 (Luo et al., 2022), the characteristic features of the magnetic and ionospheric storms of 21–24 December 2016 (Luo and Chernogor, 2022), and the thermospheric temperature and density variability during the 3–4 February 2022 minor geomagnetic storm (Laskar et al., 2023). The statistical analysis of geomagnetic storm effects can be found in Chernogor (2021b), Abe et al. (2023), and De Abreu et al. (2023).
The study of geomagnetic storms remains one of the main problems in space physics. This occurs for a few reasons. First, every magnetic storm has its own individual features in addition to the general characteristics. Second, the manifestation of magnetic storms is dependent on the solar storm parameters and features, general state of space weather, geographic coordinates, local time, and solar cycle phase. The purpose of this paper is to analyze characteristic features of latitudinal manifestations of the 23–24 April 2023 geomagnetic storm, one of the major two-step storms in solar cycle 25 to date. The main features of the coronal mass ejection that caused this two-step storm can be summarized as follows (Ghag et al., 2024). First, the storm lacked sudden storm commencement. Instead, the interplanetary magnetic field Bz component turned southward at 17:37 UT on 23 April 2023 and remained negative for about 3 h, after which Bz was fluctuating during the sheath transit until almost 01:00 UT on 24 April 2023 with Bz ∼ −22 nT (https://spaceweather.com/images2023/25apr23/cmeimpact.jpg, last access: 19 December 2024). This process was the likely cause of the first step of the severe geomagnetic storm. Next, a magnetic cloud transit occurred, with Bz ∼ −30 nT, which was the cause of the second step of the storm under study. The two magnetometer chains employed in this study were chosen, for the first time, in such a way that one of them was in the night hemisphere of the Earth during both of the two steps of the 23–24 April 2023 geomagnetic storm.
The paper begins with a description of the data being analyzed and the state of space weather. Next, the main results of data analysis presented in the Appendix in detail are summarized and the diversion of the cross-tail current into the ionosphere through a current wedge identified. Then the specification of a threshold for the emergence of the current wedge is described along with the principle achievement of this study, which, for the first time, convincingly attests to the two-step geospace storm to be the best possible solar–terrestrial event of opportunity for realizing a technique for estimating the interplanetary magnetic field (IMF) Bz component threshold for the formation of the substorm current wedge. The paper ends with the conclusions drawn.
Table 1Observatories in the Western Hemisphere.
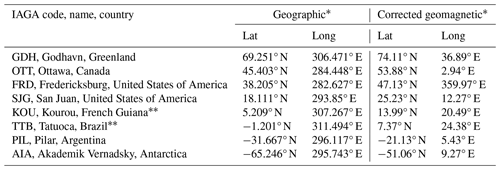
∗ The coordinates are retrieved from the list of geomagnetic observatories at https://isgi.unistra.fr/listobs_index.php?index=SSC (last access: 19 December 2024). The geomagnetic coordinates are not corrected.
Table 2Observatories in the Eastern Hemisphere.
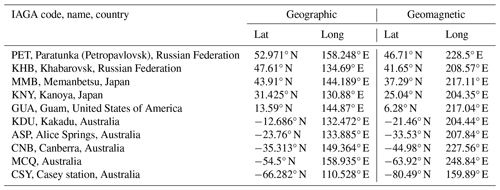
∗ The coordinates are retrieved from the list of geomagnetic observatories at https://isgi.unistra.fr/listobs_index.php?index=SSC (last access: 19 December 2024).
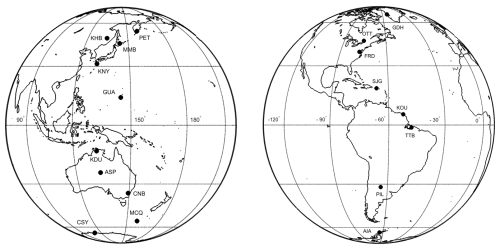
The data available at the INTERMAGNET magnetometer network website (https://imag-data.bgs.ac.uk/GIN_V1/GINForms2, last access: 22 November 2023) from two near-meridional chains of stations, one in the Western (eight stations) and the other in the Eastern (10 stations) Hemisphere, have been retrieved (Fig. 1). The vector magnetometers acquire measurements with 0.1 nT strength resolution at a sampling rate of one sample per second. The observatories in the Western Hemisphere are listed in Table 1, and those in the Eastern Hemisphere are presented in Table 2. Analysis of temporal variations in the strength of the northward, X; eastward, Y; and vertical, Z, components of the geomagnetic field over the period of 20–26 April 2023 has been performed.
The data processing technique is as follows. First, the data on the absolute value of time variations are used to calculate the diurnal trend. Then, the diurnal trend is subtracted from the primary time series resulting in the time series of relative magnitudes. The relative magnitudes of variations in all components of the geomagnetic field are subjected to further analysis.
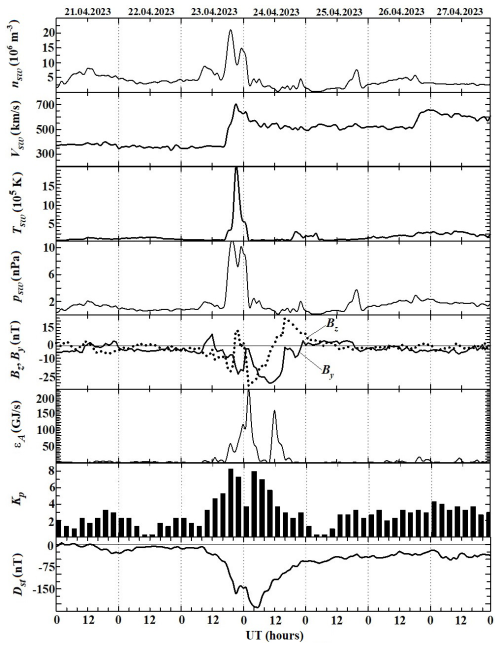
Figure 2Variations with universal time (UT) in the solar wind parameters of measured proton number density, nsw; temperature, Tsw; plasma flow speed, Vsw; calculated dynamic pressure, psw; measured Bz and By components of the interplanetary magnetic field; variations in the calculated magnitude of the energy, εA, deposited into the Earth's magnetosphere from the solar wind per unit time; and Kp and Dst indices for the period of 21–27 April 2023 (retrieved from https://omniweb.gsfc.nasa.gov/form/dx1.html, last access: 14 November 2023). Dates are indicated at the top of the figure.
The data involved in the analysis of space weather include the temporal variations in the solar wind parameters (https://omniweb.gsfc.nasa.gov/form/dx1.html, last access: 19 December 2024); the interplanetary magnetic field; the storm-time variation, Dst; and the 3 h planetary, Kp, index (https://wdc.kugi.kyoto-u.ac.jp/, last access: 19 December 2024); as well as the calculated solar wind dynamic pressure and the Akasofu energy function, all of which are presented in Fig. 2.
During the 23–24 April 2023 storm, the solar wind showed a peak in the proton density of 21.1 × 10⁶ m−3 from a background of (5–10) × 106 m−3, when the solar wind speed exhibited an enhancement to 706 km s−1 from a background of 350–400 km s−1 observed prior to the storm. These enhancements were accompanied by a rise in the dynamic pressure of 11 nPa from a background of 1–3 nPa and by an increase in the temperature of 20.5 × 10⁵ K from a background of (1–2) × 105 K. Under quiet conditions, the strengths of the IMF By and Bz components usually did not exceed ± 5 nT, whereas they significantly increased on 23 and 24 April 2023, with Bymax≈ 9.5 nT, Bymin≈ −30.2 nT, Bzmax≈ 10.5 nT, and Bzmin≈ −32.4 nT. In the course of the magnetically quiet period, the Akasofu function was smaller than 10 GJ s−1, whereas two large peaks of up to 220 and 160 GJ s−1 were observed to persist for 14 and 7 h, respectively, during 23 and 24 April 2023.
The magnitude of the background Kp index varied from 0 to 3, whereas it increased from 4 to 8.3 after 12:00 UT on 23 April 2023 and further decreased to 4. Yet another increase in the Kp index, up to 8, was observed between 03:00 and 06:00 UT on 24 April 2023. Before 08:00 UT on 23 April 2023, the magnitude of Dst varied from −30 to 5 nT. Over the interval ∼ 18:00 UT on 23 April 2023 to ∼ 01:00 UT on 24 April 2023, the Dst index showed a minimum of about −170 nT, and it exhibited a new change of approximately −212 nT between ∼ 01:00 UT and ∼ 06:00 UT on 24 April 2023. After the latter, the Dst index increased from −212 to −25 nT. Thus, this storm is the first in the solar cycle 25 two-step severe geomagnetic storm with onset at 19:26 UT on 23 April 2023, which was caused by a coronal mass ejection (Ghag et al., 2024).
Table 3Peak-to-peak amplitude of the strength fluctuations in the geomagnetic field components recorded at the stations in the Western Hemisphere.
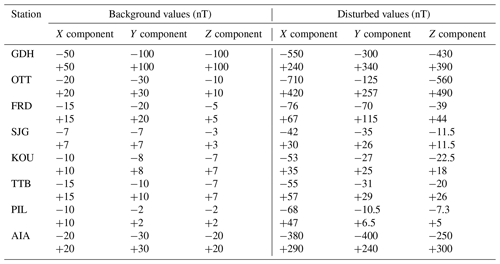
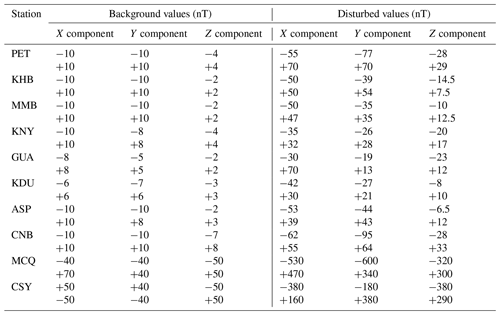
Figures A1–A9 in the Appendix show variations over time (in UT) in the relative strength of the northward X, eastward Y, and vertical Z component of the geomagnetic field over the period of 20–26 April 2023, within which the two-step geospace storm occurred on 23–24 April 2023. The variations in the relative strength of the three geomagnetic field components are analyzed in detail in Appendix, and the results are summarized in Tables 3 and 4. Table 3 shows the peak-to-peak amplitude of the strength fluctuations in the geomagnetic field components recorded at the stations in the Western Hemisphere, and Table 4 gives peak-to-peak amplitude of the strength fluctuations in the geomagnetic field components recorded at the stations in the Eastern Hemisphere. The data presented in Fig. 3 reveal that part of the cross-tail current is diverted into the polar ionosphere through the substorm current wedge.
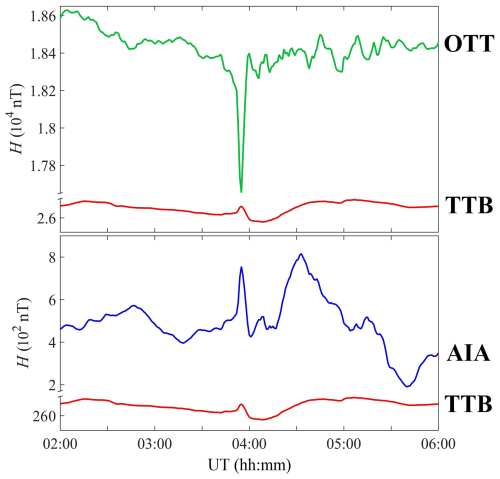
Figure 3Magnetograms from high-latitude OTT and AIA stations and equatorial TTB station on the night side during the second step of the 23–24 April 2023 geomagnetic storm.
An analysis of these data shows that all geomagnetic field components were at a maximum during two time intervals, one from approximately 12:00 to 21:00 UT on 23 April 2023 and the other from 01:00 to 05:00 UT on 24 April 2023. Thus, this was a two-step severe geomagnetic storm in solar cycle 25 (Ghag et al., 2024), with Kp indices of 8.3 and 7.7, and the Dst index equal to −170 and −212 nT, which is the main characteristic feature of the storm.
Substituting the solar wind dynamic pressure of 11 and 10 nPa recorded for these two storms (Fig. 2) into the expression for the energy of the magnetic storm (Gonzalez et al., 1994) yields 8.1 and 9.7 PJ, with the power of these storms being 173 and 674 GW, respectively. According to NOAA (https://www.swpc.noaa.gov, last access: 19 December 2024), these storms are classified as G4 (severe) geomagnetic storms. This is the second characteristic feature of the storm.
In the Western Hemisphere, the geomagnetic storm started during the day on 23 April 2023, continued through the night of 23–24 April 2023, and ceased in the daytime on 24 April 2023. In the Eastern Hemisphere, the storm appeared during local nighttime on 23–24 April 2023 and continued during the day and at night on 24 April 2023.
Next consider the latitudinal dependence of the geomagnetic perturbations that occurred in the course of the storm. The latitudinal distribution of perturbations in the strength of all geomagnetic field components on the disturbed days and the days used as a quiet-time reference period for the Western and Eastern hemispheres is presented in Tables 3 and 4.
Table 3 shows that the geomagnetic field components usually exhibited variations smaller than 40–50 nT on the days used as a quiet-time reference period. In the course of the severe geomagnetic storm, the geomagnetic field strength was observed to increase by a factor of 2–10, attaining 100–200 nT at low-latitude stations and 300–700 nT at high-latitude stations. Table 4 shows that the middle- and low-latitude stations in the Eastern Hemisphere recorded geomagnetic field fluctuations that generally did not exceed 10–20 nT on the quiet days, whereas the storm time fluctuations exhibited an increase by a factor of 2–5, attaining 70–80 nT; however, at high-latitude stations, the fluctuations were close to 500–600 nT. As expected, the magnitude of variations in the geomagnetic field increased with latitude, the variations in the strength of all component recorded at the stations nearly equidistant from the Equator were close in value, and the geomagnetic field perturbations were also close in value at close latitudes in the Western and Eastern hemispheres.
The northward component of the geomagnetic field, X, usually showed the greatest perturbations in strength in both hemispheres. The total durations of the disturbances were observed to be 26–30 h. Thus, the geomagnetic storm, the strongest in solar cycle 25, being a part of the geospace storm, established the state of space weather on a global scale over 23–24 April 2023.
Geomagnetic field variations are produced by changing electric currents. Currents relevant to geomagnetic storms comprise the magnetopause electric current flowing eastward near the equatorial plane, the westward current through the magnetospheric tail and equatorial ring current within three to six Earth radii from the Earth, and the ionospheric currents in high-latitude ionosphere.
During substorms, the electric current in the near tail can partially be diverted into the polar ionosphere along the geomagnetic field lines closing the electric current through the substorm current wedge. As a result, the westward equatorial electric current diminishes, which should be manifested by an increase in the horizontal component of the geomagnetic field at the Equator, and the westward ionospheric current increases at high latitudes, which is observed as an increase in the horizontal intensity, H, of the geomagnetic field. The magnetic effect on the surface of the Earth from the ionospheric currents significantly surpasses that from the tail current due to the proximity of the ionosphere to the ground magnetometer stations.
As it happened, in the observations discussed in this paper, one of the two magnetometer chains was situated in the night hemisphere of the Earth during both of the two steps of the 23–24 April 2023 geomagnetic storm. However, the anticipated manifestations of the substorm current wedge can be easily seen only during the second step of the 23–24 April 2023 geomagnetic storm along the Western Hemisphere chain of magnetometer stations, where the storm was observed during night. The H components acquired at the equatorial latitude station TTB (geomagnetic latitude 7.15° N) and the high-geomagnetic-latitude OTT (geomagnetic latitude 54.28° N) station are shown in the top panel of Fig. 3. Just before 04:00 UT, a partial diversion of the ring or tail current into the ionosphere through field-aligned currents occurred and yielded an increase in the intensity of the horizontal intensity, H, of the geomagnetic field at the TTB station and a simultaneous decrease in H at the high-latitude OTT station. In the Southern Hemisphere, the northern component is also positive (Kepko et al., 2015), as can be seen in the magnetogram acquired at AIA station (Fig. 3, bottom panel).
Processes analogous to those reported above are not observed during the first step of the 23–24 April 2023 geomagnetic storm along the Eastern Hemisphere chain of magnetometer stations, where the first step of the storm was observed during night. As described in the Introduction section, the strength of the interplanetary magnetic field Bz component attained ∼ −22 nT during the first step and ∼ −30 nT during the second step of the severe geomagnetic storm (Ghag et al., 2024, ). Thus, these observations indicate that there is a Bz threshold for diverting the cross-tail current through the current wedge into the ionosphere. For the 23–24 April 2023 geomagnetic storm, a threshold value is between −22 and −30 nT.
Generally, the diversion of cross-tail current into the ionosphere is dependent on initial conditions, precondition, and memory or complexity of the magnetosphere-ionosphere system (CEDAR: The New Dimension, https://cedarscience.org/sites/default/files/2021-10/CEDAR_October_V9.2.pdf, last access: 19 December 2024). Since the state of the magnetosphere system continuously evolves, the data on one-step geospace storms occurring separately are not suitable for comparison. To make the influence of such uncertainties minimal, the need to deal with two storms occurring as close as possible to each other arises, which makes a two-step geospace storm a solar–terrestrial event of opportunity for realizing a technique for estimating the IMF Bz threshold for the formation of the substorm current wedge.
Future studies on this topic are no doubt needed to confirm our conclusions, and they include the validation of features discovered in this study, the determination of thresholds for other storms, and the modeling of the formation of the current wedge.
The results obtained are of importance for both achieving the fundamental physical understanding and a quantitative assessment of energy storage in the ionosphere–magnetosphere system and its release via a partial diversion of the ring or tail current into the ionosphere through field-aligned currents (CEDAR: The New Dimension, https://cedarscience.org/sites/default/files/2021-10/CEDAR_October_V9.2.pdf, last access: 15 October 2024, 2010). The ionospheric perturbations produced by the energy release can also be of importance to radio communications, including HF radio communications (Wang et al., 2022; Wang et al., 2023).
The intercomparisons of the geomagnetic field variations recorded at two near-meridional chains of magnetometer stations in the Western and Eastern hemispheres yield the following results:
-
Part of the near-Earth cross-tail current closed itself via the ionosphere, to which it was linked by the substorm current wedge, and manifested itself in the magnetograms acquired at equatorial and high-latitude stations on the night side of the Earth.
-
This study identifies, for the first time, that the emergence of a current wedge may be quantified by a threshold value of the interplanetary magnetic field (IMF) Bz component utilizing observations made during a two-step geospace storm with ground-based magnetometers.
-
The two-step character of this storm has allowed the author to identify that the Bz interplanetary magnetic field component threshold for the formation of the substorm current wedge is within the −(22–30) nT interval.
-
The study, for the first time, convincingly attests to the two-step geospace storm being the best possible solar–terrestrial event of opportunity for realizing a technique for estimating the IMF Bz component threshold for the formation of the substorm current wedge.
-
Under quiet conditions, the geomagnetic field components usually exhibited variations not exceeding 40–50 nT in the Western Hemisphere and 10–20 nT in the Eastern Hemisphere.
-
During the severe geomagnetic disturbance of 23–24 April 2023, the strength fluctuations increased by a factor of 2–10 and 2–5 in the Western and Eastern hemispheres, respectively, attaining 300–700 nT.
-
The northward component of the geomagnetic field, X, was observed to be most disturbed in the Western and Eastern hemispheres. The total durations of the disturbances were observed to be 26–30 h.
-
The geomagnetic field components showed variations in the strength increasing with latitude. The strength fluctuations recorded at the stations nearly equidistant from the Equator were close in value. This is true for both Western and Eastern hemispheres.
-
Also close in value were the perturbations in the strength recorded at the stations at close latitudes but in different hemispheres.
-
The first two-step severe geomagnetic storm in solar cycle 25 to date as a component of the geospace storm significantly affected the state of space weather on a global scale on 23–24 April 2023.
Analysis of temporal variations in the relative strength of the northward X, eastward Y, and vertical Z component of the geomagnetic field over the period of 20–26 April 2023 has been performed. The geospace storm occurred within the period of 23–24 April 2023, the data for which are shown against the background of a quiet-time noise recorded during 20–22 and 25–26 April 2023.
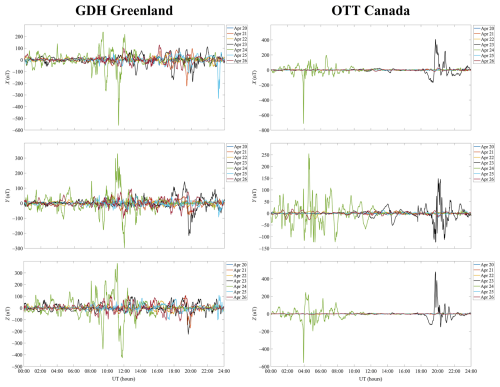
Figure A1Variations with universal time (UT) in the geomagnetic field at the GDH station (geographic coordinates 69.2520° N, 53.5330° W; geomagnetic coordinates 77.52° N, 32.69° E) and at the OTT station (geographic coordinates 45.4030° N, 75.552° W; geomagnetic coordinates 54.46° N, 3.51° W) over the period of 20–26 April 2023.
A1 Western Hemisphere
A1.1 GDH station
From 00:00 to 10:00 UT over the geomagnetically quiet interval of 20–22, 25, and 26 April 2023, the strength of the northward component of the geomagnetic field, X, showed fluctuations within ± 50 nT (Fig. A1), while between 10:00 and 18:00 UT, the strength fluctuations increased to 60–145 nT with the energy spectrum almost flat. On 23 April 2023, the variations in the X component developed into non-monotonous and even quasi-periodic changes between 10:00 and 24:00 UT, when the X-component strength varied from 120 to 180 nT. Considerable disturbances of up to −550 nT took place at around 11:15 UT on 24 April 2023, and only after 16:00 UT on 24 April 2023 did the level of fluctuations approach ± 50 nT. The recovery phase persisted during 25 and 26 April 2023.
Between 00:00 and 10:00 UT on 20–23 and 25 and 26 April 2023, the variations in the eastward component of the geomagnetic field, Y, were relatively insignificant, that is, up to 50 nT, while between 10:00 and 18:00 UT, they were observed to reach up to ± 100 nT. The variations in the Y component showed non-monotonousness and, at times, quasi-periodicity over a span of 14 h from 10:00 to 24:00 UT on 23 April 2023, with a drop in the strength down to −220 nT after 19:30 UT. From 11:00 to 12:00 UT on 24 April 2023, the strength varied from 340 to −300 nT.
On 20–23 and 25 and 26 April 2023, the variations in the vertical component of the geomagnetic field, Z, strength were quite smooth and within ± 100 nT from 00:00 to 08:00 UT, while after 10:00 UT and towards the end of the day, the variations enhanced, with a peak-to-peak amplitude attaining 340 nT. Between 00:00 and 14:00 UT on 23 April 2023, the Z component showed significant fluctuations in strength, with a peak-to-peak amplitude of 150 nT and a maximum of 100 nT. During the period from 12:00 UT on 23 April 2023 to 14:00 UT on 24 April 2023, the strength variations exhibited non-monotonousness and, at times, quasi-periodicity. At about 20:00 UT on 23 April 2023, the strength reached −230 nT. After 09:00 UT on 24 April 2023, the strength varied from 380 to −430 nT, which was recorded between about 11:00 and 12:00 UT.
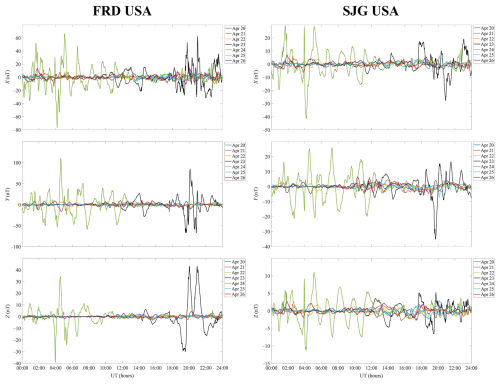
Figure A2Variations with universal time (UT) in the geomagnetic field at the FRD station (geographic coordinates 38.2100° N, 77.3670° W; geomagnetic coordinates 47.25° N, 5.47° W) and at the SJG station (geographic coordinates 18.1100° N, 66.1500° W; geomagnetic coordinates 27.20° N, 6.96° E) over the period of 20–26 April 2023.
A1.2 OTT station
On the days used as a quiet-time reference period, the variations in the strength of the northward component of the geomagnetic field, X, rarely exceeded ± 20 nT (Fig. A1). On 23 April 2023, sharp increases of up to 250–420 nT in the strength of the X component were observed from 19:30 to 22:00 UT, and from 21:00 to 22:30 UT, the X-component strength decreased approximately to −100 nT. Between 03:00 and 09:30 UT on 24 April 2023, the magnetic field strength fluctuated mainly from −100 to 200 nT, and only at 03:55 UT did it briefly drop to −710 nT. Immediately after 14:00 UT on 24 April 2023, the variations in the X-component strength became smaller than a few tens of nanoteslas.
Monotonous variations in the strength of the eastward component of the geomagnetic field, Y, did not exceed ± 30 nT during geomagnetically quiet times, whereas over the period from 10:00 UT on 23 April 2023 to 13:00 UT on 24 April 2023, the Y component exhibited large fluctuations in strength from −125 to 257 nT.
During magnetically quiet times, the vertical component of the geomagnetic field, Z, strength showed quite smooth variations, the amplitude of which was smaller than a few tens of nanoteslas. During the period from 19:00 UT on 23 April 2023 to 10:00 UT on 24 April 2023, the Z component fluctuated wildly, first from −140 to 490 nT near 19:40 UT on 23 April 2023, then within ± 80 nT after 00:00 UT, and then it decreased to −560 nT at around 03:55 UT on 24 April 2023.
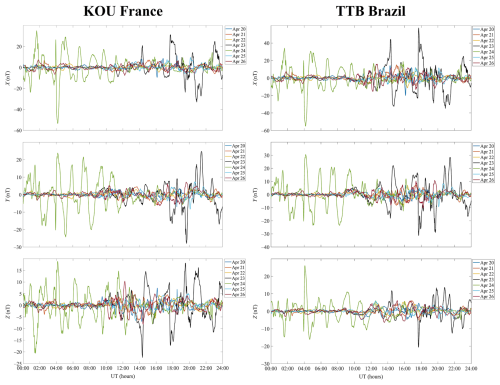
Figure A3Variations with universal time (UT) in the geomagnetic field at the KOU station (geographic coordinates 5.2100° N, 52.730° W; geomagnetic coordinates 13.87° N, 20.46° E) and at the TTB station (geographic coordinates 1.2050° S, 48.5130° W; geomagnetic coordinates 7.25° N, 24.35° E) over the period of 20–26 April 2023.
A1.3 FRD station
The variations in the northward component of the geomagnetic field, X, did not exceed 10–15 nT during magnetically quiet times (Fig. A2), while between about 10:00 UT on 23 April 2023 and 12:00 UT on 24 April 2023, its variations showed non-monotonousness and an increase in X- component strength that occurred over the interval from 19:45 to 23:35 UT. The X component exhibited fluctuations within −52 to 67 nT on 24 April 2023, with a minimum of −76 nT at about 04:10 UT; after about 12:00 UT, significant variations ceased.
During magnetically quiet times, the variations in the strength of the eastward component of the geomagnetic field, Y, were smaller than ± 20 nT, including the disturbance daily variation. During a period from 10:00 UT on 23 April 2023 to 13:00 UT on 24 April 2023, the strength fluctuations were large, with a minimum of −70 nT that occurred between 19:30 and 21:00 UT on 23 April 2023. An increase in the strength within −60 to 115 nT was observed to occur between 02:00 and 12:00 UT on 24 April 2023.
Over a span of magnetically quiet times, the vertical component of the geomagnetic field, Z, strength, which was weakly fluctuating, changed its magnitude by less than 5 nT. The noticeable variations in its magnitude began at around 14:00 UT on 23 April 2023 and ended at about 12:00 UT on 24 April 2023, with maximums of ∼ 44 nT observed at around 20:00 and 21:00 UT on 23 April 2023 and a minimum of −39 nT at about 04:00 UT on 24 April 2023.
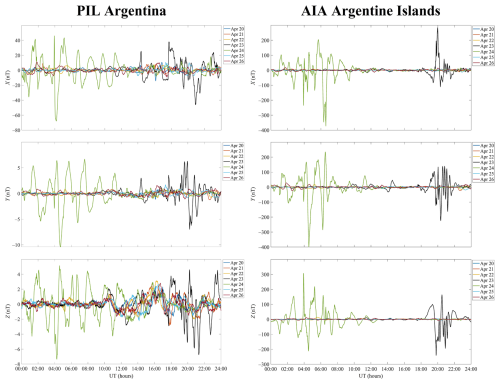
Figure A4Variations with universal time (UT) in the geomagnetic field at the PIL station (geographic coordinates 31.6670° S, 63.881° W; geomagnetic coordinates 22.33° S, 8.08° E) and at the AIA station (geographic coordinates 65.2450° S, 64.2580° W; geomagnetic coordinates −55.91°, +6.30°) over the period of 20–26 April 2023.
A1.4 SJG station
During magnetically quiet times, the fluctuations in strength of the northward component of the geomagnetic field, X, were smaller than ± 7 nT (Fig. A2). The noticeable variations in strength began at around 11:00 UT on 23 April 2023 and were over past 14:00 UT on 24 April 2023, with minimums of about −28 nT at approximately 20:50 UT on 23 April 2023 and of about −42 nT at around 04:10 UT on 24 April 2023 and with maximums of 30 nT at about 01:30 and 05:00 UT on 24 April 2023.
The strength of eastward component of the geomagnetic field, Y, showed insignificant variations of ∼ 7 nT, before 10:00 UT on 20–23 and 25 and 26 April 2023, while between 10:00 UT on 23 April 2023 and 14:00 UT on 24 April 2023, the Y-component strength exhibited non-monotonous and significant disturbances, with a minimum of about −35 nT at 19:40 UT on 23 April 2023 and a maximum of about 26 nT at 07:15 UT on 24 April 2023.
During magnetically quiet times, the strength of the vertical component of the geomagnetic field, Z,showed variations smaller than ± 3 nT. The non-monotonous and significant fluctuations in the strength of this component were observed to occur starting at 12:00 UT on 23 April 2023 and ending at 14:00 UT on 24 April 2023, with a minimum of about −11.5 nT and a maximum of about 11.5 nT.
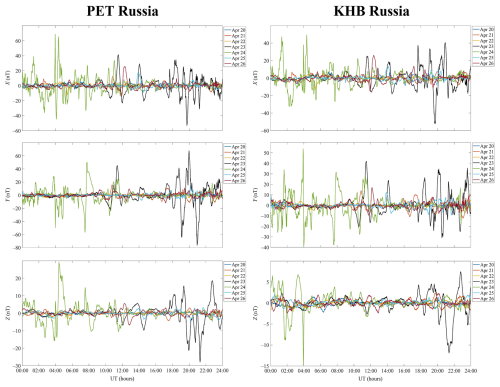
Figure A5Variations with universal time (UT) in the geomagnetic field at the PET station (geographic coordinates 52.9710° N, 158.2480° E; geomagnetic coordinates +46.63, +222.93) and at the KHB station (geographic coordinates 47.61° N, 134.68° E; geomagnetic coordinates 39.05° N, 156.42° W) over the period of 20–26 April 2023.
A1.5 KOU station
During magnetically quiet times as well as until 14:00 UT on 23 April 2023, the variations in the strength of the northward component of the geomagnetic field, X, were smaller than ± 10 nT (Fig. A3). Over the period from 11:00 UT on 23 April 2023 to 16:00 UT on 24 April 2023, the X component showed significant enhancements in its variations that become non-monotonous, with a maximum of 35 nT at 21:00 UT on 23 April 2023 and a minimum of −53 nT at 04:10 UT on 24 April 2023.
During the quiet-time reference period, the eastward component of the geomagnetic field, Y, exhibited variations attaining ± 8 nT, whereas its strength considerably decreased to −27 nT at 19:40 UT on 23 April 2023, after which it increased to 52 nT at 21:30 UT. Between 00:00 and 12:00 UT on 24 April 2023, the Y component showed large non-monotonous fluctuations in strength, attaining ± 25 nT.
The vertical component of the geomagnetic field, Z, showed strength fluctuations usually smaller than ± (5–7) nT, while significant time variations in strength persisted for the period from 10:00 UT on 23 April to 16:00 UT on 24 April 2023, with a minimum of about −22.5 nT at around 14:20 UT on 23 April 2023 and a maximum of ∼ 18 nT at approximately 19:30 UT on the same day. During the course of the day 24 April 2023, the Z component exhibited variations within −21 to 19 nT.
A1.6 TTB station
On quiet-time reference days, the northward component of the geomagnetic field, X, showed variations smaller than ± 20 nT (Fig. A3), which developed into non-monotonous and significant variations over a span of time between ∼ 10:00 UT on 23 April 2023 and ∼ 16:00 UT on 24 April 2023. The field strength had minimums of −35 and −55 nT at ∼ 21:00 UT on 23 April 2023 and at 04:10 UT on 24 April 2023, respectively, and a maximum of 57 nT at 17:40 UT on 23 April 2023.
The quiet-time eastward component of the geomagnetic field, Y, strength usually exhibited variations smaller than ± 10 nT, whereas on 23 April 2023 a minimum strength of −31 nT was recorded at ∼ 17:45 UT and a maximum of about 29 nT at 21:35 UT on 23 April 2023. The significant variations in the Y component persisted through to 18:00 UT on 24 April 2023, with a maximum of 30 nT at 04:10 UT on 24 April 2023.
During magnetically quiet times, the vertical component of the geomagnetic field, Z, exhibited variations within ± 7 nT. Approximately from 12:00 UT on 23 April 2023 to 19:00 UT on 24 April 2023, this component showed fluctuations in strength from −20 to 26 nT.
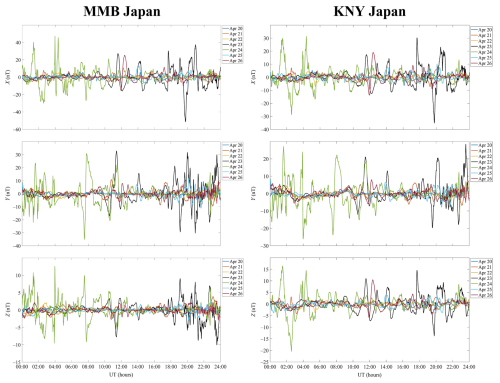
Figure A6Variations with universal time (UT) in the geomagnetic field at the MMB station (geographic coordinates 43.91° N, 144.19° E; geomagnetic coordinates 36.09° N, 147.57° W) and at the KNY station (geographic coordinates 31.42° N, 130.88° E; geomagnetic coordinates 22.70° N, 158.28° W) over the period of 20–26 April 2023.
A1.7 PIL station
On quiet-time reference days, the northward component of the geomagnetic field, X, exhibited strength variability within ± 10 nT (Fig. A4), while it showed a significant increase in non-monotonous variations over the interval from 11:00 UT on 23 April 2023 to 14:00 UT on 24 April 2023. The positive spikes of 37 and 47 nT were observed to occur at 17:40 UT on 23 April 2023 and at ∼ 04:00 UT on 24 April 2023, respectively, while the negative spikes of −47 and −68 nT occurred at 21:00 UT on 23 April 2023 and at 04:10 UT on 24 April 2023, respectively.
The strength of the eastward component of the geomagnetic field, Y, showed variability within a few nanoteslas under quiet-time conditions, while from 12:00 UT on 23 April 2023 to 16:00 UT on 24 April 2023, the variations in this component became non-monotonous and significant, with spike strengths attaining 6.5 nT and alternating decrease strengths reaching −7 nT over the interval from 19:00 to 20:00 UT on 23 April 2023 and a drop of −10.5 nT at approximately 04:40 UT on 24 April 2023.
During magnetically quiet times, the vertical component of the geomagnetic field, Z, showed variations smaller than a few nanoteslas, whereas it exhibited considerable and sharp variations from 10:00 UT on 23 April 2023 to 16:00 UT on 24 April 2023. The Z-component strength fell to −7.3 nT at approximately 04:10 UT on 24 April 2023, while its magnitude was close to 3 nT at about 16:00 UT.
A1.8 AIA station
On quiet-time reference days, the northward component of the geomagnetic field, X, exhibited strengths rarely exceeding ± 20 nT (Fig. A4). Considerable and sharp variations in this component's strength began at around 18:00 UT on 23 April 2023 and continued until 12:00 UT on 24 April 2023. During 23 April 2023, the X-component strength was observed to vary from −100 to 290 nT, while it showed greater variability on 24 April 2023 when the strength varied from −380 to 200 nT.
The quiet-time strength of the eastward component of the geomagnetic field, Y, showed variability within ± 30 nT. The significant and sharp variations in the Y component began at 13:00 UT on 23 April 2023 and persisted for 24 h. On 23 April 2023, the Y component showed strength fluctuations from −230 to 150 nT, which increased from −400 to 240 nT on 24 April 2023.
Under quiet-time conditions, the vertical component of the geomagnetic field, Z, exhibited fluctuations in strength smaller than ± 20 nT. From 18:00 UT on 23 April 2023 to 13:00 UT on 24 April 2023, the strength variations were sharp and significant. The Z component showed strength variations within −250 to 170 nT on 23 April 2023 and within −215 to 300 nT on 24 April 2023.
A2 Eastern Hemisphere
A2.1 PET station
On quiet-time reference days, the northward component of the geomagnetic field, X, exhibited moderate variability within ± 10 nT (Fig. A5). Considerable and sharp strength variations began after 10:30 UT on 23 April 2023 and persisted past 11:30 UT on 24 April 2023, with the strength fluctuating within −55 to 43 nT on 23 April 2023 and from −45 to 70 nT on 24 April 2023.
The variations in the quiet-time strength of the eastward component of the geomagnetic field, Y, strength variations were smaller than ± 15 nT. The amplitude fluctuations considerably increased past 10:00 UT on 23 April 2023 and persisted until 12:00 UT on 24 April 2023. In the course of the first day, the amplitude fluctuations in strength occurred within −77 to 70 nT, while they occurred at a lower strength level, from −57 to 50 nT, on the second day.
During the quiet-time reference period, the vertical component of the geomagnetic field, Z, showed fluctuations in strength, with amplitudes varying from about −7 to 6 nT. The fluctuations notably increased after 10:00 UT on 23 April 2023 and continued until 13:00 UT on 24 April 2023. On 23 April 2023, the Z component exhibited variations in strength from −28 to 18 nT, while it showed variations from −15 to 29 nT the next day.
A2.2 KHB station
On quiet-time reference days, the strength of the northward component of the geomagnetic field, X, showed variations generally not exceeding ± 10 nT (Fig. A5). The pronounced enhancements in sharp variations in the X-component strength began after about 11:00 UT on 23 April 2023 and continued until 16:00 UT on 24 April 2023. On 23 April 2023, the X-component strength exhibited variations within −50 to 40 nT, and it showed variations from −30 to 50 nT on 24 April 2023.
The variations in the quiet-time eastward component of the geomagnetic field, Y, were observed to occur mainly within ± 10 nT, rarely attaining 20 nT. The amplitude fluctuations showed a noticeable increase after 10:00 UT on 23 April 2023, with the disturbance continuing through to 14:00 UT on 24 April 2023. On the first day, the Y component showed fluctuations from −30 to 43 nT and on the second day within −39 to 54 nT.
The vertical component of the geomagnetic field, Z, exhibited insignificant temporal variability within ± 2 nT on the days used as a quiet-time reference period, whereas the strength was observed to increase to 7.5–12 nT on 23 April 2023. On 24 April 2023, the component showed strength fluctuations within −14.5 to 7 nT. In total, the enhanced fluctuations persisted for about 26 h.
A2.3 MMB station
The strengths of the northward component of the geomagnetic field, X, showed quiet-time variations generally smaller than ± 20 nT, but most frequently, they were confined to ± 10 nT (Fig. A6). Enhanced variations in the X-component strength began before 10:00 UT on 23 April 2023 and continued through to 12:00 UT on 24 April 2023, with the strength of this component changing from −50 to 40–47 nT.
The quiet-time variations in the strength of the eastward component of the geomagnetic field, Y, reached ± 10 nT. Significant variations in the Y-component strength began at about 10:00 UT on 23 April 2023 and continued through to about 13:00 UT on 24 April 2023, with the variations in this component strength not exceeding ± 35 nT on the first day and showing temporal variability within ± (30–35) nT on the second day.
On the days used as a quiet-time reference period, the strength of the vertical component of the geomagnetic field, Z, exhibited temporal variability within a few nanoteslas, whereas they noticeably increased at ∼ 10:00 UT on 23 April 2023 and persisted until 13:00 UT on 24 April 2023, with fluctuations attaining ± (10–12.5) nT.
A2.4 KNY station
The northward component of the geomagnetic field, X, generally exhibited variations in strength smaller than ± 10 nT (Fig. A6). The strength fluctuations showed a sharp increase after 10:00 UT on 23 April 2023 and continued to 16:00 UT on 24 April 2023. On 23 April 2023, the strength exhibited variations within −35 to 31 nT, and within −28 to 32 nT the following day.
The quiet-time variations in the strength of the eastward component of the geomagnetic field, Y, occurred within ± 8 nT. After 10:30 UT on 23 April 2023, the strength fluctuations increased from −12 to 28 nT. The next day, this component strength exhibited temporal variability within −26 to 27 nT.
On the quiet-time reference days, the vertical component of the geomagnetic field, Z, showed variations in strength from −6 to 11 nT. The strength variations exhibited a noticeable increase after 10:00 UT on 23 April 2023 and continued through to about 16:00 UT on 24 April 2023, with the fluctuations within ± 20 nT.
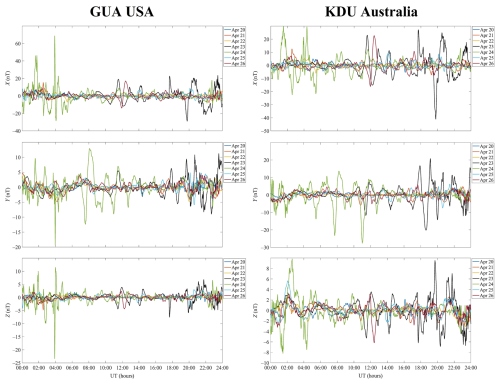
Figure A7Variations with universal time (UT) in the geomagnetic field at the GUA station (geographic coordinates 13.59° N, 144.87° E; geomagnetic coordinates 6.10° N, 143.44° W) and at the KDU station (geographic coordinates 12.69° S, 132.47° E; geomagnetic coordinates 20.96° S, 153.66° W) over the period of 20–26 April 2023.
A2.5 GUA station
The quiet-time variations in the northward component of the geomagnetic field, X, generally did not exceed 7–8 nT (Fig. A7). Enhanced strength fluctuations were observed to occur over the interval from 10:00 UT on 23 April 2023 to 06:00 UT on 24 April 2023. On 23 and 24 April 2023, the strength of this component varied from −30 to 47 nT and occasionally to 70 nT.
The eastward component of the geomagnetic field, Y, exhibited fluctuations in strength within ± 5 nT on the days used as a quiet-time reference period. Enhancements in the strength fluctuations occurred over the interval from 10:00 UT on 23 April 2023 to 14:00 UT on 24 April 2023. On the first day, the strength of this component varied from −8 to 12 nT, and on the second day, it varied within −12 to 13 nT. A brief ∼ 19 nT drop in the strength of this component was seen at around 04:00 UT on 24 April 2023.
The vertical component generally exhibited variations in the strength smaller than a few nanoteslas. Noticeable increases in the variations in the strength of this component were observed to occur over the interval from 10:00 UT on 23 April 2023 to 05:00 UT on 24 April 2023. On 23 April 2023, the Z-component strength fluctuations occurred within ± 7 nT, while the following day, they exhibited variations within −10 to 12 nT, with a brief decrease by 23 nT at about 04:00 UT.
A2.6 KDU station
On the days used as a quiet-time reference period, the variations in the strength of the northward component of the geomagnetic field, X, were observed to occur within ± 6 nT (Fig. A7). On 23 April 2023, the fluctuations in strength occurred within −42 to 28 nT from 10:00 to 24:00 UT. From 00:00 to 12:00 UT the next day, the X component exhibited variations within −23 to 30 nT.
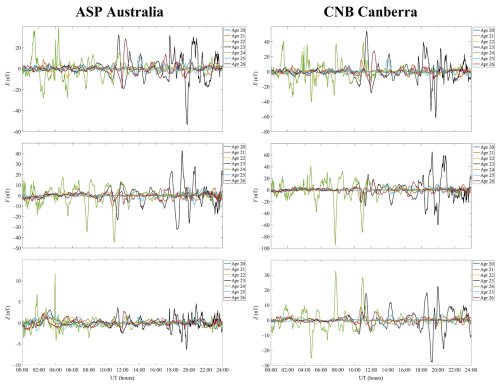
Figure A8Variations with universal time (UT) in the geomagnetic field at the ASP station (geographic coordinates 23.76° S, 133.88° E; geomagnetic coordinates 31.83° S, 151.20° W) and at the CNB station (geographic coordinates 35.32° S, 149.36° E; geomagnetic coordinates 41.75° S, 132.81° W) over the period of 20–26 April 2023.
The strength of the eastward component of the geomagnetic field, Y, was observed to fluctuate within about −7 to 6 nT on the quiet days. From 10:00 to 24:00 UT on 23 April 2023, the level of strength fluctuations enhanced to ± 20 nT. The following day, the Y-component strength showed variations within −27 to 15 nT over the interval from 00:00 to 13:00 UT.
Generally, the vertical component of the geomagnetic field, Z, showed variations in strength smaller than ± 3 nT. Over the interval from 10:00 UT on 23 April 2023 to 05:00 UT on 24 April 2023, a noticeable increase in the level of strength fluctuations was recorded of down to −8 nT and up to ∼ 10 nT.
A2.7 ASP station
The northward component of the geomagnetic field, X, showed a quiet-time variability of strength mainly within ± (3–10) nT (Fig. A8). The enhancement in strength fluctuations with a peak-to-peak amplitude of −53 to 32 nT was observed to occur between 10:00 and 24:00 UT on 23 April 2023, while between 00:00 and 06:00 UT the next day, the X-component strength exhibited temporal variability within −28 to 39 nT.
During quiet days, the eastward component of the geomagnetic field, Y, exhibited strength variations smaller than ± 10 nT, which then significantly enhanced beginning at about 10:00 UT on 23 April 2023 and persisted until 13:00 UT on 24 April 2023. On the first day, the level of strength fluctuations was found to be between −33 and 43 nT, while on the second day, it varied from −44 to 15 nT.
On the days used as a quiet-time reference period, the vertical component of the geomagnetic field, Z, exhibited temporal variability within ± 3 nT. From 10:00 to 24:00 UT on 23 April 2023, the Z component showed an increase in strength fluctuations from −6.5 to 5 nT, while on the following day, it exhibited fluctuations from −5 to 12 nT.
A2.8 CNB station
On the quiet days, the northward component of the geomagnetic field, X, showed variations in strength mainly from −10 to 10 nT (Fig. A8). Significant enhancements in strength began at around 10:00 UT on 23 April 2023 and continued through to 12:00 UT on 24 April 2023. The strength of this component was observed to vary from −62 to 55 nT on the first day and within ± 40 nT from 00:00 to 12:00 UT on the second day.
On the days used as a quiet-time reference period, the eastward component of the geomagnetic field, Y, showed strength fluctuations not exceeding ± 20 nT. Between 10:00 and 24:00 UT on 23 April 2023, the Y component exhibited variations in strength from −60 to 64 nT and during the interval from 00:00 to 12:00 UT on 24 April 2023 from −95 to 43 nT.
The vertical component of the geomagnetic field, Z, showed quiet-time variations in strength smaller than ± 8 nT. Considerable enhancements in sharp variations in the strength of this component began at about 10:00 UT on 23 April 2023 and persisted until 12:00 UT on 24 April 2023, with the Z-component strength varying from −28 to 33 nT.
A2.9 MCQ station
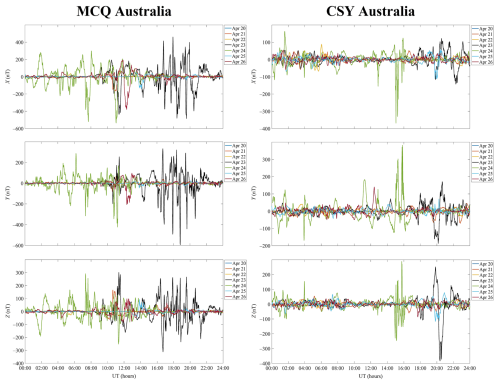
On the quiet days, the northward component of the geomagnetic field, X, was observed to vary from −40 to 70 nT (Fig. A9), with the exception of a decrease by 380 nT and an increase by 200 nT in strength at around 12:00 UT on 26 April 2023 as well as decreases by 160 and 120 nT at around 11:00 and 14:00 UT on 21 and 25 April 2023, respectively. Significant and sharp increases in amplitude and frequency fluctuations began at 10:00 UT on 23 April 2023 and stopped at around 12:00 UT on 24 April 2023, with the strength fluctuating within −530 to 470 nT.
On the days used as a quiet-time reference period, the eastward component of the geomagnetic field, Y, showed variations in strength smaller than 30–40 nT, with the exception of a drop of about 200 nT that followed an increase by 100 nT near 12:00 UT on 26 April 2023. A significant rise in amplitude and frequency fluctuations was observed to occur after 10:00 UT on 23 April 2023 and continued until 12:00 UT on 24 April 2023, when the Y-component strength varied from −600 to 340 nT.
Over the intervals from 12:00 to 14:30 UT on 25 and 26 April 2023, the strength of the vertical component of the geomagnetic field, Z, exhibited variability within −80 to 100 nT. On 21 April 2023, the strength reached 160 nT. In the course of all other quiet days, this component showed variations not exceeding a few tens of nanoteslas. From 10:00 UT on 23 April 2023 to 12:00 UT on 24 April, the Z component exhibited a sharp increase in temporal variability and the level of strength fluctuations. The strength variations reached ± 320 nT.
A2.10 CSY station
The northward component of the geomagnetic field, X, exhibited strength fluctuations generally smaller than ± 50 nT on the days used as a quiet-time reference period (Fig. A9). Sporadically, they reached ± 100 nT. Significant variations began after 17:00 UT on 23 April 2023 and persisted for about 24 h. On 23 April 2023, the strength of this component showed a decrease to −150 nT and increases to 100–110 nT. On the morning of 24 April 2023, the strength of this component showed variations within −100 to 160 nT. On the days used as a quiet-time reference period, the eastward component of the geomagnetic field, Y, showed variations usually not exceeding ± (30–40) nT, whereas the strength fluctuations reached ± 180 nT during the storm.
The vertical component of the geomagnetic field, Z, seldom exhibited variations in excess of 50 nT, with the greatest variations (−380 to 260 nT) seen on 23 April 2023.
The particular attention should be given to significant variations of up to 300–380 nT that were recorded in all components from 12:40 to 16:00 UT on 24 April 2023. During this UT interval, the X, Y, and Z components exhibited strength fluctuations within −380 to 120, −130 to 380, and −250 to 290 nT, respectively.
The data sets discussed in this paper are freely accessible on the internet at https://imag-data.bgs.ac.uk/GIN_V1/GINForms2 (INTERMAGNET, 2024).
The contact author has declared that none of the authors has any competing interests.
Publisher's note: Copernicus Publications remains neutral with regard to jurisdictional claims made in the text, published maps, institutional affiliations, or any other geographical representation in this paper. While Copernicus Publications makes every effort to include appropriate place names, the final responsibility lies with the authors.
The results presented in this paper rely on data collected at magnetic observatories. We thank the national institutes that support them and INTERMAGNET for promoting high standards of magnetic observatory practice (https://www.intermagnet.org, last access: 19 December 2024). The solar wind parameters have been retrieved from the Goddard Space Flight Center Space Physics Data Facility (https://omniweb.gsfc.nasa.gov/form/dx1.html, last access: 19 December 2024). This research also draws upon data provided by the World Data Center for Geomagnetism, Kyoto (data are retrieved from http://wdc.kugi.kyoto-u.ac.jp, last access: 19 December 2024). Special thanks are due to Victor T. Rozumenko at V. N. Karazin Kharkiv National University, who provided useful comments on the contents of this paper. The author is grateful to his students Mykyta B. Shevelev and Yugene H. Zhdanko for their assistance with preparing this paper.
This research has been supported by the Ministry of Education and Science of Ukraine (grant nos. 0121U109881 and 0122U001476).
This paper was edited by Christos Katsavrias and reviewed by two anonymous referees.
Abe, O. E., Fakomiti, M. O., Igboama, W. N., Akinola, O. O., Ogunmodimu, O., and Migoya-Orué, Y. O.: Statistical analysis of the occurrence rate of geomagnetic storms during solar cycles 20–24, Adv. Space Res., 71, 2240–2251, https://doi.org/10.1016/j.asr.2022.10.033, 2023.
Al Shidi, Q., Pulkkinen, T., Toth, G., Brenner, A., Zou, S., and Gjerloev, J.: A large simulation set of geomagnetic storms–Can simulations predict ground magnetometer station observations of magnetic field perturbations?, Space Weather, 20, e2022SW003049, https://doi.org/10.1029/2022SW003049, 2022.
Bothmer, V. and Daglis, I.: Space Weather: Physics and Effects, Springer-Verlag, New York, https://doi.org/10.1007/978-3-540-34578-7, 2006.
Buonsanto, M.: Ionospheric storms – A review, Space Sci. Rev., 88, 563–601, https://doi.org/10.1023/A:1005107532631, 1999.
CEDAR: The New Dimension, https://cedarscience.org/sites/default/files/2021-10/CEDAR_October_V9.2.pdf (last access: 15 October 2024), 2010.
Chernogor, L. F.: Physics of geospace storms, Space Science and Technology, 27, 3–77, https://doi.org/10.15407/knit2021.01.003, 2021a.
Chernogor, L. F.: Statistical Characteristics of Geomagnetic Storms in the 24th Cycle of Solar Activity, Kinemat. Phys. Celest.+, 37, 193–199, https://doi.org/10.3103/S0884591321040048, 2021b.
Chernogor, L. F. and Domnin, I. F.: Physics of geospace storms, V. N. Karazin Kharkiv National University Publ., Kharkiv, 2014.
Chernogor, L. F. and Shevelev, M. B.: Latitudinal dependence of quasi-periodic variations in the geomagnetic field during the greatest geospace storm of September 7–9, 2017, Space Sci. Technol., 26, 72–83, https://doi.org/10.15407/knit2020.02.072, 2020.
Chernogor, L. F., Grigorenko, Ye. I., Lysenko, V. N., and Taran, V. I.: Dynamic processes in the ionosphere during magnetic storms from the Kharkov incoherent scatter radar observations, Int. J. Geomagn. Aeron., 7, GI3001, 2007.
Chernogor, L. F., Garmash, K. P., Guo, Q., and Zheng, Y.: Effects of the Strong Ionospheric Storm of August 26, 2018: Results of Multipath Radiophysical Monitoring, Geomagn. Aeronomy+, 61, 73–91, https://doi.org/10.1134/S001679322006002X, 2021.
Daglis, I. A.: Space Storms and Space Weather Hazards, Springer Dordrecht, New York, https://www.springer.com/gp/book/9781402000300 (last access: 19 December 2024), 2001.
Danilov, A. D. and Laštovička, J.: Effects of geomagnetic storms on the ionosphere and atmosphere, Int. J. Geomagn. Aeron., 2, 209–224, https://elpub.wdcb.ru/journals/ijga/v02/gai99312/gai99312.htm (last access: 19 December 2024), 2001.
De Abreu, A. J., Correia, E., De Jesus, R., Venkatesh, K., Macho, E. P., and Roberto, M.: Statistical analysis on the ionospheric response over South American mid- and near high-latitudes during 70 intense geomagnetic storms occurred in the period of two decades, J. Atmos. Sol.-Terr. Phy., 245, 106060, https://doi.org/10.1016/j.jastp.2023.106060, 2023.
Fagundes, P. R., Tsali-Brown, V. Y., Pillat, V. G., Arcanjo, M. O., Venkatesh, K., and Habarulema, J. B.: Ionospheric storm due to solar Coronal mass ejection in September 2017 over the Brazilian and African longitudes, Adv. Space Res., 71, 46–66, https://doi.org/10.1016/j.asr.2022.07.040, 2023.
Fuller-Rowell, T. J., Codrescu, M. V., Roble, R. G., and Richmond, A. D.: How does the thermosphere and ionosphere react to a geomagnetic storm? Magnetic storms, in: Magnetic storms , Geoph. Monog. Series, edited by: Tsurutani B. T., Gonzalez W. D., Kamide Y., and Arballo J. K., American Geophysical Union, John Wiley & Sons, Inc., USA, https://doi.org/10.1029/GM098p0203, 98, 203–226, 1997.
Ghag, K., Raghav, A., Bhaskar, A., Soni, S. L., Sathe, B., Shaikh, Z., Dhamane, O., and Tari, P.: Quasi-planar ICME sheath: A cause of first two-step extreme geomagnetic storm of 25th solar cycle observed on 23 April 2023, Adv. Space Res., 73, 6288–6297, https://doi.org/10.1016/j.asr.2024.03.011, 2024.
Gonzalez, W. D., Jozelyn, J. A., Kamide, Y., Kroehl, H. W., Rostoker, G., Tsurutani, B. T., and Vasyliunas, V. M.: What is a geomagnetic storm? J. Geophys. Res., 99, 5771–5792, https://doi.org/10.1029/93JA02867, 1994.
Hsu, C.-T. and Pedatella, N. M.: Effects of forcing uncertainties on the thermospheric and ionospheric states during geomagnetic storm and quiet periods, Space Weather, 21, e2022SW003216, https://doi.org/10.1029/2022SW003216, 2023.
INTERMAGNET: INTERMAGNET Data Viewer, https://imag-data.bgs.ac.uk/GIN_V1/GINForms2, last access: 19 December 2024.
Kamide, Y. and Maltsev, Y. P.: Geomagnetic Storms, in: Handbook of the Solar-Terrestrial Environment, edited by: Kamide, Y. and Chian, A., Springer-Verlag, Berlin, Heidelberg, https://doi.org/10.1007/978-3-540-46315-3_14, 355–374, 2007.
Katsko, S. V., Emelyanov, L. Ya., and Chernogor, L. F.: Features of the Ionospheric Storm on December 21-24, 2016, Kinemat. Phys. Celest.+, 37, 85–95, https://doi.org/10.3103/S0884591321020045, 2021.
Kepko, L., McPherron, R. L., Amm, O., Apatenkov, S., Baumjohann, W., Birn, J., Lester, M., Nakamura, R., Pulkkinen, T. I., and Sergeev, V.: Substorm Current Wedge Revisited, Space Sci. Rev., 190, 1–46, https://doi.org/10.1007/s11214-014-0124-9, 2015.
Kleimenova, N. G., Kozyreva, O. V., Michnowski, S., and Kubicki, M.: Effect of magnetic storms in variations in the atmospheric electric field at midlatitudes, Geomagn. Aeronomy+, 48, 622–630, https://doi.org/10.1134/S0016793208050071, 2008.
Kleimenova, N. G., Kubicki, M., Odzimek, A., Malysheva, L. M., and Gromova L. I.: Effects of geomagnetic disturbances in daytime variations of the atmospheric electric field in polar regions, Geomagn. Aeronomy+, 57, 266–273, https://doi.org/10.1134/S0016793217030070, 2017.
Koskinen, H. E. J.: Physics of space storms. From Solar Surface to the Earth, Springer-Verlag, Berlin, Heidelberg, https://doi.org/10.1007/978-3-642-00319-6, 2011.
Laskar, F. I., Sutton, E. K., Lin, D., Greer, K. R., Aryal, S., and Cai, X.: Thermospheric temperature and density variability during 3–4 February 2022 minor geomagnetic storm, Space Weather, 21, e2022SW003349, https://doi.org/10.1029/2022SW003349, 2023.
Laštovička, J.: Effects of geomagnetic storms in the lower ionosphere, middle atmosphere and troposphere, J. Atmos. Terr. Phys., 58, 831–843, https://doi.org/10.1016/0021-9169(95)00106-9, 1996.
Lin, D., Wang, W., Merkin, V. G., Huang, C., Oppenheim, M., and Sorathia, K.: Origin of dawnside subauroral polarization streams during major geomagnetic storms, AGU Advances, 3, e2022AV000708, https://doi.org/10.1029/2022AV000708, 2022.
Luo, Y. and Chernogor, L. F.: Characteristic Features of the Magnetic and Ionospheric Storms on December 21–24, 2016, Kinemat. Phys. Celest.+, 38, 262–278, https://doi.org/10.3103/S0884591322050051, 2022.
Luo, Y., Chernogor, L., Garmash, K., Guo, Q., Rozumenko, V., and Zheng, Y.: Dynamic processes in the magnetic field and in the ionosphere during the 30 August–2 September 2019 geospace storm: influence on high frequency radio wave characteristics, Ann. Geophys., 39, 657–685, https://doi.org/10.5194/angeo-39-657-2021, 2021a.
Luo, Y., Guo, Q., Zheng, Y., Garmash, K. P., Chernogor, L. F., and Shulga, S. N.: Geospace storm effects on August 5–6, 2019, Space Science and Technology, 27, 45–69, https://doi.org/10.15407/knit2021.02.045, 2021b (in Ukrainian).
Luo, Y., Chernogor, L. F., and Garmash, K. P.: Magneto-Ionospheric Effects of the Geospace Storm of March 21–23, 2017, Kinemat. Phys. Celest.+, 38, 210–229, https://doi.org/10.3103/S0884591322040055, 2022.
Moldwin, M.: An introduction to space weather, 2nd edn., Cambridge University Press, Cambridge, https://doi.org/10.1017/9781108866538, 2022.
Oikonomou, C., Haralambous, H., Paul, A., Ray, S., Alfonsi, L., Cesaroni, C., and Sur, D.: Investigation of the negative ionospheric response of the 8 September 2017 geomagnetic storm over the European sector, Adv. Space Res., 70, 1104–1120, https://doi.org/10.1016/j.asr.2022.05.035, 2022.
Prölss, G. W.: Ionospheric F-region storms, in: Handbook of Atmospheric Electrodynamics, edited by: Volland H., CRC Press, Boca Raton, Florida, USA, https://doi.org/10.1201/9780203713297, 2, 195–248, 1995.
Prölss, G. W. and Roemer, M.: Thermospheric storms, Adv. Space Res., 7, 223–235, https://doi.org/10.1016/0273-1177(87)90096-2, 1987.
Qian, L., Wang, W., Burns, A. G., Chamberlin, P. C., Coster, A., Zhang, S.-R., and Solomon, S. C.: Solar flare and geomagnetic storm effects on the thermosphere and ionosphere during 6–11 September 2017, J. Geophys. Res.-Space, 124, 2298–2311, https://doi.org/10.1029/2018JA026175, 2019.
Song, P., Singer, H., and Siscoe, G. (Eds.): Space Weather, Geophysical Monograph, American Geophysical Union, Washington, DC, https://doi.org/10.1002/9781118668351, 2001.
Tariq, M. A., Yuyan, Y., Shah, M., Shah, M. A., Iqbal, T., and Liu, L.: Ionospheric–Thermospheric responses to the May and September 2017 geomagnetic storms over Asian regions, Adv. Space Res., 70, 3731–3744, https://doi.org/10.1016/j.asr.2022.08.050, 2022.
Wen, D. and Mei, D.: Ionospheric TEC disturbances over China during the strong geomagnetic storm in September 2017, Adv. Space Res., 65, 2529–2539, https://doi.org/10.1016/j.asr.2020.03.002, 2020.
Wang, J., Yang, C., and An, W.: Regional Refined Long-term Predictions Method of Usable Frequency for HF Communication Based on Machine Learning over Asia, IEEE T. Antenn. Propag., 70, 4040–4055, https://doi.org/10.1109/TAP.2021.3111634, 2022.
Wang, J., Shi, Y., Yang, C., Zhang, Z., and Zhao, L.: A Short-term Forecast Method of Maximum Usable Frequency for HF Communication, IEEE T. Antenn. Propag., 71, 5189–5198, https://doi.org/10.1109/TAP.2023.3266584, 2023.


