the Creative Commons Attribution 4.0 License.
the Creative Commons Attribution 4.0 License.
Quasi-10 d wave modulation of an equatorial ionization anomaly during the Southern Hemisphere stratospheric warming of 2002
Xiaohua Mo
The present paper studies the perturbations in an equatorial ionization anomaly (EIA) region during the Southern Hemisphere (SH) sudden stratospheric warming (SSW) of 2002, using the location of EIA crests derived from global positioning system (GPS) station observations, the total electron content (TEC) obtained by the International GNSS (global navigation satellite system) Service (IGS) global ionospheric TEC map (GIMs) and the equatorial electrojet (EEJ) estimated by the geomagnetic field in the Asian sector. The results indicate the existence of an obvious quasi-10 d periodic oscillation in the location and TEC of the northern and southern EIA crest. An eastward phase progression of the quasi-10 d wave producing the SH SSW of 2002 is also identified in polar stratospheric temperature. Previous studies have shown that a strong quasi-10 d planetary wave with zonal wave numbers s=1 extended from the lower stratosphere to the mesosphere and lower thermosphere during the SH SSW of 2002 (Palo et al., 2005). Moreover, the EEJ driven by the equatorial zonal electric field exhibits quasi-10 d oscillation, suggesting the enhanced quasi-10 d planetary wave associated with SSW penetrates into the ionosphere E region and produces oscillation in the EIA region through modulating the E-region electric fields. Our results reveal some newer features of ionospheric variation that have not been reported during Northern Hemisphere (NH) SSWs.
- Article
(3480 KB) - Full-text XML
- BibTeX
- EndNote
Sudden stratospheric warming (SSW) is large-scale meteorological process in the polar stratosphere which is characterized by a rapid rise in temperatures and a deceleration/reversal in the zonal-mean flows (Scherhag, 1952). The primary driver of SSWs is thought to be a rapid growth of a quasi-stationary planetary wave interacting with the zonal-mean flow (Matsuno, 1971). Although the main processes of SSWs occur in the polar middle atmosphere, its effects on the ionosphere have been observed in significant changes of the equatorial electrojet (EEJ), vertical plasma drift, and equatorial ionization anomaly (EIA) (Vineeth et al., 2007; Chau et al., 2009; Goncharenko et al., 2010; Pancheva and Mukhtarov, 2011; Jin et al., 2012).
Since stationary planetary waves in the Southern Hemisphere (SH) generally have smaller amplitudes than in the Northern Hemisphere (NH) where orographic and thermal forcing is stronger (Andrews et al., 1987), major SSWs often occur in the NH. Therefore, most studies about SSW effects on the ionosphere are during the NH SSW period. In recent years, a great deal of research has been focused on the variation of the low-latitude ionosphere during SSW in the NH, and the quasi-16 d periodic disturbance and the lunar tide characteristics have been found in some ionospheric parameters, for example, EEJ, vertical plasma drifts and ionospheric electron density (Vineeth et al., 2007; Chau et al., 2009; Pedatella and Forbes, 2009; Goncharenko et al., 2010). Some researchers considered that this kind of quasi-16 d periodic variations is related to the enhanced planetary wave during the SSW period (Chau et al., 2009; Pedatella and Forbes, 2009; Liu et al., 2010). But others believe that this kind of quasi-16 d period is related to the semidiurnal lunar tides (Fejer et al., 2010; Park et al., 2012). The direct evidence shows that the typical SSW feature appears in some ionospheric parameters as morning enhancement and afternoon decrease in a semidiurnal pattern that progresses to later local times within several days. However, some studies believe that the local time variation characteristics are not necessarily caused by the semidiurnal lunar tides; Pedatella et al. (2012) demonstrate that the phase of the semidiurnal solar tide changes in a manner that makes it similar to the phase of the lunar semidiurnal tide. Besides, although many studies examine the variation of the low-latitude ionosphere during the SSW period, the physical connection between the SSW in the polar region and the featured variations in the low-latitude ionosphere is still not clear. Some studies even consider the SSW and the featured variation of the low-latitude ionosphere to both be the same sources, which is the effect of enhanced planetary waves in different regions (Stening, 2011).
In comparison, the atmospheric parameters in the mesosphere and lower thermosphere (MLT) are very limited. The atmospheric variation in the MLT is usually indirectly reflected through the EEJ obtained from the geomagnetic field data in the equatorial and low-latitude region. The EEJ is driven by the zonal electric field which also produces EIA via upward E × B drift (fountain effect). The zonal electric field modulated by tidal winds in the lower thermosphere through the E-region dynamo process is easy to be influenced by various atmospheric waves, so these ionospheric variations often display similar semidiurnal pattern and 13–16 d wave signatures which have been associated with the enhanced planetary wave and solar- and lunar-tide waves during the SSW period (Pedatella and Forbes, 2009; Goncharenko et al., 2010; Fejer et al., 2010; Park et al., 2012).
In August to September 2002, three minor SSWs and a major SSW appeared in the SH (Varotsos, 2002; Baldwin et al., 2003). There is sufficient evidence that a series of unusual atmospheric states occurred in this period, i.e., a planetary-wave scale of quasi-10 d variation (Krüger et al., 2005; Palo et al., 2005), short-term semidiurnal tide variability with a zonal wave number s=1 (Chang et al., 2009) and winds oscillating with a ∼14 d period (Andrew et al., 2004), which are all linked to the extremely large planetary-wave events. Although the atmospheric activity in connection with the 2002 SH SSW has been well revealed in observations and numerical modeling, relatively little is known about the ionosphere effects of the 2002 SH SSW. Recently, Olson et al. (2013) studied the equatorial electrodynamic perturbations in the Peruvian sector during the 2002 SH SSW and found enhanced quasi-2 d fluctuations and large-amplitude multi-day perturbations in the EEJ and vertical drifts. The research of ionospheric behavior during the SH SSW periods are useful for verifying the existing explanation about the origin of ionospheric perturbations during NH SSW periods and revealing some newer features of ionospheric variation, so further investigation of the 2002 SH SSW effect on the ionosphere with more ionospheric parameters is still warranted.
In the present study, we present the first observational evidence of quasi-10 d oscillation in the EIA region during the 2002 SH SSW which has not been reported during NH SSWs, based on the location of EIA crests derived from global positioning system (GPS) station observations, the total electron content (TEC) obtained by the International GNSS (global navigation satellite system) Service (IGS) global ionospheric TEC map (GIMs), and the EEJ estimated by the geomagnetic field in the Asian sector.
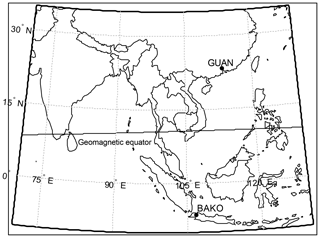
The locations of EIA crests derived from GPS observations are used to analyze the variation in the EIA region during the 2002 SH SSW from 20 July to 27 October 2002. The GPS stations are GUAN (23.19∘ N, 113.34∘ E, magnetic latitude (MLAT) ∼12.52∘ N) and BAKO (6.49∘ S, 106.84∘ E, MLAT ∼17.18∘ S) which are near the northern and southern EIA crests, respectively. The locations of the GPS stations are shown in Fig. 1. Since the ionospheric vertical TEC usually reaches the maximum at the EIA crest, the location of the EIA crest can be obtained by vertical TEC values at each ionospheric penetration point (IPP), which is the intersection of the line of sight and the ionospheric shell (assumed to be 400 km) (Mo et al., 2014). The relative accuracy of the TEC is 0.02 total electron content units (1 TECU = 1016 electrons m−2) (Hofmann-Wellenhof et al., 1992). The sample rate of these GPS stations were 30 s, so the resolution of the location of the EIA crest is less than 25 km (Mo et al., 2017). Figure 2a and b show the daily average geomagnetic latitude of the northern and southern EIA crests during the 2002 SH SSW.
The TEC from GIMs are also used to analyze the variation in the EIA region. The GIMs provide maps of the TEC obtained from a global network of GPS receivers, which have temporal resolution of 2 h and a spatial resolution of 5∘ in longitude and 2.5∘ in latitude (Mannucci et al., 1998). The EIA crest usually reaches its maximum development near 14:00 LT (Huang et al., 1989; Yeh et al., 2001), so the daily average TEC obtained by GIMs at 12:00–14:00 LT with (northern EIA region) and (southern EIA region) at E every day in the Asian sector is used to describe the variation in the northern and southern EIA regions; the results are shown in Figure 2c and d.
To demonstrate the dynamical process in the EIA region, the EEJ is also used in this study, which can be estimated by the difference between the horizontal component of the geomagnetic field at TIR (8.7∘ N, 77.8∘ E, MLAT ∼0.03∘ N) and VSK (17.68∘ N, 83.32∘ E, MLAT ∼8.56∘ N) (Rastogi et al., 1990). The results are shown in Fig. 2e. In addition, the polar stratospheric temperature (90∘ S, 10 hPa) and zonal-mean zonal winds (60∘ S, 10 hPa) obtained from the National Centers for Environment Prediction (NCEP) are used to examine the extent of the SSW; the results are shown in Fig. 2f and g. The background of the geomagnetic activity index (Kp) and solar flux index (F10.7) from http://spidr.ionosonde.net/spidr/, last access: 5 July 2008, are depicted in Fig. 2h and i.
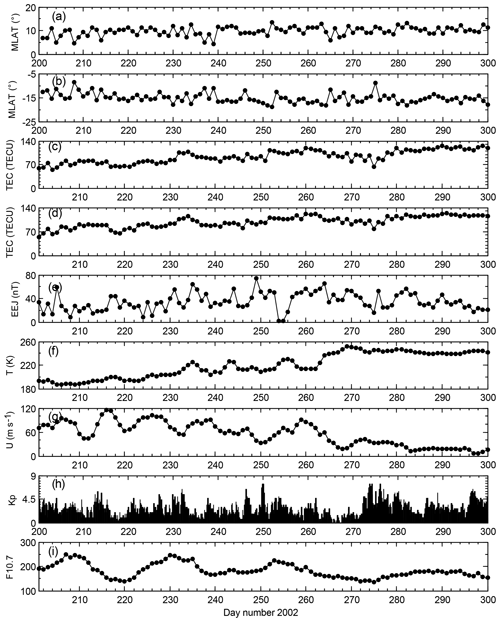
Figure 2The magnetic latitude (MLAT) location of the (a) northern and (b) southern equatorial ionization anomaly (EIA) crests. The TEC of the (c) northern and (d) southern EIA crests. The (e) equatorial electrojet (EEJ), (f) polar stratospheric temperature (at 90∘ S, 10 hPa) and (g) zonal wind (at 60∘ S, 10 hPa) from the National Centers for Environment Prediction. The (h) geomagnetic activity index (Kp) and (i) solar flux index (F10.7) during the period from 20 July to 27 October 2002.
It can be seen from Fig. 2f and g that there were three obvious minor SH SSW events around day number 230–260 and a major SH SSW event around day number 263–288 (Olson et al., 2013). Figure 3 shows the contour map of polar stratospheric temperature (80∘ S, 10 hPa) obtained from the NCEP from 20 July to 27 October 2002. An eastward phase progression of the quasi-10 d wave is clearly observed around day number 210–270. With Sounding of the Atmosphere using Broadband Emission Radiometry (SABER) temperature data, Palo et al. (2005) also observed similar disturbances and suggested it consists of an eastward-propagating quasi-10 d wave with zonal wave numbers s=1 superimposed upon a large stationary planetary wave with s=1.
Now we examine the impact of this quasi-10 d wave on the EIA region. As 2002 was at a solar maximum phase, the ionosphere may have exhibited some variations caused by periodic solar irradiance and high-speed solar streams related to solar rotation during the 2002 SH SSW event, for example, 27 d periodic variation. To exclude these long period fluctuations in the EIA region, the periods longer than 15 d in the MLAT location and TEC of the EIA crest and the EEJ are removed. Specifically, these parameters are subtracted from their respective 15 d moving average. The residuals are subjected to Lomb–Scargle (L–S) spectral analysis (Lomb, 1976; Scargle, 1982), and the results are shown in Fig. 4a–e. The horizontal dashed lines represent the 95 % confidence level. It is evident that the MLAT location and TEC of the EIA crest and the EEJ all exhibit a significant quasi-10 d periodic component, which exceeds or approaches the 95 % confidence level, suggesting that the whole dynamical process in the EIA region is modulated by a quasi-10 d wave. Figure 4f and g show the L–S spectral analysis of Kp and F10.7. It can be seen that both Kp and F10.7 do not exhibit a quasi-10 d periodic component, indicating that variation in the solar irradiance and geomagnetic activity cannot account for this quasi-10 d oscillation in the EIA region.
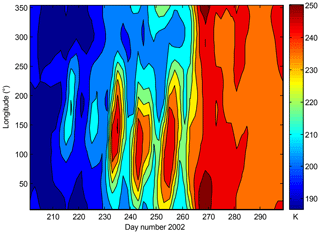
Figure 3The contour map of polar stratospheric temperature (80∘ S, 10 hPa) obtained from the NCEP during the same period as in Fig. 2.
To investigate the time evolution of quasi-10 d periodic variation, the Morlet wavelet spectral analysis is applied to the MLAT location and TEC of the EIA crest, EEJ, and Kp. The periods longer than 15 d in the MLAT location and TEC of the EIA crest and the EEJ are removed before the wavelet spectra are generated, and the results are illustrated in Fig. 5a–e. The black solid contours in each panel indicate a significance level higher than 95 %. The white line in each panel represents the cone of influence of the wavelet analysis. The color bar number is the power strength for each parameter. Obviously, the most predominant periodic component in the MLAT location and TEC of the EIA crest and the EEJ is a quasi-10 d period, which mainly appeared around day number 210–290, indicating that quasi-10 d oscillations in the EIA region go through three minor SSWs and a major SSW period. The time evolution of the power in the MLAT location and TEC of the northern EIA crest match those of southern EIA crest well, respectively. In addition, we note that both the MLAT location and the TEC of EIA crest show the quasi-2 d oscillations during the major SSW period (around day number 260–270), which are also found on equatorial ionospheric electric fields and currents at the same period (Olson et al., 2013). Figure 5f shows the wavelet spectral analysis of the Kp index. It can be seen that a quasi-10 d periodic component is nearly absent in Kp around day number 230–290, suggesting that magnetic activity should not be the driving force for this quasi-10 d oscillation in the EIA region.
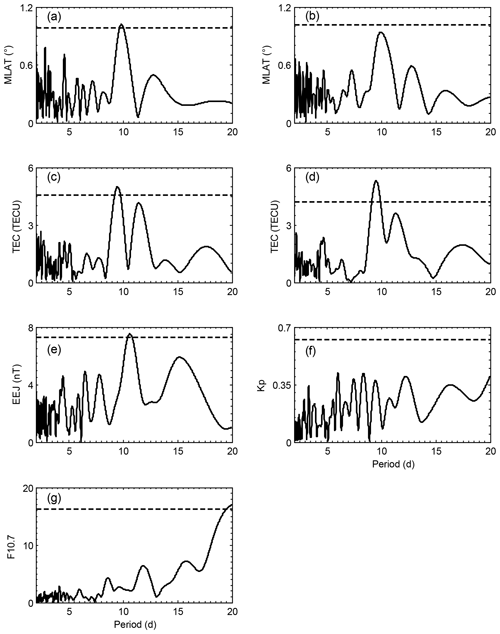
Figure 4Lomb–Scargle periodgrams of the MLAT location of the (a) northern and (b) southern EIA crests. The TEC of the (c) northern and (d) southern EIA crests. The (e) EEJ, (f) Kp index and (g) F10.7 during the same period as in Fig. 2.
In order to demonstrate the phase relationship of the quasi-10 d oscillations between the northern and southern EIA crests, the band-pass filter is performed on the MLAT location and TEC of the EIA crest. The absolute values of the MLAT location of the EIA crest are used. The band-pass filter is centered at the period of 10 d, with half-power points at 8 and 12 d, and the results are shown in Fig. 6. The quasi-10 d wave amplitudes of the northern and southern EIA crests are roughly equivalent, which exceed 1.7∘ for the MLAT location and 7 TECU for the TEC, respectively. Although the quasi-10 d wave of northern EIA crest match those of the southern EIA crest well, the wave of the northern EIA crest seemed to delay behind the southern EIA crest, especially for the MLAT location. To further verify this, Fig. 7 shows the cross correlation of quasi-10 d waves in the MLAT location (a) and TEC (b) between the northern and southern EIA crests. The cross-correlation coefficients of the MLAT location and TEC reach 0.8 and 0.93, respectively. Moreover, the maximum cross-correlation coefficients for the MLAT location is at 1 d, indicating that the wave of the northern EIA crest was delayed 1 d behind the southern EIA crest. This phase difference between northern and southern EIA crests may be due to differences in longitude between two GPS stations.
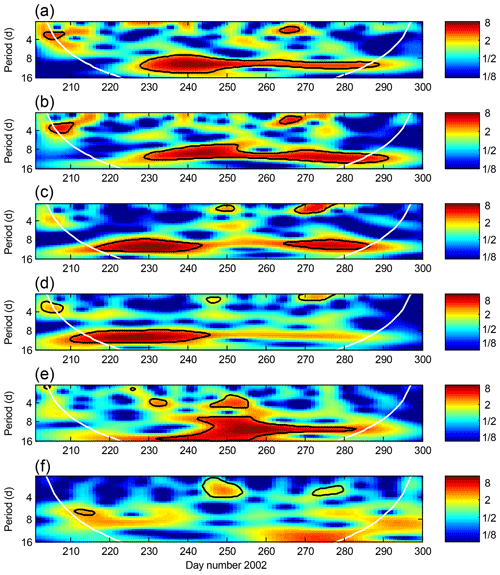
Figure 5The wavelet power spectra of the MLAT location of the (a) northern and (b) southern EIA crests. The TEC of the (c) northern and (d) southern EIA crests. The (e) EEJ and (f) Kp index during the same period as in Fig. 2. The white line in each panel represents the cone of influence of the wavelet analysis.
In recent years a series of reports have focused on ionospheric perturbations during SSW events. The most predominant features in the low-latitude ionosphere associated with the SSW event are a semidiurnal pattern and 13-to-16 d periodic variations, which are attributed to the nonlinear interaction of planetary waves and solar- and lunar-tide waves (Pedatella and Forbes, 2009; Goncharenko et al., 2010; Fejer et al., 2010; Park et al., 2012). As major SSWs often occur in the NH, most studies are about SSW effects on the ionosphere during the NH SSW period. In August to September 2002, the first major SSW was observed in the SH. The NH and SH SSWs occurred in the Arctic and Antarctic winters, respectively, so the occurring time and location of the SH SSW are opposite to those of the NH SSW. Research on ionospheric behavior during the SH SSW periods is useful for testing the general rule of ionospheric perturbations during the NH SSW periods. For example, Olson et al. (2013) demonstrated that multi-day ionospheric perturbations responding to the 2002 SH SSW resemble those observed during NH SSWs, and these ionospheric perturbations were associated with enhanced lunar tidal effects.
In this study we present observations of quasi-10 d oscillation in the EIA region during the 2002 SH SSW that has not been reported during NH SSWs. This quasi-10 d periodic component is absent or very weak in the Kp and F10.7 indexes, indicating that the magnetic activity and solar irradiance cannot account for this quasi-10 d oscillation in the EIA region. Meanwhile, an unusual atmospheric state occurred in this period: the ozone hole over the Antarctic had a smaller size and split into two separate holes (Varotsos 2002; Baldwin et al., 2003). This phenomenon is thought to be due to high temperatures in the Antarctic stratosphere, which was contributed to by upward propagation of planetary waves (Venkat Ratnam et al., 2004). Moreover, strong planetary-wave scale quasi-10 d variation was observed in polar stratospheric temperature during this period. The wave interactions between eastward-propagating waves with periods near 10 d, quasi-stationary planetary waves, and the zonal-mean atmospheric state were eventually driven towards total breakdown of the polar vortex and a major warming of the stratosphere (Krüger et al., 2005; Palo et al., 2005). So the quasi-10 d oscillations in the EIA region should be ascribed to atmosphere perturbations linking the SSW in the Southern Hemisphere.
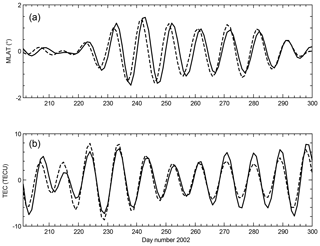
Figure 6The band-pass filter results of the (a) MLAT location of the (solid line) northern and (dashed line) southern EIA crests. The (b) TEC of the (solid line) northern and (dashed line) southern EIA crests during the same period as in Fig. 2.
The coupling process of 10 d oscillation between the lower atmosphere and ionosphere can be demonstrated by existing observations and simulations. A series of studies have showed how the quasi-10 d planetary wave in stratosphere can penetrate into the ionosphere E region (Krüger et al., 2005; Palo et al., 2005; Chang et al., 2009). Krüger et al. (2005) revealed eastward-traveling waves with periods near 10 d and their interaction with quasi-stationary planetary waves forced in the troposphere during the 2002 SH SSW event, supporting the observational and numerical evidence that the eastward-traveling wave interacts with the stationary wave to produce a quasi-periodic amplitude modulation of the stationary waves (Hirota et al., 1990; Ushimaru and Tanaka, 1992). Palo et al. (2005) found an eastward-propagating quasi-10 d wave with zonal wave numbers s=1 and s=2 and quasi-stationary planetary waves with s=1 extending from the lower stratosphere to the 100–120 km height region with little amplitude attenuation. While the quasi-stationary planetary wave is confined to the high-latitude atmosphere and cannot directly propagate to equatorial ionosphere, the tides were introduced into a planetary-wave-modulation mechanism. Eswaraiah et al. (2018) reported that zonal diurnal and semidiurnal tide amplitudes in the Antarctic mesosphere and lower thermosphere were enhanced around day number 230–290 during the 2002 SH SSW, which coincides with the enhanced period of quasi-10 d oscillations in the EIA region shown in Fig. 5. Moreover, Chang et al. (2009) showed that the short-term variability of the s=1 semidiurnal tide is strongly dependent upon the planetary wave with zonal number 1 (PW1) events (quasi-10 d wave) prior to the major warming during the 2002 SH SSW, supporting the suggestion that the quasi-stationary planetary wave can influence migrating and nonmigrating solar tides globally (Liu et al., 2010; Pedatella and Forbes, 2010). So the interactions between the quasi-10 d planetary wave and tide will modify the ionosphere E-region winds, which can produce E-region electric fields via the E-region dynamo process. In this study, the EEJ driven by the equatorial zonal electric field also exhibits quasi-10 d oscillation, indicating that the upward-propagating planetary waves interacted with the tide-produced oscillation in the EIA region through modulating E-region electric fields. Specifically, the E-region electric fields map to the lower-ionospheric F region along the magnetic field lines and generate an eastward electric field (Goncharenko et al., 2010). At the magnetic equator, the eastward electric field with quasi-10 d periodic variation changes electron density distribution in the low-latitude region via E × B drift and finally leads to quasi-10 d planetary waves characteristic of variations in the EIA region. Previous studies have revealed a strong correlation between ionospheric perturbations and the occurrence of NH SSW. During the NH SSW period, quasi-16 d oscillations and semidiurnal patterns are observed in equatorial mesopause temperature, the MLT meridional and zonal wind, the EEJ, electron density, and the TEC (Vineeth et al., 2007; Pedatella and Forbes, 2009; Park et al., 2012; Jonah et al., 2014). Some researchers attribute these ionospheric perturbations to the strong dynamical coupling between the lower atmosphere and ionosphere through the intensification of planetary-wave activity (Chau et al., 2009) and lunar (Fejer et al., 2010) and solar (Pedatella et al., 2012) tides. In this study, the consistent quasi-10 d oscillations appear in the EEJ and the location and TEC of the northern and southern EIA crests, indicating that the coupling mechanism between the lower atmosphere and ionosphere during the SH SSW period is consistent with that during the NH SSW period.
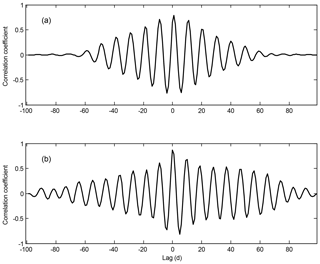
Figure 7The cross correlation of quasi-10 d waves in the MLAT location (a) and TEC (b) between the northern and southern EIA crests.
In our previous studies, a 14-to-15 d wave during several NH SSW events is ascribed to lunar tide (Mo et al., 2018). So the source of quasi-10 d oscillations in the EIA region during the 2002 SH SSW is different from 14-to-15 d waves during the NH SSW. For this 10 d periodic event, it seems that the effect of the planetary wave is more obvious. Moreover, no obvious 14-to-15 d oscillation is found in the EIA region during the 2002 SH SSW, which may be that the equatorial lunar semidiurnal effects during September–October are weaker than those during January–February (Stening et al., 2011; Pedatella, 2014). Olson et al. (2013) also reported that the perturbations amplitude of the EEJ and vertical drifts modulated by lunar semidiurnal tides during the SH SSW are smaller than those during the NH SSW.
Using the location and TEC of the EIA crests derived from GPS station observations and GIMs, we found a quasi-10 d periodic variability in the northern and southern EIA region in the Asian sector during the SH SSW of 2002. In the same time period, this quasi-10 d oscillation is also seen in the polar stratospheric temperature, which is absent and weak in the Kp and F10.7 indexes, respectively. The SH SSW of 2002 itself is generated by a quasi-10 d planetary wave. Previous studies have shown that a strong quasi-10 d planetary wave with zonal wave numbers s=1 extends from the lower stratosphere to the mesosphere and lower thermosphere during the SH SSW of 2002 (Palo et al., 2005). Moreover, the EEJ driven by the equatorial zonal electric field exhibits quasi-10 d oscillation, indicating that the upward-propagating planetary waves interacted with the tide will modify E-region electric fields, thereby altering the plasma structures through an upward E × B drift, which results in the periodical variations in these ionospheric parameters in the F region. These results support the suggestion that the quasi-10 d variation in the EIA region should be ascribed to an enhanced 10 d planetary wave in the lower atmosphere associated with the SSW.
The GPS data were from the Crustal Movement Observation Network of China (via e-mail to yglyang@cma.gov.cn) and IGS (http://sopac-old.ucsd.edu, last access: 24 June 2011). The geomagnetic data at TIR and VSK were from the World Data Center (WDC) for Geomagnetism, Kyoto (http://wdc.kugi.kyoto-u.ac.jp/hyplt/index.html, last access: 7 March 2010). The GIMs were downloaded from the Crustal Dynamics Data Information System website (ftp://cddis.gsfc.nasa.gov, last access: 10 January 2011).
XM and DZ contributed to this study. XM wrote the paper. XM and DZ revised the paper together.
The authors declare that they have no conflict of interest.
This research was jointly supported by the Guangxi Natural Science Foundation (grant no. 2016GXNSFAA380132) and Chinese Meridian Project. We gratefully acknowledge National Center for Environmental Prediction (NCEP) for providing public access to stratospheric data (available at https://www.esrl.noaa.gov/psd/data/reanalysis/, last access: 18 December 2012).
This research has been supported by the National Natural Science Foundation of China (grant nos. 41864006, 41674157, and 41464006).
This paper was edited by Dalia Buresova and reviewed by three anonymous referees.
Andrew, J. D., Vincent, R. A., Murphy, D. J., Tsutsumi, M., Riggin, D. M., and Jarvis, M. J.: The large-scale dynamics of the mesosphere-lower thermosphere during the Southern Hemisphere stratospheric warming of 2002, Geophys. Res. Lett., 31, L14102, https://doi.org/10.1029/2004GL020282, 2004.
Andrews, D. G., Holton, J. R., and Leovy, C. B.: Middle Atmosphere Dynamics, Academic, San Diego, Calif, 489 pp., 1987.
Baldwin, M., Hirooka, T., O'Neill, A., and Yoden, S.: major stratospheric warming in the Southern Hemisphere in 2002: Dynamical aspects of the ozone hole split, SPARC Newsl., 20, 24–26, 2003.
Chang, L. C., Palo, S. E., and Liu, H.-L.: Short-term variation of the s=1 nonmigrating semidiurnal tide during the 2002 stratospheric sudden warming, J. Geophys. Res., 114, D03109, https://doi.org/10.1029/2008JD010886, 2009.
Chau, J. L., Fejer, B. G., and Goncharenko, L. P.: Quiet variability of equatorial E × B drift during a sudden stratospheric warming event, Geophys. Res. Lett., 36, L05101, https://doi.org/10.1029/2008GL036785, 2009.
Eswaraiah, S., Kim, Y. H., Lee, J., Ratnam, M. V., and Rao, S. V. B.: Effect of Southern Hemisphere sudden stratospheric warmings on Antarctica mesospheric tides: First observational study, J. Geophys. Res.-Space, 123, 2127–2140, https://doi.org/10.1002/2017JA024839, 2018.
Fejer, B. G., Olson, M. E., Chau, J. L., Stolle, C., Lühr, H., Goncharenko, L. P., Yumoto, K., and Nagatsuma, T.: Lunar-dependent equatorial ionospheric electrodynamic effects during sudden stratospheric warmings, J. Geophys. Res., 115, A00G03, https://doi.org/10.1029/2010JA015273, 2010.
Goncharenko, L. P., Chau, J. L., Liu, H.-L., and Coster, A. J.: Unexpected connections between the stratosphere and ionosphere, Geophys. Res. Lett., 37, L10101, https://doi.org/10.1029/2010GL043125, 2010.
GPS station: SOPAC and CSRC, available at: http://sopac-csrc.ucsd.edu/, last access: July 2008.
Hirota, I., Kuroi, K., and Shiotani, M.: Midwinter warmings in the Southern Hemisphere stratosphere in 1988, Q. J. Roy. Meteor. Soc., 116, 929–941, 1990.
Hofmann-Wellenhof, B., Lichtenegger, H., and Collins, J.: GPS – Theory and Practice, Springer, New York, 334 pp., 1992.
Huang, Y. N., Cheng, K., and Chen, S. W.: On the equatorial anomaly of the ionospheric total electron content near the northern anomaly crest region, J. Geophys. Res., 94, 13515–13525, 1989.
Jin, H., Miyoshi, Y., Pancheva, D., Mukhtarov, P., Fujiwara, H., and Shinagawa, H.: Response of the migrating tides to the stratospheric sudden warming in 2009 and their effects on the ionosphere studied by a whole atmosphere-ionosphere model GAIA with COSMIC and TIMED/SABER observations, J. Geophys. Res., 117, A10323, https://doi.org/10.1029/2012JA017650, 2012.
Jonah, O. F., de Paula E. R., Kherani, E. A., Dutra, S. L. G., and Paes, R. R.: Atmospheric and ionospheric response to sudden stratospheric warming of January 2013, J. Geophys. Res.-Space, 119, 4973–4980, https://doi.org/10.1002/2013JA019491, 2014.
Krüger, K., Naujokat, B., and Labitzke, K.: The unusual midwinter warming in the Southern Hemisphere stratosphere 2002: A comparison to Northern Hemisphere phenomena, J. Atmos. Sci., 62, 603–613, 2005.
Liu, H. -L, Wang, W., Richmond, A. D., and Roble, R. G.: Ionospheric variability due to planetary waves and tides for solar minimum conditions, J. Geophys. Res., 115, A00G01, https://doi.org/10.1029/2009JA015188, 2010.
Lomb, N. R.: Least-squares frequency analysis of unequally spaced date, Astrophys. Space Sci., 39, 447–462, 1976.
Mannucci, A. J., Wilson, B. D., Yuan, D. N., Ho, C. M., Lindqwister, U. J., and Runge, T. F.: A global mapping technique for GPS derived ionospheric total electron content measurements, Radio Sci., 33, 565–582, https://doi.org/10.1029/97RS02707, 1998.
Matsuno, T.: A dynamical model of the stratospheric sudden warming, J. Atmos. Sci., 28, 1479–1494, 1971.
Mo, X. H. and Zhang, D. H.: Lunar tidal modulation of periodic meridional movement of equatorial ionization anomaly crest during sudden stratospheric warmaing, J. Geophys. Res.-Space, 123, 1488–1499, https://doi.org/10.1002/2017JA024718, 2018.
Mo, X. H., Zhang, D. H., Goncharenko, L. P., Hao, Y. Q., and Xiao, Z.: Quasi-16-day periodic meridional movement of the equatorial ionization anomaly, Ann. Geophys., 32, 121–131, https://doi.org/10.5194/angeo-32-121-2014, 2014.
Mo, X. H., Zhang, D. H., Goncharenko, L. R., Zhang, S. R., Hao, Y. Q., Xiao, Z., Pei, J. Z., Yoshikawa, A., and Chau, H. D.: Meridional movement of northern and southern equatorial ionization anomaly crests in the East-Asian sector during 2002–2003 SSW, Science China Earth Sciences, 60, 776–785, https://doi.org/10.1007/s11430-016-0096-y, 2017.
NASA: The GIMs, available at: ftp://cddis.gsfc.nasa.gov, last access: January 2011.
Olson, M. E., Fejer, B. G., Stolle, C., Lühr, H., and Chau, J. L.: Equatorial ionospheric electrodynamic perturbations during Southern Hemisphere stratospheric warming events, J. Geophys. Res.-Space, 118, 1190–1195, https://doi.org/10.1002/jgra.50142, 2013.
Palo, S. E, Forbes, J. M., Zhang, X., Russell III, J. M., Mertens, C. J., Mlynczak, M. G., Burns, G. B., Espy, P. J., and Kawahara, T. D.: Planetary wave coupling from the stratosphere to the thermosphere during the 2002 Southern Hemisphere pre-stratwarn period, Geophys. Res. Lett., 32, L23809, https://doi.org/10.1029/2005GL024298, 2005.
Pancheva, D. and Mukhtarov, P.: Stratospheric warmings: The atmosphere-ionosphere coupling paradigm, J. Atmos. Sol.-Terr. Phys., 73, 1697–1702, https://doi.org/10.1016/j.jastp.2011.03.006, 2011.
Park, J., Lühr, H., Kunze, M., Fejer, B. G., and Min, K. W.: Effect of sudden stratospheric warming on lunar tidal modulation of the equatorial electrojet, J. Geophys. Res., 117, A03306, https://doi.org/10.1029/2011JA017351, 2012.
Pedatella, N. M.: Observations and simulations of the ionospheric lunar tide: Seasonal variability, J. Geophys. Res.-Space, 119, 5800–5806, https://doi.org/10.1002/2014JA020189, 2014.
Pedatella, N. M. and Forbes, J. M.: Modulation of the equatorial F-region by the quasi-16 day planetary wave, Geophys. Res. Lett., 34, L09105, https://doi.org/10.1029/2009GL037809, 2009.
Pedatella, N. M. and Forbes, J. M.: Evidence for stratosphere sudden warming-ionosphere coupling due to vertically propagating tides, Geophys. Res. Lett., 37, L11104, https://doi.org/10.1029/2010GL043560, 2010.
Pedatella, N. M., Liu, H. L., and Richmond, A. D.: Atmospheric semidiurnal lunar tide climatology simulated by the Whole Atmosphere Community Climate Model, J. Geophys. Res., 117, A06327, https://doi.org/10.1029/2012JA017792, 2012.
Rastogi, R. G. and Klobuchar, J. A. : Ionospheric electron content within the equatorial F2 layer anomaly belt, J. Geophys. Res., 95, 19045–19052, https://doi.org/10.1029/JA095iA11p19045, 1990.
Scargle, J. D.: Studies in astronomical time series analysis, II. Statistical aspects of spectral analysis of unevenly spaced data, Astrophys. J., 263, 835–853, 1982.
Scherhag, R.: Die explosionsartigen Stratosphärenerwärmungen des Spätwinters 1952, Berlin, Dtsch. Wetterdienstes, 6, 51–63, 1952.
Stening, R. J.: Lunar tide in the equatorial electrojet in relation to stratospheric warmings, J. Geophys. Res., 116, A12315, https://doi.org/10.1029/2011JA017047, 2011.
Ushimaru, S. and Tanaka, H.: A numerical study of the interaction between stationary Rossby waves and eastward-traveling waves in the Southern Hemisphere stratosphere, J. Atmos. Sci., 49, 1354–1373, 1992.
Varotsos, C.: The Southern Hemisphere ozone hole split in 2002, Environ. Sci. Pollut. Res., 9, 375–376, 2002.
Venkat Ratnam, M., Tsuda, T., Jacobi, C., and Aoyama, Y.: Enhancement of gravity wave activity observed during a major Southern Hemisphere stratospheric warming by CHAMP/GPS measurements, Geophys. Res. Lett., 31, L16101, https://doi.org/10.1029/2004GL019789, 2004.
Vineeth, C., Pant, T. K., Devasia, C. V., and Sridharan, R.: Atmosphere-ionosphere coupling observed over the dip equatorial MLTI region through the quasi 16-days wave, Geophys. Res. Lett., 34, L12102, https://doi.org/10.1029/2007GL030010, 2007.
World Data Center (WDC): The geomagnetic data at TIR and VSK, available at: http://wdc.kugi.kyoto-u.ac.jp/hyplt/index.html, last access: March 2010.
Yeh, K. C., Franke, S. J., Andreeva, E. S., and Kunitsyn, V. E.: An investigation of motions of the equatorial anomaly crest, Geophys. Res. Lett., 28, 4517–4520, https://doi.org/10.1029/2001GL013897, 2001.


