the Creative Commons Attribution 4.0 License.
the Creative Commons Attribution 4.0 License.
Localized total electron content enhancements in the Southern Hemisphere
This paper is dedicated to the investigation of localized TEC (total electron content) enhancements (LTEs), which were detected in the Southern Hemisphere via the analysis of global ionospheric maps. Using data from different years (2014, 2015 and 2018), we show the presence of LTEs almost independently of solar activity. We also show that LTEs are a phenomenon that can be observed in serial: at the same universal time (UT), similar enhancement can manifest themselves over several days. The intensity of LTEs varies depending on the solar flux and does not directly depend on the interplanetary magnetic field orientation; these events occur under both geomagnetically disturbed and quiet conditions. The highest LTE occurrence rate was observed during the period of local winter (April–September) in all years analyzed. The longest observed LTE series was detected during 2014 and lasted 80 d – or 120 d if we exclude two daily gaps.
- Article
(2772 KB) - Full-text XML
- BibTeX
- EndNote
The Southern Hemisphere (SH) ionosphere has not been investigated as broadly as that of the Northern Hemisphere (NH): historically, most of the geophysical observations and measurements have been made north of the Equator. Even now that many observatories exist around the globe, there is still a lack of ground-based observations for a large part of the SH, as it is mostly occupied by ocean. Satellite measurements allow us to investigate the ionosphere over oceans; however, due to the high variability and the movement of satellites, it is very difficult to observe the same region under the same conditions.
It is known that the SH contains some anomalous regions. The South Atlantic Magnetic Anomaly (SAMA), for example, is formed by the configuration of the geomagnetic field which has a global intensity minimum over South Atlantic and South America that makes it easier for energetic particles of inner radiation belt to precipitate, thereby increasing the ionospheric conductivity over the region (Abdu et al., 2005). South of the SAMA, in the southeastern Pacific and South Atlantic–Antarctic regions, the combination of the geomagnetic field features and thermospheric winds produces an inverted diurnal plasma density pattern at equinoxes and in the SH summer (October–March) – the nighttime maximum is larger than the daytime minimum – which is known as the Weddell Sea Anomaly (WSA; Horvath, 2006). Jakowski et al. (2015) showed that it is possible to observe a so-called nighttime winter anomaly (NWA), which refers to a period when the electron concentration values are higher in winter than in summer, during periods of low solar activity in the Asian longitudinal sector of the SH. Furthermore, Yasukevich et al. (2018) showed that the WA manifests itself intensely the NH and is much less pronounced in the SH. It is quite clear that the structure and dynamics of the ionosphere in both hemispheres should be different due to these anomalies and should consequently be investigated separately.
The most widely used and generally accepted ionospheric model, the International Reference Ionosphere (IRI) empirical model (e.g., Bilitza, 2018), does not predict some features of the SH ionosphere sufficiently. However, by analyzing predictions from the International Reference Ionosphere 2016 (IRI-2016), Karia et al. (2019) showed that the model does reproduce the observed NWA effect, although it is at a different longitude and could be improved for better predictions. Comparing TEC measurements and the results of IRI-Plas (International Reference Ionosphere extended to the plasmasphere), Alcay and Oztan (2019) found that the model generally overestimates the GPS-TEC measured at stand-alone stations in the SH, with a maximal difference of about 15 TECu. Karpachev and Klimenko (2018) proposed a new model that reproduced the structure of the high-latitude ionosphere more accurately than IRI-2016 and noted that the inaccuracies in IRI in that region are connected to inaccuracies in the ground-based sounding data, which vary over a day. However, none of these models predict the occurrence of localized enhancements of the electron concentration, especially in the SH.
The most typical irregularities in the distribution of the electron concentration are produced during geomagnetic storms. Foster and Coster (2007) investigated storm-enhanced densities (SEDs) and showed that it is possible to detect SEDs which could be observed as localized TEC enhancements (LTE) in maps of total electron content (TEC) during severe and extreme storms. The abovementioned authors showed that LTEs can be detected in the nightside ionosphere at the middle latitudes of both hemispheres during a storm recovery phase in magneto-conjugated regions. The authors note that the observed enhancements approximately corotate in place over the positions in which they were formed earlier during the event. However, the LTE phenomenon studied by Foster and Coster (2007) is different from the LTE phenomenon studied in this paper. During the analysis of the ionospheric response to a geomagnetic storm on 15 August 2015, Edemskiy et al. (2018) detected a curious LTE in the global ionospheric maps (GIMs). Unlike the LTEs observed by Foster and Coster (2007), this enhancement was observed in a sunlit (near-noon) area of the SH and lasted for several hours. It did not corotate but changed position following the Sun, and it propagated along the geomagnetic parallels. Using quite a simple detection algorithm, Edemskiy et al. (2018) found about 30 similar events in the SH from 2010 to 2016, and most of the detected LTEs were observed during relatively disturbed periods. The authors showed a direct dependence of the number of the detected LTEs on the solar activity level and suggested that the generation of the enhancements was connected to the orientation of the interplanetary magnetic field (IMF), namely with Bz.
The present article is an attempt to detect more LTEs that developed in the SH during different solar activity periods and to investigate them more carefully with the aim of understanding the mechanisms of their generation. The paper is structured as follows: Sect. 2 describes the data and methods; Sect. 3 presents results; Sect. 4 comprises the discussion and presents possible generation mechanisms; and Sect. 5 summarizes the main results.
The algorithm used by Edemskiy et al. (2018) had some disadvantages: the fixed detection threshold used did not allow them to detect relatively weak LTEs; and the comparison applied, which employed a weekly TEC median, excluded possible series of such formations from consideration. In an attempt to improve the effectiveness of the LTE detection, we used specific criteria regarding TEC formation. In this paper, a TEC enhancement is considered to be a LTE if the following criteria are met:
-
The enhancement is located in the middle latitudes of a sunlit region. We mainly investigate LTEs that are clearly observed in the Indian and South Atlantic oceans, and we did not take enhancements in the NH into account. Moreover, LTEs in the SH were not accompanied by LTEs in the NH; thus, focusing on SH LTEs was considered to be quite reasonable.
-
The enhancement is spatially limited by relatively lower TEC values. The normalized difference between the squared maximal value in the LTE and the minimal value at its border should be no less than 20 %. Generally, this means that a clear trough should be observed between the southern crest of the equatorial ionization anomaly (EIA) and a region of enhanced TEC.
-
The enhancement is confined and has a border of lower TEC values (Δ≥20 %) no farther than 40∘ in longitude from the location of the maximal TEC value. This primarily means that we do not consider longitudinally stretched enhancements, as we assume that a different mechanism is responsible for their generation.
These criteria were applied to the analysis of global ionospheric maps (GIMs). Currently, these maps are provided by several scientific groups: the Center for Orbit Determination in Europe (CODE; codg), the European Space Agency (ESA; esag), the NASA Jet Propulsion Laboratory (JPL; jplg), the Universitat Politécnica de Catalunya (UPC; upcg), Wuhan University (whug); and the Chinese Academy of Sciences (CAS; casg). The International GNSS Service (IGS; igsg) also provides maps created as a combination of maps from CODE, UPS, ESA and JPL. The spatial resolution of these maps is (latitude × longitude), and the temporal resolution is 2 h (1 h for CODE maps since 2015). Maps are calculated from slant (sTEC) values measured at 200–350 GNSS receivers (depending on the data availability and the method used) worldwide as well as the application of an interpolation method. GIMs from all of the above mentioned groups are freely available from the Crustal Dynamics Data Information System (CDDIS) server (ftp://cddis.gsfc.nasa.gov/gps/products/ionex, last access: 22 April 2020). According to Roma-Dollase et al. (2018), CODE and CAS maps have the lowest relative errors in the South Atlantic and Indian Ocean regions. Taking the high temporal resolution of CODE maps into account as well as the clearer information in the headers of these maps regarding the data used, we utilized CODE GIMs in the present paper.
To confirm the presence of a LTE, we use measurements from the SWARM and COSMIC (Constellation Observing System for Meteorology Ionosphere and Climate) satellite missions. The SWARM mission was launched by ESA at the end of 2013. It is mainly aimed at the investigation of Earth's magnetic field. The mission includes three satellites at polar orbits of about 500 km (460 km for Alpha and Charlie, and 530 km for Bravo). The data are available via a browser-based application (https://vires.services/, last access: 22 April 2020) or via an API tool (https://github.com/ESA-VirES/VirES-Python-Client, last access: 22 April 2020). In the present paper, SWARM in situ measurements of electron density are used.
The COSMIC project provides measurements of upper atmosphere and ionosphere parameters. In the present paper, we use TEC profiles obtained via radio occultation (RO) receiving of GPS signals. To distinguish these data from the standard ground-based TEC measurements, we use the abbreviation SS TEC (satellite-to-satellite TEC). COSMIC data are freely provided as NetCDF files (https://cdaac-www.cosmic.ucar.edu/, last access: 22 April 2020).
We mainly analyze the occurrence rate of LTEs and their dependence on space weather. The quantitative analysis of LTEs generally consists of the definition of a maximal TEC value over the investigated region and the calculation of its relation to the mean TEC value over the region. An analysis of the dependence of these parameters on near-space conditions was also carried out during the investigation. LTE shapes vary widely and are quite difficult to formalize.
To analyze the connection of the observed features of the ionospheric dynamics with the geomagnetic field, we use the Super Dual Auroral Radar Network (SuperDARN) altitude-adjusted, corrected geomagnetic coordinates (AACGM; Shepherd, 2014) as a Python module developed by Angeline Burrell (https://github.com/aburrell/aacgmv2, last access: 22 April 2020). To create maps in geomagnetic coordinates, we place each TEC cell from the GIM map at the corresponding magnetic latitude and longitude calculated by AACGM for an altitude of 100 km.
Files of GIMs in IONEX format were treated with the “gnss-lab” python package created by Ilya Zhivetiev (https://github.com/gnss-lab, last access: 22 April 2020). The processing and presentation of data was carried out using the “NumPy” (https://numpy.org, last access: 22 April 2020) and “pandas” (https://pandas.pydata.org/, last access: 22 April 2020) Python libraries. Geomagnetic indices (e.g., Kp, Dst and AE) and other near-space parameters (including the F10.7 index for the estimation of solar activity) were taken from the OMNI database (https://omniweb.gsfc.nasa.gov, last access: 22 April 2020). During the investigated years, monthly averaged F10.7 values varied from 130 to 160 (2014), 95 to 135 (2015) and 65 to 75 sfu (2018), corresponding to high, relatively high and low level solar activity, respectively. It should be noted that the AE index values during 2018 are only available for January and February from both the OMNI and Kyoto WDC (http://wdc.kugi.kyoto-u.ac.jp/dstae/index.html, last access: 22 April 2020) databases.
An example of a clearly observed LTE was detected on 5 April 2014 (Fig. 1). The disturbance reached its highest intensity between 10:00 and 12:00 UT when TEC values in the most intense part of the disturbance exceeded 78 TECu. This value is comparable to equatorial TEC values. The highest values were detected in a latitudinal region between 45 and 70∘ S. At the same time, TEC values over the entire region (30–70∘ S, 0–90∘ E) were enhanced.
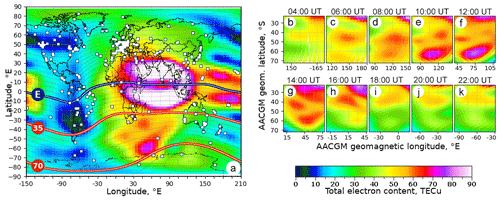
Figure 1(a) An intense LTE observed at 10:00 UT on 5 April 2014 near Antarctica, and (b–k) its development during a day in geomagnetic coordinates. (a) The LTE develops along geomagnetic parallels in a region between 35 and 70∘ S (red lines).
It is possible to distinguish two parts in the LTE presented: a midlatitudinal localized TEC enhancement (MLTE) and a subpolar localized TEC enhancement (SLTE). The LTE on 5 April had a strong subpolar part and weaker but still pronounced midlatitudinal section. As will be shown later, such a strong SLTE is not typical, and, in some cases, a SLTE is not detected at all. However, both a MLTE and a SLTE were quite clearly present during this event for several hours, which was the main reason for describing this particular case in more detail.
During its development, the LTE changed its latitudinal position within a range from 30 to 80∘ S, corresponding to range of geomagnetic parallels from 35 to 70∘ S (red lines in Fig. 1a). Phases of the development on 5 April are shown in geomagnetic coordinates (AACGM) in Fig. 1b–k. As can be seen from the figure, the LTE exists for the entire day and changes its intensity unevenly. The less intense MLTE part persists longer and has a lower magnitude than a brighter SLTE. Both parts are confined to their own ranges of geomagnetic latitudes: 30–50∘ S for the MLTE, and 50–65∘ S for the SLTE. During the whole period shown, their positions remain approximately in the subsolar area (local noon).
It is necessary to say that the LTEs are detected most clearly over the Atlantic and Indian oceans, where the number of GNSS stations is insufficient. The white squares in Fig. 1 mark the locations of the receivers that provide CODE with data for TEC maps. Only a few of these receivers are located in the ocean (on islands), and the only station is located in the area from 30 to 60∘ S (latitude) in the Indian Ocean (Kerguelen Islands, KERG). Therefore, LTE detection has to be confirmed using other observations.
In situ measurements of the electron concentration (Ne) from SWARM satellites allow us to validate the TEC distribution presented by GIMs. Fig. 2a presents the Ne values observed between 08:00 and 14:00 UT on 5 April 2014. Each track is marked using a colored dot corresponding to the Alpha (red), Bravo (blue) and Charlie (cyan) satellites; the numbers in the corresponding colors mark the satellite position at the beginning and the end of the track in the following format: HHMM (hours and minutes). All of the satellites were moving from the Equator to the pole.
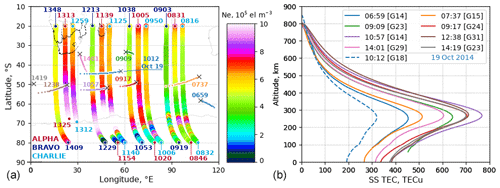
Figure 2(a) The electron concentration from 08:00 to 14:00 UT on 5 April 2014 measured by SWARM, and (b) the total electron content from RO measurements by COSMIC satellites (solid). (b) SS TEC profiles from 5 April compared with the profile from 19 October 2014 when no LTE was detected (dashed). The numbers represent the time of observation and are presented in the following format: HHMM (hours and minutes).
The area with an extremely high concentration of electrons is clearly observed in data from all the three satellites. Blank areas in measurements from Alpha and Charlie between 11:30 and 13:30 UT mark the zone of concentrations exceeding the color axis limitation. Temporal differences between the passages of the satellites allow us to observe the dynamics of the LTE. The most intensive part is shown by Alpha's measurements. Charlie is about 15 min and 2.5∘ ahead of Alpha, and its measurements generally show lower concentrations, especially for the period between 08:00 and 12:00 UT. This difference is most probably caused by the movement of the enhancement: according to the GIM, the LTE is located in the subsolar region and follows the Sun. Bravo is about 30 min and 12∘ behind Alpha, and its measurements show a significantly lower concentration than the other satellites. This could point not only to the disturbance displacement but also to its distribution with altitude, as the orbit of Bravo is 70 km higher than those of Alpha and Charlie.
The distribution of the electron concentration with altitude can be analyzed using radio occultation measurements by COSMIC satellites. Profiles of SS TEC from 5 April are presented in Fig. 2b. Each SS TEC value in a profile is obtained on a bent satellite-to-satellite ray and is attributed to a tangent point of the ray (Rocken et al., 2000). Projections of the tangent points during each profile measurement are shown in Fig. 2a using the same color as the profile. The cross symbols on the trajectories and the nearby numbers indicate the location and time of the lowest altitude measurement (last measured value before GPS satellite occultation), respectively. Due to the phenomenon of LTE series, which will be described later, TEC values over the given region are enhanced during almost the whole month. To demonstrate an ionospheric profile without any enhancement in the GIM, we have chosen to use 19 October 2014; the profile from 19 October 2014 measured by COSMIC at 10:12 UT is shown using a dashed blue line in Fig. 2.
It is quite clear that the detected disturbance was propagating according to solar motion and had the highest electron concentration in the F region at about 11:00 UT. Profiles also show that the electron concentration at an altitude 460 km could be 1.5–2 times higher that at 530 km, which corresponds with SWARM measurements.
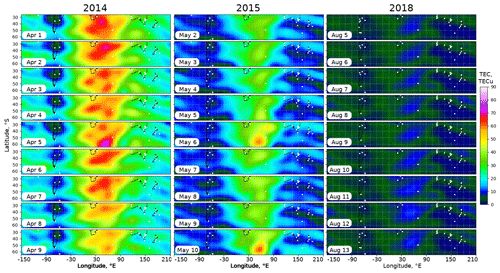
LTEs similar to the one detected on 5 April could be observed on several days in a row. In the particular case of April 2014, LTEs south of Africa were detected from 18 March to 11 April. TEC maps at 10:00 UT for 1–9 April 2014 are presented in Fig. 3 (left column). The geomagnetic conditions during this period were slightly disturbed: the maximal Kp value was 4 (7 April), and the minimal Dst value was about −25 nT (7–8 April). The intensity and shape of the LTEs presented vary from day to day, but at the same universal time, all of the LTEs occupy the same region. The intensities of the MLTE and SLTE varied independently. The SLTE was only more intense on 5 April. Mostly its intensity was either close to that of the MLTE (1, 3, 4, 7 and 9 April) or lower (2, 6 and 8 April). We define such a continuous sequence of LTEs observed day by day as a LTE series. At least two consistently observed LTEs are considered to be series. Figure 3 (middle and right columns) demonstrate LTE series observed during years of relatively high (2015, middle) and low (2018, right) solar activity. The activity level was estimated using F10.7 index values. The intensity of the observed LTEs varied according to the global electron content, which depends on the solar activity (e.g., Afraimovich et al., 2008). The disturbances in 2015 still had two different zones of LTEs, whereas all of the LTEs presented from 2018 were apparently MLTE type events (see 6 April in Fig. 3, left column). Geomagnetic activity during the days shown in the figure was moderate to low, and there was no clear correlation between the indices (e.g., Kp and Dst) and the shapes or intensities of the disturbances.
Series of LTEs were detected during all 3 years. Figure 4 shows the variations in solar (F10.7) and geomagnetic (AE and Dst) indices during each year, indicating days when LTEs were detected (blue and red bars). All of the indices are daily averaged values. According to the Fig. 4, LTEs are most often detected in autumn and at the beginning of winter (from March to June–July). With respect to the series, the absolute maximum of their occurrence is observed in the autumn–winter period, and the longest series occur between April and June. In late spring and in summer, no LTE series were usually observed. The most interesting series here lasted 80 d in 2014, from May to July (Fig. 4a). It is possible to see that only several short gaps separate this series from two others in autumn; thus, the entire period from late March to July should probably be considered one long series. Such a long sequence occupying one-third of a year definitely points to a regular process. For the other years, the same season contains majority of the LTE series, although they are separated by more frequent and wider gaps. It is interesting to see that we detect more series during a year of low solar activity (2018) than during a moderately active one (2015).
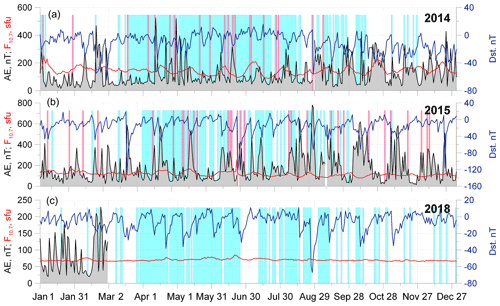
Figure 4Days with LTEs observed in the SH (blue bars) during 2014 (a), 2015 (b) and 2018 (c). Plots show the annual variations in the daily average F10.7 (red line), AE (black line with gray shading) and Dst (navy blue line) indices values. Cases of bright SLTE observations are highlighted using red bars. In 2018, the AE index was only available for January and February.
The red bars in Fig. 4 mark the days when the intensity of the SLTE was higher than the intensity of the accompanying MLTE (as in Fig. 1). Such bright SLTEs were only detected during years of relatively high solar activity (2014 and 2015). Comparing their occurrence with the averaged indices, we cannot really observe clear dependence between their detection and near-Earth space conditions.
Due to the large variety of spatial forms and intensity distributions of LTEs (Fig. 2), it is not easy to select a key parameter for an analysis over 3 years. Thus, we simplified the task by analyzing variations in the maximal TEC (TECmax) value observed at 10:00 UT in a region from 30∘ W to 60∘ E and from 30 to 60∘ S. Figure 5 presents the distributions of TECmax for the entire 3 years versus the following main near-space parameters: solar flux at 10.7 nm (F10.7; Fig. 5a, e); the By (Fig. 5b) and Bz (Fig. 5f) components of the IMF; and the SYM-H (Fig. 5c) and Dst (Fig. 5g) geomagnetic indices. The relative intensity of a LTE could be analyzed using the ratio of the TECmax to the average TEC over the region (TECratio). The distributions of the TECratio versus the main parameters (not presented) are quite chaotic and do not demonstrate any pronounced dependence, except for the AE (Fig. 5d) and the IMF intensity B (Fig. 5h). AE and B also do not show a clear dependence, although the TECratio values do tend to be higher with increased AE and B values. It was found that the maximal value quite clearly depended on the F10.7 index (Fig. 5a) during active years (2014 and 2015). This was not a surprise, as the maximal value directly depends on the entire amount of electrons in ionosphere, which is driven by solar radiation. With respect to all of the other parameters, no specific dependence on them could be noted.
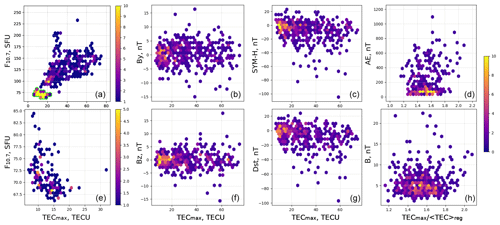
Figure 5The distributions of the maximal TEC values in a region from 30∘ W to 60∘ E and from 30 to 60∘ S versus 10.7 nm solar radiation (a, e), the By (b) and Bz (f) components of the IMF, the SYM-H (c) and Dst (g) geomagnetic indices; and the distributions of the maximal to the regional mean TEC ratio versus the AE index (d) and B (h). All of the TEC values are taken at 10:00 UT during 2014, 2015 and 2018. The distribution in panel (e) is made with data from 2018 only; these data are highlighted using green in panel (a).
When observed separately, SH LTEs were previously assumed to be a relatively rare phenomenon that was produced by a specific near-space condition (Edemskiy et al., 2018). However, the data presented in this study show that LTEs occur quite often and can be observed in series over a relatively long period during which geomagnetic conditions and solar parameters vary significantly. The distributions presented did not reveal any pronounced dependence except that between the maximal TEC value in the region and the solar flux intensity (Fig. 5a). Obviously, the TECmax linearly depends on the total amount of electrons in the ionosphere or the global electron content, and the latter is known to be dependent on the F10.7 index (e.g., Astafyeva et al., 2008). At the same time, it is surprising that the other distributions in Fig. 5 do not show a clear dependence on near-space parameters. The previous suggestion from Edemskiy et al. (2018) that SH LTEs only occur during disturbed conditions – and especially with observed negative Bz – appears not to be entirely correct.
As the LTEs were detected at 10:00 UT and occupied the same region of the SH, they displayed wide variety of shapes, making it difficult to classify them. However, the MLTE and SLTE intensities were apparently independent; this points to different mechanisms of formation that could be used as a means of classification. We selected cases of bright SLTEs (Fig. 4, red bars) and calculated the respective distributions of the TECmax and the TECratio versus AE, Bz Dst and SYM-H for these days (Fig. 6a, b, c, d) and for all of the other LTEs (Fig. 6e, f, g, h) detected in the SH over the investigated years.
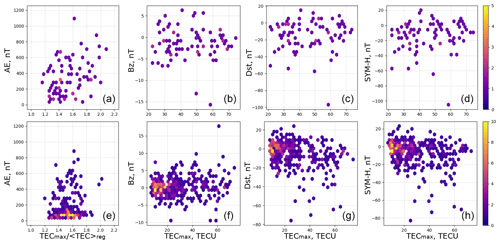
Figure 6Distributions of the TECratio and the TECmax versus the main geomagnetic indices for days with high intensity SLTEs (a–d) and for all of the other LTEs (e–h).
Figure 6 shows that most of the bright SLTEs were detected at moments of negative Dst and SYM-H as well as high AE index values. This means that bright SLTEs are often observed during disturbed geomagnetic conditions. It is known that SEDs generated at high latitudes during geomagnetic storms can be observed in the TEC maps as localized enhancements (e.g., Foster and Rideout, 2007); thus, the SLTE detected could be a manifestation of a SED.
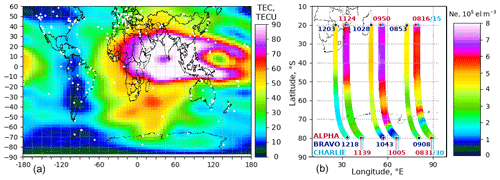
Figure 7A LTE on 18 April 2014 that was observed in the GIM (a) and in in situ measurements of Ne by SWARM satellites (b).
According to Foster (2008), SEDs are typically observed during severe geomagnetic storms and are generally formed by an F-region plasma driven upward and poleward (ExB direction) by an eastward electric field that has penetrated into the inner magnetosphere during the early phase of a geomagnetic storm. As it is formed by the fountain effect, the enhanced plasma of EIA peaks can be redistributed during extreme events when uplifting plasma reaches higher-latitude flux tubes, resulting in enhanced electron density near the plasmapause. Most often, these uplifts are observed in the dusk sector (Foster, 2008). Further development of the event can lead to the generation of a sub-auroral polarization stream, creating a SED as a connection between the dusk sector and a region of the dayside cusp. Thus, the detected SLTEs could be partially generated via the abovementioned mechanism.
Several features of SLTEs should be highlighted. First, intense SLTEs were also detected during a relatively quiet period. At least a quarter of them were detected with AE index values lower that 200 nT (Fig. 6a). Second, most SEDs are believed to be plume-shaped, clearly connected to the EIA region and have high intensities along the entire plume. The criteria used to determine LTEs excluded both the stretched formations and those with a connection to the EIA. Therefore, not all SLTEs are produced by SEDs, and, even if they are, the mechanism of their generation should differ from that in the NH.
Measurements of the electron concentration by SWARM clearly confirm the presence of SLTEs when only generally enhanced Ne values are presented at middle latitudes (Fig. 2) without a clear MLTE maximum. This apparent absence of the MLTE could be explained by the orbit position: all of the satellite overpasses on 5 April crossed MLTE at its east edge (at 10:00 UT, it was at about 70∘ E) where the TEC falls and does not show a significant peak. Due to their orbital motion, the SWARM satellites appear over the same region at different times, and at some moments it is possible to see an exact intersection of a LTE. On 18 April 2014, a pronounced LTE was observed in both GIMs and Ne measurements (Fig. 7). It is quite clear from Fig. 7 that the enhanced concentration is observed at the altitudes of both the Alpha and Charlie (460 km) and Bravo (530 km) satellite orbits. This, combined with the data shown in Fig. 2, makes a strong case for the fact that LTEs of both types (MLTE and SLTE) are predominantly located in the F2 region.
Midlatitudinal LTEs are mostly detected in the same region of the SH (at 10:00 UT), but they demonstrate a wide variety of shapes. It is difficult to say that their generation is driven by space weather, as no clear dependence on the main space weather parameters was found for the occurrence rate or the intensities of LTEs. Thus, the mechanism of LTE formation is most likely connected to some kind of plasma redistribution, as the enhancements were most often observed during the autumn–winter period (April–August, Fig. 4) when the intensity of solar ionization in the middle latitudes should be less effective than during summer. Apparently, the mechanism is not connected to or is not organized like the fountain effect, as the fountain effect typically causes a quasi-symmetrical (with respect to the Equator) pattern, and similar LTEs were not detected in the magneto-conjugated region of the NH. Moreover, the intensities of the TECs in the corresponding part of the NH during LTE detection are typically lower than those in the SH. This seasonal asymmetry is reminiscent of the winter anomaly (WA) phenomenon: the F2-layer density values are greater in the winter hemisphere than in the summer hemisphere. Using COSMIC RO data, Gowtam and Tulasi Ram (2017) showed that the WA effect is confined to the morning–noon hours and to low latitudes at altitudes between 300 and 700 km, and they claimed that the WA was absent at middle latitudes. By analyzing GIMs and satellite data, Yasukevich et al. (2018) confirmed that the SH WA was much less pronounced than the NH WA; moreover, it is mostly observed in the southern region of Indian Ocean. The authors also showed the dependence of the anomaly intensity on solar activity and claimed that it could only be observed during high solar activity years. Furthermore, they concluded that the anomaly in the TEC could only be observed in periods with F10.7 index values greater than 170 sfu. However, as shown above, while the intensity of the LTE may depend on the F10.7 value, the occurrence rate does not, and only a few LTEs were detected during periods with high F10.7 index values. Higher TEC values in the SH were also observed during periods with really low F10.7 values (entire 2018). Thus, the mechanism of LTE generation is probably not connected to the WA.
When observed dynamically, LTEs showed development along geomagnetic parallels within 30–70∘ S of geomagnetic latitude, which is approximately within the boundaries of magnetic shells L=2–4 (Fig. 1b–k), and they could be observed permanently for several days with slight changes in their form and intensity. Andersson et al. (2014) detected a hot spot of energetic electron precipitation E>300 keV in the SH at geomagnetic latitudes between 55 and 72∘ S (that was much less pronounced in the NH) and at geographic longitudes between 150∘ W and 60∘ E. However, this result is based on nighttime observations, i.e., predominantly autumn–winter observations, when almost no LTEs were detected. Using Polar Orbiting Environmental Satellites (POES) data for the analysis of the South Atlantic Anomaly, Domingos et al. (2017) found a particle flux plume located within L=2.5–3 in the South Atlantic. The position of the plume was in a good correlation with a typical LTE position; however, the plume was observed in December when the occurrence rate is minimal (Fig. 4). Moreover it was shown that particle precipitations were not responsible for the LTE that was analyzed in detail by Edemskiy et al. (2018). Thus, LTEs are most probably not directly connected to the increased fluxes.
Statistically, the electron concentration over the western part of the Indian Ocean is enhanced during equinox periods. By investigating TOPEX data from 1992 to 2005, Jee et al. (2009) showed that noontime TEC values were significantly increased over the southern part of Africa and its Indian Ocean shore between March and April. A similar increment with a lower intensity is shown between September and October. In summertime, it is still possible to observe this enhancement with a much lower intensity. In winter, the region of enhanced TEC depends on solar activity: during high activity periods, no enhancement is observed; during low activity periods, the Equatorial Anomaly area grows, reaching 30∘ S over Africa, and the TEC values south of Africa also increase. Our results show a higher probability of wintertime LTE detection during lower activity years. Analyzing the GIMs for 1998–2015, Lean et al. (2016) found typically enhanced TEC over the region from 10:00 to 16:00 UT and, according to data from 2000 to 2002, the highest values occur between March and May.
In conclusion, the LTE generation mechanism is still currently unclear. The phenomenon of the SH LTE is observed quite regularly during periods of different solar activity and under different near-space conditions, even manifesting itself during geomagnetically quiet periods. As we did not detect symmetrical phenomena in the NH, we could conclude that the enhancements are a feature of the SH ionosphere and, therefore, should be driven by a combination of its specific conditions, such as the geomagnetic field, the oceanic ionosphere and the system of winds. Such a regular phenomenon should also be taken into account by models. Currently, it is difficult to say if it is reproduced by models, as it is not well described in the literature. However, it is noteworthy that Lee et al. (2011) showed the presence of enhanced electron concentration formation over the western part of the Indian Ocean using measurements from GRACE and CHAMP satellites. The authors concluded that 2001 and 2007 IRI models did not predict the observed enhancement at all. Therefore, the phenomenon should be investigated more precisely, as it will surely give us more clear understanding of global distribution of ionospheric plasma.
This paper shows that localized TEC enhancements in the SH are observed quite regularly and can be detected in serial. As they have a clear seasonal asymmetry of occurrence, they do not show any pronounced dependence on space weather parameters. Enhancements can be detected during both disturbed and relatively quiet geomagnetic periods with different levels of solar activity. Midlatitudinal and subpolar LTEs seem to have different mechanism of generation and should therefore be investigated separately in more detail. At least half of the observed SLTEs were detected during disturbed conditions and could be connected to SED structures. However, some of them occurred during relatively quiet conditions, which means that the generation of SLTEs could be driven by several different mechanisms. Midlatitudinal LTEs are observed more regularly and show a larger variety of shapes and intensities. TEC values during MLTE detection are typically higher than those in the conjugated region of the NH. The absence of a clear dependence of the occurrence rate of MLTEs on space weather makes it difficult to propose any specific mechanism for their generation.
The data presented lead us to the opinion that, although observed LTEs are supposed to be an ionospheric disturbance, LTEs are most likely a feature of the SH ionosphere. This phenomenon should be investigated in more detail using additional methods, such as comparison with different models of the ionosphere.
All of the data used in this research are freely available from the websites listed in Sect. 2 of this article. Date of the last access to all of the listed sources is 22 April 2020.
The author declares that there is no conflict of interest.
The author is grateful to Jan Laštovička for the idea behind this investigation, for fruitful discussions and for corrections to the text. Martin Pačes is acknowledged for his kind help with obtaining SWARM data, and thanks are due to Nikolay Zolotarev for his help with the COSMIC data treatment. The author is grateful to all of the data centers that provided data, including NASA's Crustal Dynamics Data Information System (CDDIS), the CODE scientific group, and the SWARM and COSMIC mission staff. The author also wishes to thank the reviewers, who helped to improve the paper scientifically, and the editorial board, especially Dayana Santana Santana, for the significant improvements to the text.
This paper was edited by Ana G. Elias and reviewed by Maxim Klimenko and one anonymous referee.
Abdu, M. A., Batista, I. S., Carrasco, A. J., and Brum, C. G. M.: South Atlantic magnetic anomaly ionization: A review and a new focus on electrodynamic effects in the equatorial ionosphere, J. Atmos. Sol.-Terr. Phys., 67, 1643–1657, https://doi.org/10.1016/j.jastp.2005.01.014, 2005. a
Afraimovich, E. L., Astafyeva, E. I., Oinats, A. V., Yasukevich, Y. V., and Zhivetiev, I. V.: Global electron content: a new conception to track solar activity, Ann. Geophys., 26, 335–344, https://doi.org/10.5194/angeo-26-335-2008, 2008.
Alcay, S. and Oztan, G.: Analysis of global TEC prediction performance of IRI-PLAS model, Adv. Space Res., 63, 3200–3212, https://doi.org/10.1016/j.asr.2019.02.002, 2019. a
Andersson, M. E., Verronen, P. T., Rodger, C. J., Clilverd, M. A., and Wang, S.: Longitudinal hotspots in the mesospheric OH variations due to energetic electron precipitation, Atmos. Chem. Phys., 14, 1095–1105, https://doi.org/10.5194/acp-14-1095-2014, 2014. a
Astafyeva, E. I., Afraimovich, E. L., Oinats, A. V., Yasukevich, Y. V., and Zhivetiev, I. V.: Dynamics of global electron content in 1998–2005 derived from global GPS data and IRI modeling, Adv. Space Res., 42, 763–769, https://doi.org/10.1016/j.asr.2007.11.007, 2008. a
Bilitza, D.: IRI the International Standard for the Ionosphere, Adv. Radio Sci., 16, 1–11, https://doi.org/10.5194/ars-16-1-2018, 2018. a
Domingos, J., Jault, D., Pais, M. A., and Mandea, M.: The South Atlantic Anomaly throughout the solar cycle, Earth Plant Sc. Lett., 473, 154–163, https://doi.org/10.1016/j.epsl.2017.06.004, 2017. a
Edemskiy, I., Lastovicka, J., Buresova, D., Habarulema, J. B., and Nepomnyashchikh, I.: Unexpected Southern Hemisphere ionospheric response to geomagnetic storm of 15 August 2015, Ann. Geophys., 36, 71–79, https://doi.org/10.5194/angeo-36-71-2018, 2018. a, b, c, d, e, f
Foster, J. C.: Ionospheric-magnetospheric-heliospheric coupling: Storm-time thermal plasma redistribution, in: Mid-Latitude Dynamics and Disturbances, Geophys. Monogr. Ser., Vol. 181, AGU, Washington, DC, 121–134, https://doi.org/10.1029/181GM12, 2008. a, b
Foster, J. C. and Coster, A. J.: Localized stormtime enhancement of TEC at Low Latitudes in the american sector, J. Atmos. Sol.-Terr. Phys., 69, 1241–1252, 2007. a, b, c
Foster, J. C. and Rideout, W.: Storm enhanced density: magnetic conjugacy effects, Ann. Geophys., 25, 1791–1799, https://doi.org/10.5194/angeo-25-1791-2007, 2007. a
Gowtam, S. V. and Tulasi Ram, S.: Ionospheric winter anomaly and annual anomaly observed from Formosat-3/COSMIC Radio Occultation observations during the ascending phase of solar cycle 24, Adv. Space Res., 60, 1585–1593, https://doi.org/10.1016/j.asr.2017.03.017, 2017. a
Horvath, I.: A total electron content space weather study of the nighttime Weddell Sea Anomaly of 1996/1997 southern summer with TOPEX/Poseidon radar altimetry, J. Geophys. Res., 111, A12317, https://doi.org/10.1029/2006JA011679, 2006. a
Jakowski, N., Hoque, M. M., Kriegel, M., and Patidar, V.: The persistence of the NWA effect during the low solar activity period 2007–2009, J. Geophys. Res.-Space, 120, 9148–9160, https://doi.org/10.1002/2015JA021600, 2015. a
Jee, G., Burns, A. G., Kim, Y.‐H., and Wang, W.: Seasonal and solar activity variations of the Weddell Sea Anomaly observed in the TOPEX total electron content measurements, J. Geophys. Res., 114, A04307, https://doi.org/10.1029/2008JA013801, 2009. a
Karia, S. P., Kim, J., Afolayan, A. O., and Lin, T. I.: A study on Nighttime Winter Anomaly (NWA) and other related Mid-latitude Summer Nighttime Anomaly (MSNA) in the light of International Reference Ionosphere (IRI) – Model, Adv. Space Res., 63, 1949–1960, https://doi.org/10.1016/j.asr.2018.11.021, 2019. a
Karpachev, A. T. and Klimenko, M. V.: Satellite Model of FoF2 in the High-Latitude Winter Ionosphere of the Northern and Southern Hemispheres, 2nd URSI Atlantic Radio Science Meeting (AT-RASC), Meloneras, 2018, 1–4, https://doi.org/10.23919/URSI-AT-RASC.2018.8471367, 2018. a
Lean, J. L., Meier, R. R., Picone, J. M., Sassi, F., Emmert, J. T., and Richards, P. G.: Ionospheric total electron content: Spatial patterns of variability, J. Geophys. Res.-Space, 121, 10367–10402, https://doi.org/10.1002/2016JA023210, 2016. a
Lee, C. K., Han, S. C., Bilitza, D., and Chung, J.-K.: Validation of international reference ionosphere models using in situ measurements from GRACE K-band ranging system and CHAMP planar Langmuir probe, J. Geodesy, 85, 921–929, https://doi.org/10.1007/s00190-011-0442-6, 2011. a
Rocken, C., Kuo, Y. H., Schreiner, W. S., Hunt, D., Sokolovskiy, S., and McCormick, C.: COSMIC System Description, Special issue of TAO (Terrestrial), Atmos. Ocean. Sci., 11, 21–52, https://doi.org/10.3319/TAO.2000.11.1.21(COSMIC), 2000. a
Roma-Dollase, D., Hernandez-Pajares, M., Krankowski, A., Kotulak, K., Ghoddousi-Fard, R., Yuan, Y., Li, Z., Zhang, H., Shi, C., Wang, C., Feltens, J., Vergados, P., Komjathy, A., Schaer, S., Garcia-Rigo, A., and Gomez-Cama, J. M.: Consistency of seven different GNSS global ionospheric mapping techniques during one solar cycle, J. Geodesy, 92, 691–706, https://doi.org/10.1007/s00190-017-1088-9, 2018. a
Shepherd, S. G.: Altitude-adjusted corrected geomagnetic coordinates: Definition and functional approximations, J. Geophys. Res., 119, 7501–7521, https://doi.org/10.1002/2014JA020264, 2014. a
Yasyukevich, Y. V., Yasyukevich, A. S., Ratovsky, K. G., Klimenko, M. V., Klimenko, V. V., and Chirik, N. V.: Winter anomaly in NmF2 and TEC: when and where it can occur, J. Space Weather Space Clim., 8, 1–14, https://doi.org/10.1051/swsc/2018036, 2018. a, b


