the Creative Commons Attribution 4.0 License.
the Creative Commons Attribution 4.0 License.
Characterization of gravity waves in the lower ionosphere using very low frequency observations at Comandante Ferraz Brazilian Antarctic Station
Emilia Correia
Luis Tiago Medeiros Raunheitte
José Valentin Bageston
Dino Enrico D'Amico
The goal of this work is to investigate the gravity wave (GW) characteristics in the low ionosphere using very low frequency (VLF) radio signals. The spatial modulations produced by the GWs affect the conditions of the electron density at reflection height of the VLF signals, which produce fluctuations of the electrical conductivity in the D region that can be detected as variations in the amplitude and phase of VLF narrowband signals. The analysis considered the VLF signal transmitted from the US Cutler, Maine (NAA) station that was received at Comandante Ferraz Brazilian Antarctic Station (EACF, 62.1∘ S, 58.4∘ W), with its great circle path crossing the Drake Passage longitudinally. The wave periods of the GWs detected in the low ionosphere are obtained using the wavelet analysis applied to the VLF amplitude. Here the VLF technique was used as a new aspect for monitoring GW activity. It was validated comparing the wave period and duration properties of one GW event observed simultaneously with a co-located airglow all-sky imager both operating at EACF. The statistical analysis of the seasonal variation of the wave periods detected using VLF technique for 2007 showed that the GW events occurred all observed days, with the waves with a period between 5 and 10 min dominating during night hours from May to September, while during daytime hours the waves with a period between 0 and 5 min are predominant the whole year and dominate all days from November to April. These results show that VLF technique is a powerful tool to obtain the wave period and duration of GW events in the low ionosphere, with the advantage of being independent of sky conditions, and it can be used during the whole day and year-round.
- Article
(5967 KB) - Full-text XML
- BibTeX
- EndNote
The upper part of the middle atmosphere, the upper mesosphere and lower thermosphere (MLT), is dominated by the effects of the atmospheric waves (acoustic–gravity waves, gravity waves, tides and planetary waves) with periods from a few seconds to hours, which originate at tropospheric and stratospheric layers or even from in situ generation. The waves with a period below the acoustic cutoff, which is typically less than a few minutes, are classified as acoustic waves, and the waves with a period above the Brunt–Väisälä period, which is typically about 5 min, are classified as gravity waves (Beer, 1974).
During last decades, due to the recognized importance of the gravity waves (GWs) in the general circulation, structure, and variability in the MLT, and as an essential component in the Earth climate system (Fritts and Alexander, 2003; Alexander et al., 2010), these waves had been intensively investigated. For example, Ern et al. (2011), using data from the SABER instrument on board the TIMED satellite, estimated the horizontal gravity wave momentum flux and showed that the fluxes at stratospheric heights (40 km) are stronger at latitudes above 50∘ in local winter and near the subtropics in the summer hemisphere. This is in agreement with Wang et al. (2005) and Zhang et al. (2012), who used temperature soundings of the same instrument and showed high gravity wave activity over regions of strong convection located at lower latitudes in summer and over the southern Andes and Antarctica Peninsula in winter. The sources of mesospheric GW obtained through high-resolution general circulation model also show that the dominant sources are steep mountains and strong upper-tropospheric westerly jets in winter and intense subtropical monsoon convection in summer (Sato et al., 2009). Thus, any major disturbances that occur in the stratosphere can significantly modify the GW fluxes, which in turn change the thermal and wind structures of the MLT region. One of these disturbances is the sudden stratospheric warmings (e.g., Schoeberl, 1978), which are large-scale perturbation of the polar winter stratosphere where the gradients of winds and temperatures are reversed for periods of days to weeks.
Acoustic–gravity waves (AGWs) and GWs are generated simultaneously by the same tropospheric sources and produce strong temperature perturbations in the thermosphere (e.g., Snively, 2013). The atmospheric gravity waves originate in the lower atmosphere and propagate upwards, traveling through regions with decreasing density, which results in an exponential growth of their amplitudes (e.g., Andrews et al., 1987). The large wave amplitudes lead to wave breaking, which deposits the momentum flux at the MLT region, which comes mostly from waves with periods lower than 30 min (Fritts and Vincent, 1987; Vincent, 2015). Theoretical, numerical, and observational studies have improved the understanding of the GW sources, observed parameters (wavelength, period, and velocity), propagation directions (isotropic/anisotropic), spectrum of intrinsic wavelengths and periods, and moment fluxes, as well as their impact in the MLT region. A variety of techniques have been used to obtain wave parameters, such as the horizontal and vertical wavelengths, phase speeds, and periods, involving satellite observations as well as ground-based instrumentation. Each technique has its own strengths and limitations as presented, for example, by Vincent (2015).
The GW activity has been extensively observed mainly by using airglow all-sky imagers that permit one to obtain the horizontal wave parameters and the propagation directions of the small-scale waves (e g., Taylor et al., 1995). In airglow imagers the GWs are seen as intensity variations of the optical emission from airglow layers located at the MLT region (80–100 km altitude), but this technique requires dark and cloud-free conditions during the night. Particularly at high latitudes it is impossible to observe the nightglow during the summer since there are no totally dark conditions during this season.
In order to avoid the limitations of the optical airglow observations, other techniques using radio soundings started to be used to characterize the mesospheric GWs in the ionospheric D and E regions. The propagation of GWs through the mesosphere induces spatial modulations in the neutral density, which modulates the electron production rate and the effective collision frequency between the neutral components and electrons in the lower ionosphere. The ionospheric absorption of the cosmic radio noise is a function of the product of these two parameters, and so the fluctuations produced by the effect of GWs can be detected by imaging riometers. The ionospheric absorption modulations observed with different riometer beams permit one to infer the gravity wave parameters such as the phase velocity, period, and direction of propagation, as demonstrated by Jarvis et al. (2003) and Moffat-Griffin et al. (2008). They validated this technique comparing mesospheric GW signatures observed by using both a co-located imaging riometer and airglow imager. AGWs in the ionosphere have been mapped using Global Positioning System total electron content data. As reported by Nishioka et al. (2013), both AGWs and GWs are often observed to persist over hours.
The atmospheric gravity waves can also be detected in the lower ionosphere using very low frequency (VLF: 3–30 kHz) radio signals. The amplitude and phase of VLF signals propagating in the Earth–ionosphere waveguide are affected by the conditions of the local electron density at reflection height, which is in the ionospheric D region. The spatial modulations produced by the GWs in the neutral density produce fluctuations of the electrical conductivity in the D region, which are detected as variations in the amplitude and phase of VLF narrowband (NB) signals. AGWs have been detected as amplitude variations of VLF signals associated with solar terminator motions (Nina and Cadez, 2013), with the passage of tropical cyclones crossing the transmitter–receiver VLF propagation path (Rozhnoi et al., 2014), and particularly during nighttime, in association with local convective and lightning activity (Marshall and Snively, 2014). Planetary wave signatures have also been detected in the VLF NB amplitude data, whose effects are pronounced during wintertime and present a predominant quasi 16 d oscillation (Correia et al., 2011, 2013; Schmitter, 2012; Pal et al., 2015).
The advantage of using radio techniques to observe AGWs instead of the optical ones is that they are able to provide observations independently of the sky conditions, even during the daytime, and year-round. The purpose of this paper is to present the characterization of the GW events detected in the lower ionosphere from the analysis of the VLF NB amplitude of signals detected at Comandante Ferraz Brazilian Antarctic Station (EACF). The wave parameters such as the period and the time duration of the GW activity will be obtained from the spectral analysis of the VLF amplitude fluctuations. The methodology using the VLF technique is validated comparing the derived parameters of one GW event detected simultaneously with a co-located airglow all-sky imager.
The VLF signals propagate over long distances via multiple reflections, with considerably low attenuation, and are detected by VLF receivers after being reflected in the lower ionosphere at ∼70–90 km of height (e.g., Wait and Spies, 1964). The changes detected in the amplitude and phase of the VLF NB signals give information on the D-region physical and dynamic conditions along the transmitter–receiver great circle path (GCP), which are associated with the ionosphere electrical conductivity. This analysis uses VLF signals transmitted from the US Navy stations at Cutler, Maine (24.0 kHz, NAA), and at Lualualei, Hawaii (21.4 kHz, NPM), which after propagating along the GCPs NAA–EACF and NPM–EACF were detected with 1 s time resolution using an AWESOME receiver (Scherrer et al., 2008) operating at EACF (62.1∘ S, 58.4∘ W) station located on King George Island in the Antarctic Peninsula (Fig. 1).
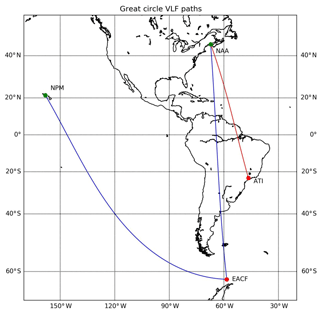
Figure 1VLF propagation paths from NAA and NPM transmitters to the receiver stations located at Comandante Ferraz Brazilian Antarctic Station (EACF) (blue paths) and Atibaia, São Paulo (red path).
The GW parameters were obtained from the VLF NB amplitude signals using a wavelet spectral analysis, which gives the wave period and time duration of GW activity, as will be described in the following section. To demonstrate the potentiality of usage of the VLF technique to observe GWs, the spectral analysis is applied during the night of 10 June 2007, when a prominent GW event (mesospheric front) occurred. It was well observed and characterized by using a co-located airglow imager along with temperature profiles from TIMED/SABER and horizontal winds from a medium-frequency (MF) radar operated at Rothera Station (Bageston et al., 2011). Afterwards, a year-round climatology of GWs of parameters related to the wave periods was obtained from the amplitude data of VLF signals propagating in the NAA–EACF GCP for the full year of 2007.
2.1 Wavelet spectral analysis
The wavelet analysis was used to obtain the parameters of VLF amplitude signal fluctuations, which might be associated with the time and duration of the GW event and the period range it covers. The tool used was developed by Torrence and Compo (1998) and includes the rectification of the bias in favor of large scales in the wavelet power spectrum, which was introduced by Liu et al. (2007). The analysis uses the Morlet mother wavelet with a frequency parameter equal to 6, significance level of 95 %, and time lag of 0.72 (Torrence and Compo, 1998). The wavelet analysis returns the following general results: the power spectrum; the global wavelet spectra, which measures the time-averaged wavelet power spectra over a certain period and its significance level; and scale-averaged wavelet power, which is the weighted sum of the wavelet power spectrum over 2 to 64 bands.
The wavelet analysis was applied to the VLF data obtained at EACF during the night of 10 July 2007, when a GW event was observed with a co-located airglow imager. This was done to compare the wave period and event duration parameters obtained from VLF data with the ones obtained from all-sky images.
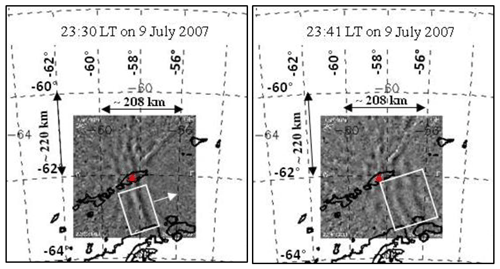
Figure 2Processed all-sky images of the GW event observed at EACF (red symbol) at 23:30 and 23:41 LT (UT−3) on the night of 9–10 July 2007, showing the mesospheric front (white box) propagating from west/southwest to east/northeast (arrow direction in the first image). The images were projected at the mesospheric layer in order to have a spatial area as good as 312 km × 312 km without significant distortion in the unwrapped images.
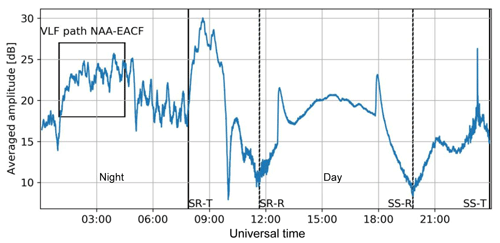
Figure 3VLF amplitude from NAA transmitter station detected with 15 s time resolution at EACF on 10 July 2007. The vertical lines mark the sunrise (SR) and sunset (SS) at NAA transmitter station (T, full lines) and at receiver station (R, dashed lines). The periods of completely night and day in the NAA–EACF VLF path are identified. The box marks the time interval of data used to perform the spectral analysis.
Figure 2 shows two processed airglow images plotted in geographical coordinates, centered at Comandante Ferraz Station (denoted by the red symbol) and observed on the night of 9–10 July 2007, when it was possible to identify a gravity wave event (inside the white box) in the upper mesosphere by using a wideband near-infrared hydroxyl (OH-NIR) filter. The wave propagation direction is denoted by the arrow put just ahead of the box in the first image. The date and time of observation are indicated at the top of the map. The latitude and longitude (each 2∘ apart) are also shown, as well as the horizontal distances (in km), respectively in latitude and longitude, just above and on the left of the airglow images, for distances of 2∘ (in latitude) and 4∘ (in longitude). The images were processed as follows: star's field subtraction, correcting for the fish-eye lens format, and application of the time difference (TD) image processing to a short set of images. The small projected area (312 km × 312 km, resolution of 1 km per pixel) was caused by the limitations of the CCD size relative to the optical system since this is a low-cost CCD that was adapted in an old optical system (nowadays the optical system is reassembled to allow a useful area in the CCD of 512 pixels × 512 pixels).This mesospheric GW was classified by Bageston et al. (2011) as a mesospheric front observed at EACF from about 23:20 LT (LT = UT−3) up to 23:53 LT. The analysis was performed from 23:20 to 23:42 LT, when an increase in the number of wave crests was visible in the wave packet when it propagates across the field of view of the sky, and this growth rate was inferred as four waves crest per hour (Bageston et al., 2011). The fast Fourier transform 2D spectral analysis was applied to six images from 23:32 to 23:38 LT on 9 July (02:32 to 02:38 UT on 10 July), and the following wave parameters were obtained: horizontal wavelength of 33 km, observed period of 6 min, and observed phase speed of 92 m s−1. During the same night, this event was observed with a co-located near-zenithal (field of view about 22∘ off-zenith) temperature airglow imaging spectrometer, which observes the OH (6–2) band emission (FotAntar-3, Bageston et al., 2007). The spectral analysis of the temperature showed evidence of gravity waves of small scale with a predominant period of ∼14 min (Bageston et al., 2011). Since the spectrometer has a smaller field of view (∼70 km in diameter) compared to the all-sky imager (∼300 km of diameter in the un-warped images), the larger predominant periodicity obtained from the temperature could be one component of the main wave observed with the airglow all-sky imager (Bageston et al., 2011). These parameters are similar to the ones obtained for mesospheric fronts or bore-type events, which were understood as a rare type of gravity waves at polar latitudes and were first observed at Halley Station in May 2001 (Nielsen et al., 2006). Nowadays, with more observations, it is clear that the mesospheric fronts or bores are more likely to be observed at middle to high latitudes (even in unexpected places such as the South Pole) as can be noted in the recent studies on this subject (e.g., Pautet et al., 2018; Giongo et al., 2018; Hozumi et al., 2018).
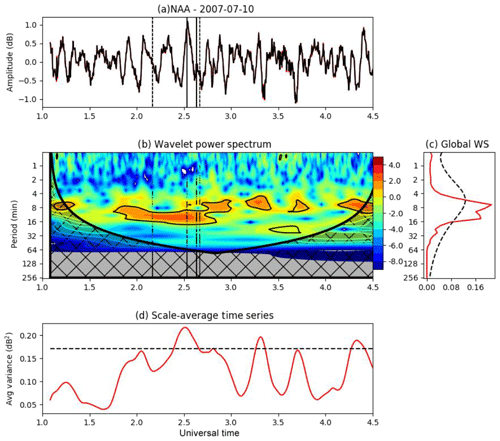
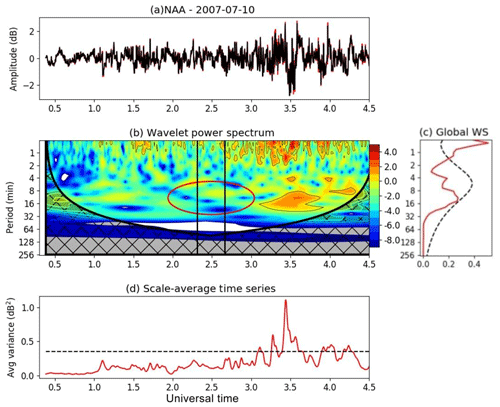
Figure 4Example of wavelet spectral analysis applied to the VLF amplitude signal in the NAA–EACF GCP on 10 July 2007. (a) The residual VLF amplitude after subtracting the raw data from a 10 min running mean. (b) Wavelet power spectra in logarithm (base 2), with regions of confidence levels greater than 95 % (showed with black contours), and the cross-hatched areas indicating the regions where edge effects become important. (c) Time-averaged wavelet power spectra (Global WS). (d) Scale-averaged wavelet power.
The VLF amplitude from NAA transmitter detected at EACF on 10 July 2007 is shown in Fig. 3, where the vertical lines identify the sunrise and sunset hours at the transmitter (SR-T and SS-T, full lines) and receiver (SR-R and SS-R, dashed lines) stations. The wavelet spectral analysis (Fig. 4) was applied to the VLF data from 01:00 to 04:30 UT (22:00 LT 9 June to 01:30 LT on 10 June, box in Fig. 3), which covers the nighttime interval of the images obtained with the co-located all-sky imager.
Figure 4 shows the spectral analysis applied to the VLF amplitude data. The analysis is applied to the residual value obtained after subtracting the raw data from a 12 min running mean (Fig. 4a), which implies in an upper cutoff period of ∼30 min in order to characterize the small-scale and short-period waves. Figure 4a clearly shows four strong fluctuations in the VLF amplitude between 01:50 and 02:40 UT (22:50 and 23:40 LT), which occurred in close temporal association with the crests identified in the airglow images. The last VLF fluctuation was the strongest one and ended at ∼02:40 UT (23:40 LT), near the time when the wave packet started to dissipate as observed in the airglow images (Bageston et al., 2011). The power spectrum of the residual VLF amplitude (Fig. 4b) shows strong significant components with periods between 4 and 16 min, with stronger peaks at ∼6 and 14 min. The global wavelet spectrum (Fig. 4c) shows a stronger component with period between 4 and 8 min that is due six significant events of ∼20 min duration (Fig. 4d), with one of them occurring from 02:32 to 02:38 UT (23:32 to 23:38 LT), which is the same time interval a wave period of 6 min was identified in the airglow images. The other significant component with a peak at ∼14 min is present from 01:50 to 02:40 UT (Fig. 4d), the same time interval when the four crests of the mesospheric front were identified in the airglow images. They occurred in close temporal association with the identification of gravity waves with the same period in the spectral analysis of the OH temperature obtained with the co-located imaging spectrometer (Bageston et al., 2011).
Since the VLF path is quite long, we have performed one test to make sure that the wave event was the same one detected near EACF and not at any other location in the path between the transmitter and receiver. This test considers the wavelet analysis applied to the VLF path NAA–Atibaia (NAA–ATI), which is almost the same trajectory of NAA–EACF, but its length is ∼50 % shorter. Figure 5 shows no wave events at the time the event was detected in the NAA–EACF path that had association with the GW seen in the airglow imager, evidencing that the event occurred in the part of the VLF trajectory closer the EACF station. This test confirms the GW events detected by VLF technique in the NAA–EACF path occurred near the Antarctic Peninsula and could be associated with the events observed by the airglow imager operating at EACF.
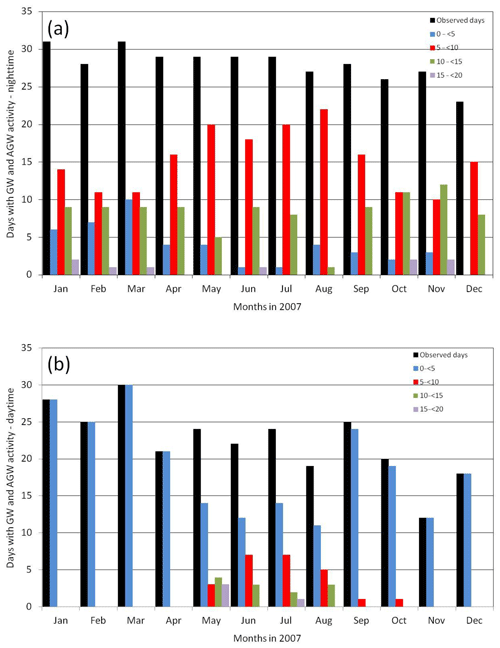
Figure 6Monthly small-scale wave activity at EACF as detected in the low ionosphere using VLF technique during 2007 during night (a) and daytime (b) hours. The black bar shows the number of the observed days per month, and the colored bars show the number of nights and days per month with GW events observed according to the wave predominant periods. The bar colors give the number of waves with predominant period observed in each month separated as the following period intervals: 0–5 (blue), 5–10 (red), 10–15 (green), and 15–20 min (purple).
The characterization of the GWs using VLF amplitude data using wavelet analysis demonstrated the viability for the usage of VLF signals to obtain the period and time duration of the GW events. The use of VLF observations to characterize the GW events permits one to obtain their climatology all year-round since they are not affected by the atmospheric conditions and also can be done during daytime.
2.2 Climatology of GW period from VLF signal
The GW climatology was made based on the wavelet analysis applied to the VLF amplitude signal detected during both the nighttime and daytime hours in the NAA–EACF GCP for the full 2007 year. The wave period from the VLF technique is the predominant component with the highest relative power amplitude in the global wavelet power spectrum. For example, in the analysis done in the previous subsection, the predominant wave period was ∼6 min. The wave period year-round climatology obtained via the VLF technique during nighttime is compared with the one obtained with the co-located airglow imager.
Here the statistical analysis is presented of the predominant wave period of the GW events detected in the low ionosphere as amplitude fluctuations of the VLF signals, which is a new aspect of using the VLF technique. The analysis uses the VLF signal received at EACF during the whole year of 2007, and it is performed independently during nighttime (21:00–05:00 LT) and daytime (11:00–16:00 LT) hours, in order to avoid the influence of the sunrise and sunset terminators in the spectral analysis. The nighttime wave period properties obtained via VLF were used to compare with the wave period characteristics obtained with the co-located airglow all-sky imager.
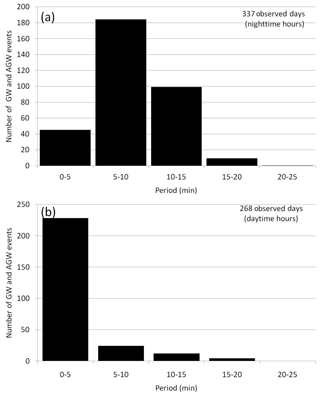
Figure 7Histogram plots of the predominant observed wave periods of the small-scale GWs detected in the lower portion of the ionosphere as amplitude variations of the VLF signal propagating in the NAA–EACF during night (a) and daytime (b) hours.
The solar activity during 2007 was at lower levels since this year was near the minimum phase of the 23rd solar cycle. So it was a period of low occurrence of solar flares, most of them of GOES C class. In order to avoid the effect of D-region electron density changes associated with flares, the periods disturbed by the impact of flares were not used in the daytime wavelet analysis of VLF signal. The geomagnetic conditions were at lower levels during 2007 with 85 % of the geomagnetic storms having the Dst index peak higher than −50 nT (weak storm) and only two moderate storms with Dst peak nT. The monthly Dst values were higher than −15 nT and kp lower than 2, which means low-level geomagnetic activity.
Figure 6 shows the seasonal variation of GW occurrence rate per month evaluated from the number of VLF observed days per month (black bars) and the respective number of nights (Fig. 6a) and days (Fig. 6b) with events detected in the low ionosphere. Small-scale GW events were detected during all nights and days of observations, with the predominant wave periods between 0 and 25 min, which are distributed in five period ranges from 0 to 25 min (0–5, 5–10, 10–15, 15–20, and 20–25). The occurrence rate of the events detected during nighttime (Fig. 6a) shows that the waves with a period between 5 and 10 min occurred at a higher number from May to September (> 60 %, winter season). They are followed by the waves with a period between 10 and 15 min, which occurred at a higher number from October to November, suggesting an equinoctial distribution. Waves with periods < 5 min (AGWs) also suggest an equinoctial distribution but with a higher occurrence in March. The distribution of the waves with a period between 15 and 25 min suggests a higher occurrence from October to March (Antarctic summer season). The distribution of the GWs with periods from 5 to 10 min is in excellent agreement with the statistical results of the GW events observed by the co-located airglow all-sky imager, which showed the majority of the waves (∼85 %) were observed between June and September (Bageston et al., 2009). The daytime analysis (Fig. 6b) shows the AGWs (period < 5 min) predominate all days (100 %) from November to April, while the waves with a period between 5 and 10 min were predominant some days from May to October with a higher occurrence between June and July (Antarctic winter season), followed by the waves with a period between 10 and 20 min dominating for only a few days from May to August with a lower occurrence in July.
Figure 7 shows the histogram plots containing the distribution of the predominant wave period of the wave events detected in the lower ionosphere using the VLF technique for the 337 nights and 268 d of observations in 2007. During nighttime (Fig. 7a), the predominant wave periods were mostly distributed between 5 and 15 min (∼80 %), with a higher number of occurrences between 5 and 10 min (∼ 50 %) and a smaller number of occurrences (∼10 %) of waves with periods below 5 min (AGWs). This wave period distribution for small-scale and short-period GWs is in good agreement with the statistics reported by Bageston et al. (2009) from the analysis of 234 GWs observed with a co-located airglow all-sky imager from April to October 2007. On the other hand, during the daytime the predominant wave periods were concentrated between 0 and 5 min (∼85 %), in the AGW range, followed by the GWs with a period between 5 and 10 min (∼10 %) and few waves (∼5 %) with periods between 10 and 20 min.
In this work we presented an investigation of the GW characteristics in the low ionosphere, where they produce density fluctuations that were detected as amplitude variations of VLF signals. The analysis used the VLF signal transmitted from the US Cutler, Maine (NAA) station that was received at Comandante Ferraz Brazilian Antarctic Station (EACF), with a great circle path crossing the Drake Passage longitudinally. The wavelet analysis of the VLF amplitude considered the predominant small-scale wave periods observed during the daytime and night hours separately, in order to compare the wave periods observed during nighttime with the ones obtained from a co-located airglow all-sky imager. The use of the VLF technique was validated by comparing the wave period and duration properties of one GW event observed simultaneously with a co-located airglow all-sky imager.
The statistical analysis of the wave period of the GW events detected at EACF using the VLF technique for 2007 showed that the GW events were observed almost all days with VLF observations. During nighttime the waves with periods between 5 and 10 min are dominant (55 %), presenting a higher occurrence rate (large activity) per month from May to September with the maximum in June–July. The next predominantly more frequent waves have periods ranging from 10 to 15 min (30 %), followed by few events (10 %) with periods lower than 5 min (AGWs). Both waves suggested an equinoctial distribution with the waves with periods between 10 and 15 min occurring at a higher number in November and the shorter-period waves in March. The wave period distribution of the 5 to 10 min component is in good agreement with the wave period distribution of the GW events observed during 2007 with the co-located airglow all-sky imager. On the other hand, during daytime the waves with a period below 5 min are dominant (85 %), and particularly from November to April they dominated all days of the months, followed by the waves with a period between 5 and 10 min (10 %), which dominate for a few days from May to October and present a higher occurrence from June to July, and finally for the waves with periods between 10 and 20 min (5 %) that dominate just for a few days from May to August with a lower occurrence rate in July.
These results show that the VLF technique is a powerful tool to obtain the wave period and duration of GW events in the low ionosphere, with the advantage of being independent of sky conditions. It can also be used during the whole day and year-round. The VLF technique also shows its potentiality to simultaneously obtain the properties of the AGWs and GWs, which is important to better define the generation mechanisms of these atmospheric waves and their relevance in the Earth's thermosphere. The analysis of wave events using VLF signals from two distinct transmitter stations ∼100∘ apart in longitude (e.g., NAA–EACF and NPM–EACF) could also be used to obtain information about the velocity and direction of propagation of the GW events, but these tasks will be the subject of future work.
The VLF data from EACF station are available upon request from the corresponding author at ecorreia@craam.mackenzie.br. Airglow images from EACF can be solicited directly by email to José Valentin Bageston (bageston@gmail.com).
EC conceived the study, led the implementation of data processing and analysis, and actively contributed to the discussion of results and paper writing. JVB assisted in conceiving the study, contributed to the data processing and analysis, and discussion of results and paper writing. LTMR and DED'A as Ms students also did a significant part of the data analysis work and helped with the interpretation of the results.
The authors declare that they have no conflict of interest.
This article is part of the special issue “7th Brazilian meeting on space geophysics and aeronomy”. It is a result of the Brazilian meeting on Space Geophysics and Aeronomy, Santa Maria/RS, Brazil, 5–9 November 2018.
Emilia Correia thanks the National Council for Scientific and Technological Development – CNPq, São Paulo Research Foundation – FAPESP for individual research support, and the National Institute for Space Research (INPE/MCTI). The authors also acknowledge the support of the Brazilian Ministry of Science, Technology, Innovation and Communications (MCTIc); the Ministry of the Environment (MMA); and Inter-Ministry Commission for Sea Resources (CIRM). Luis Tiago Medeiros Raunheitte thanks the Coordenação de Aperfeiçoamento de Pessoal de Nível Superior – Brasil (CAPES) – Finance Code 001.
This research has been supported by the Conselho Nacional de Desenvolvimento Científico e Tecnológico – CNPq (grant nos. 406690/2013-8 and 303299/2016-9), the São Paulo Research Foundation – FAPESP (grant no. 2019/05455-2), and the Coordenação de Aperfeiçoamento de Pessoal de Nível Superior – Brasil (CAPES) – Finance Code 001.
This paper was edited by Inez Batista and reviewed by two anonymous referees.
Alexander, M. J., Geller, M., McLandress, C., Polavarapu, S., Preusse, P., Sassi, F., Sato, K., Ern, M., Hertzog, A., Kawatani, Y., Pulido, M., Shaw, T., Sigmond, M., Vincent, R., and Watanabe, S.: Recent developments in gravity wave effects in climate models and the global distribution of gravity wave momentum flux from observations and models, Q. J. R. Meteorol. Soc., 136, 1103–1124, https://doi.org/10.1002/qj.637, 2010.
Andrews, D. G., Holton, J. R., and Leovy, C. B.: Middle atmosphere dynamics, Academic Press, London, 489 pp., 1987.
Bageston, J. V., Gobbi, D., Tahakashi, H., and Wrasse, C. M.: Development of Airglow OH Temperature Imager for Mesospheric Study, Revista Brasileira de Geofísica, 25, 27–34, https://doi.org/10.1590/S0102-261X2007000600004, 2007.
Bageston, J. V., Wrasse, C. M., Gobbi, D., Takahashi, H., and Souza, P. B.: Observation of mesospheric gravity waves at Comandante Ferraz Antarctica Station (62∘ S), Ann. Geophys., 27, 2593–2598, https://doi.org/10.5194/angeo-27-2593-2009, 2009.
Bageston, J. V., Wrasse, C. M., Batista, P. P., Hibbins, R. E., Fritts, D. C., Gobbi, D., and Andrioli, V. F.: Observation of a mesospheric front in a thermal-doppler duct over King George Island, Antarctica, Atmos. Chem. Phys., 11, 12137–12147, https://doi.org/10.5194/acp-11-12137-2011, 2011.
Beer, T.: Atmospheric Waves, John Wiley, New York, 300 pp., 1974.
Correia, E., Kaufmann, P., Raulin, J.-P., Bertoni, F., and Gavilan, H. R.: Analysis of daytime ionosphere behavior between 2004 and 2008 in Antarctica, J. Atmos. Sol.-Terr. Phys., 73, 2272–2278, https://doi.org/10.1016/j.jastp.2011.06.008, 2011.
Correia, E., Raulin, J. P., Kaufmann, P., Bertoni, F. C., and Quevedo, M.T.: Inter-hemispheric analysis of daytime low ionosphere behavior from 2007 to 2011, J. Atmos. Sol.-Terr. Phys., 92, 51–58, https://doi.org/10.1016/j.jastp.2012.09.006, 2013.
Ern, M., Preusse, P., Gille, J. C., Hepplewhite, C. L., Mlynczak, M. G., Russell III, J. M., and Riese, M.: Implications for atmospheric dynamics derived from global observations of gravity wave momentum flux in stratosphere and mesosphere, J. Geophys. Res., 116, D19107, https://doi.org/10.1029/2011JD015821, 2011.
Fritts, D. C. and Vincent, R. A.: Mesospheric momentum flux studies at Adelaid, Australia: Observations and a gravity wave-tidal interaction model, J. Atmos. Sci., 44, 605–619, 1987
Fritts, D. C. and Alexander, M. J.: Gravity wave dynamics and effects in the middle atmosphere, Rev. Geophys., 41, 1003, https://doi.org/10.1029/2001RG000106, 2003.
Giongo, G. A., Bageston, J. V., Batista, P. P., Wrasse, C. M., Bittencourt, G. D., Paulino, I., Paes Leme, N. M., Fritts, D. C., Janches, D., Hocking, W., and Schuch, N. J.: Mesospheric front observations by the OH airglow imager carried out at Ferraz Station on King George Island, Antarctic Peninsula, in 2011, Ann. Geophys., 36, 253–264, https://doi.org/10.5194/angeo-36-253-2018, 2018.
Hozumi, Y., Saito, A., Sakanoi, T., Yamazaki, A., and Hosokawa, K.: Mesospheric bores at southern midlatitudes observed by ISS-IMAP/VISI: a first report of an undulating wave front, Atmos. Chem. Phys., 18, 16399–16407, https://doi.org/10.5194/acp-18-16399-2018, 2018.
Jarvis, M. J., Hibbins, R. E., Taylor, M. J., and Rosenberg, T. J.: Utilizing riometry to observe gravity waves in the sunlit mesosphere, Geophys. Res. Lett., 30, 1979, https://doi.org/10.1029/2003GL017885, 2003.
Liu, Y., Liang, X. S., and Weisberg, R. H.: Rectification of the bias in the wavelet power spectrum, J. Atmos. Ocean. Techno., 24, 2093–2102, https://doi.org/10.1175/2007JTECHO511.1, 2007
Marshall, R. A. and Snively, J. B.: Very low frequency subionospheric remote sensing of thunderstorm-driven acoustic waves in the lower ionosphere, J. Geophys. Res.-Atmos., 119, 5037–5045, https://doi.org/10.1002/2014JD021594, 2014.
Moffat-Griffin, T., Hibbins, R. E., Nielsen, K., Jarvis, M. J., and Taylor, M. J.: Observing mesospheric gravity waves with an imaging riometer, J. Atmos. Sol.-Terr. Phys., 70, 1327–1335, https://doi.org/10.1016/j.jastp.2008.04.009, 2008.
Nielsen, K., Taylor, M. J., Stockwell, R., and Jarvis, M.: An unusual mesospheric bore event observed at hight latitudes over Antarctica, Geophys. Res. Lett., 33, L07803, https://doi.org/10.1029/2005GL025649, 2006.
Nina, A. and Čadež, V. M.: Detection of acoustic-gravity waves in lower ionosphere by VLF radio waves, Geophys. Res. Lett., 40, 4803–4807, https://doi.org/10.1002/grl.50931, 2013.
Nishioka, M., Tsugawa, T., Kubota, M., and Ishii, M.: Concentric waves and short-period oscillations observed in the ionosphere after the 2013 Moore EF5 tornado, Geophys. Res. Lett., 40, 5581–5586, https://doi.org/10.1002/2013GL057963, 2013.
Pal, S., Chakraborty, S., and Chakrabarti, S. K.: On the use of Very Low Frequency transmitter data for remote sensing of atmospheric gravity and planetary waves, Adv. Sp. Res., 55, 1190–1198, https://doi.org/10.1016/j.asr.2014.11.023, 2015.
Pautet, P.-D., Taylor, M. J., Snively, J. B., and Solorio, C.: Unexpected occurrence of mesospheric frontal gravity wave events over South Pole (90∘ S), J. Geophys. Res., 123, 160–173, https://doi.org/10.1002/2017JD027046, 2018.
Rozhnoi, A., Solovieva, M., Levin, B., Hayakawa, M., and Fedun, V.: Meteorological effects in the lower ionosphere as based on VLF/LF signal observations, Nat. Hazards Earth Syst. Sci., 14, 2671–2679, https://doi.org/10.5194/nhess-14-2671-2014, 2014.
Sato, K., Watanabe, S., Kawatani, Y., Amd, K., Miyazaki, Y. T., and Takahashi, M.: On the origins of mesospheric gravity waves, Geophys. Res. Lett., 36, L19801, https://doi.org/10.1029/2009GL039908, 2009.
Scherrer, D., Cohen, M., Hoeksema, T., Inan, U., Mitchell, R., and Scherrer, P.: Distributing space weather monitoring instruments and educational materials worldwide for IHY2007: the AWESOME and SID project, Adv. Space Res., 42, 1777–1785, https://doi.org/10.1016/j.asr.2007.12.013, 2008.
Schmitter, E. D.: Data analysis of low frequency transmitter signals received at a midlatitude site with regard to planetary wave activity, Adv. Radio Sci., 10, 279–284, https://doi.org/10.5194/ars-10-279-2012, 2012.
Schoeberl, M. R.: Stratospheric warmings: Observations and theory, Rev. Geophys. Space Phys., 16, 521–538, https://doi.org/10.1029/RG016i004p00521, 1978.
Snively, J. B.: Mesospheric hydroxyl airglow signatures of acoustic and gravity waves generated by transient tropospheric forcing, Geochemistry, Geophysics, Geosystems, 40, 4533–4537, https://doi.org/10.1002/grl.50886, 2013.
Taylor, M. J. and Garcia, F. J.: A two-dimensional spectral analysis of short period gravity waves imaged in the OI(557.7 nm) and near infrared OH nightglow emissions over Arecibo, Puerto Rico, Geophys. Res. Lett., 22, 2473–2476, https://doi.org/10.1029/95GL02491, 1995.
Torrence, C. and Compo, G. P.: A practical guide to wavelet analysis, Bull. Amer. Meteor. Soc., 79, 61–78, 1998.
Vincent, R. A.: The dynamics of the mesosphere and lower thermosphere: a brief review, Prog. Earth Planet. Sc., 2, 1–13, https://doi.org/10.1186/s40645-015-0035-8, 2015.
Wait, J. R. and Spies, K. P.: Characteristics of the Earth-ionosphere waveguide for VLF radio waves, US Dept. of Commerce, National Bureau of Standards, 1964.
Wang, L., Geller, M. A., and Alexander, M. J.: Spatial and temporal variations of gravity wave parameters. Part I: intrinsic frequency, wavelength, and vertical propagation direction, J. Atmos. Sci., 62, 125–142, https://doi.org/10.1175/JAS-3364.1, 2005.
Zhang, Y., Xiong, J., Liu, L., and Wan, W.: A global morphology of gravity wave activity in the stratosphere revealed by the 8-year SABER/TIMED data, J. Geophys. Res., 117, 21101, https://doi.org/10.1029/2012jd017676, 2012.


