the Creative Commons Attribution 4.0 License.
the Creative Commons Attribution 4.0 License.
Swarm field-aligned currents during a severe magnetic storm of September 2017
Swarm satellite observations are used to characterize the extreme behavior of large- and small-scale field-aligned currents (FACs) during the severe magnetic storm of September 2017. Evolutions of the current intensities and the equatorward displacement of FACs are analyzed while the satellites cross the pre-midnight, pre-noon, dusk and dawn sectors in both hemispheres. The equatorward boundaries of FACs mainly follow the dynamics of the ring current as monitored in terms of the SYM-H index. The minimum latitude of the FAC boundaries is limited to 50∘ magnetic latitude (MLat). The FAC densities are very variable and may increase dramatically, especially in the nightside ionosphere during the storm-time substorms. At the peak of substorms, the average FAC densities reach >3 µA m−2. The dawn–dusk asymmetry is manifested in the enhanced dusk-side R2 FACs in both hemispheres. In the 1 Hz data filamentary high-density structures are always observed. In the pre-noon sector, the bipolar structures (7.5 km width FACs of opposite polarities adjacent to each other) dominate, while at the other local times the upward and downward FACs tend to be latitudinally separated. The most intense small-scale FACs, up to ∼80 µA m−2, are observed just in the post-midnight sector. Simultaneous magnetic and plasma perturbations indicate that this structure is likely a current system of a mesoscale auroral arc.
- Article
(5219 KB) - Full-text XML
- BibTeX
- EndNote
Field-aligned currents (FACs) provide electrodynamic coupling of the solar wind–magnetosphere–ionosphere system. FACs flow along the high-conducting geomagnetic field lines between different magnetospheric domains and the high-latitude ionosphere. The current system is driven by the internal magnetospheric circulation of the plasma and magnetic field within the global reconnection cycle (Dungey, 1961; Cowley and Lockwood, 1992) and by additional viscous-like interaction at the flanks of the magnetosphere (Axford, 1964). Configuration of FACs is primarily controlled by the interplanetary magnetic field (IMF) orientation (Bythrow et al., 1984; Potemra et al., 1984). Other parameters of the solar wind (velocity, density, IMF strength) and the ionospheric conductivity also play a role (e.g., Christiansen et al., 2002; Ridley, 2007; Korth et al., 2010).
Schematic distribution of large-scale FACs was established by Iijima and Potemra (1976) based on Triad satellite data. Subsequent space missions allowed construction of comprehensive empirical models of FACs parameterized by the IMF direction and strength, by season, and by hemisphere (Weimer, 2001; Papitashvili et al., 2002; Green et al., 2009). The ionospheric projection of the 3-D FAC system consists of a pair of sheets elongated approximately along the magnetic latitude, namely, Region 1 (R1) and Region 2 (R2), with opposite current flow directions in the morning and evening local time sectors and additional current sheets (R0) located on the day side poleward of R1/R2. R1 FAC flows into the ionosphere (downward current) and from the ionosphere (upward current) on the dawn and dusk sides, respectively. R1 currents, if they reside on closed field lines of the Earth's magnetic field, are believed to originate in either the boundary layer or in the plasma sheet (Ganushkina et al., 2015). R2 FAC is considered to be a diversion of the partial ring current to the ionosphere driven by pressure gradients in the inner magnetosphere (Cowley, 2000). R0 current is connected to the dayside magnetopause, and its polarity strongly depends on the IMF By component. In the Northern Hemisphere, the R0 current flows predominantly out of the ionosphere for positive IMF By and into the ionosphere for negative IMF By (Papitashvili et al., 2002; Lukianova et al., 2012). Additional current associated with the sunward ionospheric flow may appear inside the polar cap if IMF Bz is northward (Iijima et al., 1984; Vennerstrøm et al., 2002).
While average large-scale (>150 km) current densities typically are in units of µA m−2 or less, instantaneous small-scale FACs may reach several hundred µA m−2 (Neubert and Christiansen, 2003). The smaller-scale structures are often associated with auroral arcs which are accompanied by ionospheric conductivity and electric field perturbations (Aikio et al., 2002; Juusola et al., 2016). In particular, it was shown that in the evening (morning) sector, there is downward FAC equatorward (poleward) of the arc and upward FAC above the arc. These two FAC regions are connected by a poleward (equatorward) horizontal current. Recent studies also confirmed that the cusp plasma injections are accompanied by pairs of FACs, upward at lower latitude and downward at higher latitude (Marchaudon et al., 2006).
Significant differences in the characteristics of FACs at different scales, especially near noon and midnight, have been found (Gjerloev et al., 2011; Lühr et al., 2015; McGranaghan et al., 2017). Under stationary conditions the FAC system evolves in accordance with the reconnection rate, which is controlled primarily by the solar wind. If a substorm occurs, additional FACs form a current wedge connecting the cross-tail current and the nightside westward ionospheric electrojet (Akasofu, 1964; Lui, 1996). The magnitude of existing large-scale FACs also increases (Iijima and Potemra, 1978; Coxon et al., 2014). The dayside R1 currents are found to be stronger than their nightside counterpart during the substorm growth phase; at the same time R1 moves equatorward. After expansion-phase onset, the nightside R1 currents dominate and their location moves to higher latitudes (Clausen et al., 2013). Recent studies have also suggested that the substorm current wedge could also include an R2 current system (Ritter and Lühr, 2008).
Magnetic storms are characterized by a dramatic enhancement of energy deposition to the Earth's atmosphere. During a magnetic storm, FACs become highly dynamic because of the enhanced solar-wind–magnetosphere interaction, release of energy stored previously in the magnetotail, particle precipitation and ring current build-up. Storm-time FACs are stronger and more variable compared to non-storm FACs predicted by the climatological models. Since the intensity and time evolution of FACs vary from storm to storm, it is of interest to analyze their unique characteristics. However, relatively few papers focus on observed storm-time FACs. For example, utilizing the magnetic field measurements by the CHAMP satellite, Wang et al. (2006) investigated the Northern Hemisphere and Southern Hemisphere dayside and nightside FAC characteristics during the extreme October and November 2003 magnetic storms. It was shown that as Dst decreases, the FAC region expands equatorward, with the shift of FACs on the dayside controlled by the southward IMF. For both case studies, in the Southern (late spring) Hemisphere the minimum latitude of the FACs is limited to 50∘ magnetic latitude (MLat) for large negative values of Bz. (The minima are the same, although in October the IMF Bz drops to −28 nT, while in November it reaches −50 nT.) In the Northern (late autumn) Hemisphere the equatorward boundaries of the FAC region are located at 55–60∘ MLat. Using the global maps from the Iridium constellation, Anderson et al. (2005) studied the FAC intensities during severe magnetic storms which occurred during solar cycle 23, with particular attention given to the evolution of FACs in the course of the storm of August 2000. The results revealed the dawn–dusk asymmetry of the R1/R2 current sheets, with an increase primarily found on the duskside. It was also shown that under disturbed conditions the total current intensity was constrained to be below 20 MA (Anderson and Korth, 2007).
Since 2014, comprehensive studies of FAC distributions were carried out based on high-precision observations onboard the Swarm constellation (e.g., Dunlop et al., 2015; Juusola et al., 2016; McGranaghan et al., 2017). However, the Swarm data have not yet been fully utilized for the storm-time FAC analysis. It is the purpose of this paper to characterize the magnitude and position of the large- and smaller-scale FACs as their response to the magnetic storm development. The Swarm observations are used in order to identify various characteristics of the storm-time FACs for the event of 6–9 September 2017, which was one of the two most severe magnetic storms of the recent solar cycle 24 (the previous event was the St. Patrick's Day storm on 17 March 2015). The September 2017 event is of particular interest because it was a two-step storm during which two major substorms occurred and the FAC system is affected by the storm–substorm interplay. In this paper we investigate the time evolution of the large-scale FAC intensities, the displacement of the FAC equatorward boundaries and the extreme small-scale (for the 1 Hz data, the spatial resolution is ∼7.5 km) currents.
2.1 Instrumentation
The ESA Swarm mission is a constellation consisting of three identical satellites (hereafter SwA, SwB and SwC, respectively); all are at low-altitude polar orbits (Friis-Christensen et al., 2008). The Swarm constellation was launched at the end of 2013 and entered the operational phase in April 2014. The initial orbit altitudes are 465 km (SwA and SwC) and ∼520 km (SwB) and the inclination is 87.5∘. For By in September 2017 the orbit altitude decreases to ∼440 and 505 km, respectively. SwA and SwC fly in a tandem separated by 1–1.4∘ in longitude and the differential delay in orbit is ∼3 s. The orbit period is about 93 min (the speed of the satellites is about 7.5 km s−1) and slightly different between SwA/SwC and the upper satellite SwB, so that their along-orbit separation in local time gradually changes. Their orbital planes also gradually drift apart, and the separation angle increases by ∼20∘ longitude per year. Slowly drifting in longitude, the orbits cover all the local time sectors over about 130 d.
The mission has a multi-instrument payload. The main module is the high-sensitivity vector (fluxgate type) and scalar magnetometers for determining the magnitude and direction of the total vector and variations of the geomagnetic field with an accuracy of more than 0.5 nT (Merayo et al., 2008). Magnetometers make it possible to carry out measurements in a wide range, including the Earth's main magnetic field and the variations of the external magnetic field generated by FACs. FACs are detected by their magnetic perturbations in the orthogonal plane which are obtained after subtracting the main magnetic field model from the total measured values. From a single spacecraft the FAC density can be estimated based on one magnetic component with a technique invoking Ampere's law under assumptions about the infinite current sheet geometry and the orthogonal crossing of the current sheet. This method was used for the previous one-satellite missions, such as Magsat and Ørsted (Christiansen et al., 2002). It is also applied to each Swarm satellite separately. The dual-satellite estimation method calculates current density from curl(B) measured quasi-simultaneously at four locations adapted for SwA and SwC data, where measurements separated along-track are used to create a “tetrahedron” (Ritter and Lühr, 2006). The curl(B) method provides more reliable current density estimates, as it does not require any assumptions about current geometry and orientation. The FAC outputs of both dual-satellite and single-satellite methods are considered to be in reasonable agreement (Ritter et al., 2013). However, a high degree of coherence is typical at auroral latitudes, while in the polar cap the results based on a dual-spacecraft technique are more reliable (Lühr et al., 2016). Both algorithms are implemented to generate the Swarm products that are produced automatically by ESA's processing center as soon as all input data are available. The products are provided using the dual-satellite method on the lower pair of satellites SwA and SwC and the single-satellite solution for each of the Swarm spacecraft individually. The 1 s values (1 Hz sampling rate) of FAC densities are available via the online Swarm data portal (ftp://swarm-diss.eo.esa.int, last access: 10 January 2020) as Level 2 data products (Swarm Level 2 Processing System, 2019). In the present study the single-satellite FACs are used in order to apply the similar method to SwB and SwA/SwC data.
Each satellite is also equipped with the Electric Field Instrument, which includes the Langmuir probe to provide measurements of ionospheric plasma parameters: electron density, electron temperature and spacecraft potential (Knudsen et al., 2003). The plasma data are available at a 2 Hz sampling rate as the standard product of the Swarm database. Unfortunately, due to technical problems, measurements of the electric field and ions are rather rare. Nevertheless, the combination of data provided by a magnetometer and a plasma analyzer on electrons makes it possible to identify perturbations associated with FACs. In each Level 2 data file the location of the satellite is presented in an geographic coordinate system NEC (x – north, y – east, z – center), where the x and y components lie in the horizontal plane, pointing northward and eastward, respectively, and z points to the center of gravity of the Earth. For the purpose of the present study all projections of the passes are shown in the magnetic local time (MLT) and MLat domain. For this the coordinates are available via the online Swarm Data Visualisation Tool (VirES).
2.2 Orbits on 6–9 September 2017
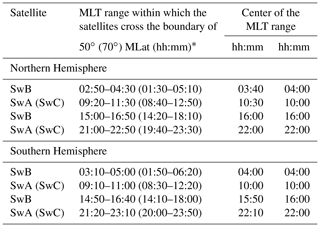
The polar projection of the satellite orbits (14–15 trajectories per day) as of 6–9 September 2017 in the Northern Hemisphere and Southern Hemisphere is shown in Fig. 1. For mid-September 2017 the passes are centered in the pre-midnight, pre-noon, pre-dusk and pre-dawn sectors. The satellite SwA (orbits of SwC are very similar) enters the region of MLat > 50∘ between ∼ 09:00 and 12:00 MLT and leaves this region between ∼ 21:00 and 23:00 MLT. The entry (exit) points of the SwB orbit are between ∼ 15:00 and 17:00 (02:00 and 04:00) MLT. In the Southern Hemisphere the direction of the tracks in the MLT–MLat framework is opposite. During a day, the successive projections are systematically shifted almost parallel to each other; however, at auroral latitudes, they stay mainly within the same sectors. The MLT ranges covered by the tracks are presented in Table 1.
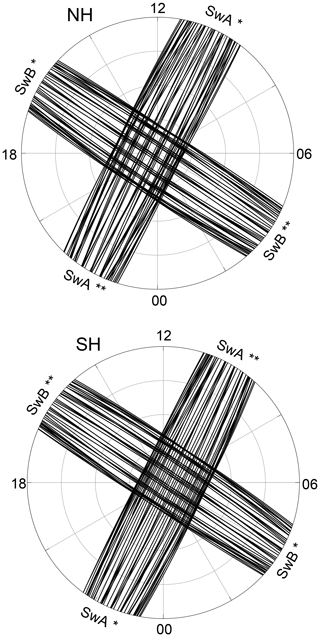
Figure 1Polar maps of the SwA and SwB orbits in the Northern Hemisphere and Southern Hemisphere on 6–9 September 2017 in the MLT–MLat framework. Circles are drawn every 10∘ down to 50∘ MLat. Symbols * and indicate, respectively, the entry and exit crossing of the boundary MLat = 50∘.
At the declining phase of solar cycle 24, starting from 6 September 2017, strong multiple solar flares occurred. The associated interplanetary coronal mass ejections collided with Earth's magnetosphere and caused the most intense magnetic storm of the recent solar cycle. The storm produced strong geomagnetic disturbances, ionospheric effects, magnificent auroral displays, elevated hazards to power systems and unstable high-frequency (HF) radio wave propagation (e.g., Chertok et al., 2018; Clilverd et al., 2018; Curto et al., 2018; Yasyukevich et al., 2018).
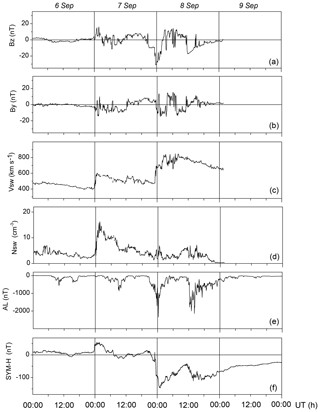
Evolution of the solar wind (SW) parameters and geomagnetic activity is presented in Fig. 2, showing (from top to bottom) the IMF Bz and By, the SW proton speed (Vsw) and density (Nsw), the auroral AL and the equatorial SYM-H geomagnetic indices from the OMNI web service (https://omniweb.gsfc.nasa.gov/, last access: 1 December 2019). Two SW shock events impact the magnetosphere. The arrival of the first shock late on 6 September (23:50 UT) results in a sudden increase in all parameters except the AL index. Since at that time the IMF Bz turns northward, the initial disturbance is only weakly geoeffective as a result. At 20:40 UT, 7 September, IMF Bz turns southward, which triggers a substorm growth phase and a ring current build-up. The second shock arrived at ∼ 23:40 UT on 7 September, with the SW speed up to 800 km s−1 and strongly negative Bz and By. This shock causes an abrupt drop in SYM-H down to −150 nT and a spike-like decrease in AL down to −2200 nT. After 03:00 UT, 8 September, the IMF Bz becomes positive, AL gradually approaches zero and SYM-H starts to recover until the next southward turn of Bz. At ∼06 UT on 8 September another strongly negative Bz period is seen, and the SW speed remains high (>700 km s−1). This causes the second substorm (AL is −2000 nT) and ring current intensification (SYM-H is −100 nT). A steady recovery occurs in the AL index throughout 9 September, while the SYM-H gradually increases from −75 to −35 nT. The SW parameters are not available for this day.
4.1 FAC densities
Statistically the large-scale R1 and R2 FAC densities peak at the dawn–dusk meridian. At dusk, the orbits of SwB are centered at about 16:00 MLT; on the night side, the orbits are centered at 04:00 MLT. SwA and SwC cross the pre-noon sector at about 10:00 MLT, where disturbances associated with substorms are expected. An example of the FACs measured along the SwB track is shown in Fig. 3. The 1 s values presented in Fig. 3a provide clear evidence of strong bursts at the auroral latitudes (55–75∘ MLat). The auroral FACs exhibit large-amplitude spike-like structures, thus confirming the existence of filamentary current sheets embedded in the large-scale current sheets. The intensities of these small-scale FACs vary in units to tens of µA m−2. Figure 3b depicts the 51-point smoothed curve (the length of the sliding window is ∼380 km). It can be seen that the satellite approaching the pole from the dusk observes first the downward (positive) R2 and then the upward (negative) R1 current; both are of ∼1 µA m−2 density. Above approximately 70∘ MLat FACs become marginal. When the satellite moves equatorward at the early morning local times, a structure is observed in which the poleward currents are positive, so they may be associated with the downward R1 FAC. The most equatorward currents are negative and thus represent the R2 FAC.
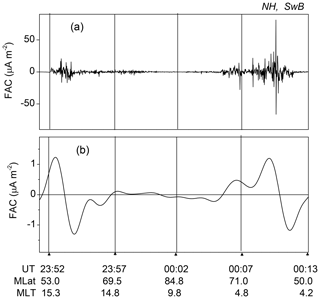
Figure 3(a) 1 s and (b) smoothed FACs measured by SwB in the northern polar region between 23:50 UT, 7 September, and 00:13 UT, 8 September. Downward (upward) current is positive (negative).
To demonstrate the global temporal evolution of FACs, in Fig. 4 the current densities for the four MLT sectors are presented separately for the Northern Hemisphere (Fig. 4a, c, e, g) and Southern Hemisphere (Fig. 4b, d, f, h). Each red (blue) point is determined by averaging the 1 s downward (upward) current densities, when the satellite crosses the region filled with FACs. The upper (a–d) and lower (e–h) plots represent the data from the day side (10:00 and 16:00 MLT) and night side (04:00 and 22:00 MLT), respectively. For easier visual association of the evolution of FACs with the storm development, the SYM-H and AL indices are added in the plots (a, b) representing the day side and in the plots (e, f) representing the night side, respectively. During 6–9 September, FACs shown in Fig. 4 exhibit three pronounced enhancements, which are of different intensity depending on the MLT sectors. (Note that the FAC densities do not show any systematic changes associated with the orbit oscillation during the day.) All FACs start to increase at the very beginning of 7 September in association with the SW dynamic pressure front impinging on the magnetosphere, causing a positive excursion of SYM-H. The dayside FACs increase abruptly (this is especially well seen in Fig. 4b–c, i.e., at 10:00 MLT, north, and at 16:00 MLT, south), while the nightside FACs (Fig. 4e–h) respond to the shock with a considerable delay. The nightside FACs peak in the middle of 7 September, when a moderate substorm occurs.
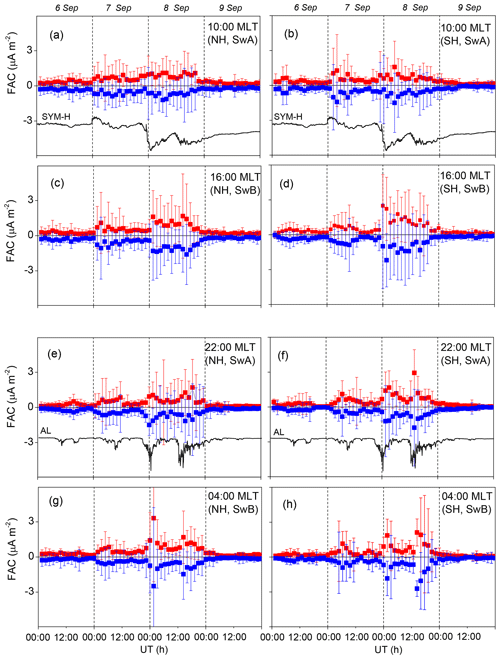
Figure 4Average FAC densities in the four local time sectors covered by the Swarm data on 6–9 September 2017. The left columns of the plots correspond to the Northern Hemisphere (NH) and the right columns correspond to the Southern Hemisphere (SH). The upper plots (a–d) and the lower plots (e–h) show the dayside and nightside FACs, respectively. The SYM-H and AL indices are added in plots (a, b) and (e, f), respectively. The centered MLTs (10:00, 16:00, 22:00 and 04:00) are shown in the right upper corner of each plot. The downward and upward FACs (and the corresponding error bars) are shown in red and blue, respectively.
At the very beginning of 8 September, in association with the first deep drops of SYM-H and AL, a step-like increase is seen at all MLTs except the pre-noon sector. The peak of the dayside and nightside FACs reaches 2.5 and 3.5 µA m−2, respectively. For a particular crossing the standard deviation exceeds 5–6 µA m−2, while the standard error is about 0.3 µA m−2. The dayside FACs (Fig. 4a–d) stay enhanced during the whole day of 8 September. The nightside FACs (Fig. 4e–h) more closely follow the evolution of AL, so that the current intensities decrease in accordance with the first storm-time substorm recovery. The next increase in the nightside FACs occurs at ∼ 12:00 UT on 8 September, when the second major substorm and the second drop in SYM-H are observed. On the day side the response of FACs to this substorm is marginal, although the current densities remain elevated throughout the day. All FACs fall to pre-storm levels by 9 September.
Comparison of the evolution of FAC intensity with the SW and geomagnetic parameters during the period of 6–9 September reveals that the storm-time FACs are, on average, several times larger than the quiet-time ones. Better correspondence exists between the nightside FACs (compared to the dayside ones) and the substorm activity as monitored by the AL index.
4.2 Dynamics of the equatorward boundary of the FAC region
It is well established that the enhanced SW input and the pile-up of open magnetic flux during a geomagnetic storm result in the equatorward expansions of the polar cap and the auroral oval as a whole (e.g., Milan et al., 2004). Following the magnetospheric dynamics FACs also move equatorward. Figure 5 shows the evolution of the equatorward boundary (EqB) of FACs on 6–9 September. For the comparison the SYM-H and AL indices are added. The EqB parameter is determined as the lowest MLat at which FACs are terminated. The procedure of the 20-point sliding window (the scale is about 150 km) moving along a track from the Equator to the pole is applied to the 1 s FAC values and the corresponding MLats. EqB is selected as the lowest MLat of the window if 90 % of FAC values within the window exceed µA m−2. Then the results are checked visually in order to avoid the erroneously calculated latitudes, which may happen, e.g., if a significant latitudinal gap between R1 and R2 occurs. When calculating EqB, no separation between the upward and downward FACs is made.
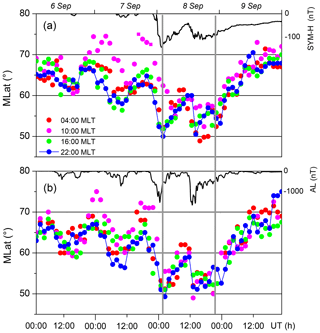
Figure 5MLat of the FAC equatorward boundaries (EqB) in the Northern Hemisphere (a) and Southern Hemisphere (b) for the sectors centered at around 04:00, 10:00, 16:00 and 22:00 MLT. EqB for each sector is shown by dots of different colors; blue dots representing the nightside (∼ 22:0 MLT) EqB are connected by a line. The SYM-H and AL index (black line) is added to the upper and lower plots, respectively. The vertical lines mark the beginning of the main and recovery phases.
Even visual comparison of the SYM-H and EqB evolutions in Fig. 5 reveals generally coherent behavior of these two parameters. In particular, during a period preceding the storm main phase (before 8 September, when SYM-H is mainly positive) EqB is located much lower than during the end of the recovery phase (after ∼ 12:00 UT on 9 September, when SYM-H is still negative). Before the SYM-H attains the negative values below −20 nT at 22:00 on 7 September, FACs are observed mainly poleward of 60∘ MLat in both hemispheres. Moderate equatorward shifts of EqB are associated with the modest substorms that occurred before the storm main phase in the middle of 6 and 7 September. Prior to the main phase, in both hemispheres the pre-noon (10:00 MLT) EqB is found considerably poleward compared to the EqB locations at other MLTs. The effect is well seen during the two time intervals: from ∼ 22:00 UT, 6 September till 06:00 UT, 7 September and at 12:00–24:00 UT, 7 September. Both intervals are dominated by the northward IMF (cf. Fig. 2), so that a shrinking of the polar cap and a poleward shift of the auroral oval are expected. With regard to the positions of FACs, the displacement of its equatorward boundary is the largest only in the pre-noon sector, while the other local times remain less affected.
Upon arrival of the SW shock at the very end of 7 September, EqB is abruptly shifted equatorward, then tends to recover until the middle of 8 September, and then drops again following the second intensification of the storm. At the very beginning of 8 September EqB is found at its lowest position at 50∘ MLat. A drop in EqB occurs simultaneously with the peak of the first substorm intensification and the lowest SYM-H (−160 nT). The second substorm reaches its peak slightly before the second minimum of SYM-H (at 12:50 and 13:55, respectively). During this second activation the EqB is shifted again as low as 50∘ MLat (although SYM-H is only −100 nT). As seen in Fig. 5, the evolution of EqB tends to follow the gradual change in SYM-H rather than abrupt drops in AL related to the substorm activations (see also Fig. 2 for AL). Unlike the current density, which is enhanced throughout the storm and exhibits several spike-like increases in accordance with AL, the temporal variations of EqB are relatively smooth. A relatively small difference in evolution on the dayside and nightside EqBs is observed. At the peaks of the storm, EqB is at about 50∘ MLat, while during the late recovery phase, EqB is shifted poleward as high as 70∘ MLat. Possible expansions of the FAC region during the substorm growth phase and then its contraction after onset are difficult to resolve with the Swarm data.
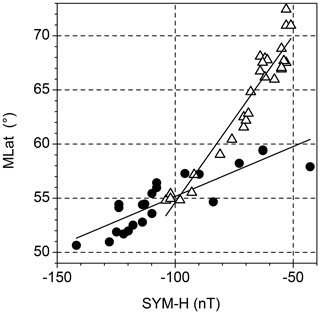
The equatorward displacement of FACs roughly correlates with the storm intensity as monitored by the SYM-H index, while the storm-time substorms can modify this relationship. In Fig. 6, separately for the main and recovery phases, the correlations between SYM-H and the nightside EqB are shown. Data from both the Northern Hemisphere and Southern Hemisphere are included. The correlation coefficients (cc) for the main and recovery phases are very similar (cc = 0.88 and 0.87), while the corresponding regression equations are considerably different. During the storm main phase, the equatorward expansion of EqB is governed by the equation MLat = . When the recovery phase begins, the poleward shift of EqB is described by the expression MLat = . The faster poleward recovery of EqB compared with its equatorward expansion is due to the fast decrease in substorm activity on 9 September.
4.3 Small-scale FACs
It is known that FACs appear on a wide range of scales, from large-scale sheet-like currents of hundreds of kilometers in width to very small-scale filamentary currents of hundreds of meters in width. The quasi-instantaneous amplitudes of the small-scale component are often much larger than the stationary R1/R2 FACs. The current intensity varies inversely with scale, so that large-scale currents are typically a few µA m−2, whereas the smaller-scale currents (down to 10 km) are a few tens of µA m−2 (Neubert and Christiansen, 2003; Luhr et al., 2015; McGranaghan et al., 2017). To obtain the time series of the Swarm peak current densities on 6–9 September 2017, the largest positive and negative 1 s values were selected from each crossing in a given MLT time sector irrespective of the hemisphere. The obtained peak values are presented in Fig. 7. First of all, from this figure one can see that the small-scale peaks may be more than an order of magnitude larger than the FACs averaged over a track (cf. Fig. 4). On 6 September, only two outliers of about +20 and −30 µA m−2 are observed. Both are from the pre-midnight sector and are associated with a moderate substorm that occurred in the middle of this day. During the disturbed period, starting with the compression of the magnetosphere on 7 September, the amplitudes of peaks tend to increase. Two intense substorms occurring during the storm main phase cause an additional strengthening of small-scale FACs at all MLTs. At ∼ 00:00 UT on 8 September, the upward and downward currents at early morning local times attain their extremes of 70–80 µA m−2. The second major substorm that occurred in the middle of 8 September is also accompanied by the peaks, which are more pronounced on the dusk side, where the upward FAC reaches about −50 µA m−2. Note that some peaks can be missed due to the temporal and spatial gaps between the satellite tracks.
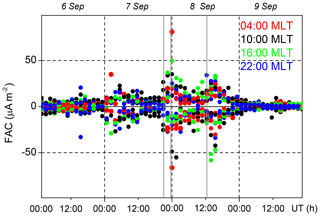
Figure 7The largest downward (positive) and upward (negative) 1 s current densities for four MLT sectors on 6–9 September. The vertical solid lines mark the beginning of the storm main phase at 22:00 on 7 September (the time when SYM-H attains its stable negative values nT; the period of SYM-H lasts till the end of 9 September), the peaks of the first and second major substorms (the time when AL attains its minimum).
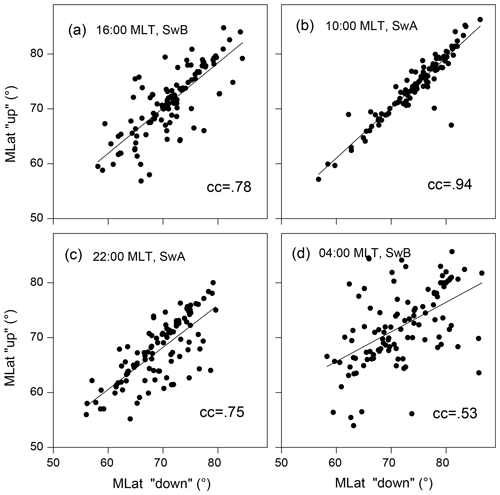
When for each crossing within a certain MLT sector, the minimum (i.e., peak upward current) and maximum (i.e., peak downward current) 1 s FACs are selected, it appears that in some cases these peaks are observed at very close latitudes, while in other cases the minimum and maximum are spaced in latitude. In Fig. 8, the correlations between the MLats, at which the most intense small-scale FACs of opposite polarities are observed, are presented for each MLT sector. The x axis (y axis) corresponds to the MLat of the downward (upward) peak selected in each crossing. The magnitudes of minima and maxima are not accounted for. From Fig. 8 one can see that the correlation between the latitudinal positions of the upward and downward peaks varies with MLT. The highest correlation coefficient (cc = 0.94) is found in the pre-noon sector (Fig. 8b). This is indicative of a large population of the paired, closely adjacent small-scale currents of opposite polarity (called hereafter the bipolar structure). At dusk (Fig. 8a) the correlation coefficient decreases down to 0.78. Almost the same correlation (cc = 0.75) is observed in the pre-midnight sector (Fig. 8c). In the early morning hours (Fig. 8d) the correlation is much weaker (cc = 0.53), implying that the extreme upward and downward currents appear less frequently in pairs but rather are spatially (or temporary) separated. Different mechanisms of the small-scale FAC formation on the day side and night side can be the cause of this spatial distribution and variability.
4.4 Small-scale FACs of extreme amplitudes
During the storm under consideration a pair of the most intense upward and downward small-scale FACs is revealed by SwB at around 00:10 UT on 8 September, when the satellite traverses the auroral latitudes from north to south over the geographic area of the Barents Sea, about 20∘ magnetic longitude to the east from the IMAGE magnetometer network (http://space.fmi.fi/image, last access: 1 December 2019). The network produces the IL index, which is a simple estimate of the total westward currents crossing the IMAGE chain. The IL index (Fig. 9) shows that the extreme FACs are observed during the first period of the storm-time substorm intensifications, several minutes before the IL drops from −1500 to −3700 nT.
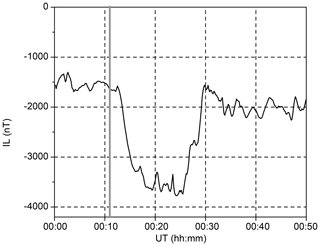
Figure 9The 10 s IL index at 00:00–00:50 UT, 8 September. The time of the extreme FAC observation is shown by the grey line.
The 1 s FACs and plasma parameters (the electron density, Ne, temperature, Te, and the spacecraft electric potential, Usc) measured by SwB at 00:08–00:12 UT on 8 September are shown in Fig. 10. As show in Fig. 10a, at 00:10:18–00:10:19 UT the satellite observes the bipolar current structure of extreme density consisting of the poleward downward (81 µA m−2) and equatorward upward (−66 µA m−2) FACs. The paired upward and downward FACs are of relatively comparable values; thus, they are balanced and likely closed locally. In Fig. 10a the original 1 s values are superimposed on the smoothed curve, which reveals a signature of the downward R1 and upward R2 FACs. The bipolar structure is located at the edge of the downward FAC.
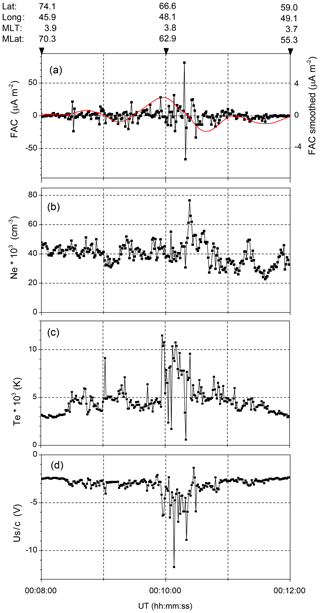
Figure 10The 1 s values of (a) FAC density, (b) Ne, (c) Te, and (d) Usc measured along the SwB track at 00:08:00–00:12:00 UT, 8 September. In the upper plot the 21-point smoothed FAC density is also shown. Geographic and geomagnetic coordinates are shown at the top.
The bipolar current structure is accompanied by plasma perturbations. A narrow peak in Ne up to 77×103 cm−3 (Fig. 10b) and an increase in Te up to ∼104 K on average (Fig. 10c), that is, ∼50 % above their ambient values, are observed almost simultaneously with a pair of extreme FACs. (It should be noted that the Te values presented here are based on the current processing of the satellite data and may be still uncalibrated. However, this hardly affects the relatively small-scale perturbations.) The elevated Te is observed in a wider region slightly poleward of the enhanced Ne. The plasma disturbances are clearly seen in Usc, which is proportional to (k is the Boltzmann constant). Note that the level of noise for the Usc channel is much lower compared to that for the Te channel (0.4 % and 2 % for Usc and Te, respectively). Figure 10d shows that a reduction of Usc starts at 00:09:56 UT and then peaks at 00:10:08 (−12 V) and 00:10:20 UT (−8 V); the average decrease is −5 V. The region where the Te and Usc are perturbed is several times wider than the region occupied by the pair of extreme FACs.
If the localized increase in Ne indicates conductance enhancement (likely due to precipitating electrons), the observed plasma and current perturbations are similar to those associated with auroral arcs (Opgenoorth et al., 1990; Lyons, 1992; Johnson et al., 1998; Aikio et al., 1993; Juusola, et al., 2016). In particular, Aikio et al. (2002) studied the current system of arcs in the evening sector, where the background electric field is northward. It was shown that for arcs located within the northward convection, electric field currents flow downward on the equatorward side of the arcs, then poleward, and then upward from the arcs. The arcs are associated with an enhanced northward-directed electric field region on the equatorward side of the arc. An enhancement in the electric field starts already several tens of kilometers equatorward of the arc edge.
During the storm under consideration the bipolar FAC pattern observed at 00:10 UT is located in the morning sector, where the background electric field is expected to be southward. This is confirmed by the SuperDARN-based convection model (http://vt.superdarn.org/tiki-index.php?page=ASCIIData, last access: 12 October 2019), which predicts in the region of the SwB observations the magnitudes of the southward and westward components to be about 6.5 and 0.5 mV m−1, respectively. As mentioned in Sect. 2.1, unfortunately the in situ Swarm electric field is unavailable. Only the reported characteristics of the electric field associated with arcs can be used for qualitative analysis. In particular, for morning-side arcs an enhanced southward electric field on the poleward side of the arc is expected. In this case the current pattern consists of a downward FAC on the poleward side of the arc connected to an upward current above the arc by an equatorward ionospheric closure current. This is exactly what is seen in Fig. 10a: when SwB flies away the pole, it first observes a positive spike (downward FAC) and then a negative spike (upward FAC). Since the width of the region of enhanced Ne is ∼30 km, the arc is relatively narrow. Comparing Fig. 10a and b one can see that the paired FACs is located on the poleward side of the region of enhanced Ne. Note that in Fig. 10b a sharp increase in Ne up to cm−3 is preceded by a weaker spike-like drop down to cm−3. A decrease in Ne (which is usually much less pronounced than an increase due to precipitating electrons) is associated with a downward FAC observed at the opposite boundary of the arc. Elevations of Te may be created by electric fields which can arise within a narrow region adjacent to the northern side of the auroral arc as observed by Aikio et al. (2002).
Observations of the LEO Swarm multi-satellite mission are used in order to identify various characteristics of the storm-time FACs for the severe event of 6–9 September 2017. During the storm main phase two major substorms occurred, so that the FAC system evolved under conditions of the storm–substorm interplay. In mid-September 2017 the separation between the upper and lower Swarm satellites was about 6 h in local time. Within the sectors centered at 04:00, 10:00, 16:00 and 22:00 MLT the northern and southern polar regions were covered by about 60 tracks along which the 1 Hz measurements of FACs were carried out. These observations made it possible to reveal the evolution of the large-scale FAC intensities, the displacement of the FAC equatorward boundaries and some features of the extreme small-scale FACs.
5.1 Large-scale characteristics of FACs
The evolution of large-scale characteristics of FACs during the September 2017 storm is in general agreement with regularities observed previously by CHAMP during the intense 2003 geomagnetic storms (Wang et al., 2006). The common feature of all storm times is the equatorward motion of FACs generally correlating with the storm intensity. During the September 2017 storm the global coverage of the high latitudes by the precise measurement onboard the Swarm satellites made it possible to reveal that the FACs were enhanced at all MLTs starting from the time of the first SW shock arrival at the very beginning of 7 September, although the northward IMF and the prolonged period of geomagnetic quietness lasted almost a day. After this quietness a storm abruptly commenced at ∼ 22:00 UT on 7 September. During the two-step main phase FACs exhibit three pronounced enhancements, and the evolution of FACs depends on the MLT sectors. On the dayside FACs strengthen after the sudden commencement and in response to the first drop in SYM-H, while the response to the second drop in SYM-H is relatively weak. On the night side the current intensities follow mainly the substorm dynamics as monitored in terms of the AL index, promptly respond to the onset of storm-time substorms and strengthen at the peaks of substorms. At the same time, during the period between the major substorms, when AL is fully recovered but SYM-H is not, FACs stay considerably enhanced.
The September 2017 storm is characteristic of a considerable equatorward expansion of the FAC region as low as 50∘ MLat in both hemispheres. The latitudinal displacement of FACs is more gradual and smooth than the changes in current intensity. For comparison, during the 2003 storms the minimum latitudes of peak current density are limited to 52–56∘ MLat (Wang et al., 2006). It should be noted that these authors defined the latitudinal positions of peak current density but not the most equatorward boundary of the FAC region; thus, the actual FAC region may expand to lower latitudes. The lowest latitudinal position of the storm-time FACs was found by Fujii et al. (1992). For the storm of March 1989 the equatorward boundary of the FAC system reached as low as 48∘ MLat. Similar to the 2003 storms, in 2017 the latitudinal positions of EqB generally follow the SYM-H variations. FACs are shifted further equatorward during the storm-time substorms. Even a relatively minor substorm that occurred prior to the storm causes a considerable equatorward displacement of FACs. The lowest latitude of EqB is observed when both the SYM-H and AL indices reach their minimums.
Although the storm of September 2017 is considerably weaker ( nT) than the storms that occurred in 1989 ( nT) and 2003 ( nT), the FAC region expands approximately to the same latitudes. This effect may be interpreted in terms of saturation, when the FAC region does not expand lower than ∼50∘ MLat independently of the storm severity. Linear dependence between latitudinal boundaries of the FAC sheets upon the dayside merging electric field and the AE and Dst indices has been reported by Xiong et al. (2014). It was also pointed out that toward high activity a saturation of equatorward expansion seems to set in.
In September 2017, prior to the storm main phase, when the IMF Bz is northward, the pre-noon EqB is located at higher latitudes (∼75∘ MLat) compared to the other MLT sectors (∼65∘ MLat). Surprisingly, in the course of the storm main phase, no considerable difference between the latitudinal positions of EqB in different MLT sectors is found. After ∼ 12:00 UT on 9 September, in the late recovery phase (SYM-H is −50 nT), both the dayside and nightside EqB recover to their undisturbed position (about 70∘ MLat). The coherent behavior of EqB is rather unexpected because Wang et al. (2006) found that the poleward recovery of FACs on the night side is slower than on the day side. Previous analysis of the latitudinal shift of the polar cap boundaries based on the IMAGE observations during a magnetic storm has also shown that, if the IMF Bz turns northward, the dayside boundary recovers much faster than the nightside boundary (Lukianova and Kozlovsky, 2013). This is because the dynamics of the nightside boundary depends on the energy accumulated in the magnetotail during the previous period of the storm main phase. However, it seems that the storm of September 2017 does not show the same regularity. The reason may be that during the storm main phase the two major substorms occurred, so that the energy stored in the tail was released more quickly. Comparing the evolution of the FAC densities and the equatorial boundary positions during the storm recovery, one can see that the densities decay much faster than the boundaries return to their quiet-time positions.
High FAC intensity is associated with the auroral oval. Previous studies based on particle precipitation and optical observations have shown that the oval radius increases when the ring current is intensified during magnetic storms (e.g., Meng, 1982; Yokoyama et al., 1998). Significant variations in the location of the aurora take place during the substorm cycle. Substorms occurring on expanded auroral ovals during magnetic storms are most intense, since they close the most magnetospheric open magnetic flux, and the presence of the enhanced ring current increases the open flux threshold at which substorm onset is favored (Milan et al., 2009). It was also shown that changes in oval radius associated with dayside and substorm driving occur on timescales of minutes and hours, while changes associated with the ring current are more protracted, as the ring current dissipates slowly (Milan, 2009).
The Swarm observations, although they are instantaneous, reveal a tendency of the dawn–dusk asymmetry FACs. The dawn–dusk asymmetry is revealed by comparing the upward and downward FACs, which are summed for all crossings over dusk and dawn separately. While the summed FAC intensities are comparable between the two hemispheres, the positive and negative densities at dusk and dawn are slightly imbalanced and the net current is nonzero. It seems that the dusk-side downward (R2) FACs are larger than the dusk-side upward (R1) and dawn-side R1 and R2 currents. The observed imbalance in FACs is likely related to an intensification of the partial ring current, which is connected to the R2 FAC at dusk. Strengthening of the partial ring current may also lead to asymmetric dusk-side inflation of the geomagnetic field lines. The dawn–dusk asymmetry in strength and the equatorward displacement of R1 and R2 at the peak of the major storm in August 2000 have been reported by Anderson and Korth (2007). This study utilized the global distributions of FACs generated at a 10 min cadence separately for the Northern Hemisphere and Southern Hemisphere by the AMPERE project which is based on the fleet of Iridium satellites. Although the Swarm observations are unable to provide the instantaneous global FAC distribution, the responses of FACs in certain MLT sectors on the dawn side are different from those on the dusk side. Note that the results in Table 2 are calculated by using the 1 Hz FAC values, and their averages do not necessarily represent the large-scale R1/R2 FACs. Nevertheless, for the storm of September 2017, the dawn–dusk asymmetry is manifested in the enhanced average density of the downward FACs on the dusk side. This feature is consistent with the global observations by AMPERE, from which the asymmetry of large-scale FACs can be identified. At the same time, almost no difference in the equatorward shift of the dusk-side and dawn-side FACs is observed by Swarm.
5.2 Small-scale FACs
Due to their large amplitudes, small-scale FACs play an important role in the energy input to the upper atmosphere. In several previous studies, the FACs associated with arcs were estimated as 1–10 µA m−2 (Bythrow and Potemra, 1987; Elphic et al., 1998; Janhunen et al., 2000; Lühr et al., 2016). A larger range of current densities, varying between 4 and > 40 µA m−2, has been observed (Aikio et al., 2002), and even more intense small-scale FACs, up to hundreds of µA m−2, at the edges of arcs have been measured by MEO satellites (Marklund et al., 1982; Bythrow et al., 1984). Such a large range of the FAC estimates is likely related to its different scales (and different techniques), because for arcs with very sharp electron density gradients, the FACs associated with ionospheric currents flow in narrow regions at arc edges. If the real widths are smaller, the current densities are expected to be larger.
Filamentary structures of high densities are always presented in the Swarm observations. The narrow high-density currents are averaged out when integrated over a FAC region, so that multilayer structures of steady large-scale FACs of the R1/R2 type depicted by Iijima and Potemra (1978) can be revealed after a proper smoothing. From a statistical study of the temporal and spatial-scale characteristics of different FAC types derived with the Swarm satellites, Luhr et al. (2015) have shown that small-scale (up to some 10 km) FACs are carried predominantly by kinetic Alfvén waves. A persistent period of small-scale FACs was of order 10 s, while large-scale FACs can be regarded as stationary for more than 1 min. Neubert and Christiansen (2003) studied the morphology of very small-scale FACs from a survey of Ørsted satellite 25 Hz data. These FACs are distributed in a broad region around the pre-noon and cusp regions and in the pre-midnight sector. It was found that at the considered timescale, instantaneous currents may reach the largest values up to 1000 µA m−2, while the average current densities reach a maximum of 10 µA m−2. McGranaghan et al. (2017) demonstrated a local time dependence in the relationships between large (>250 km) and small FAC scales (10–150 km width; density is up to 0.5 µA m−2). It was found that linear relationships exist near dawn and dusk local times, while at noon and midnight local times no similar regularity is seen. The results are based on all available data from the Swarm satellites and the AMPERE irrespective of the level of geomagnetic activity.
During the September 2017 storm one of the Swarm satellites managed to observe a pair of the most intense small-scale 7.5 km width FACs of opposite polarity, the magnitudes of which are approximately +80 and −70 µA m−2. These upward and downward FACs are adjusted to each other and separated in a fraction of a degree in MLat. The bipolar FAC structure occurs in the region approximately between R1 and R2, just prior to the abrupt substorm intensification in the vicinity of the newly developed ionospheric westward electrojet. The polarity reversal captured by the Swarm data for 2 consecutive seconds implies a quite localized current closure through the ionosphere mostly via Pedersen horizontal currents. Although without optical and electric field data one could not draw a strict conclusion, the small-scale bipolar FAC patterns accompanied by localized enhancements in Ne and Te are likely associated with mesoscale discrete aurora. One-to-one correspondence of small-scale FACs with localized electron precipitation events has been previously observed (e.g., Fukunishi et al., 1991). The SwB observations are in agreement with the disturbances expected for the arcs that occurred on the morning side, where the ambient electric field is southward. The observed features resemble those reported by Kozlovsky et al. (2007) and Aikio et al. (2002), but bear in mind that the latter are related to the evening sector, where the background electric field is northward. Based on Swarm/THEMIS All Sky Imager observations, Wu et al. (2017) associated multiple auroral arcs with up–down current pairs. For these arcs unipolar and multipolar FAC systems with current densities of about a few µA m−2 have been observed. Arcs in unipolar FAC systems have a typical width of 10–20 km and a spacing of 25–50 km. Arcs in multipolar systems are wider and more separated. In the bipolar structure of extreme intensity observed by SwB in 8 September, the current density exceeds the values observed by Wu et al. (2017) at least by a factor of 10, while the spatial extent of FACs is smaller. This difference implies the existence of sharp electron density gradients at arc edges. Usually, the arcs consist of auroral rays and bright spots moving along the arcs, and these spatial irregularities may produce the extreme small-scale FACs. This study has shown that under disturbed conditions, FACs forming the arc current system may reach hundreds of µA m−2 on the spatial scale of less than 10 km.
Statistically, the bipolar structures dominate pre-noon. In the post-midnight MLTs they are observed less frequently. While the interpretation of the bipolar structure in terms of the mesoscale arc pattern seems reasonable, the small-scale FACs are often a result of reconnection processes distributed over the dayside magnetopause and even in the tail for negative Bz. In contrast to post-midnight, in the pre-noon sector, where cusp/cleft currents are expected, the bipolar structures are quite frequent. This may be a signature of the plasma injections which are accompanied by pairs of FACs generated due to flux transfer event (FTE) formation (Southwood, 1987) or multiple reconnection at the magnetopause. Magnetic topologies associated with FTEs were previously observed by the MEO satellites (Marchaudon et al., 2004, 2006; Pu et al., 2013). These small-scale FACs are possibly a consequence of turbulence and instabilities associated with the process of opening previously closed magnetospheric field lines and merging them with the interplanetary magnetic field (Watermann et al., 2009). The regularity presented in Fig. 8 shows that during the September 2017 magnetic storm the bipolar structures dominate exactly in the region where the signatures of FTEs and the reconnection lines that formed at the magnetopause are expected. At the same time, a pair of the most intense FACs is observed on the night side.
Characteristics of FACs inferred from the 1 Hz Swarm observations during the severe magnetic storm of 6–9 September 2017 are presented. This storm is the two-step one with an about 22 h preliminary phase, and the intense substorms occurred in the course of the storm main phase. The satellites cross the pre-midnight, pre-noon, pre-dusk and pre-midnight sectors. The following features of the storm-time FACs are found.
The evolution of the current intensities and the latitudinal positions of the equatorward boundaries of the FAC region are mainly controlled by a storm–substorm interplay. The FACs become enhanced starting from the SW shock arrival despite the prolonged period of the northward IMF. The evolvements of the nightside FACs are combinations of the modulations related to the geomagnetic storm and substorm. Their densities are more responsive to the substorm development, while the dayside FACs are intensified in response to the SW shock and then stay enhanced. At the peak of the substorm, the FAC densities averaged over a track within a given MLT sector reach 3±0.25 µA m−2, while the undisturbed level is about 0.2±0.02 µA m−2.
The equatorward displacement of FAC sheets correlates with the storm intensity as monitored by the SYM-H index. The correlation coefficients for the main and recovery phases are about 0.9, while in the course of the main phase the rate of equatorward expansion of FACs is slower than their poleward displacement during the recovery phase. This is likely due to the relatively fast decrease in substorm activity. The minimum latitude of the equatorward FAC boundaries is limited to 49–50∘ MLat. Although the storm of September 2017 is relatively weak (Dst is about −100 nT), the FAC region expands approximately to the same latitudes as those observed for the more severe storms.
The filamentary structures of high-density FACs are always presented in the Swarm observations. A bipolar structure (i.e., the adjacent upward and downward small-scale FACs), ∼80 µA m−2, 7.5 km width, is observed in the vicinity of the newly developed westward electrojet just prior to the substorm onset. Simultaneous plasma perturbations indicate that the FAC pattern is likely associated with the mesoscale auroral arc.
The data used for the publication of this research are freely available from the Swarm Science Team web site (ftp://swarm-diss.eo.esa.int, ESA, 2018) or the Swarm visualization tool (https://vires.services/, last access: 1 December 2019).
The author declares that there is no conflict of interest.
Swarm data are available through the European Space Agency Online platform (ftp://swarm-diss.eo.esa.int, last access: 1 December 2019), after registration. We acknowledge the Swarm Science Team for providing the Level 2 data and the Swarm visualization tool (https://vires.services/, last access: 1 December 2019). The OMNI data on the solar wind, interplanetary magnetic field and geomagnetic indices are obtained from NASA/GSFC's Space Physics Data Facility's CDA web service (http://omniweb.gsfc.nasa.gov/, last access: 12 October 2019).
This paper was edited by Dalia Buresova and reviewed by five anonymous referees.
Aikio, A. T., Opgenoorth, H. J., Persson, M. A. L., and Kaila, K. U.: Ground based measurements of an arc-associated electric field, J. Atmos. Terr. Phys., 55, 797–808, https://doi.org/10.1016/0021-9169(93)90021-P, 1993.
Aikio, A. T., Lakkala, T., Kozlovsky, A., and Williams, P. J. S.: Electric fields and currents of stable drifting auroral arcs in the evening sector, J. Geophys. Res., 107, 1424, https://doi.org/10.1029/2001JA009172, 2002.
Akasofu, S.-I.: The development of the auroral substorm, Planet. Space Sci., 12, 273–282, https://doi.org/10.1016/0032-0633(64)90151-5, 1964.
Anderson, B. J. and Korth, H.: Saturation of global field aligned currents observed during storms by the Iridium satellite constellation, J. Atmos. Sol.-Terr. Phy., 69, 166–169, https://doi.org/10.1016/j.jastp.2006.06.013, 2007.
Anderson, B. J., Ohtani, S.-I., Korth, H., and Ukhorskiy, A.: Storm time dawn-dusk asymmetry of the large-scale Birkeland currents, J. Geophys. Res., 110, A12220, https://doi.org/10.1029/2005JA011246, 2005.
Axford, W. I.: Viscous interaction between the solar wind and the Earth's magnetosphere, Planet. Space Sci., 12, 45–53, https://doi.org/10.1016/0032-0633(64)90067-4, 1964.
Bythrow, P. F., Potemra, T. A., and Zanetti, L. J.: Variation of the auroral Birkeland current pattern associated with the north–south component of the IMF, in: Magnetospheric Currents, GM, AGU, Washington D.C., 131–136, https://doi.org/10.1029/GM028p0131, 1984.
Bythrow, P. F. and Potemra, T. A.: Birkeland currents and energetic particles associated with optical auroral signatures of a westward traveling surge, J. Geophys. Res., 92, 8691–8699, https://doi.org/10.1029/JA092iA08p08691, 1987.
Chertok, I. M., Belov, A. V., and Abunin, A. A.: Solar eruptions, Forbush decreases, and geomagnetic disturbances from outstanding active region 12673, Space Weather, 16, 1549–1560, https://doi.org/10.1029/2018SW001899, 2018.
Christiansen, F., Papitashvili, V. O., and Neubert, T.: Seasonal variations of high-latitude field-aligned currents inferred from Ørsted and Magsat observations, J. Geophys. Res., 107, SMP 5-1–SMP 5-13, https://doi.org/10.1029/2001JA900104, 2002.
Clausen, L. B. N., Baker, J. B. H., Ruohoniemi, J. M., Milan, S. E., Coxon, J. C., Wing, S., Ohtani, S., and Anderson, B. J. : Temporal and spatial dynamics of the regions 1 and 2 Birkeland currents during substorms, J. Geophys. Res., 118, 3007–3016, https://doi.org/10.1002/jgra.50288, 2013.
Clilverd, M. A., Rodger, C. J., Brundell, J. B., Dalzell, M., Martin, I., Mac-Manus, D. H., Thomson, N. R., Petersen, T., and Obana, Y.: Long-lasting geomagnetically induced currents and harmonic distortion observed in New Zealand during the 7–8 September 2017 disturbed period, Space Weather, 16, 704–717, https://doi.org/10.1029/2018SW001822, 2018.
Cowley, S. W. H.: Magnetosphere-ionosphere interactions: A tutorial review, in Magnetospheric Current Systems, Geophys. Monogr. Ser., 118, 91–106, AGU, Washington, D. C., https://doi.org/10.1029/GM118p0091, 2000.
Cowley, S. W. H. and Lockwood, M.: Excitation and decay of solar wind driven flows in the magnetosphere-ionosphere system, Ann. Geophys., 10, 103–115, 1992.
Coxon, J. C., Milan, S. E., Clausen, L. B. N., Anderson, B. J., and Korth, H.: A superposed epoch analysis of the regions 1 and 2 Birkeland currents observed by AMPERE during substorms, J. Geophys. Res.-Space, 119, 9834–9846, https://doi.org/10.1002/2014JA020500, 2014.
Curto, J. J., Marsal, S., Blanch, E., and Altadill, D.: Analysis of the solar flare effects of 6 September 2017 in the ionosphere and in the Earth's magnetic field using spherical elementary current systems, Space Weather, 16, 1709–1720, https://doi.org/10.1029/2018SW001927, 2018.
Dungey, J. W.: Interplanetary magnetic fields and the auroral zones, Phys. Rev. Lett., 6, 47–48, https://doi.org/10.1103/PhysRevLett.6.47, 1961.
Dunlop, M. W., Yang, Y.-Y., Yang J.-Y., Lühr, H., Shen, C., Olsen, N., Ritter, P., Zhang, Q.-H., Cao, J.-B., Fu, H.-S., and Haagmans, R.: Multispacecraft current estimates at swarm, J. Geophys. Res.-Space, 120, 8307–8316, https://doi.org/10.1002/2015JA021707, 2015.
Elphic, R. C., Bonnell, J. W., Strangeway, R. J., Kepko, L., Ergun, R. E., McFadden, J. P., Carlson, W. Peria, C. W., Cattell, C. A., Klumpar, D., Shelley, E., Peterson, W., Moebius, E., Kistler, L., and Pfaff, R.: The auroral current circuit and field-aligned currents observed by FAST, Geophys. Res. Lett., 25, 2033–2036, https://doi.org/10.1029/98GL01158, 1998.
ESA: ESA Swarm Data Access, Level 2 daily, available at: https://earth.esa.int/web/guest/swarm/data-access (last access: 1 December 2019), 2018.
Friis-Christensen, E., Luhr, H., Knudsen, D., and Haagmans, R.: Swarm – An Earth observation mission investigating geospace, Adv. Space Res., 41, 210–216, https://doi.org/10.1016/j.asr.2006.10.008, 2008.
Fujii, R., Fukunishi, H., Kokubun, S., Sugiura, M., Tohyama, F., Hayakawa, H., Tsuruda K., and Okada, T.: Field-aligned currents signatures during the March 13–14, 1989, great magnetic storm, J. Geophys. Res., 97, 10703–10715, https://doi.org/10.1029/92JA00171, 1992.
Fukunishi, H., Fujii, R., Kokubun, S., Tohyama, F., Mukai, T., and Oya, H.: Small-scale field-aligned currents observed by the Akebono (EXOS-D) satellite, Geophys. Res. Lett., 18, 297–300, https://doi.org/10.1029/91GL00036, 1991.
Ganushkina, N. Y., Liemohn, M. W., Dubyagin, S., Daglis, I. A., Dandouras, I., De Zeeuw, D. L., Ebihara, Y., Ilie, R., Katus, R., Kubyshkina, M., Milan, S. E., Ohtani, S., Ostgaard, N., Reistad, J. P., Tenfjord, P., Toffoletto, F., Zaharia, S., and Amariutei, O.: Defining and resolving current systems in geospace, Ann. Geophys., 33, 1369–1402, https://doi.org/10.5194/angeo-33-1369-2015, 2015.
Gjerloev, J. W., Ohtani, S., Iijima, T., Anderson, B., Slavin, J., and Le, G.: Characteristics of the terrestrial field-aligned current system, Ann. Geophys., 29, 1713–1729, https://doi.org/10.5194/angeo-29-1713-2011, 2011.
Green, D. L., Waters, C. L., Anderson, B. J., and Korth, H.: Seasonal and interplanetary magnetic field dependence of the field-aligned currents for both Northern and Southern Hemispheres, Ann. Geophys., 27, 1701–1715, https://doi.org/10.5194/angeo-27-1701-2009, 2009.
Iijima, T. and Potemra, T. A.: The amplitude distribution of field-aligned currents at northern high latitudes observed by Triad, J. Geophys. Res., 81, 2165–2174, https://doi.org/10.1029/JA081i013p02165, 1976.
Iijima, T. and Potemra, T.: Large-scale distribution of field-aligned currents associated with substorms, J. Geophys. Res., 83, 599–615, https://doi.org/10.1029/JA083iA02p00599, 1978.
Iijima, T., Potemra, T. A., Zanetti, L. J., and Bythrow, P. F.: Large-Scale Birkeland Currents in the Dayside Polar Region During Strongly Northward IMF: A New Birkeland Current System, J. Geophys. Res., 89, 7441–7452, https://doi.org/10.1029/JA089iA09p07441, 1984.
Janhunen, P., Olsson, A., Amm, O., and Kauristie, K.: Characteristics of a stable arc based on FAST and MIRACLE observations, Ann. Geophys., 18, 152–160, https://doi.org/10.1007/s00585-000-0152-5, 2000.
Johnson, M. L., Murphree, J. S., Marklund, G. T., and Karlsson, T.: Progress on relating optical auroral forms and electric field patterns, J. Geophys. Res., 103, 4271–4284, https://doi.org/10.1029/97JA00854, 1998.
Juusola, L., Kauristie, K., Vanhamaki, H., Aikio, A., and van de Kamp, M.: Comparison of auroral ionospheric and field-aligned currents derived from Swarm and ground magnetic field measurements, J. Geophys. Res.-Space, 121, 9256–9283, https://doi.org/10.1002/2016JA022961, 2016.
Kozlovsky, A., Aikio, A., Turunen, T., Nilsson, H., Sergienko, T., Safargaleev, V., and Kauristie, K.: Dynamics and electric currents of morningside Sun-aligned auroral arcs, J. Geophys. Res., 112, A06306, https://doi.org/10.1029/2006JA012244, 2007.
Knudsen, D., Burchill, J. K., Berg, K., Cameron, T., Enno, G. A., Marcellus, C. G., King, E. P., and Wevers, I.: A low energy charged particle distribution imager with a compact sensor for space applications, Rev. Sci. Instrum., 74, 202–211, https://doi.org/10.1063/1.1525869, 2003.
Luhr, H., Park, J., Gjerloev, J. W., Rauberg, J., Michaelis, I., Merayo, J. M. G., and Brauer, P.: Field-aligned currents' scale analysis performed with the Swarm constellation, Geophys. Res. Lett., 42, 1–8, https://doi.org/10.1002/2014GL062453, 2015.
Lühr, H., Huang, T., Wing, S., Kervalishvili, G., Rauberg, J., and Korth, H.: Filamentary field-aligned currents at the polar cap region during northward interplanetary magnetic field derived with the Swarm constellation, Ann. Geophys., 34, 901–915, https://doi.org/10.5194/angeo-34-901-2016, 2016.
Lui, A. T. Y.: Current disruption in the Earth's magnetosphere: Observations and models, J. Geophys. Res., 101, 13067–13088, https://doi.org/10.1029/96JA00079, 1996.
Lukianova, R. and Kozlovsky, A.: Dynamics of polar boundary of the auroral oval derived from the IMAGE satellite data, Cosmic Res., 51, 46–53, https://doi.org/10.1134/S0010952513010061, 2013.
Lukianova, R. Yu., Kozlovskii, A., and Christiansen, F.: field-aligned currents in the winter and summer hemispheres caused by IMF By, Geomagn. Aeronomy, 52, 300–308, https://doi.org/10.1134/S0016793212020089, 2012.
Lyons, L. R.: Formation of auroral arcs via magnetosphere-ionosphere coupling, Rev. Geophys., 30, 93–112, https://doi.org/10.1029/92RG00002, 1992.
Marchaudon, A., Cerisier, J.-C., Greenwald, R. A., and Sofko, G. J.: Electrodynamics of a flux transfer event: Experimental test of the Southwood model, Geophys. Res. Lett., 31, L09809, https://doi.org/10.1029/2004GL019922, 2004.
Marchaudon, A., Cerisier, J.-C., Bosqued, J.-M., Owen, C. J., Fazakerley, A. N., and Lahiff, A. D.: On the structure of field-aligned currents in the mid-altitude cusp, Ann. Geophys., 24, 3391–3401, https://doi.org/10.5194/angeo-24-3391-2006, 2006.
Marklund, G., Sandahl, I., and Opgenoorth, H.: A study of the dynamics of a discrete auroral arc, Planet. Space Sci., 30, 179–197, https://doi.org/10.1016/0032-0633(82)90088-5, 1982.
McGranaghan, R. M., Mannucci, A. J., and Forsyth, C.: A comprehensive analysis of multiscale field-aligned currents: Characteristics, controlling parameters, and relationships, J. Geophys. Res.-Space, 122, 11931–11960, https://doi.org/10.1002/2017JA024742, 2017.
Meng, C.-I.: Dynamic variation of the auroral oval during intense magnetic storms, J. Geophys. Res., 89, 227–235, https://doi.org/10.1029/JA089iA01p00227, 1984.
Merayo, J. G. M., Jorgensen, J. L., Friis-Christensen, E., Brauer, P., Primdahl, F., Jorgensen, P. S., Allin, T. H., and Denver, T.: The Swarm Magnetometry Package, in: Small Satellites for Earth Observation, edited by: Sandau, R., Röser, H. P., and Valenzuela, A., Springer, Dordrecht, 143–151, https://doi.org/10.1007/978-1-4020-6943-7_13, 2008.
Milan, S. E., Cowley, W. H., Lester, M., Wright, D. M., Slavin, J. A., Fillingim, M., Carlson, C. W., and Singer, H. J.: Response of the magnetotail to changes in the open flux content of the magnetosphere, J. Geophys. Res., 109, A04220, https://doi.org/10.1029/2003JA010350, 2004.
Milan, S. E.: Both solar wind-magnetosphere coupling and ring current intensity control of the size of the auroral oval, Geophys. Res. Lett., 36, L18101, https://doi.org/10.1029/2009GL039997, 2009.
Milan, S. E., Hutchinson, J., Boakes, P. D., and Hubert, B.: Influences on the radius of the auroral oval, Ann. Geophys., 27, 2913–2924, https://doi.org/10.5194/angeo-27-2913-2009, 2009.
Neubert, T. and Christiansen, F.: Small-scale, field-aligned currents at the top-side ionosphere, Geophys. Res. Lett., 30, 2010, https://doi.org/10.1029/2003GL017808, 2003.
Opgenoorth, H. J., Haggstrom, I., Williams, P. J. S., and Jones, G. O. L.: Regions of strongly enhanced perpendicular electric fields adjacent to auroral arcs, J. Atmos. Terr. Phys., 52, 449–458, https://doi.org/10.1016/0021-9169(90)90044-N, 1990.
Papitashvili, V. O., Christiansen, F., and Neubert, T.: A new model of field-aligned currents derived from high-precision satellite magnetic field data, Geophys. Res. Lett., 29, 1683, https://doi.org/10.1029/2001GL014207, 2002.
Potemra, T. A., Zanetti, L. J., Bythrow, P. F., and Lui, A. T. Y.: By-dependent convection patterns during northward interplanetary magnetic field, J. Geophys. Res., 89, 9753, https://doi.org/10.1029/JA089iA11p09753, 1984.
Pu, Z. Y., Raeder, J., Zhong, J., Bogdanova, Y. V., Dunlop, M., Xiao, C. J., Wang, X. G., and Fazakerley, A.: Magnetic topologies of an in vivo FTE observed by Double Star/TC-1 at Earth's magnetopause, Geophys. Res. Lett., 40, 3502–3506, https://doi.org/10.1002/grl.50714, 2013.
Ridley, A. J.: Effects of seasonal changes in the ionospheric conductances on magnetospheric field-aligned currents, Geophys. Res. Lett., 34, L05101, https://doi.org/10.1029/2006GL028444, 2007.
Ritter, P. and Lühr, H.: Curl-B technique applied to Swarm constellation for determining field-aligned currents, Earth Planets Space, 58, 463–476, https://doi.org/10.1186/BF03351942, 2006.
Ritter, P. and Lühr, H.: Near-Earth magnetic signature of magnetospheric substorms and an improved substorm current model, Ann. Geophys., 26, 2781–2793, https://doi.org/10.5194/angeo-26-2781-2008, 2008.
Ritter, P., Lühr, H., and Rauberg, J.: Determining field-aligned currents with the Swarm constellation mission, Earth Planets Space, 65, 1285–1294, https://doi.org/10.5047/eps.2013.09.006, 2013.
Southwood, D. J.: The ionospheric signature of flux transfer events, J. Geophys. Res., 92, 3207–3213, https://doi.org/10.1029/JA092iA04p03207, 1987.
Swarm Level 2 Processing System: Product specification for L2 Products and Auxiliary Products, available at: https://earth.esa.int/documents/10174/1514862/Swarm_L2_Product_specification, last access: 12 December 2019.
Vennerstrøm, S., Moretto, T., Olsen, N., Friis-Christensen, E., Stampe, A. M., and Watermann, J. F.: Field-aligned currents in the dayside cusp and polar cap region during northward IMF, J. Geophys. Res., 107, SMP 18-1–SMP 18-5, https://doi.org/10.1029/2001JA009162, 2002.
Wang, H., Lühr, H., Ma, S. Y., Weygand, J., Skoug, R. M., and Yin, F.: Field-aligned currents observed by CHAMP during the intense 2003 geomagnetic storm events, Ann. Geophys., 24, 311–324, https://doi.org/10.5194/angeo-24-311-2006, 2006.
Watermann, J., Stauning, P., Lühr, H., Newell, P. T., Christiansen, F., and Schlegel, K.: Are small-scale field-aligned currents and magnetosheath-like particle precipitation signatures of the same low-altitude cusp?, Adv. Space Res., 43, 41–46, https://doi.org/10.1016/j.asr.2008.03.031, 2009.
Weimer, D. R.: Maps of ionospheric field-aligned currents as a function of the interplanetary magnetic field derived from Dynamics Explorer 2 data, J. Geophys. Res., 106, 2889–12902, https://doi.org/10.1029/2000JA000295, 2001.
Wu, J., Knudsen, D. J., Gillies, D. M., Donovan, E. F., and Burchill, J. K.: Swarm observation of field-aligned currents associated with multiple auroral arc systems, J. Geophys. Res.-Space, 122, 10145–10156, https://doi.org/10.1002/2017JA024439, 2017.
Xiong, C., Lühr, H., Wang, H., and Johnsen, M. G.: Determining the boundaries of the auroral oval from CHAMP field-aligned current signatures – Part 1, Ann. Geophys., 32, 609–622, https://doi.org/10.5194/angeo-32-609-2014, 2014.
Yasyukevich, Yu., Astafyeva, E., Padokhin, A., Ivanova, V., Syrovatskii, S., and Podlesnyi, A.: The 6 September 2017 X-class solar flares and their impacts on the ionosphere, GNSS and HF radio wave propagation, Space Weather, 16, 1013–1027, https://doi.org/10.1029/2018SW001932, 2018.
Yokoyama, N., Kamide, Y., and Miyaoka, H.: The size of the auroral belt during magnetic storms, Ann. Geophys., 16, 566–573, https://doi.org/10.1007/s00585-998-0566-z, 1998.


